Embed Size (px)
Citation preview
Primary focus of studies: •Tracing water uptake sources•The Canopy Effect•Tree-leaf Temperature
Hydrogen & Oxygen in Plants: Applications
Modified by Guangsheng ZhuangFeb. 8, 2010
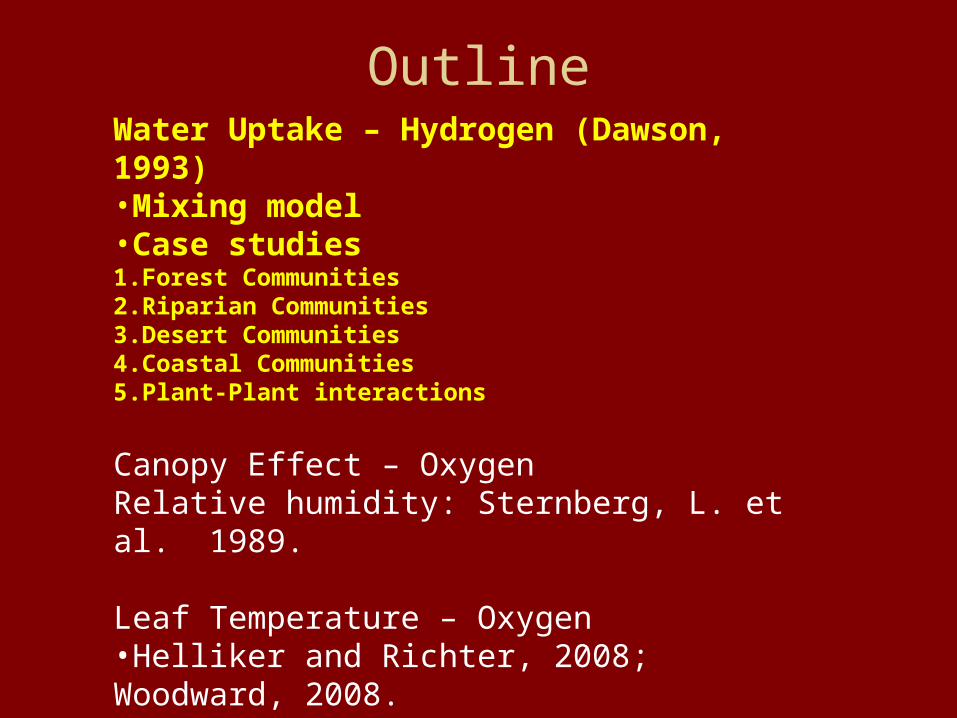
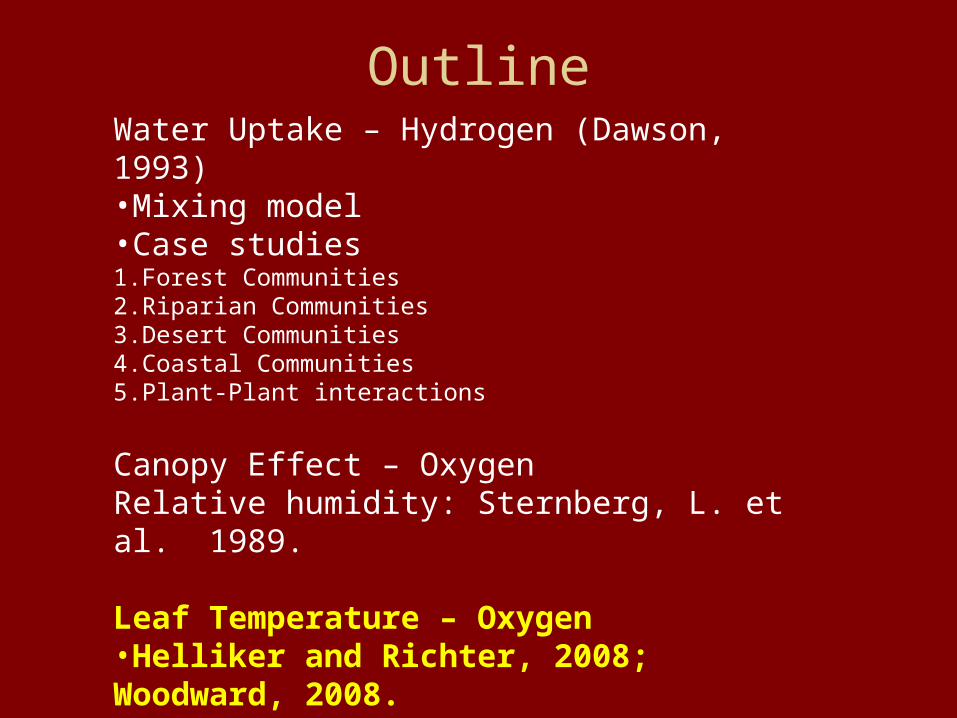
OutlineWater Uptake – Hydrogen (Dawson, 1993)•Mixing model•Case studies1.Forest Communities2.Riparian Communities 3.Desert Communities4.Coastal Communities5.Plant-Plant interactions
Canopy Effect – OxygenRelative humidity: Sternberg, L. et al. 1989.
Leaf Temperature – Oxygen•Helliker and Richter, 2008; Woodward, 2008.
A brief word about mixing models…
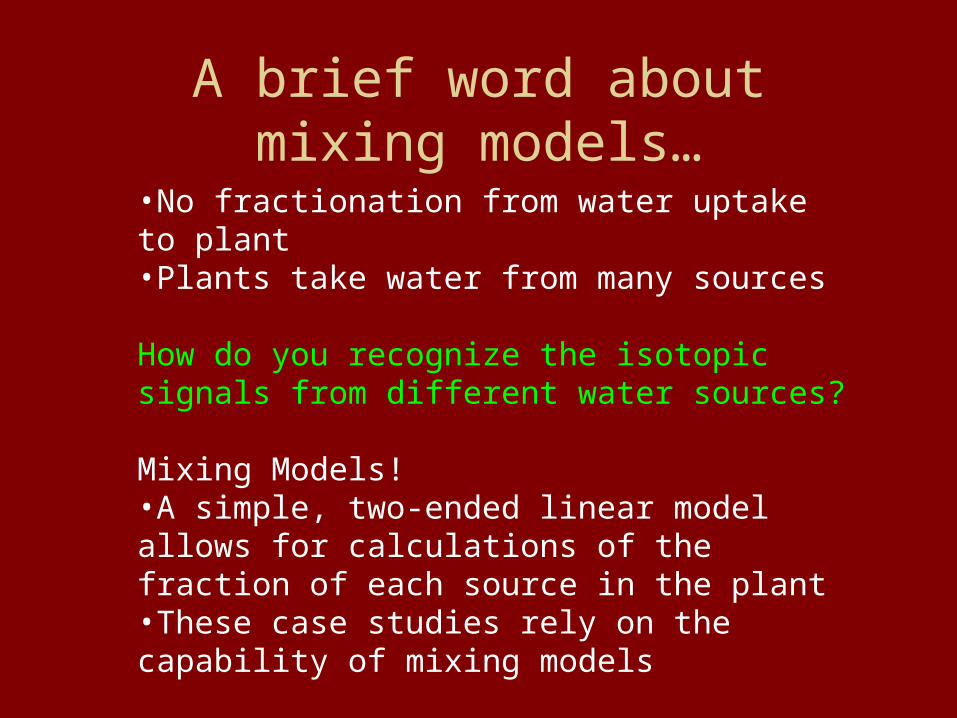
•No fractionation from water uptake to plant•Plants take water from many sources
How do you recognize the isotopic signals from different water sources?
Mixing Models!•A simple, two-ended linear model allows for calculations of the fraction of each source in the plant•These case studies rely on the capability of mixing models
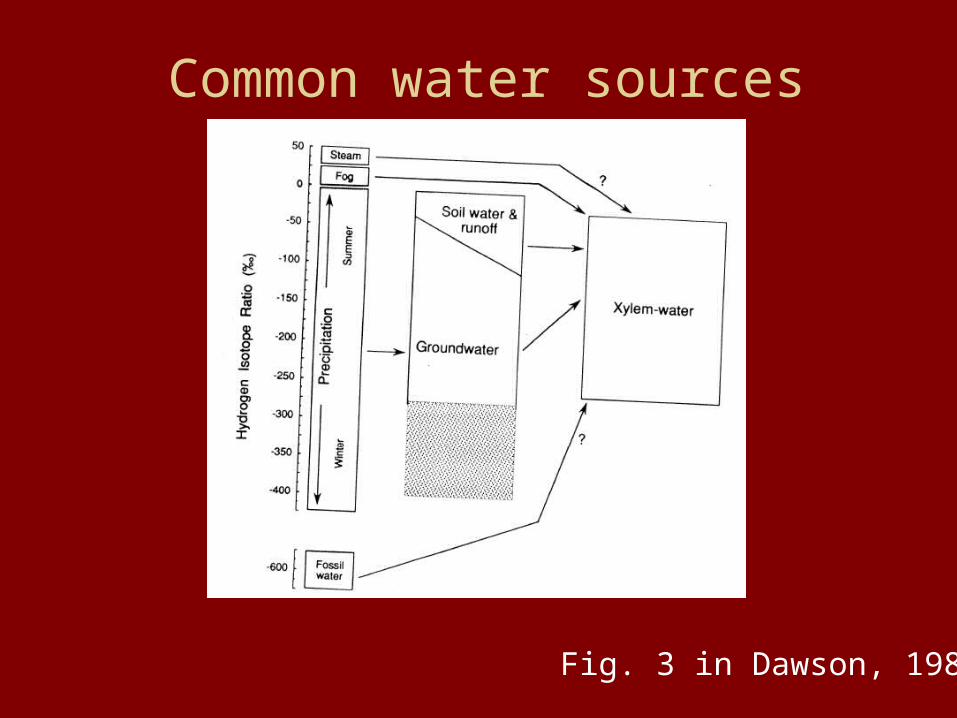
Common water sources
Fig. 3 in Dawson, 1989
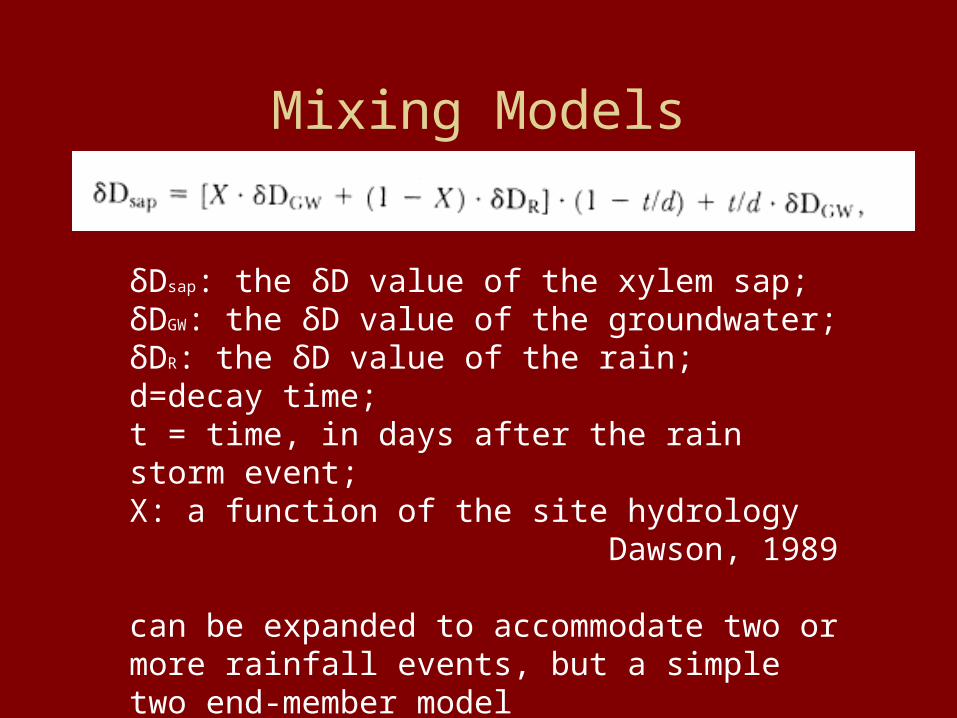
δDsap: the δD value of the xylem sap;δDGW: the δD value of the groundwater;δDR: the δD value of the rain;d=decay time;t = time, in days after the rain storm event;X: a function of the site hydrology
Dawson, 1989
can be expanded to accommodate two or more rainfall events, but a simple two end-member model
Mixing Models
Forest communities
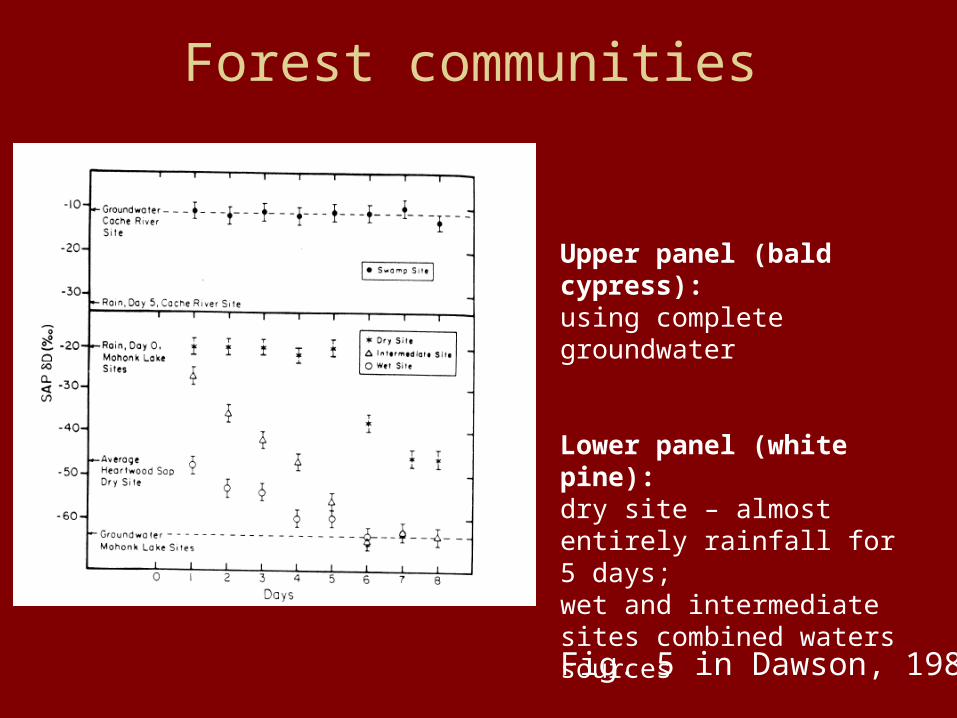
Fig. 5 in Dawson, 1989
Upper panel (bald cypress):using complete groundwater
Lower panel (white pine):dry site – almost entirely rainfall for 5 days;wet and intermediate sites combined waters sources
Riparian Communities: Are streamside trees too good for
streamside water?
Setup: •Western riparian community: water-stressed, large gradient in water availability farther from streamsD ratios from xylem water analyzed to compare with D of stream water and D of groundwater
Where do trees get their water?
Results: expected & unexpected
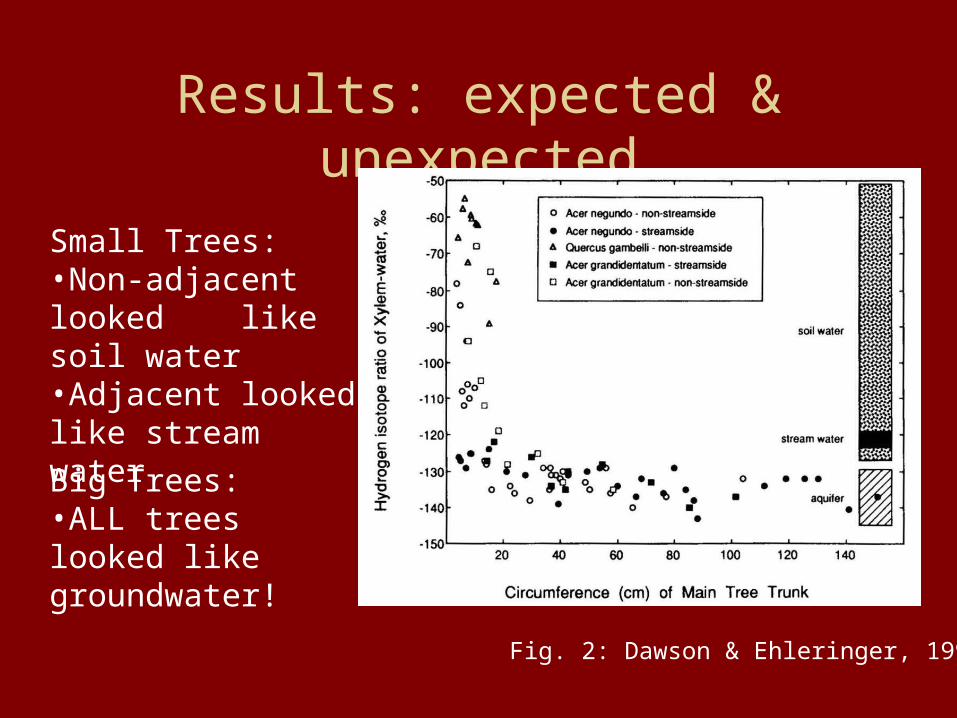
Small Trees:•Non-adjacent looked like soil water•Adjacent looked like stream water
Big Trees:•ALL trees looked like groundwater!
Fig. 2: Dawson & Ehleringer, 1991
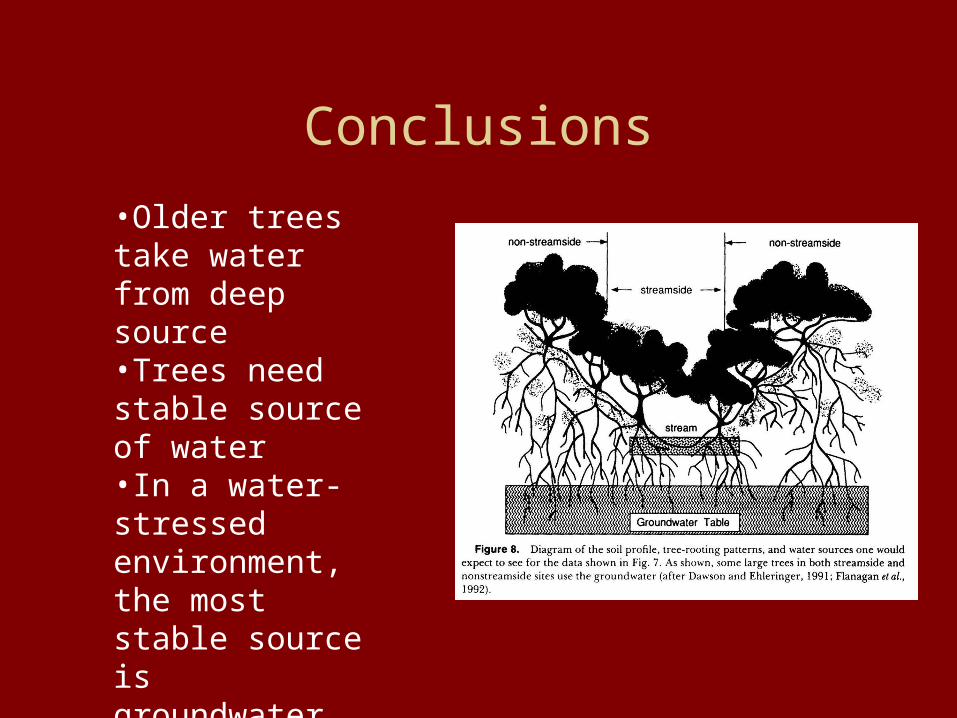
Conclusions
•Older trees take water from deep source•Trees need stable source of water•In a water-stressed environment, the most stable source is groundwater, so trees primarily draw from there
Implications
•Assumption that proximity implies a source is not necessarily true•Availability of groundwater can allow for drought-intolerant species in water-stressed ecosystems•Stream management practices need to be rethought? (e.g. stream flow diversion)
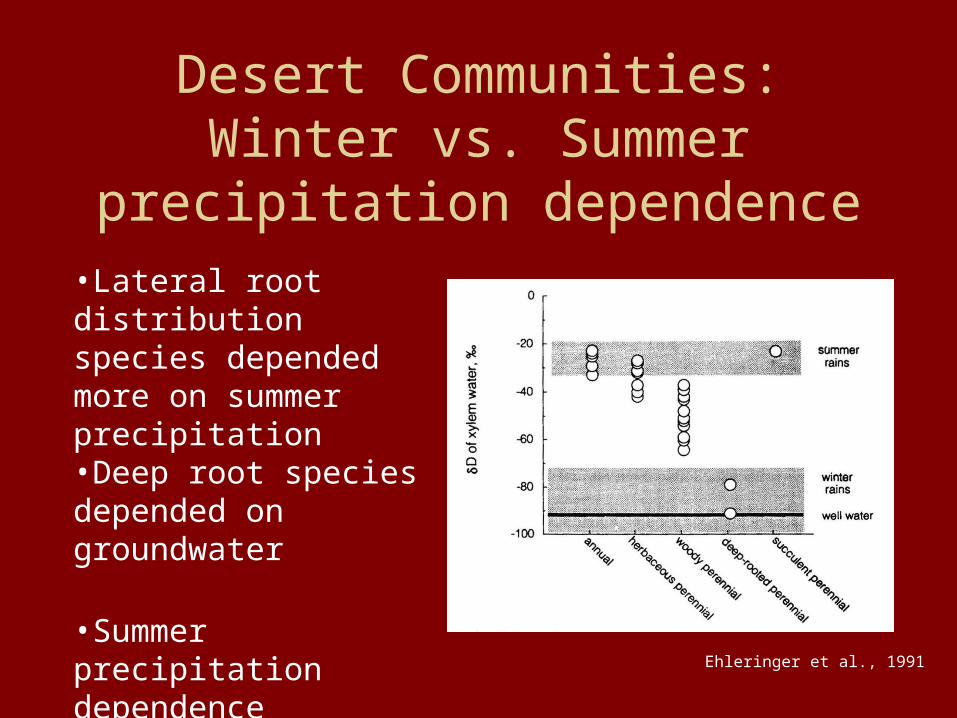
Desert Communities:Winter vs. Summer precipitation
dependence•Lateral root distribution species depended more on summer precipitation•Deep root species depended on groundwater
•Summer precipitation dependence correlated with greater overall water stress & more WUE
Ehleringer et al., 1991
Implications
•Different strengths related to use of water sources impacts coexistence, competition and community composition
•ie, drought periods vs. rainy summers - who wins?
•Regarding global climate change (GCM predictions)•CO2 , T’s mean more summer precipitation•This change will favor perennial species with widely distributed roots over deeper-rooted species
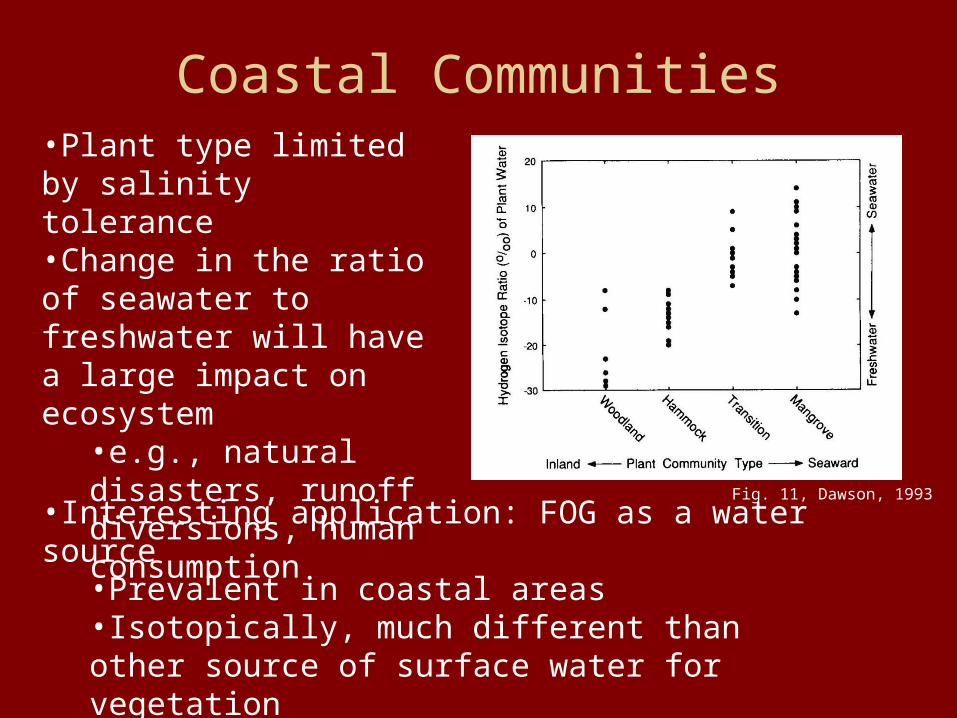
Coastal Communities•Plant type limited by salinity tolerance•Change in the ratio of seawater to freshwater will have a large impact on ecosystem
•e.g., natural disasters, runoff diversions, human consumption
•Interesting application: FOG as a water source•Prevalent in coastal areas•Isotopically, much different than other source of surface water for vegetation•e.g., Coastal Redwood in California
Fig. 11, Dawson, 1993
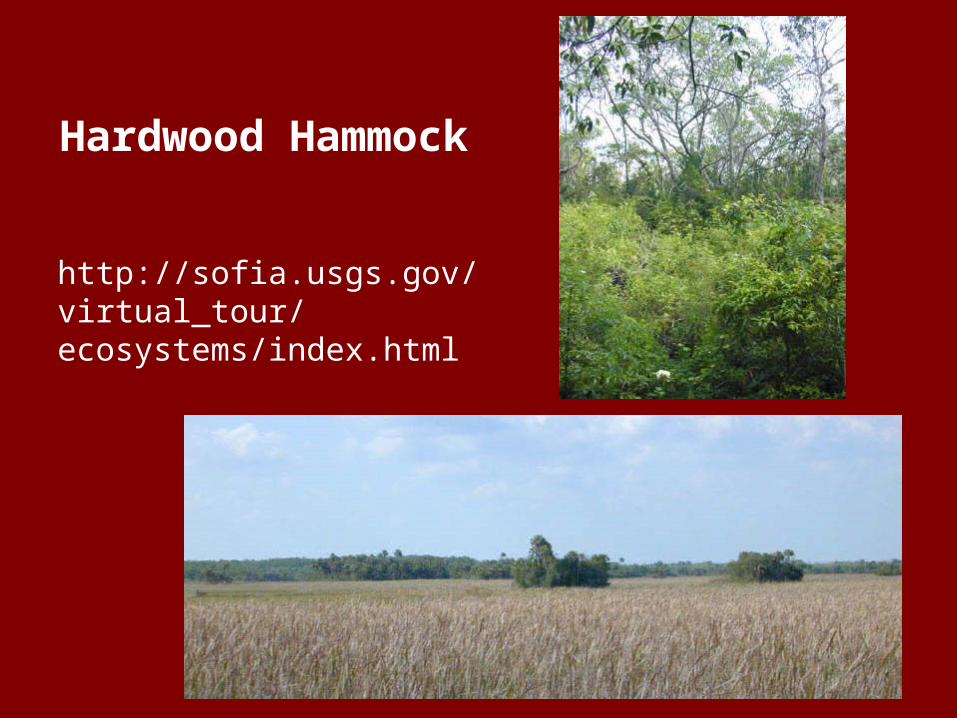
Hardwood Hammock
http://sofia.usgs.gov/virtual_tour/ecosystems/index.html
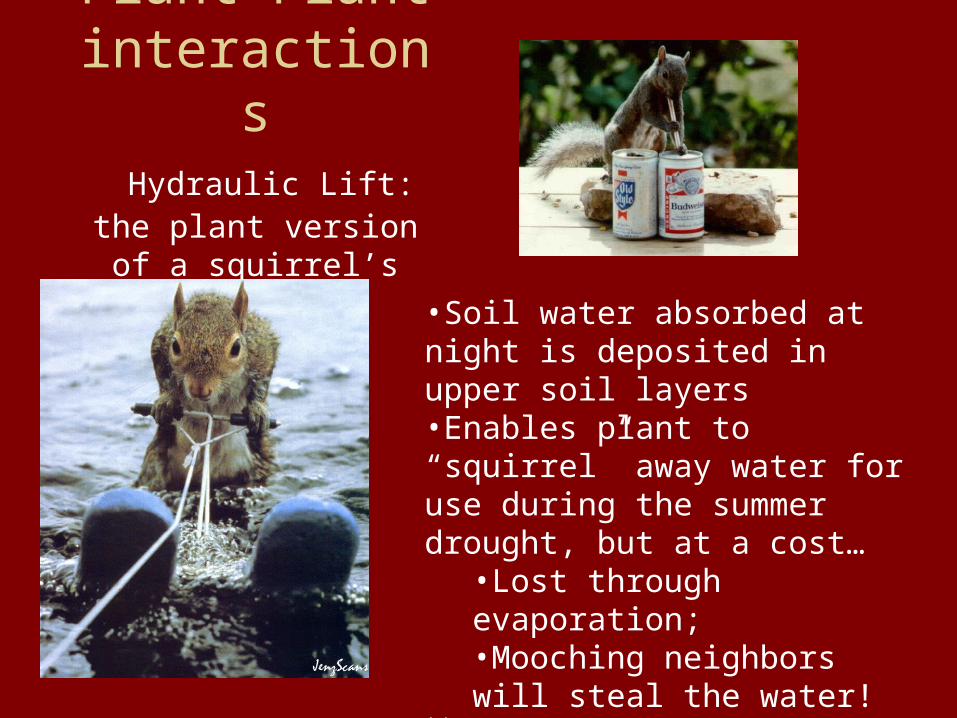
Plant-Plant interactions
Hydraulic Lift: the plant version of a squirrel’s life…
•Soil water absorbed at night is deposited in upper soil layers•Enables plant to “squirrel” away water for use during the summer drought, but at a cost…
•Lost through evaporation;•Mooching neighbors will steal the water!
D values can show what fraction of “lifted” water is taken by neighboring plants
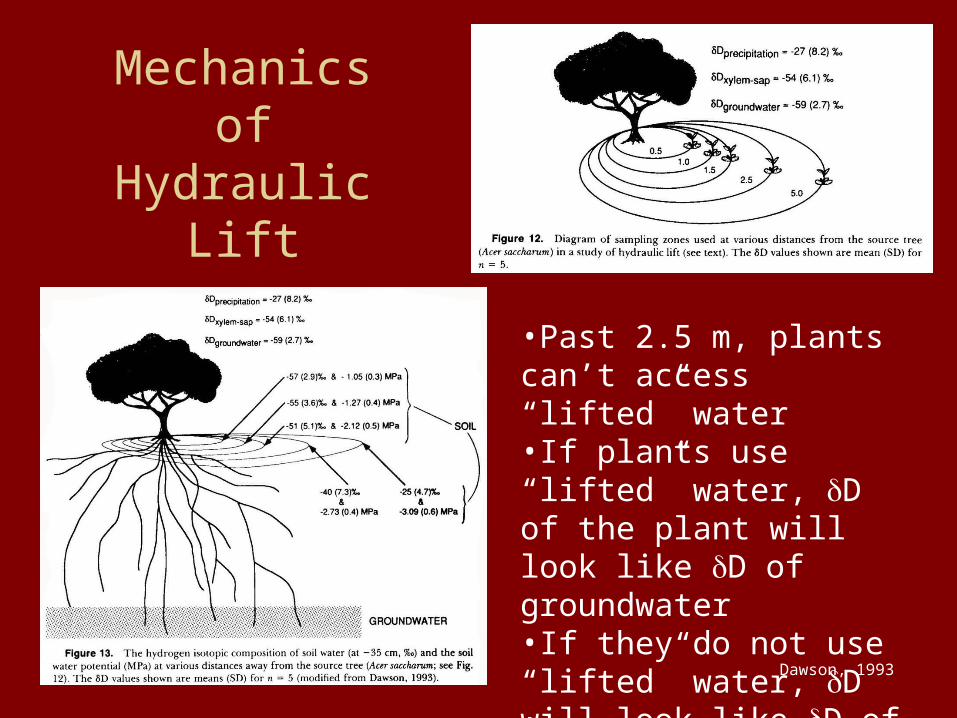
•Past 2.5 m, plants can’t access “lifted” water•If plants use “lifted” water, D of the plant will look like D of groundwater•If they do not use “lifted” water, D will look like D of precipitation
Mechanics of Hydraulic Lift
Dawson, 1993
Implications
•“Lifted” water is important for neighboring plants during droughts•In some situations, close proximity may be a competitive advantage instead of a disadvantage
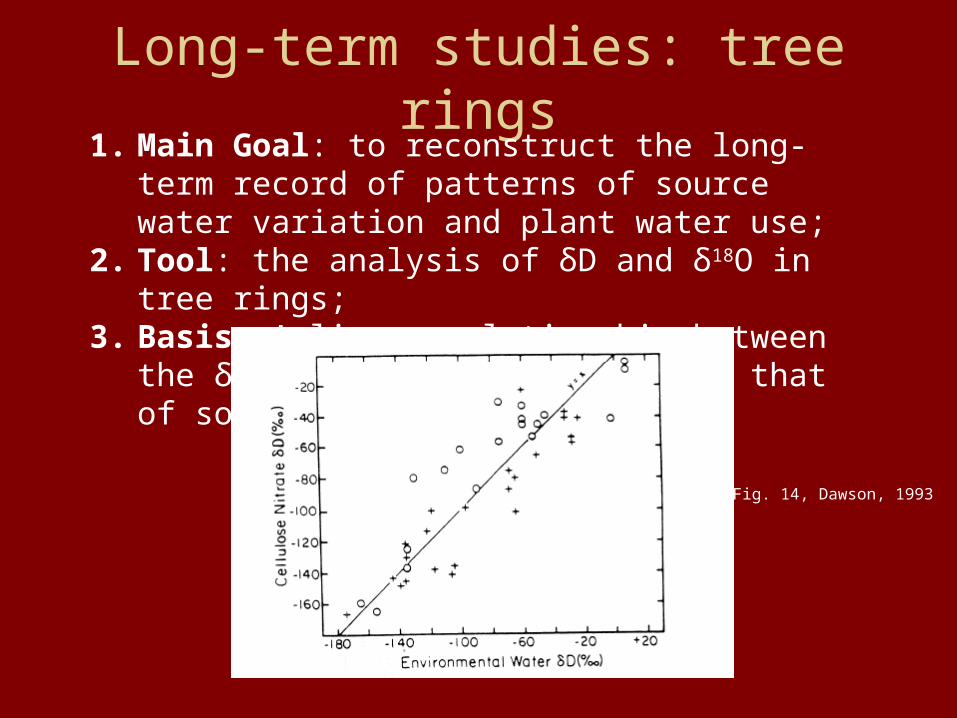
Long-term studies: tree rings1. Main Goal: to reconstruct the long-term record of
patterns of source water variation and plant water use;2. Tool: the analysis of δD and δ18O in tree rings;3. Basis: A linear relationship between the δD in
cellulose nitrate and that of source waters
Fig. 14, Dawson, 1993
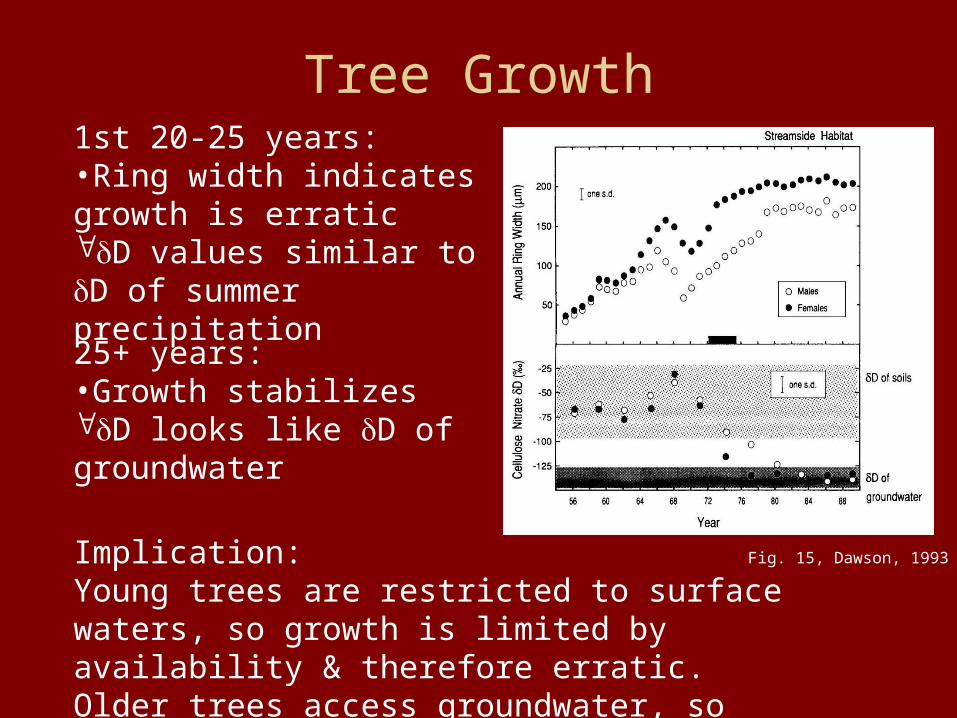
Tree Growth1st 20-25 years:•Ring width indicates growth is erraticD values similar to D of summer precipitation
25+ years:•Growth stabilizesD looks like D of groundwater
Implication:Young trees are restricted to surface waters, so growth is limited by availability & therefore erratic. Older trees access groundwater, so growth is more stable
Fig. 15, Dawson, 1993
OutlineWater Uptake – Hydrogen (Dawson, 1993)•Mixing model•Case studies1.Forest Communities2.Riparian Communities 3.Desert Communities4.Coastal Communities5.Plant-Plant interactions
Canopy Effect – OxygenRelative humidity: Sternberg, L. et al. 1989.
Leaf Temperature – Oxygen•Helliker and Richter, 2008; Woodward, 2008.
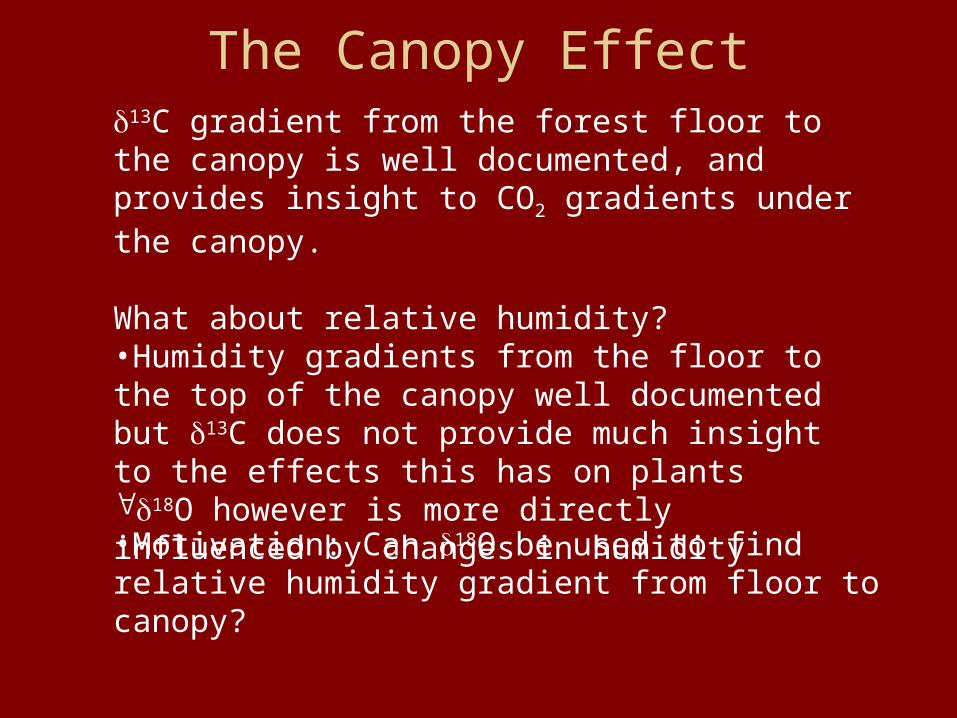
The Canopy Effect13C gradient from the forest floor to the canopy is well documented, and provides insight to CO2 gradients under the canopy.
What about relative humidity?•Humidity gradients from the floor to the top of the canopy well documented but 13C does not provide much insight to the effects this has on plants18O however is more directly influenced by changes in humidity
•Motivation: Can 18O be used to find relative humidity gradient from floor to canopy?
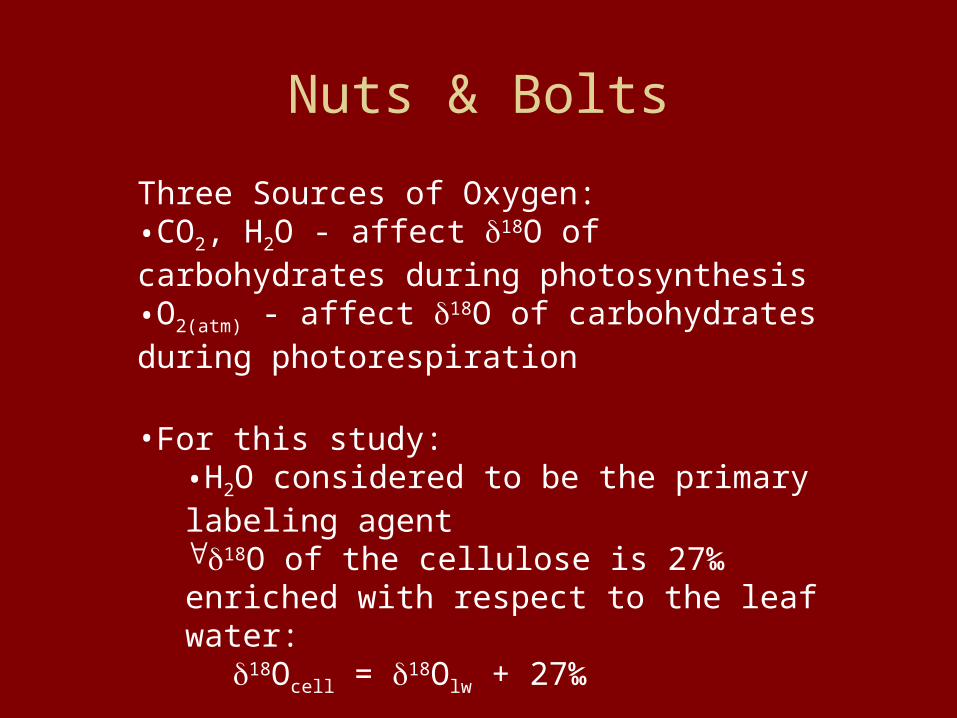
Three Sources of Oxygen:•CO2, H2O - affect 18O of carbohydrates during photosynthesis•O2(atm) - affect 18O of carbohydrates during photorespiration
•For this study:•H2O considered to be the primary labeling agent18O of the cellulose is 27‰ enriched with respect to the leaf water:
18Ocell = 18Olw + 27‰
Nuts & Bolts
Equation Breakdown
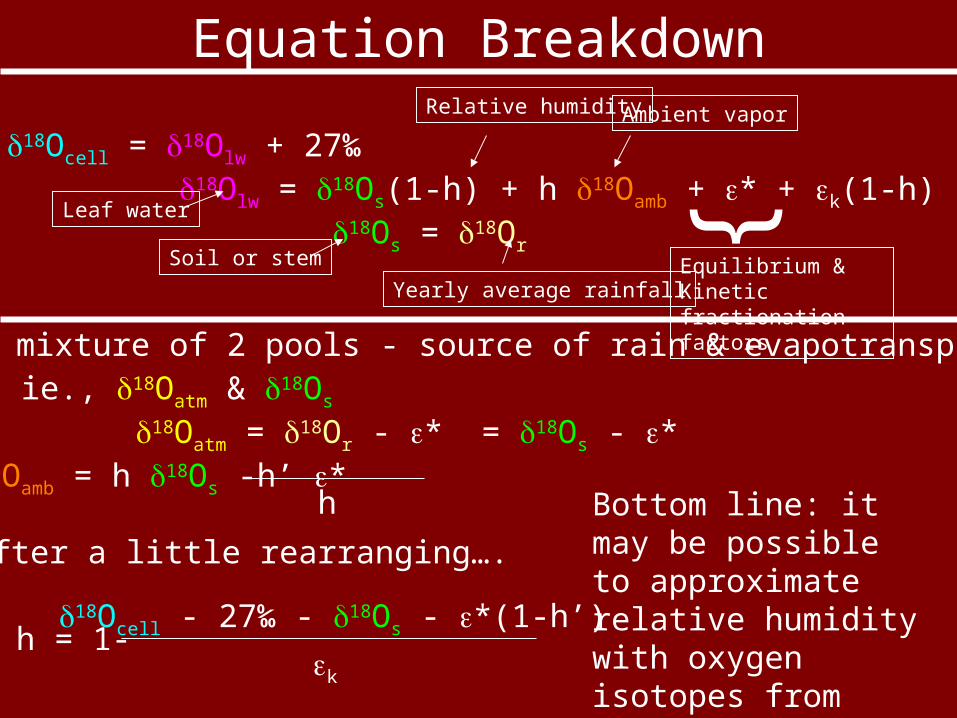
18Ocell = 18Olw + 27‰ 18Olw = 18Os(1-h) + h 18Oamb + * + k(1-h)
18Os = 18Or Soil or stem
Yearly average rainfall
Leaf water
Ambient vapor
18Oamb: mixture of 2 pools - source of rain & evapotranspiration ie., 18Oatm & 18Os 18Oatm = 18Or - * = 18Os - *
So, 18Oamb = h 18Os -h’ *
{
Equilibrium & Kinetic fractionation factors
After a little rearranging….
h = 1-18Ocell - 27‰ - 18Os - *(1-h’)
k
Bottom line: it may be possible to approximate relative humidity with oxygen isotopes from soil water & tree cellulose
h
Relative humidity
Results
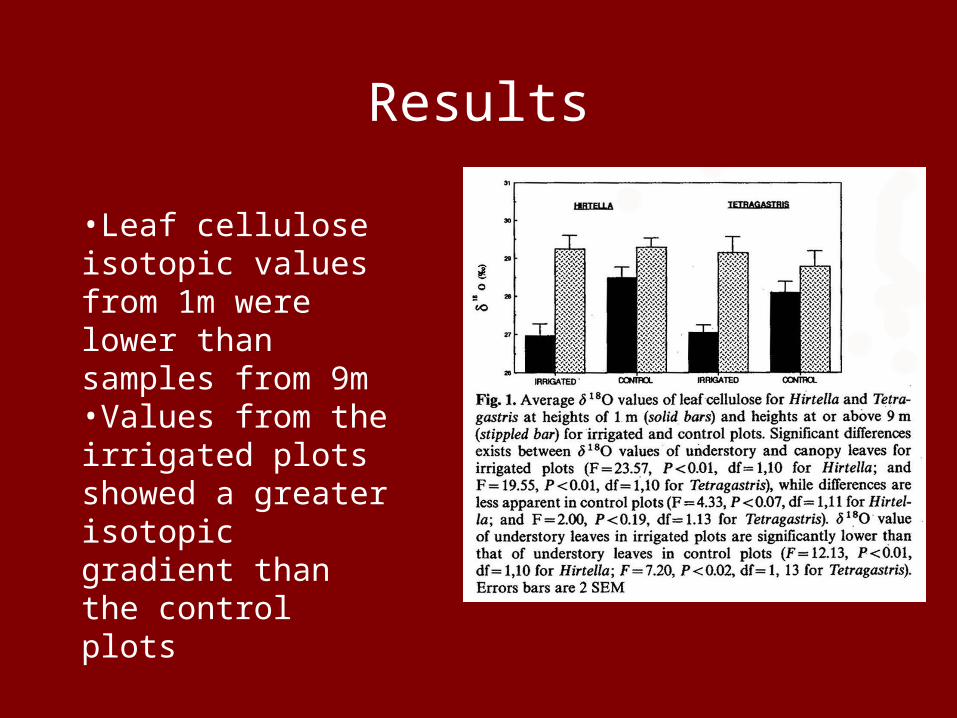
•Leaf cellulose isotopic values from 1m were lower than samples from 9m•Values from the irrigated plots showed a greater isotopic gradient than the control plots
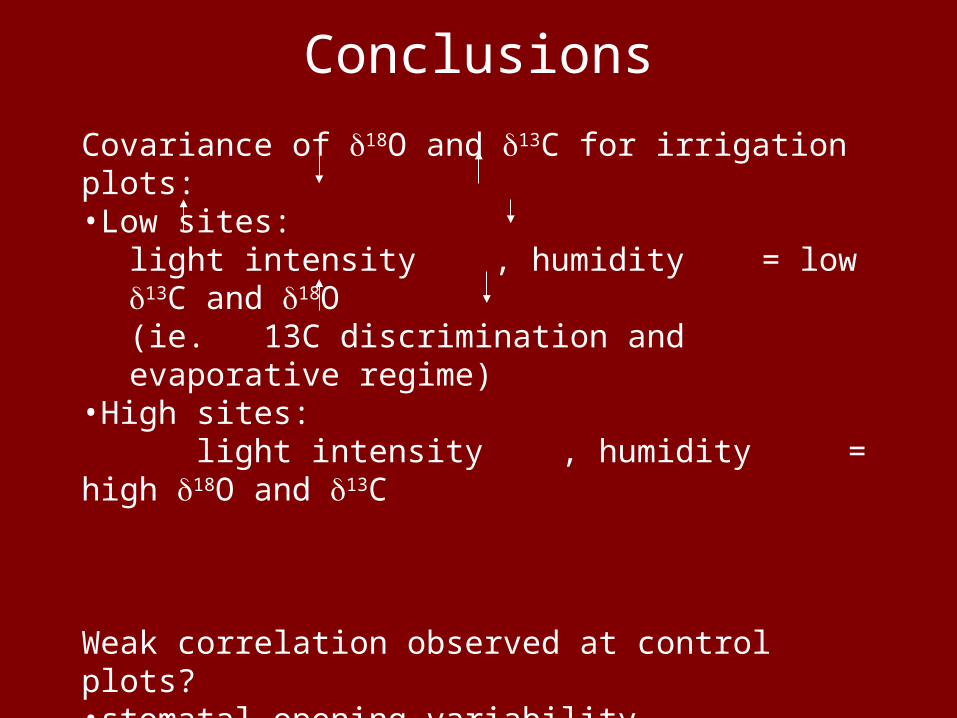
Conclusions
Covariance of 18O and 13C for irrigation plots:•Low sites:
light intensity , humidity = low 13C and 18O(ie. 13C discrimination and evaporative regime)
•High sites: light intensity , humidity = high 18O and 13C
Weak correlation observed at control plots?•stomatal opening variability•Stomates in irrigated plots controlled by humidity while in control plots, other factors like root or leaf water potential apply
OutlineWater Uptake – Hydrogen (Dawson, 1993)•Mixing model•Case studies1.Forest Communities2.Riparian Communities 3.Desert Communities4.Coastal Communities5.Plant-Plant interactions
Canopy Effect – OxygenRelative humidity: Sternberg, L. et al. 1989.
Leaf Temperature – Oxygen•Helliker and Richter, 2008; Woodward, 2008.
Leaf Temperature
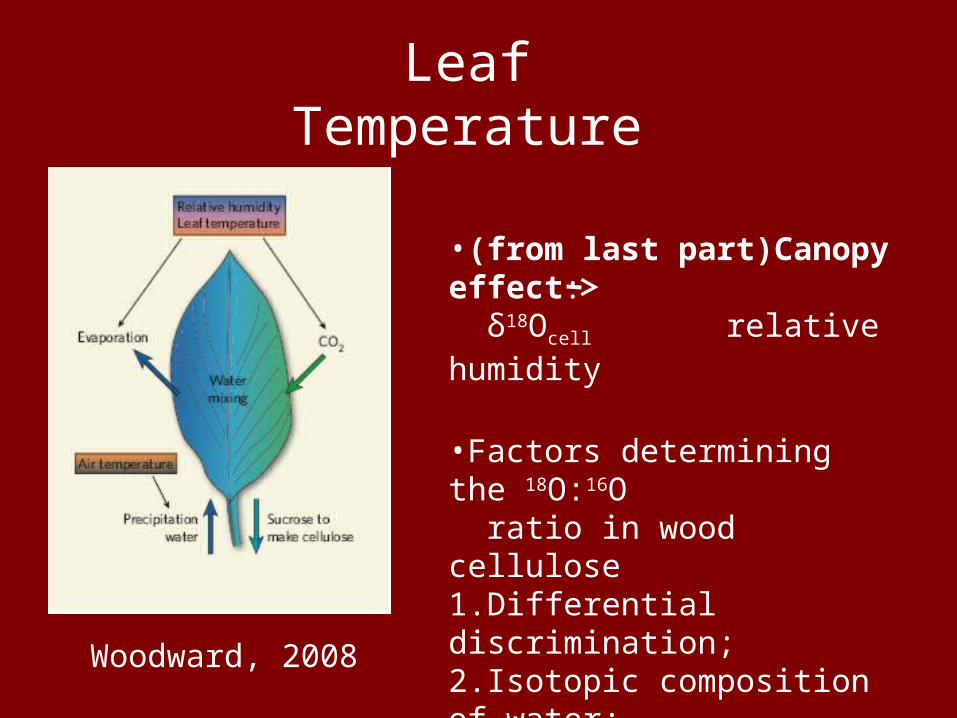
•(from last part)Canopy effect: δ18Ocell relative humidity
•Factors determining the 18O:16O ratio in wood cellulose1.Differential discrimination;2.Isotopic composition of water;
Woodward, 2008
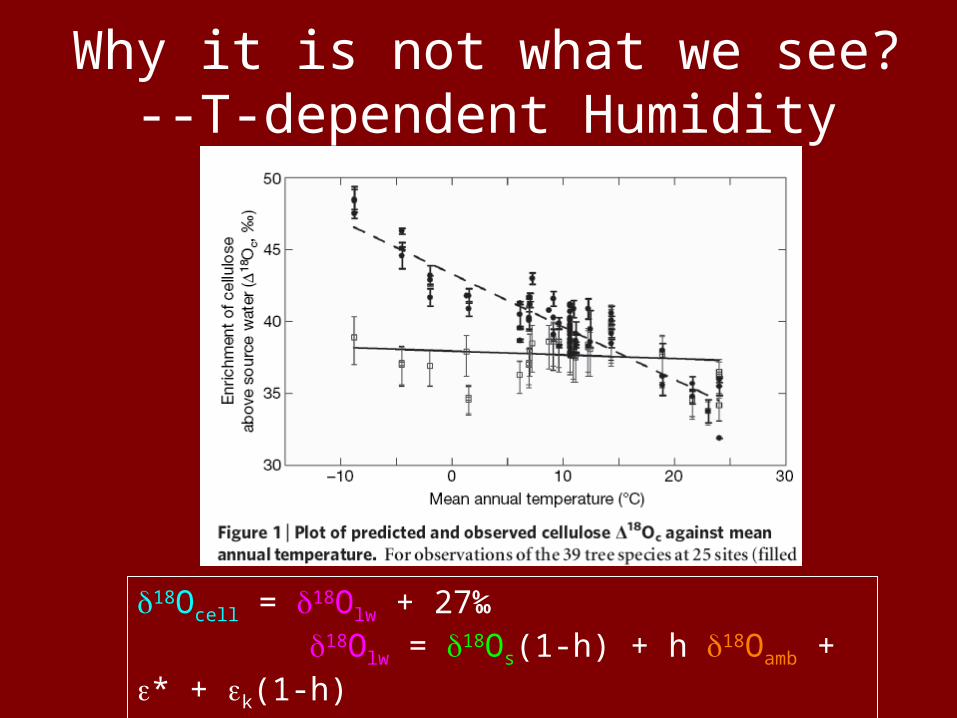
18Ocell = 18Olw + 27‰ 18Olw = 18Os(1-h) + h 18Oamb + * + k(1-h)
18Os = 18Or
Why it is not what we see?--T-dependent Humidity
Helliker and Richter, 2008
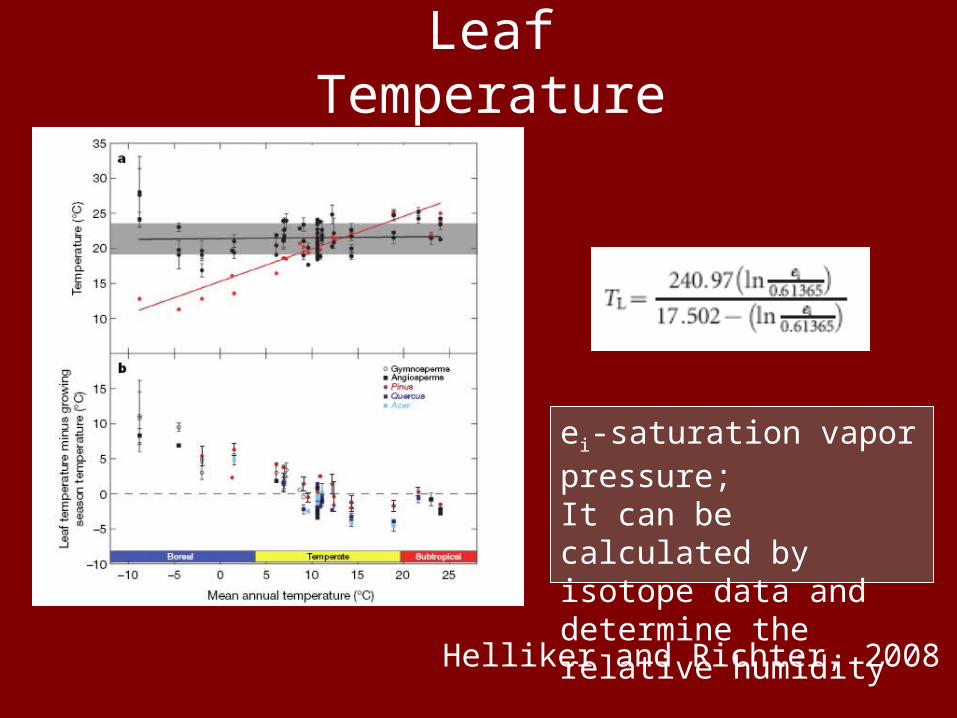
Leaf Temperature
ei-saturation vapor pressure;It can be calculated by isotope data and determine the relative humidity
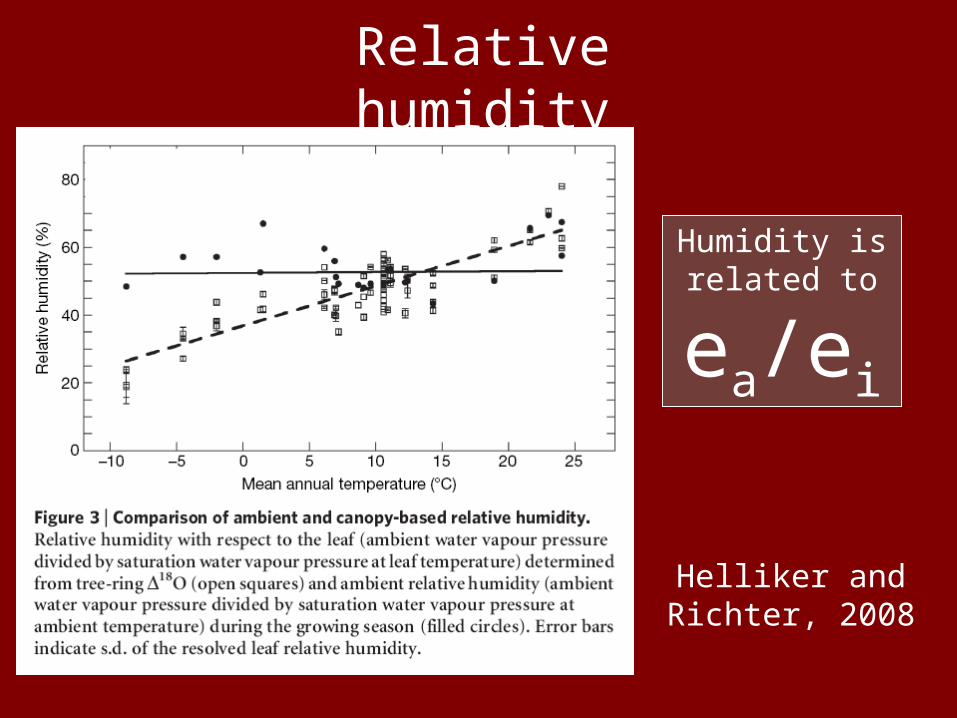
Relative humidity
Helliker andRichter, 2008
Humidity is related to
ea/ei
Implications
• Effect on real and modeled water loss from boreal ecosystems;
1. False assumption: leaf temperatures are the same as ambient temperatures;
2. Humidity reconstructions – will yield much lower values for cooler climates and higher values for warmer climates than expected
• Architectural controls of branches on leaf T