Embed Size (px)
Citation preview
Chapter 1
Primary Energy Data
October 2016
This chapter should be cited as
ERIA (2016), ‘Primary Energy Data’, prepared by the General Department of Energy and General Department of Petroleum, Cambodia National Energy Statistics 2016. ERIA Research Project Report 2015-8, Jakarta: ERIA, pp.1-15.
C h a p t e r 1
Primary Energy Data
Cambodia’s energy structure is simple. Fossil fuels, such as coal and petroleum products, are imported, while biomass is mostly produced domestically. Electricity production depends on hydro and coal with some import from Viet Nam, Thailand, and the Lao People’s Democratic Republic (Lao PDR). In this chapter, currently available primary energy data in Cambodia are introduced. The data collection flow of the existing data is shown in Annex 2.
1.1 Coal
Two types of coal data exist in Cambodia. These are the coal consumption for power generation and for the industry sector. The data are managed by Electricité du Cambodge (EDC) and the General Department of Energy (GDE), Ministry of Mines and Energy (MME).
1.1.1 Coal consumption for power generation
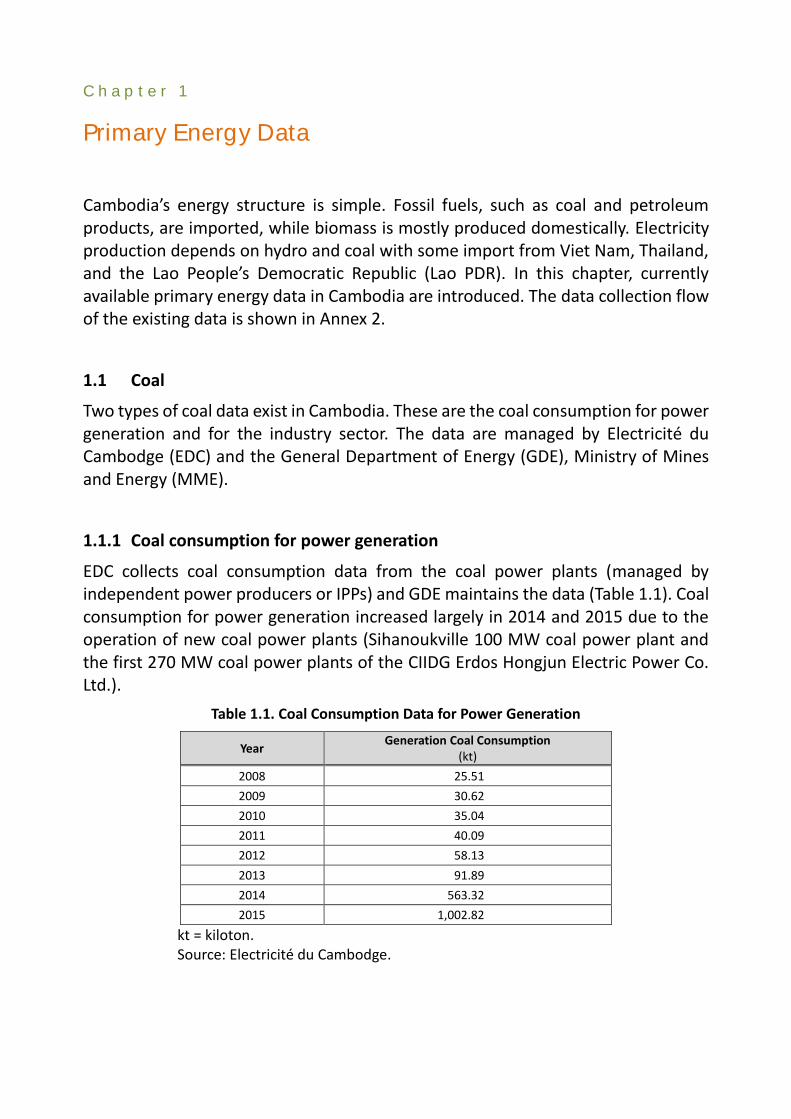
EDC collects coal consumption data from the coal power plants (managed by independent power producers or IPPs) and GDE maintains the data (Table 1.1). Coal consumption for power generation increased largely in 2014 and 2015 due to the operation of new coal power plants (Sihanoukville 100 MW coal power plant and the first 270 MW coal power plants of the CIIDG Erdos Hongjun Electric Power Co. Ltd.).
Table 1.1. Coal Consumption Data for Power Generation
Year Generation Coal Consumption
(kt)
2008 25.51
2009 30.62
2010 35.04
2011 40.09
2012 58.13
2013 91.89
2014 563.32
2015 1,002.82
kt = kiloton. Source: Electricité du Cambodge.
2 | Chapter 1 • Primary Energy Data
1.1.2 Coal consumption in the industry sector
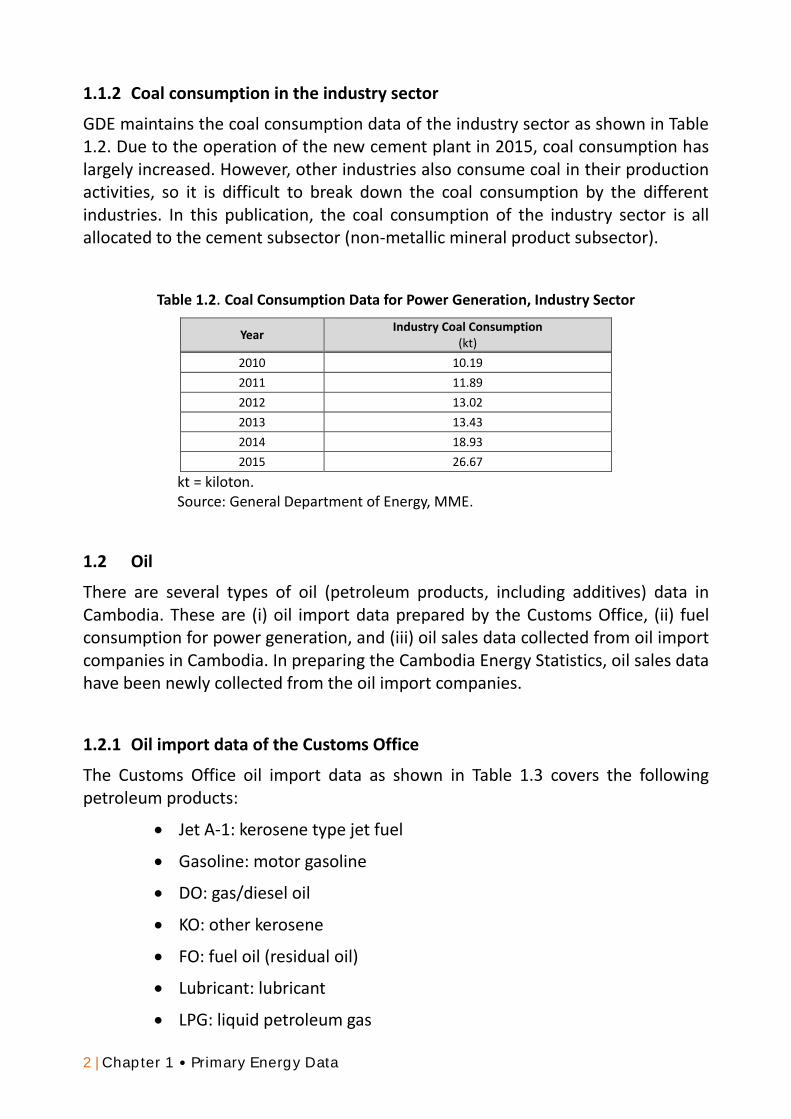
GDE maintains the coal consumption data of the industry sector as shown in Table 1.2. Due to the operation of the new cement plant in 2015, coal consumption has largely increased. However, other industries also consume coal in their production activities, so it is difficult to break down the coal consumption by the different industries. In this publication, the coal consumption of the industry sector is all allocated to the cement subsector (non-metallic mineral product subsector).
Table 1.2. Coal Consumption Data for Power Generation, Industry Sector
Year Industry Coal Consumption
(kt)
2010 10.19
2011 11.89
2012 13.02
2013 13.43
2014 18.93
2015 26.67
kt = kiloton. Source: General Department of Energy, MME.
1.2 Oil
There are several types of oil (petroleum products, including additives) data in Cambodia. These are (i) oil import data prepared by the Customs Office, (ii) fuel consumption for power generation, and (iii) oil sales data collected from oil import companies in Cambodia. In preparing the Cambodia Energy Statistics, oil sales data have been newly collected from the oil import companies.
1.2.1 Oil import data of the Customs Office
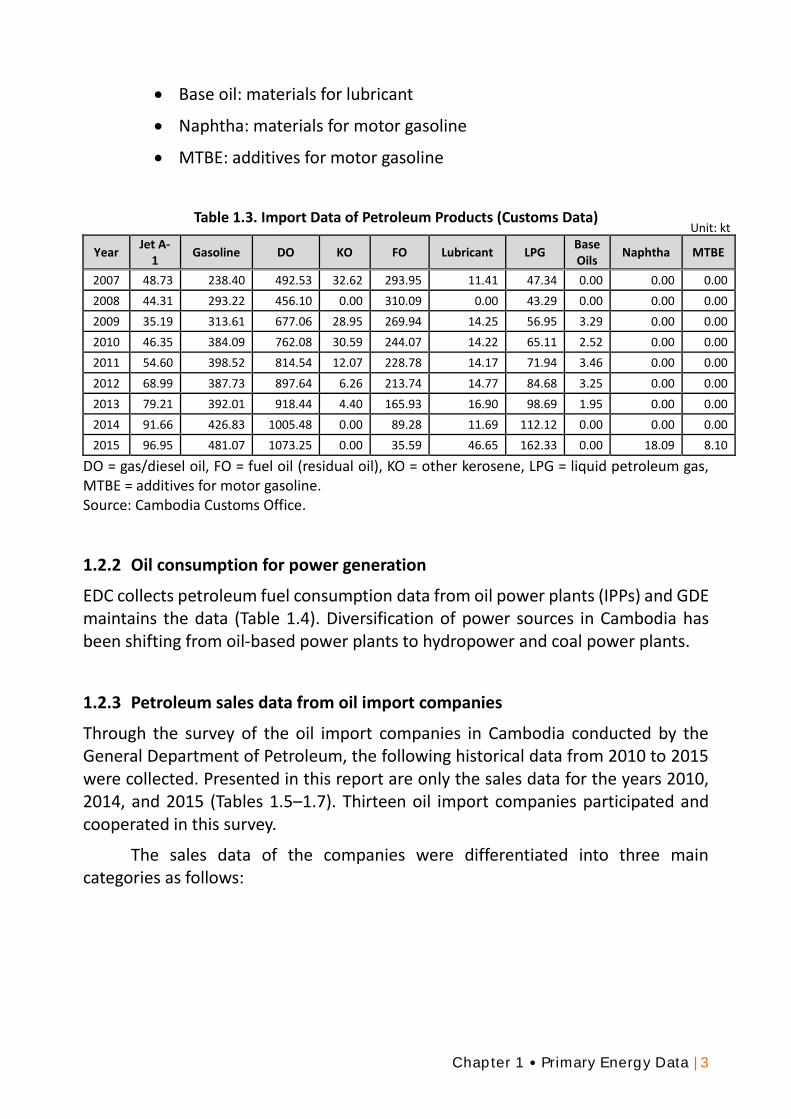
The Customs Office oil import data as shown in Table 1.3 covers the following petroleum products:
Jet A-1: kerosene type jet fuel
Gasoline: motor gasoline
DO: gas/diesel oil
KO: other kerosene
FO: fuel oil (residual oil)
Lubricant: lubricant
LPG: liquid petroleum gas
Chapter 1 • Primary Energy Data | 3
Base oil: materials for lubricant
Naphtha: materials for motor gasoline
MTBE: additives for motor gasoline
Table 1.3. Import Data of Petroleum Products (Customs Data)
Year Jet A-
1 Gasoline DO KO FO Lubricant LPG
Base Oils
Naphtha MTBE
2007 48.73 238.40 492.53 32.62 293.95 11.41 47.34 0.00 0.00 0.00
2008 44.31 293.22 456.10 0.00 310.09 0.00 43.29 0.00 0.00 0.00
2009 35.19 313.61 677.06 28.95 269.94 14.25 56.95 3.29 0.00 0.00
2010 46.35 384.09 762.08 30.59 244.07 14.22 65.11 2.52 0.00 0.00
2011 54.60 398.52 814.54 12.07 228.78 14.17 71.94 3.46 0.00 0.00
2012 68.99 387.73 897.64 6.26 213.74 14.77 84.68 3.25 0.00 0.00
2013 79.21 392.01 918.44 4.40 165.93 16.90 98.69 1.95 0.00 0.00
2014 91.66 426.83 1005.48 0.00 89.28 11.69 112.12 0.00 0.00 0.00
2015 96.95 481.07 1073.25 0.00 35.59 46.65 162.33 0.00 18.09 8.10
DO = gas/diesel oil, FO = fuel oil (residual oil), KO = other kerosene, LPG = liquid petroleum gas, MTBE = additives for motor gasoline. Source: Cambodia Customs Office.
1.2.2 Oil consumption for power generation
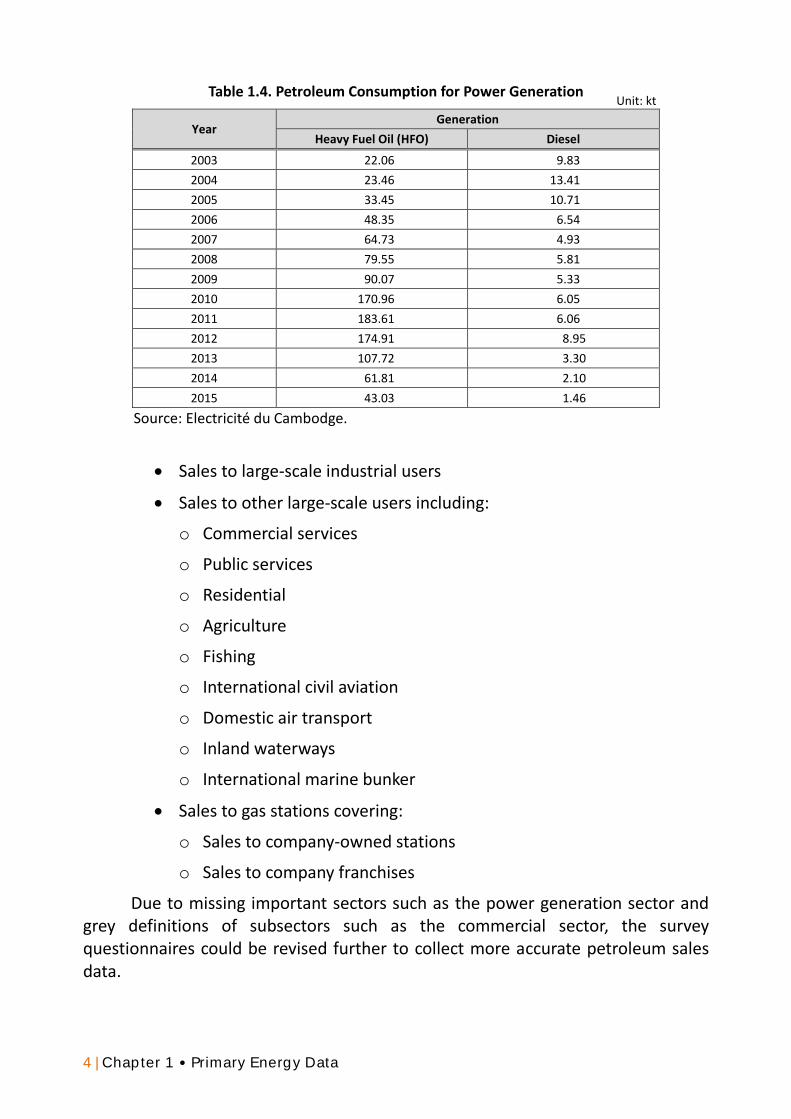
EDC collects petroleum fuel consumption data from oil power plants (IPPs) and GDE maintains the data (Table 1.4). Diversification of power sources in Cambodia has been shifting from oil-based power plants to hydropower and coal power plants.
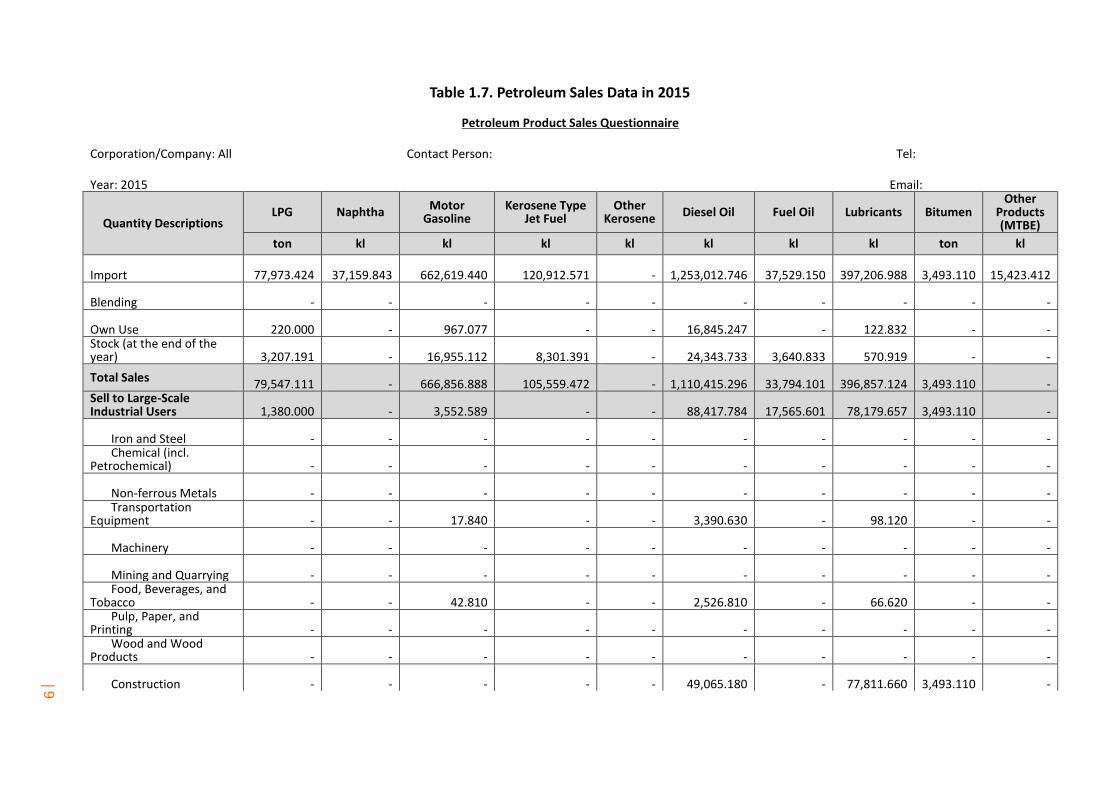
1.2.3 Petroleum sales data from oil import companies
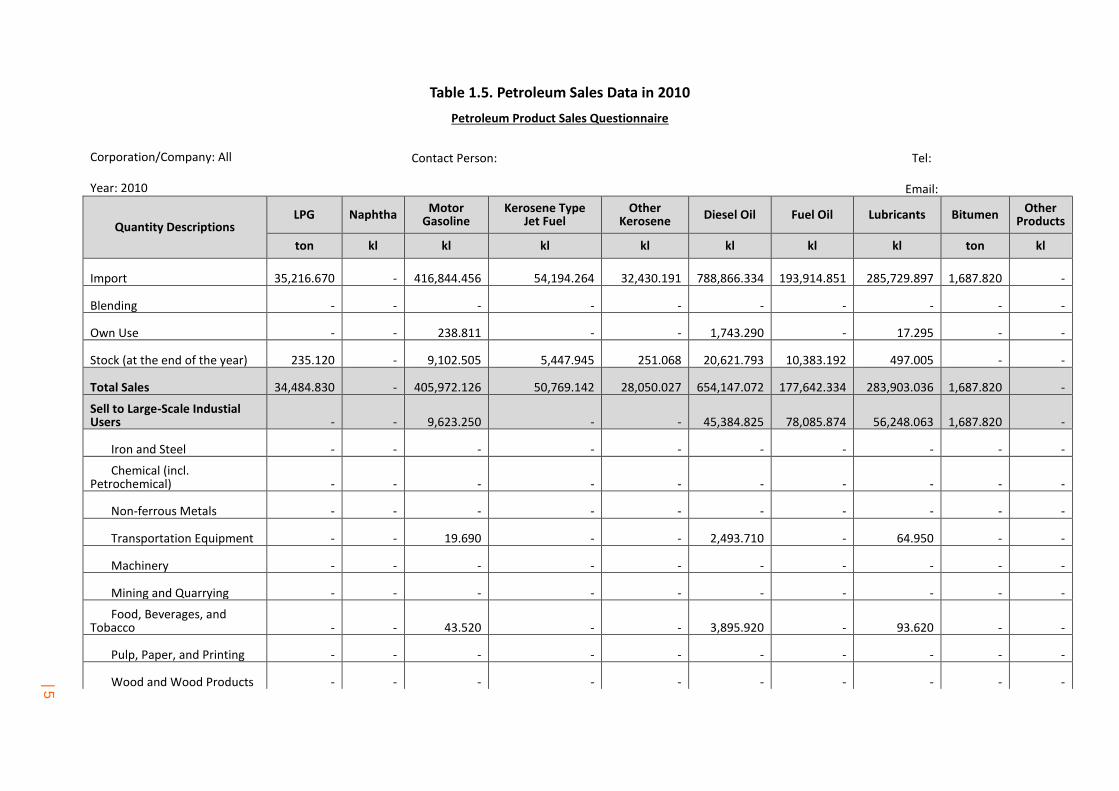
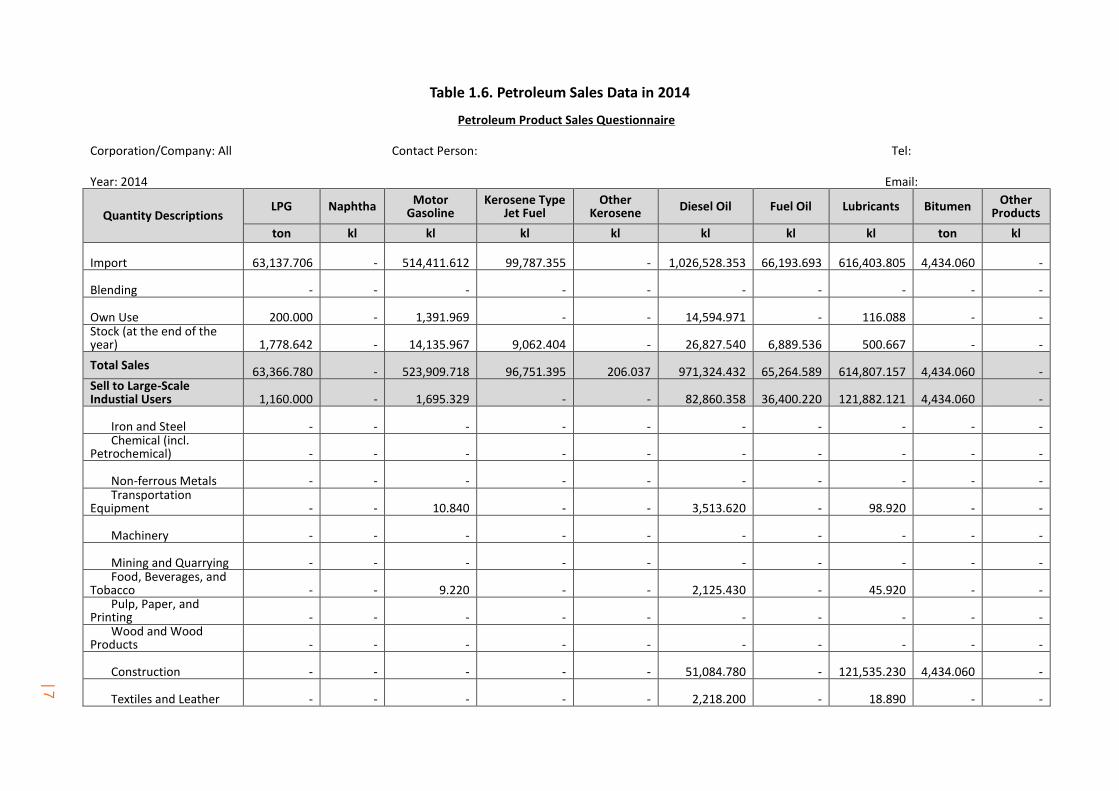
Through the survey of the oil import companies in Cambodia conducted by the General Department of Petroleum, the following historical data from 2010 to 2015 were collected. Presented in this report are only the sales data for the years 2010, 2014, and 2015 (Tables 1.5–1.7). Thirteen oil import companies participated and cooperated in this survey.
The sales data of the companies were differentiated into three main categories as follows:
Unit: kt
4 | Chapter 1 • Primary Energy Data
Table 1.4. Petroleum Consumption for Power Generation
Year Generation
Heavy Fuel Oil (HFO) Diesel
2003 22.06 9.83
2004 23.46 13.41
2005 33.45 10.71
2006 48.35 6.54
2007 64.73 4.93
2008 79.55 5.81
2009 90.07 5.33
2010 170.96 6.05
2011 183.61 6.06
2012 174.91 8.95
2013 107.72 3.30
2014 61.81 2.10
2015 43.03 1.46
Source: Electricité du Cambodge.
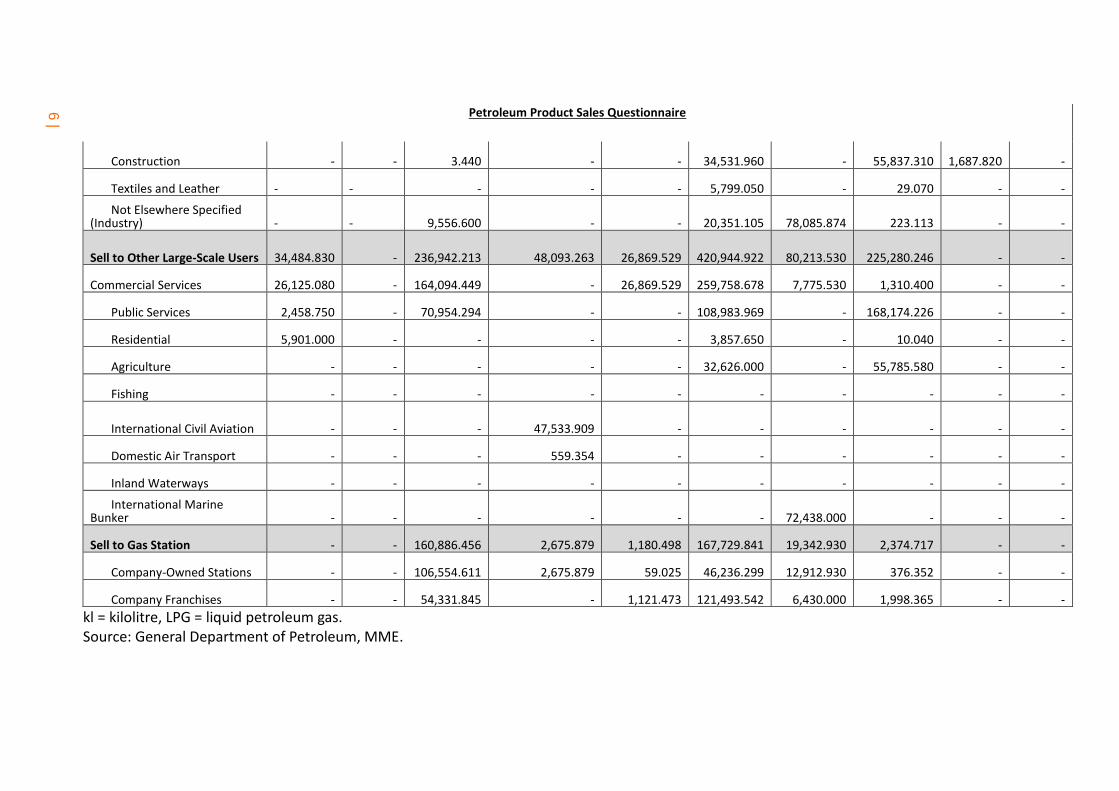
Sales to large-scale industrial users
Sales to other large-scale users including:
o Commercial services
o Public services
o Residential
o Agriculture
o Fishing
o International civil aviation
o Domestic air transport
o Inland waterways
o International marine bunker
Sales to gas stations covering:
o Sales to company-owned stations
o Sales to company franchises
Due to missing important sectors such as the power generation sector and grey definitions of subsectors such as the commercial sector, the survey questionnaires could be revised further to collect more accurate petroleum sales data.
Unit: kt
| 5
Table 1.5. Petroleum Sales Data in 2010
Petroleum Product Sales Questionnaire
Corporation/Company: All Contact Person: Tel:
Year: 2010 Email:
Quantity Descriptions LPG Naphtha
Motor Gasoline
Kerosene Type Jet Fuel
Other Kerosene Diesel Oil Fuel Oil Lubricants Bitumen
Other Products
ton kl kl kl kl kl kl kl ton kl
Import
35,216.670
-
416,844.456
54,194.264
32,430.191
788,866.334
193,914.851
285,729.897
1,687.820
-
Blending
-
-
-
-
-
-
-
-
-
-
Own Use
-
-
238.811
-
-
1,743.290
-
17.295
-
-
Stock (at the end of the year)
235.120
-
9,102.505
5,447.945
251.068
20,621.793
10,383.192
497.005
-
-
Total Sales
34,484.830
-
405,972.126
50,769.142
28,050.027
654,147.072
177,642.334
283,903.036
1,687.820
-
Sell to Large-Scale Industial Users
-
-
9,623.250
-
-
45,384.825
78,085.874
56,248.063
1,687.820
-
Iron and Steel
-
-
-
-
-
-
-
-
-
-
Chemical (incl. Petrochemical)
-
-
-
-
-
-
-
-
-
-
Non-ferrous Metals
-
-
-
-
-
-
-
-
-
-
Transportation Equipment
-
-
19.690
-
-
2,493.710
-
64.950
-
-
Machinery
-
-
-
-
-
-
-
-
-
-
Mining and Quarrying
-
-
-
-
-
-
-
-
-
-
Food, Beverages, and Tobacco
-
-
43.520
-
-
3,895.920
-
93.620
-
-
Pulp, Paper, and Printing
-
-
-
-
-
-
-
-
-
-
Wood and Wood Products
-
-
-
-
-
-
-
-
-
-
6 |
Petroleum Product Sales Questionnaire
Construction
-
-
3.440
-
-
34,531.960
-
55,837.310
1,687.820
-
Textiles and Leather -
-
-
-
-
5,799.050
-
29.070
-
-
Not Elsewhere Specified (Industry)
-
-
9,556.600
-
-
20,351.105
78,085.874
223.113
-
-
Sell to Other Large-Scale Users
34,484.830
-
236,942.213
48,093.263
26,869.529
420,944.922
80,213.530
225,280.246
-
-
Commercial Services
26,125.080
-
164,094.449
-
26,869.529
259,758.678
7,775.530
1,310.400
-
-
Public Services
2,458.750
-
70,954.294
-
-
108,983.969
-
168,174.226
-
-
Residential
5,901.000
-
-
-
-
3,857.650
-
10.040
-
-
Agriculture
-
-
-
-
-
32,626.000
-
55,785.580
-
-
Fishing
-
-
-
-
-
-
-
-
-
-
International Civil Aviation
-
-
-
47,533.909
-
-
-
-
-
-
Domestic Air Transport
-
-
-
559.354
-
-
-
-
-
-
Inland Waterways
-
-
-
-
-
-
-
-
-
-
International Marine Bunker
-
-
-
-
-
-
72,438.000
-
-
-
Sell to Gas Station
-
-
160,886.456
2,675.879
1,180.498
167,729.841
19,342.930
2,374.717
-
-
Company-Owned Stations
-
-
106,554.611
2,675.879
59.025
46,236.299
12,912.930
376.352
-
-
Company Franchises
-
-
54,331.845
-
1,121.473
121,493.542
6,430.000
1,998.365
-
-
kl = kilolitre, LPG = liquid petroleum gas. Source: General Department of Petroleum, MME.
| 7
Table 1.6. Petroleum Sales Data in 2014
Petroleum Product Sales Questionnaire
Corporation/Company: All Contact Person: Tel:
Year: 2014 Email:
Quantity Descriptions LPG Naphtha Motor
Gasoline Kerosene Type
Jet Fuel Other
Kerosene Diesel Oil Fuel Oil Lubricants Bitumen Other
Products
ton kl kl kl kl kl kl kl ton kl
Import
63,137.706
-
514,411.612
99,787.355
-
1,026,528.353
66,193.693
616,403.805
4,434.060
-
Blending
-
-
-
-
-
-
-
-
-
-
Own Use
200.000
-
1,391.969
-
-
14,594.971
-
116.088
-
- Stock (at the end of the year)
1,778.642
-
14,135.967
9,062.404
-
26,827.540
6,889.536
500.667
-
-
Total Sales 63,366.780
-
523,909.718
96,751.395
206.037
971,324.432
65,264.589
614,807.157
4,434.060
-
Sell to Large-Scale Industial Users
1,160.000
-
1,695.329
-
-
82,860.358
36,400.220
121,882.121
4,434.060
-
Iron and Steel
-
-
-
-
-
-
-
-
-
- Chemical (incl. Petrochemical)
-
-
-
-
-
-
-
-
-
-
Non-ferrous Metals
-
-
-
-
-
-
-
-
-
- Transportation Equipment
-
-
10.840
-
-
3,513.620
-
98.920
-
-
Machinery
-
-
-
-
-
-
-
-
-
-
Mining and Quarrying
-
-
-
-
-
-
-
-
-
- Food, Beverages, and Tobacco
-
-
9.220
-
-
2,125.430
-
45.920
-
-
Pulp, Paper, and Printing
-
-
-
-
-
-
-
-
-
-
Wood and Wood Products
-
-
-
-
-
-
-
-
-
-
Construction
-
-
-
-
-
51,084.780
-
121,535.230
4,434.060
-
Textiles and Leather
-
-
-
-
-
2,218.200
-
18.890
-
-
8 |
Not Elsewhere Specified (Industry)
-
-
1,675.269
-
-
23,918.328
36,400.220
183.161
-
-
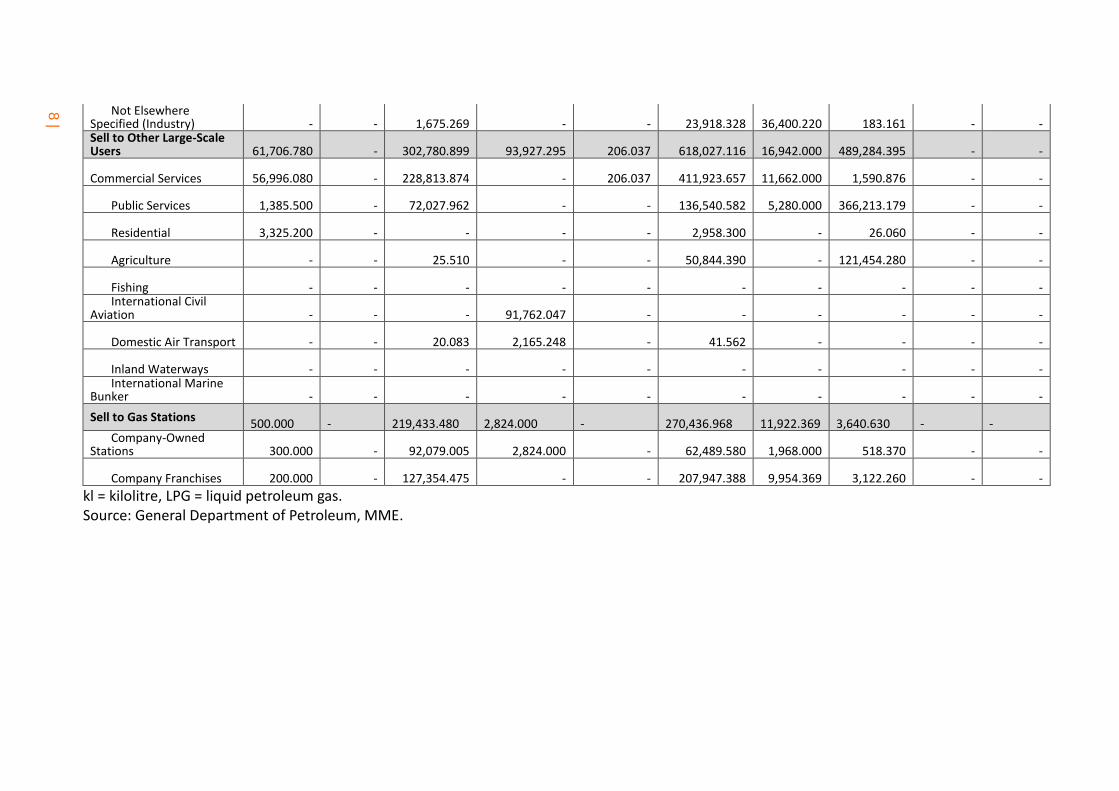
Sell to Other Large-Scale Users
61,706.780
-
302,780.899
93,927.295
206.037
618,027.116
16,942.000
489,284.395
-
-
Commercial Services
56,996.080
-
228,813.874
-
206.037
411,923.657
11,662.000
1,590.876
-
-
Public Services
1,385.500
-
72,027.962
-
-
136,540.582
5,280.000
366,213.179
-
-
Residential
3,325.200
-
-
-
-
2,958.300
-
26.060
-
-
Agriculture
-
-
25.510
-
-
50,844.390
-
121,454.280
-
-
Fishing
-
-
-
-
-
-
-
-
-
- International Civil Aviation
-
-
-
91,762.047
-
-
-
-
-
-
Domestic Air Transport
-
-
20.083
2,165.248
-
41.562
-
-
-
-
Inland Waterways
-
-
-
-
-
-
-
-
-
- International Marine Bunker
-
-
-
-
-
-
-
-
-
-
Sell to Gas Stations 500.000
-
219,433.480
2,824.000
-
270,436.968
11,922.369
3,640.630
-
-
Company-Owned Stations
300.000
-
92,079.005
2,824.000
-
62,489.580
1,968.000
518.370
-
-
Company Franchises
200.000
-
127,354.475
-
-
207,947.388
9,954.369
3,122.260
-
-
kl = kilolitre, LPG = liquid petroleum gas. Source: General Department of Petroleum, MME.
| 9
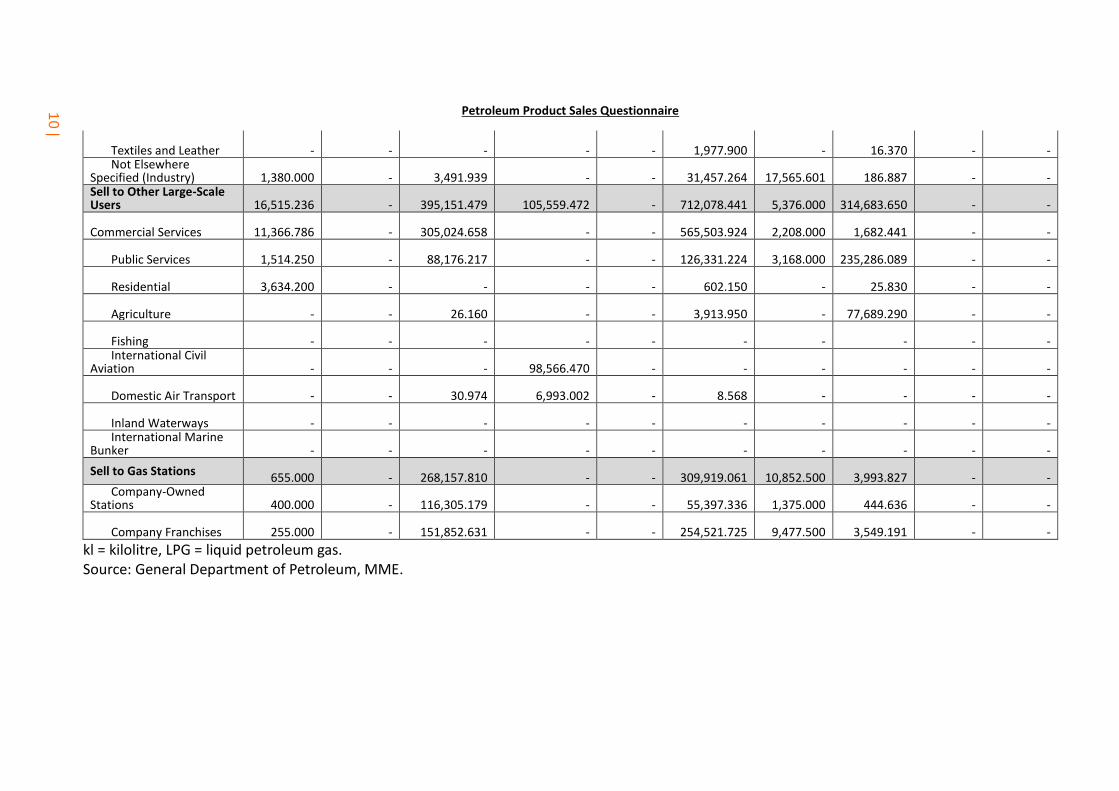
Table 1.7. Petroleum Sales Data in 2015
Petroleum Product Sales Questionnaire
Corporation/Company: All Contact Person: Tel:
Year: 2015 Email:
Quantity Descriptions LPG Naphtha
Motor Gasoline
Kerosene Type Jet Fuel
Other Kerosene Diesel Oil Fuel Oil Lubricants Bitumen
Other Products (MTBE)
ton kl kl kl kl kl kl kl ton kl
Import
77,973.424
37,159.843
662,619.440
120,912.571
-
1,253,012.746
37,529.150
397,206.988
3,493.110
15,423.412
Blending
-
-
-
-
-
-
-
-
-
-
Own Use
220.000
-
967.077
-
-
16,845.247
-
122.832
-
- Stock (at the end of the year)
3,207.191
-
16,955.112
8,301.391
-
24,343.733
3,640.833
570.919
-
-
Total Sales 79,547.111
-
666,856.888
105,559.472
-
1,110,415.296
33,794.101
396,857.124
3,493.110
-
Sell to Large-Scale Industrial Users
1,380.000
-
3,552.589
-
-
88,417.784
17,565.601
78,179.657
3,493.110
-
Iron and Steel
-
-
-
-
-
-
-
-
-
- Chemical (incl. Petrochemical)
-
-
-
-
-
-
-
-
-
-
Non-ferrous Metals
-
-
-
-
-
-
-
-
-
- Transportation Equipment
-
-
17.840
-
-
3,390.630
-
98.120
-
-
Machinery
-
-
-
-
-
-
-
-
-
-
Mining and Quarrying
-
-
-
-
-
-
-
-
-
- Food, Beverages, and Tobacco
-
-
42.810
-
-
2,526.810
-
66.620
-
-
Pulp, Paper, and Printing
-
-
-
-
-
-
-
-
-
-
Wood and Wood Products
-
-
-
-
-
-
-
-
-
-
Construction
-
-
-
-
-
49,065.180
-
77,811.660
3,493.110
-
10
|
Petroleum Product Sales Questionnaire
Textiles and Leather
-
-
-
-
-
1,977.900
-
16.370
-
- Not Elsewhere Specified (Industry)
1,380.000
-
3,491.939
-
-
31,457.264
17,565.601
186.887
-
-
Sell to Other Large-Scale Users
16,515.236
-
395,151.479
105,559.472
-
712,078.441
5,376.000
314,683.650
-
-
Commercial Services
11,366.786
-
305,024.658
-
-
565,503.924
2,208.000
1,682.441
-
-
Public Services
1,514.250
-
88,176.217
-
-
126,331.224
3,168.000
235,286.089
-
-
Residential
3,634.200
-
-
-
-
602.150
-
25.830
-
-
Agriculture
-
-
26.160
-
-
3,913.950
-
77,689.290
-
-
Fishing
-
-
-
-
-
-
-
-
-
- International Civil Aviation
-
-
-
98,566.470
-
-
-
-
-
-
Domestic Air Transport
-
-
30.974
6,993.002
-
8.568
-
-
-
-
Inland Waterways
-
-
-
-
-
-
-
-
-
- International Marine Bunker
-
-
-
-
-
-
-
-
-
-
Sell to Gas Stations
655.000
-
268,157.810
-
-
309,919.061
10,852.500
3,993.827
-
- Company-Owned Stations
400.000
-
116,305.179
-
-
55,397.336
1,375.000
444.636
-
-
Company Franchises
255.000
-
151,852.631
-
-
254,521.725
9,477.500
3,549.191
-
-
kl = kilolitre, LPG = liquid petroleum gas. Source: General Department of Petroleum, MME.
Chapter 1 • Primary Energy Data | 11
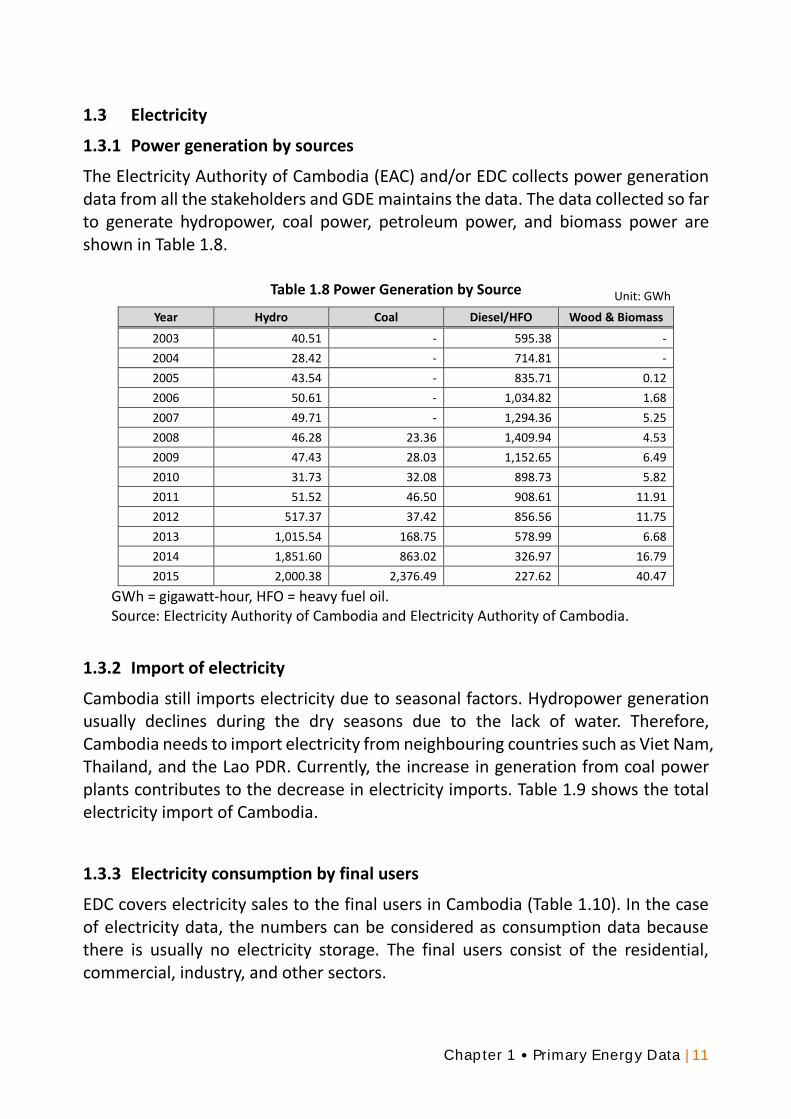
1.3 Electricity
1.3.1 Power generation by sources
The Electricity Authority of Cambodia (EAC) and/or EDC collects power generation data from all the stakeholders and GDE maintains the data. The data collected so far to generate hydropower, coal power, petroleum power, and biomass power are shown in Table 1.8.
Table 1.8 Power Generation by Source
Year Hydro Coal Diesel/HFO Wood & Biomass
2003 40.51 - 595.38 -
2004 28.42 - 714.81 -
2005 43.54 - 835.71 0.12
2006 50.61 - 1,034.82 1.68
2007 49.71 - 1,294.36 5.25
2008 46.28 23.36 1,409.94 4.53
2009 47.43 28.03 1,152.65 6.49
2010 31.73 32.08 898.73 5.82
2011 51.52 46.50 908.61 11.91
2012 517.37 37.42 856.56 11.75
2013 1,015.54 168.75 578.99 6.68
2014 1,851.60 863.02 326.97 16.79
2015 2,000.38 2,376.49 227.62 40.47
GWh = gigawatt-hour, HFO = heavy fuel oil. Source: Electricity Authority of Cambodia and Electricity Authority of Cambodia.
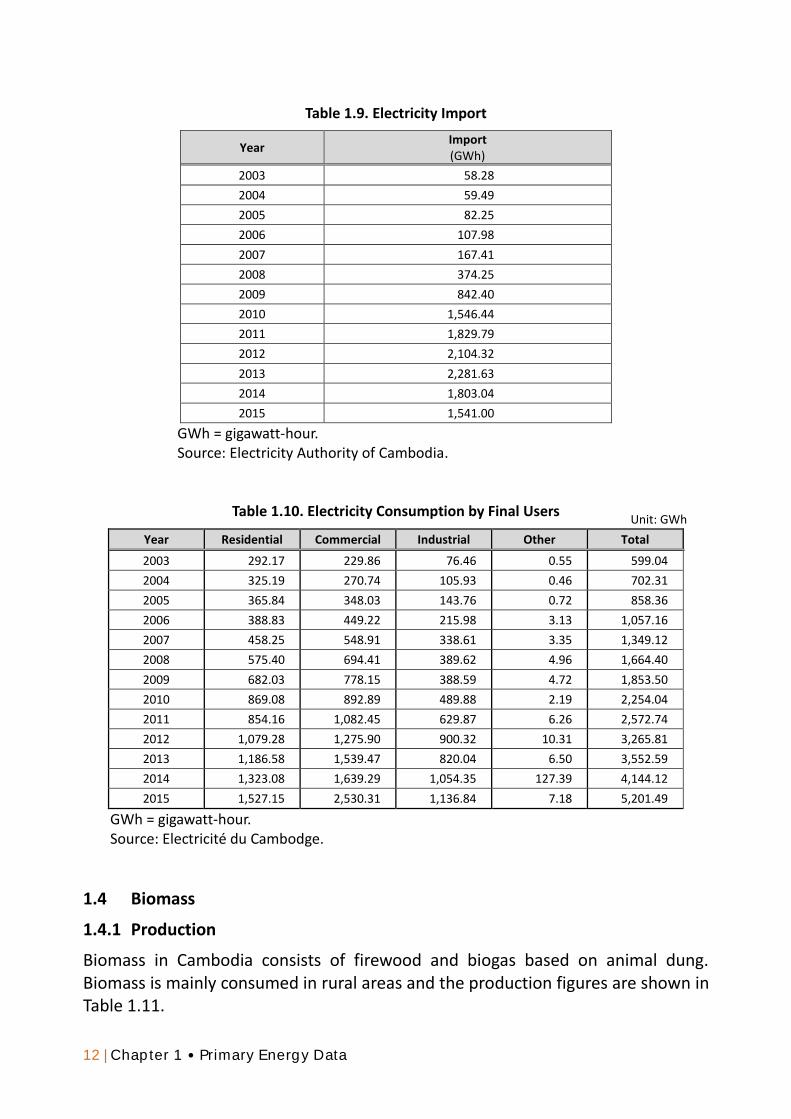
1.3.2 Import of electricity
Cambodia still imports electricity due to seasonal factors. Hydropower generation usually declines during the dry seasons due to the lack of water. Therefore, Cambodia needs to import electricity from neighbouring countries such as Viet Nam, Thailand, and the Lao PDR. Currently, the increase in generation from coal power plants contributes to the decrease in electricity imports. Table 1.9 shows the total electricity import of Cambodia.
1.3.3 Electricity consumption by final users
EDC covers electricity sales to the final users in Cambodia (Table 1.10). In the case of electricity data, the numbers can be considered as consumption data because there is usually no electricity storage. The final users consist of the residential, commercial, industry, and other sectors.
Unit: GWh
12 | Chapter 1 • Primary Energy Data
Table 1.9. Electricity Import
Year Import (GWh)
2003 58.28
2004 59.49
2005 82.25
2006 107.98
2007 167.41
2008 374.25
2009 842.40
2010 1,546.44
2011 1,829.79
2012 2,104.32
2013 2,281.63
2014 1,803.04
2015 1,541.00
GWh = gigawatt-hour. Source: Electricity Authority of Cambodia.
Table 1.10. Electricity Consumption by Final Users
Year Residential Commercial Industrial Other Total
2003 292.17 229.86 76.46 0.55 599.04
2004 325.19 270.74 105.93 0.46 702.31
2005 365.84 348.03 143.76 0.72 858.36
2006 388.83 449.22 215.98 3.13 1,057.16
2007 458.25 548.91 338.61 3.35 1,349.12
2008 575.40 694.41 389.62 4.96 1,664.40
2009 682.03 778.15 388.59 4.72 1,853.50
2010 869.08 892.89 489.88 2.19 2,254.04
2011 854.16 1,082.45 629.87 6.26 2,572.74
2012 1,079.28 1,275.90 900.32 10.31 3,265.81
2013 1,186.58 1,539.47 820.04 6.50 3,552.59
2014 1,323.08 1,639.29 1,054.35 127.39 4,144.12
2015 1,527.15 2,530.31 1,136.84 7.18 5,201.49
GWh = gigawatt-hour. Source: Electricité du Cambodge.
1.4 Biomass
1.4.1 Production
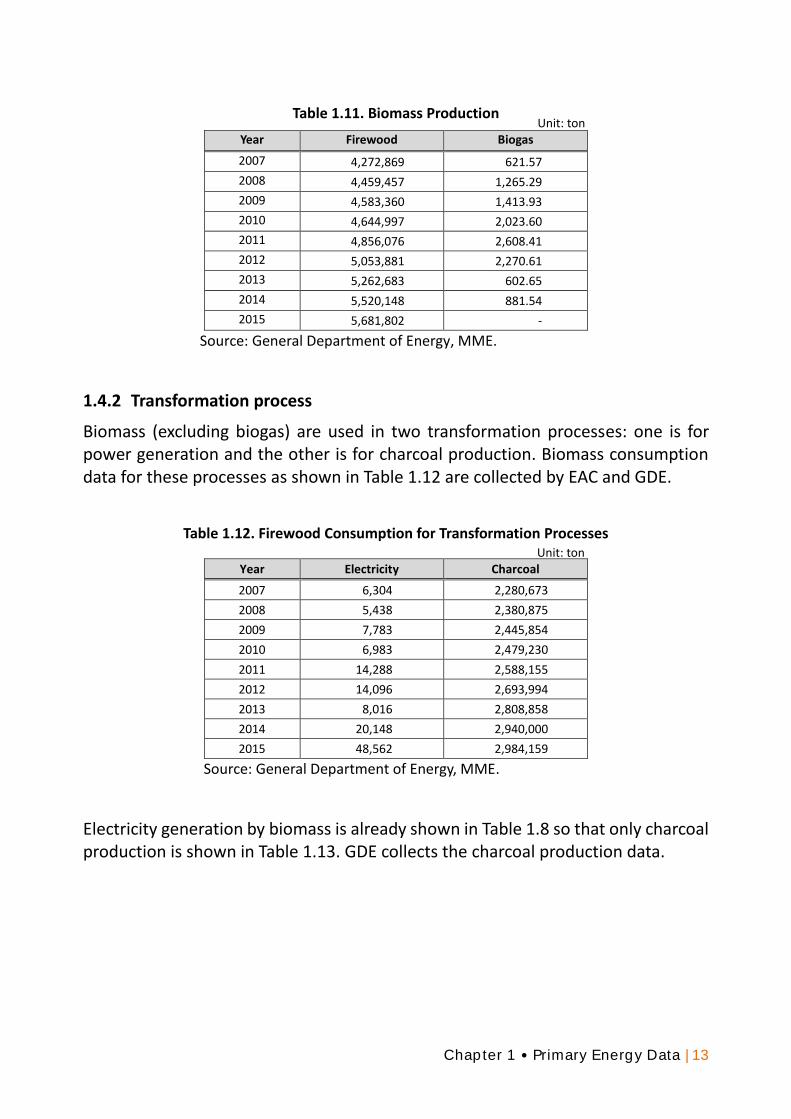
Biomass in Cambodia consists of firewood and biogas based on animal dung. Biomass is mainly consumed in rural areas and the production figures are shown in Table 1.11.
Unit: GWh
Chapter 1 • Primary Energy Data | 13
Table 1.11. Biomass Production
Year Firewood Biogas
2007 4,272,869 621.57
2008 4,459,457 1,265.29
2009 4,583,360 1,413.93
2010 4,644,997 2,023.60
2011 4,856,076 2,608.41
2012 5,053,881 2,270.61
2013 5,262,683 602.65
2014 5,520,148 881.54
2015 5,681,802 -
Source: General Department of Energy, MME.
1.4.2 Transformation process
Biomass (excluding biogas) are used in two transformation processes: one is for power generation and the other is for charcoal production. Biomass consumption data for these processes as shown in Table 1.12 are collected by EAC and GDE.
Table 1.12. Firewood Consumption for Transformation Processes
Year Electricity Charcoal
2007 6,304 2,280,673
2008 5,438 2,380,875
2009 7,783 2,445,854
2010 6,983 2,479,230
2011 14,288 2,588,155
2012 14,096 2,693,994
2013 8,016 2,808,858
2014 20,148 2,940,000
2015 48,562 2,984,159
Source: General Department of Energy, MME.
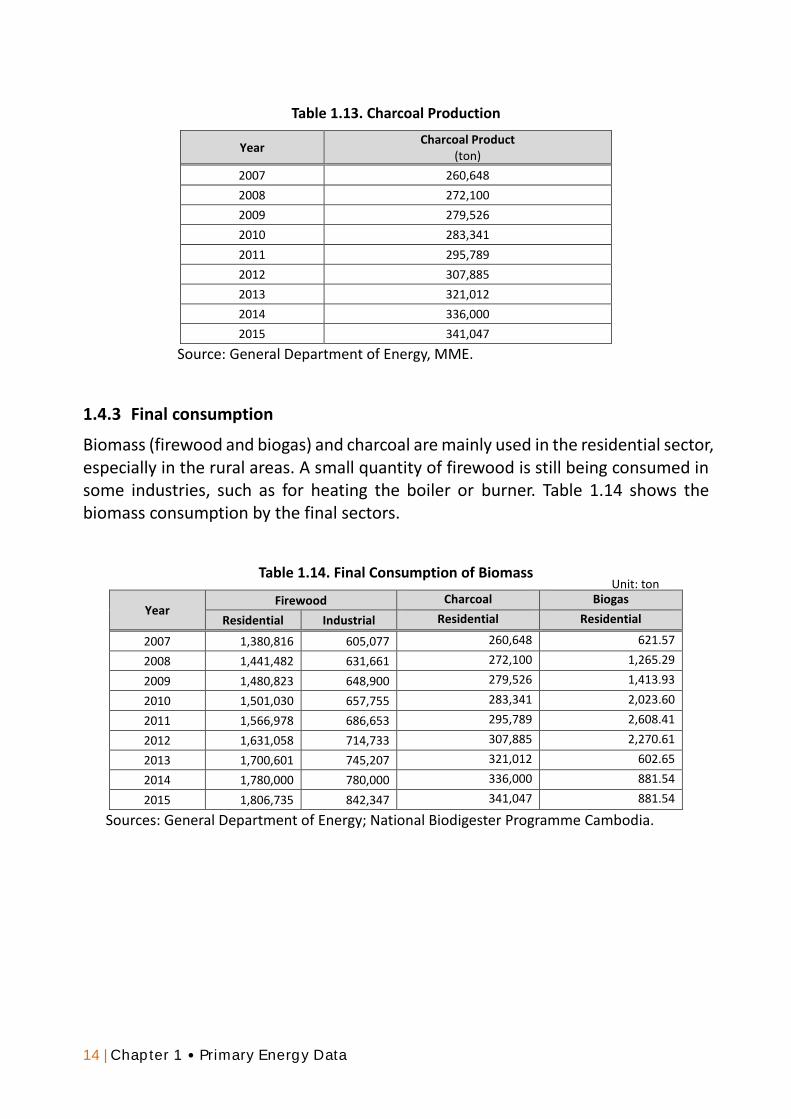
Electricity generation by biomass is already shown in Table 1.8 so that only charcoal production is shown in Table 1.13. GDE collects the charcoal production data.
Unit: ton
Unit: ton
14 | Chapter 1 • Primary Energy Data
Table 1.13. Charcoal Production
Year Charcoal Product
(ton)
2007 260,648
2008 272,100
2009 279,526
2010 283,341
2011 295,789
2012 307,885
2013 321,012
2014 336,000
2015 341,047
Source: General Department of Energy, MME.
1.4.3 Final consumption
Biomass (firewood and biogas) and charcoal are mainly used in the residential sector, especially in the rural areas. A small quantity of firewood is still being consumed in some industries, such as for heating the boiler or burner. Table 1.14 shows the biomass consumption by the final sectors.
Table 1.14. Final Consumption of Biomass
Year Firewood Charcoal Biogas
Residential Industrial Residential Residential
2007 1,380,816 605,077 260,648 621.57
2008 1,441,482 631,661 272,100 1,265.29
2009 1,480,823 648,900 279,526 1,413.93
2010 1,501,030 657,755 283,341 2,023.60
2011 1,566,978 686,653 295,789 2,608.41
2012 1,631,058 714,733 307,885 2,270.61
2013 1,700,601 745,207 321,012 602.65
2014 1,780,000 780,000 336,000 881.54
2015 1,806,735 842,347 341,047 881.54
Sources: General Department of Energy; National Biodigester Programme Cambodia.
Unit: ton
Chapter 1 • Primary Energy Data | 15
1.5 Estimation of Missing Data
Clearly, substantial energy data are available for preparing the Cambodia energy balance table historically from 2010 to 2014 and, in some cases, also up to 2015. Nonetheless, some energy data are still missing. In this case, estimation of missing data is indispensable. The following are examples of the estimation under this project (details are shown in Chapter 2):
Coal import: Coal import estimated based on coal consumption data.
Final consumption of petroleum products: Petroleum import data between the Customs Office and petroleum companies are not the same due to different definitions of the products. As such, the customs data are the control data for total consumption. The final consumption of petroleum products is estimated from the petroleum companies’ data.
Separation of the jet fuel imports for domestic flights and international flights is based on Cambodia’s air transport statistics (international aviation bunker).
The international standard heat value is applied for converting the physical value into its heat value. The unit for the energy balance table is the heat value (e.g. tons of oil equivalent, TOE).
Electricity for own use is separated at generation sites into coal, petroleum, hydro, and biomass power generation.