Embed Size (px)
Citation preview
Application Note
Primary Characterization of a Monoclonal Antibody Using Agilent HPLC-Chip Accurate-Mass LC/MS Technology
The characterization of a monoclonal antibody at low nanogram levels using
an Agilent HPLC-Chip system coupled to an Agilent Accurate-Mass Q-TOF MS
instrument is described. The superior sensitivity and mass accuracy of the
HPLC-Chip LC/MS platform, combined with the powerful data processing
capabilities of Agilent MassHunter and BioConfi rm software, enabled easy and
rapid identifi cation of antibody heterogeneity and cleaved fragments. Robust,
reliable, and easy to use, Agilent nanofl ow LC/MS technology is ideally suited
for the routine analysis of biopharmaceuticals.
Introduction
Recombinant monoclonal antibodies (mAbs) represent an important class of bio-
pharmaceutical products with a wide range of diagnostic and clinical applications.
The worldwide market for monoclonal antibodies is projected to reach $26 billion by
2010–2011. These therapeutic glycoproteins are usually produced from mammalian
cell lines (hybridomas), then purifi ed, concentrated, and exchanged into an appropriate
formulation buffer prior to being sold. Although mAbs are relatively stable biomol-
ecules, a number of chemical modifi cations and degradation reactions can occur
during manufacturing, formulation, and storage, thereby necessitating reliable and
sensitive methods for the characterization of protein purity and structural integrity.
Accurate mass measurements of intact proteins, whole subunits, or domains are
useful for the rapid verifi cation of sequence composition and identifi cation of post-
translational modifi cations and sample handling artifacts.
LC/MS technology is a powerful and sensitive technique for the characterization and
identifi cation of proteins. Nanofl ow LC/MS enables faster and more sensitive protein
identifi cation while minimizing sample and solvent consumption. Agilent’s microfl uidic-
based HPLC-Chip integrates sample preparation, chromatographic separation, and
nanoelectrospray formation for effi cient, high-sensitivity nanospray LC/MS. Agilent
Accurate-Mass LC/MS TOF and Q-TOF systems deliver exceptional mass resolution,
Authors
Ravindra Gudihal
Sudha Ragalopalan
Ranjit Gulge
Andrew Gieschen
Christine Miller
Ning Tang
Keith Waddell
Agilent Technologies, Inc.,
Santa Clara, CA, USA
Application Note
2 This item is intended for Research Use Only. Not for use in diagnostic procedures.
mass accuracy, sensitivity, and data processing capabilities for
optimal MS characterization of proteins. In this note, we report
the rapid LC/MS characterization of low nanogram levels of
an intact mAb and its fragments using the Agilent HPLC-Chip
system coupled to an Accurate-Mass Q-TOF.
Experimental
Materials
L-cysteine, EDTA disodium, sodium phosphate dibasic anhy-
drous, sodium phosphate monobasic, sodium bicarbonate,
papain suspension (in 0.05 M sodium acetate), and DL-dithio-
threitol (DTT) were purchased from Sigma. PNGase and the
Tris reaction buffer pH 8.2 were obtained from Prozyme.
Deglycosylation reaction
Deglycosylation of the mAb was performed using PNGase
in 20 mM Tris-HCl buffer pH 8.2 as described by the manu-
facturer. Briefl y, 0.3 µL of 100 U/mL solution of PNGase was
added to 3 µg of antibody in 20 mM Tris-HCl buffer pH 8.2. The
mixture was incubated at 37°C for 24 hr. Samples were appro-
priately diluted in 3% acetonitrile/water with 0.1%
formic acid solution prior to LC/MS analysis.
Papain digestion
The papain was activated using freshly prepared activation
buffer (papain activation/digestion buffer: 1 mM EDTA, 50 mM
sodium phosphate buffer and 10 mM cysteine, pH 7.0) for 15
min at 37°C. Activated papain solution was then added to the
mAb in papain digestion buffer. The mAb-to-protease ratio
was 60:1(w/w). The mixture was incubated at 37°C for 2 hr.
Samples were appropriately diluted in 3% acetonitrile/water
with 0.1% formic acid solution prior to LC/MS analysis.
3
Reduction reaction
The mAb (1.5 µg) was reduced with 25 mM DTT at pH 8.6 for 1
hr at 80°C. Samples were appropriately diluted in 3% acetonitrile/
water with 0.1% formic acid solution prior to LC/MS analysis.
LC/MS Analysis
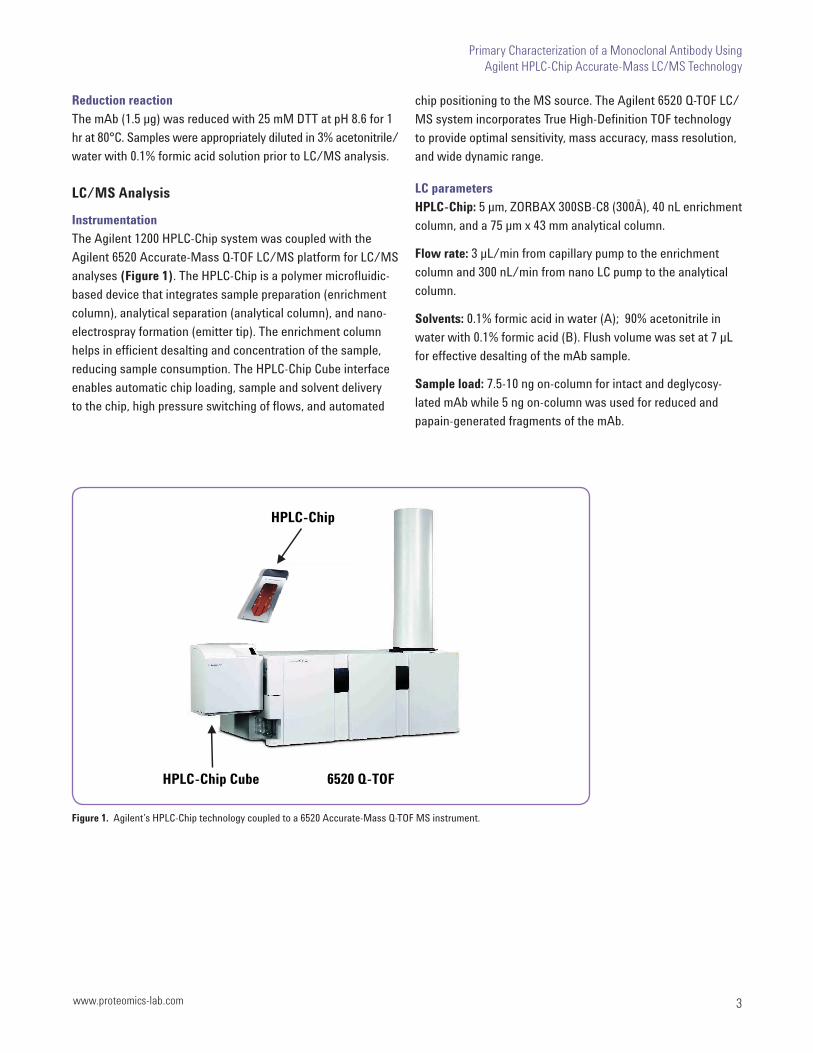
Instrumentation
The Agilent 1200 HPLC-Chip system was coupled with the
Agilent 6520 Accurate-Mass Q-TOF LC/MS platform for LC/MS
analyses (Figure 1). The HPLC-Chip is a polymer microfl uidic-
based device that integrates sample preparation (enrichment
column), analytical separation (analytical column), and nano-
electrospray formation (emitter tip). The enrichment column
helps in effi cient desalting and concentration of the sample,
reducing sample consumption. The HPLC-Chip Cube interface
enables automatic chip loading, sample and solvent delivery
to the chip, high pressure switching of fl ows, and automated
chip positioning to the MS source. The Agilent 6520 Q-TOF LC/
MS system incorporates True High-Defi nition TOF technology
to provide optimal sensitivity, mass accuracy, mass resolution,
and wide dynamic range.
LC parameters
HPLC-Chip: 5 µm, ZORBAX 300SB-C8 (300Å), 40 nL enrichment
column, and a 75 µm x 43 mm analytical column.
Flow rate: 3 µL/min from capillary pump to the enrichment
column and 300 nL/min from nano LC pump to the analytical
column.
Solvents: 0.1% formic acid in water (A); 90% acetonitrile in
water with 0.1% formic acid (B). Flush volume was set at 7 µL
for effective desalting of the mAb sample.
Sample load: 7.5-10 ng on-column for intact and deglycosy-
lated mAb while 5 ng on-column was used for reduced and
papain-generated fragments of the mAb.
Primary Characterization of a Monoclonal Antibody Using Agilent HPLC-Chip Accurate-Mass LC/MS Technology
www.proteomics-lab.com
Figure 1. Agilent’s HPLC-Chip technology coupled to a 6520 Accurate-Mass Q-TOF MS instrument.
HPLC-Chip
HPLC-Chip Cube 6520 Q-TOF
Application Note
4 This item is intended for Research Use Only. Not for use in diagnostic procedures.
Sample loading: With cap pump at 3% B.
Sample analysis: Gradient with nano pump as shown below.
MS parameters
Spectra were recorded in positive ion mode and in profi le mode
on the Agilent 6520 Accurate-Mass Q-TOF MS instrument.
Vcap: 1750 V and drying gas fl ow of 5 L/min at 325°C was
used.
Fragmentor voltage: 420 V for intact antibody/deglycosylated
form and 350 V for the fragments.
Data were acquired in standard (20,000 m/z), 1 GHz, MS only
mode, range 500-4,000 m/z (for fragments of mAb); 1,000-4,000
m/z (for intact mAb).
Data analysis
AgilentMass Hunter Qualitative Analysis software and the
MassHunter BioConfi rm software (version B.02.00) were used.
Protein and fragment masses were obtained using maximum
entropy deconvolution. Average masses for intact mAb, light
chain, heavy chain, Fab, and Fc were calculated from sequences
using the Sequence Editor feature found in the BioConfi rm
software.
4x10
0
0.1
0.2
0.3
0.4
0.5
0.6
0.7
0.8
0.9
1
1.1
1.2
1.3
1.4
1.5
1.6
1.7
1.8
1.9
2
2706.7422
2756.7152 2611.8165
2808.7909 2566.7952
2862.7840 2523.3067
2481.2595 2919.0798
2440.5988 2977.3333
2401.2639 3038.0612 2363.1768
3101.3321 3167.3332
3308.0414
Counts vs. Mass-to-Charge (m/z)
2200 2250 2300 2350 2400 2450 2500 2550 2600 2650 2700 2750 2800 2850 2900 2950 3000 3050 3100 3150 3200 3250 3300 3350 3400
x104
0
0.5
1
1.5
2 2706.7422 2658.4255
2756.7152
2808.7909
2680.4239 2730.0683 2781.5349
Counts vs. Mass-to-Charge (m/z)
2660 2680 2700 2720 2740 2760 2780 2800 2820
2658.4255
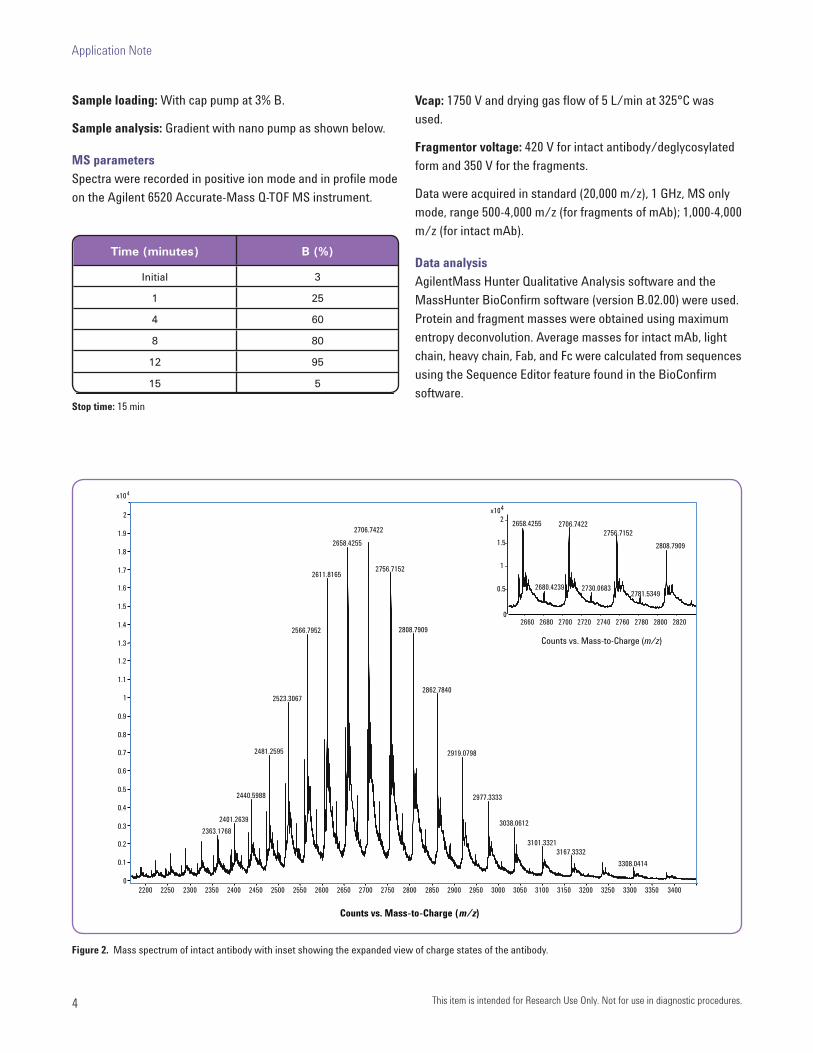
Figure 2. Mass spectrum of intact antibody with inset showing the expanded view of charge states of the antibody.
Stop time: 15 min
Time (minutes) B (%)
Initial 3
1 25
4 60
8 80
12 95
15 5
www.proteomics-lab.com
Primary Characterization of a Monoclonal Antibody Using Agilent HPLC-Chip Accurate-Mass LC/MS Technology
5
Results and Discussion
Analysis of Intact Antibody
Figure 2 shows the averaged mass spectrum of the intact anti-
body after elution from the HPLC-Chip. A very well distributed
series of peaks is seen corresponding to the m/z of the many
different charge state species of the intact antibody. Small
satellite peaks within each charge state are also observed
(see inset), corresponding to either adducts or modifi cations
of the mAb. To gain more insight into the possible modifi ca-
tion/adduct, deconvolution of the intact mass spectrum was
performed using a maximum entropy algorithm (Figure 3).
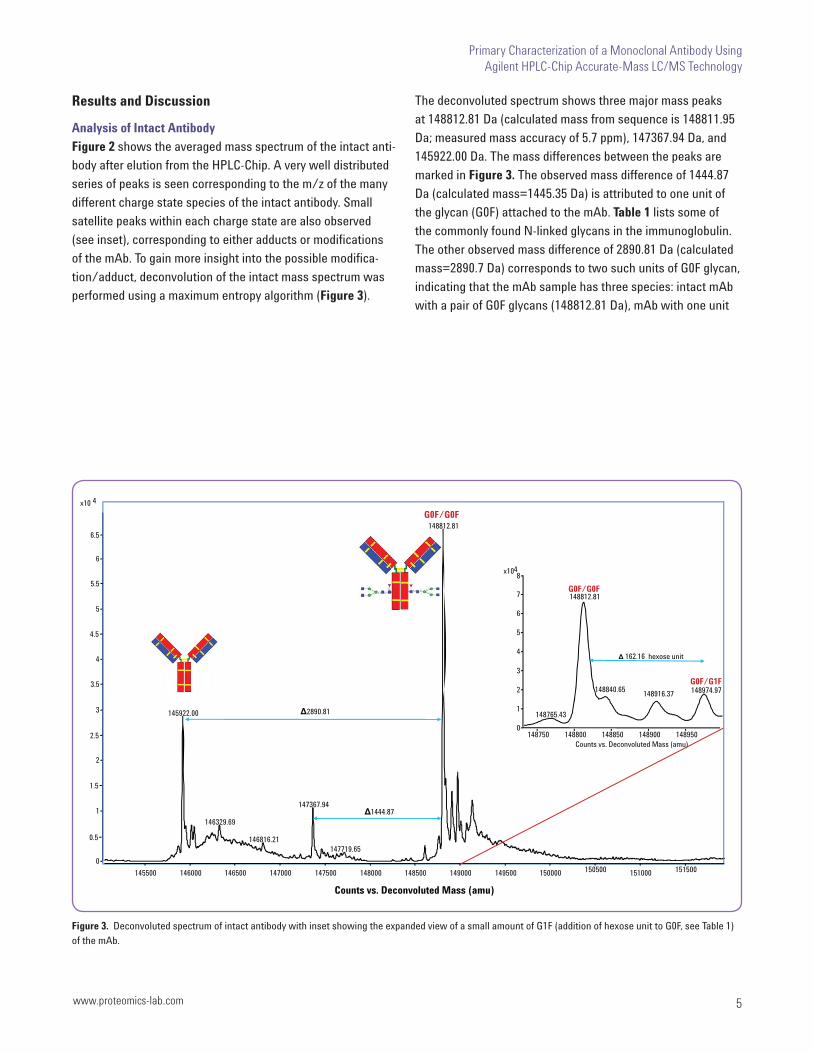
The deconvoluted spectrum shows three major mass peaks
at 148812.81 Da (calculated mass from sequence is 148811.95
Da; measured mass accuracy of 5.7 ppm), 147367.94 Da, and
145922.00 Da. The mass differences between the peaks are
marked in Figure 3. The observed mass difference of 1444.87
Da (calculated mass=1445.35 Da) is attributed to one unit of
the glycan (G0F) attached to the mAb. Table 1 lists some of
the commonly found N-linked glycans in the immunoglobulin.
The other observed mass difference of 2890.81 Da (calculated
mass=2890.7 Da) corresponds to two such units of G0F glycan,
indicating that the mAb sample has three species: intact mAb
with a pair of G0F glycans (148812.81 Da), mAb with one unit
Figure 3. Deconvoluted spectrum of intact antibody with inset showing the expanded view of a small amount of G1F (addition of hexose unit to G0F, see Table 1)
of the mAb.
1444.87
2890.81
G0F/G0Fx10 4
0
1
2
3
4
5
6
6.5 148812.81
145922.00
147367.94
146329.69
146816.21 147719.65
Counts vs. Deconvoluted Mass (amu)
145500 146000 146500 147000 147500 148000 148500 149000 149500 150000 150500 151000 151500
5.5
4.5
3.5
2.5
1.5
0.5
162.16 hexose unit
x104
0
1
2
3
4
5
6
7
8
148812.81
148974.97 148840.65 148916.37
148765.43
Counts vs. Deconvoluted Mass (amu) 148750 148800 148850 148900 148950
G0F/G0F
G0F/G1F
Application Note
6 This item is intended for Research Use Only. Not for use in diagnostic procedures.
of G0F glycan (147367.94 Da), and mAb devoid of any N-
linked glycan part (145922.00 Da). Another peak (Figure 3) at
148974.97 Da was assigned to the addition of a hexose unit to
the G0F glycan part of the antibody (observed mass increase
of 162.16 Da; calculated mass is 162.14 Da), denoted as G1F in
Figure 3 (see Table 1).
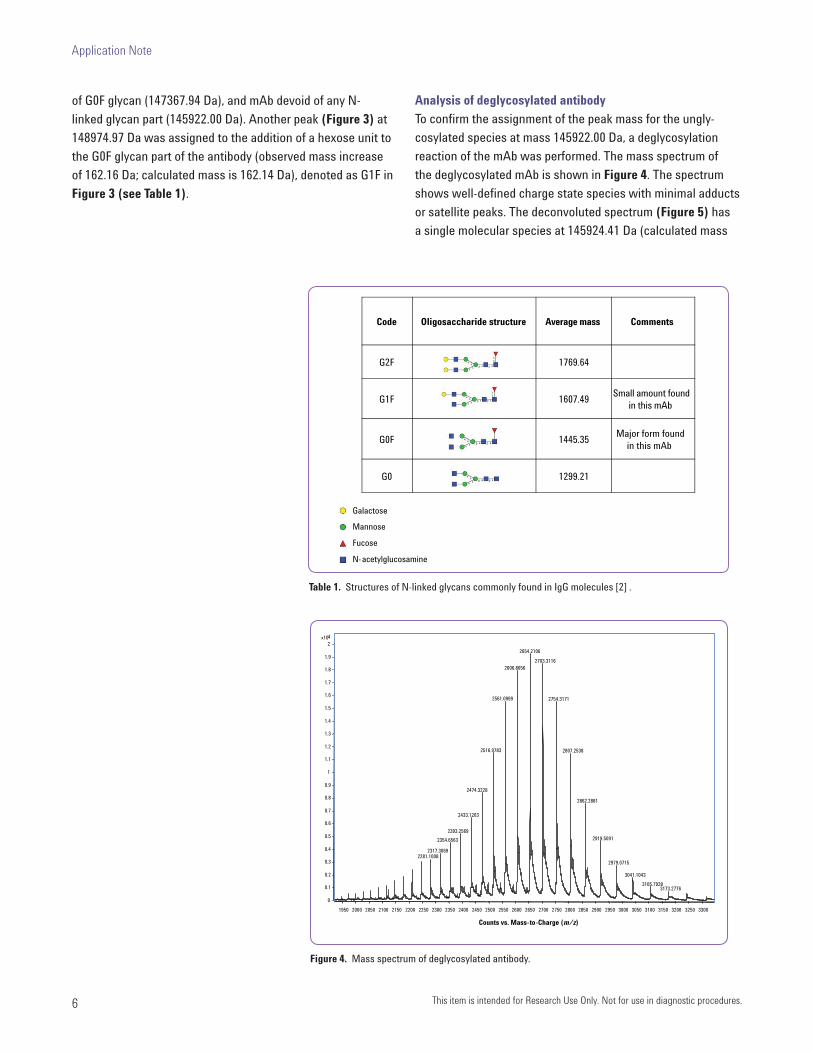
Analysis of deglycosylated antibody
To confi rm the assignment of the peak mass for the ungly-
cosylated species at mass 145922.00 Da, a deglycosylation
reaction of the mAb was performed. The mass spectrum of
the deglycosylated mAb is shown in Figure 4. The spectrum
shows well-defi ned charge state species with minimal adducts
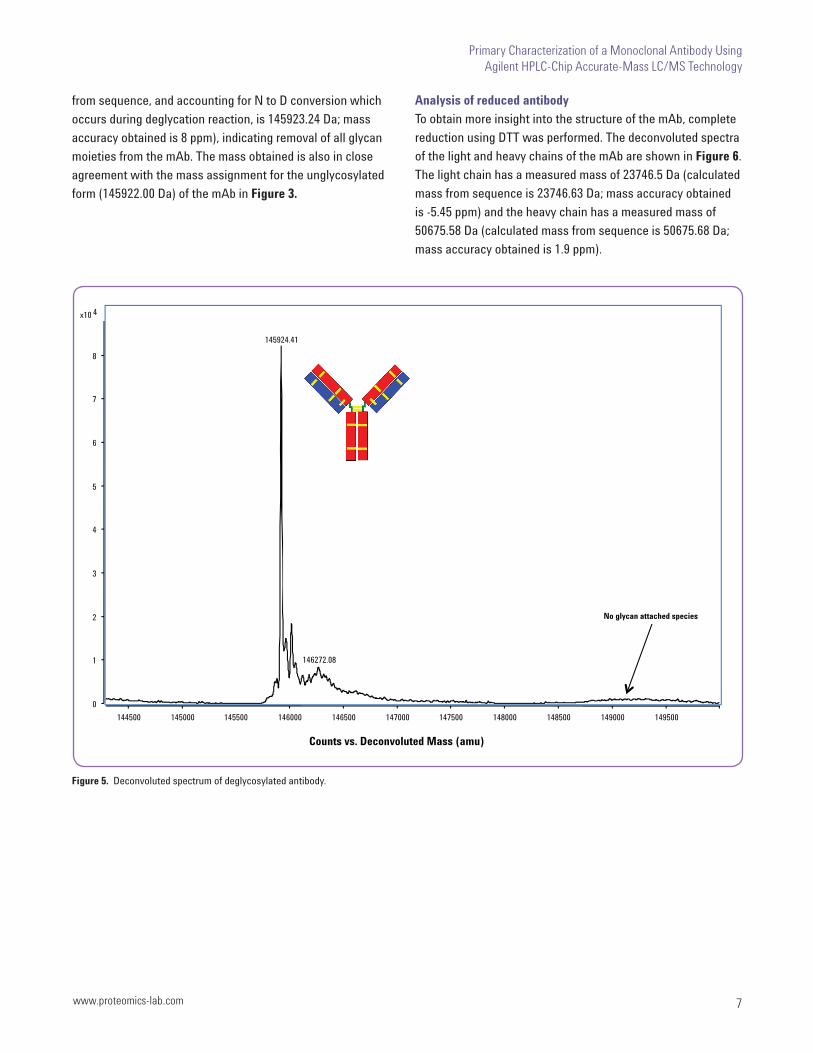
or satellite peaks. The deconvoluted spectrum (Figure 5) has
a single molecular species at 145924.41 Da (calculated mass
Table 1. Structures of N-linked glycans commonly found in IgG molecules [2] .
Code Oligosaccharide structure Average mass Comments
G2F 1769.64
G1F 1607.49Small amount found
in this mAb
G0F 1445.35Major form found
in this mAb
G0 1299.21
Galactose
Mannose
Fucose
N-acetylglucosamine
4 x10
0
0.1
0.2
0.3
0.4
0.5
0.6
0.7
0.8
0.9
1
1.1
1.2
1.3
1.4
1.5
1.6
1.7
1.8
1.9
2
2654.2106
2703.3116 2606.8056
2561.0999 2754.3171
2516.9783 2807.2538
2474.3228
2862.2881
2433.1203
2393.2569
2919.5091 2354.6563
2317.3069 2281.1008
2979.0715
3041.1043
3105.7939 3173.2776
Counts vs. Mass-to-Charge (m/z)
1950 2000 2050 2100 2150 2200 2250 2300 2350 2400 2450 2500 2550 2600 2650 2700 2750 2800 2850 2900 2950 3000 3050 3100 3150 3200 3250 3300
Figure 4. Mass spectrum of deglycosylated antibody.
www.proteomics-lab.com
Primary Characterization of a Monoclonal Antibody Using Agilent HPLC-Chip Accurate-Mass LC/MS Technology
7
from sequence, and accounting for N to D conversion which
occurs during deglycation reaction, is 145923.24 Da; mass
accuracy obtained is 8 ppm), indicating removal of all glycan
moieties from the mAb. The mass obtained is also in close
agreement with the mass assignment for the unglycosylated
form (145922.00 Da) of the mAb in Figure 3.
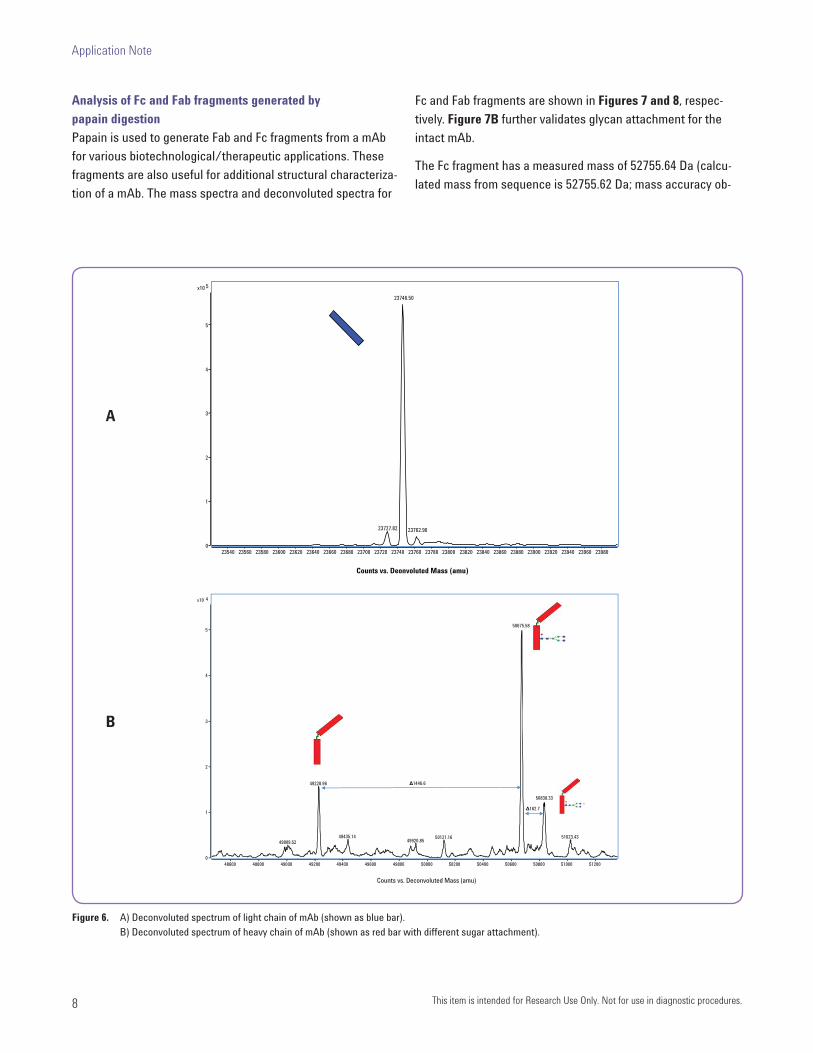
Analysis of reduced antibody
To obtain more insight into the structure of the mAb, complete
reduction using DTT was performed. The deconvoluted spectra
of the light and heavy chains of the mAb are shown in Figure 6.
The light chain has a measured mass of 23746.5 Da (calculated
mass from sequence is 23746.63 Da; mass accuracy obtained
is -5.45 ppm) and the heavy chain has a measured mass of
50675.58 Da (calculated mass from sequence is 50675.68 Da;
mass accuracy obtained is 1.9 ppm).
No glycan attached species
4 x10
0
1
2
3
4
5
6
7
8
145924.41
146272.08
Counts vs. Deconvoluted Mass (amu)
144500 145000 145500 146000 146500 147000 147500 148000 148500 149000 149500
Figure 5. Deconvoluted spectrum of deglycosylated antibody.
Application Note
8 This item is intended for Research Use Only. Not for use in diagnostic procedures.
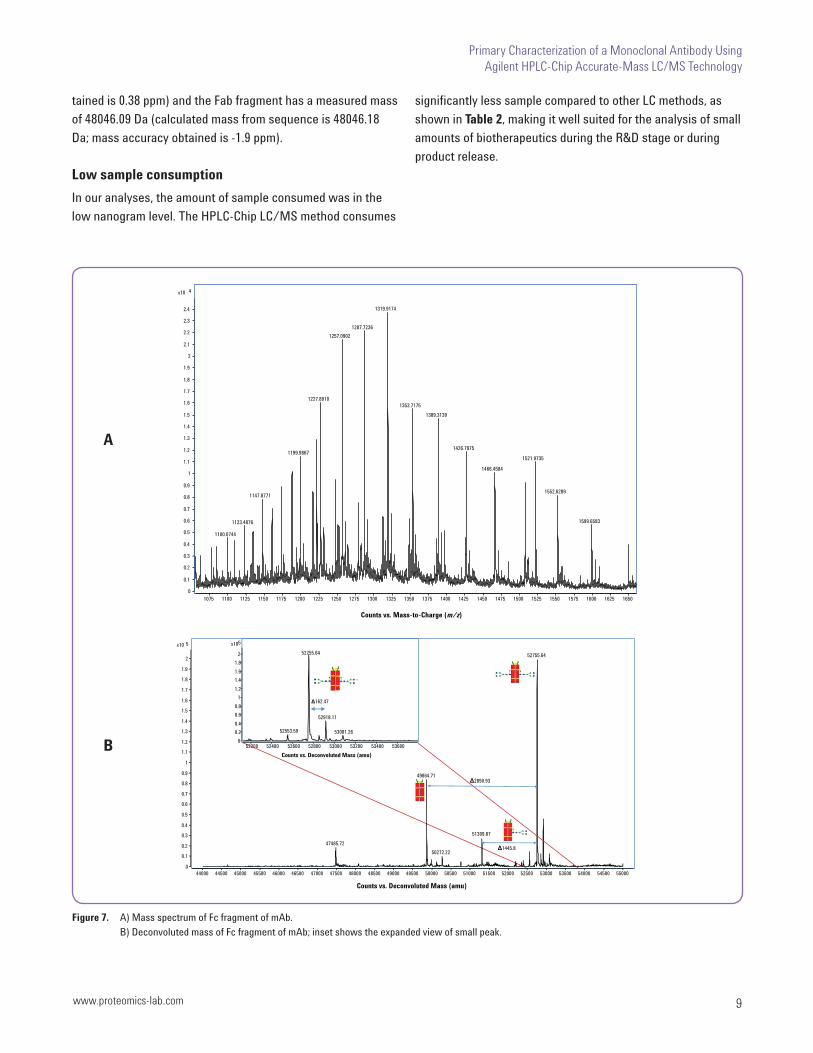
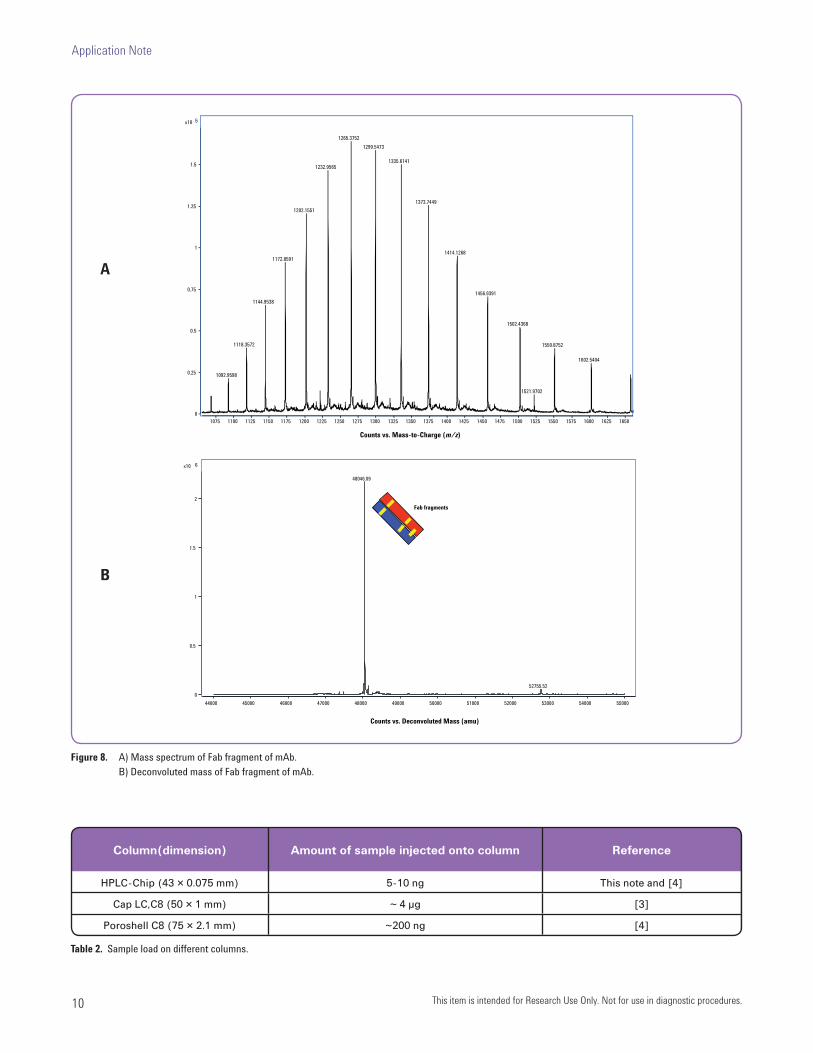
Analysis of Fc and Fab fragments generated by
papain digestion
Papain is used to generate Fab and Fc fragments from a mAb
for various biotechnological/therapeutic applications. These
fragments are also useful for additional structural characteriza-
tion of a mAb. The mass spectra and deconvoluted spectra for
Fc and Fab fragments are shown in Figures 7 and 8, respec-
tively. Figure 7B further validates glycan attachment for the
intact mAb.
The Fc fragment has a measured mass of 52755.64 Da (calcu-
lated mass from sequence is 52755.62 Da; mass accuracy ob-
Figure 6. A) Deconvoluted spectrum of light chain of mAb (shown as blue bar).
B) Deconvoluted spectrum of heavy chain of mAb (shown as red bar with different sugar attachment).
5 x10
0
1
2
3
4
5
23746.50
23727.82 23762.96
Counts vs. Deonvoluted Mass (amu)
23540 23560 23580 23600 23620 23640 23660 23680 23700 23720 23740 23760 23780 23800 23820 23840 23860 23880 23900 23920 23940 23960 23980
1446.6
162.7
4 x10
0
1
2
3
4
5 50675.58
49228.96
50838.33
49435.14 51023.43 50121.16 49920.85 49009.52
Counts vs. Deconvoluted Mass (amu)
48600 48800 49000 49200 49400 49600 49800 50000 50200 50400 50600 50800 51000 51200
A
B
www.proteomics-lab.com
Primary Characterization of a Monoclonal Antibody Using Agilent HPLC-Chip Accurate-Mass LC/MS Technology
9
tained is 0.38 ppm) and the Fab fragment has a measured mass
of 48046.09 Da (calculated mass from sequence is 48046.18
Da; mass accuracy obtained is -1.9 ppm).
Low sample consumption
In our analyses, the amount of sample consumed was in the
low nanogram level. The HPLC-Chip LC/MS method consumes
signifi cantly less sample compared to other LC methods, as
shown in Table 2, making it well suited for the analysis of small
amounts of biotherapeutics during the R&D stage or during
product release.
Figure 7. A) Mass spectrum of Fc fragment of mAb.
B) Deconvoluted mass of Fc fragment of mAb; inset shows the expanded view of small peak.
A
B
4 x10
0
0.1
0.2
0.3
0.4
0.5
0.6
0.7
0.8
0.9
1
1.1
1.2
1.3
1.4
1.5
1.6
1.7
1.8
1.9
2
2.1
2.2
2.3
2.4 1319.9174
1287.7236
1257.0902
1227.8910 1353.7175
1389.3139
1426.7975 1199.9867
1521.9735
1466.4584
1552.6289 1147.8771
1599.6583 1123.4876
1100.0744
Counts vs. Mass-to-Charge (m/z)
1075 1100 1125 1150 1175 1200 1225 1250 1275 1300 1325 1350 1375 1400 1425 1450 1475 1500 1525 1550 1575 1600 1625 1650
1445.8
2890.93
162.47
5 x10
0
0.1
0.2
0.3
0.4
0.5
0.6
0.7
0.8
0.9
1
1.1
1.2
1.3
1.4
1.5
1.6
1.7
1.8
1.9
2 52755.64
49864.71
51309.87
47485.72
50272.22
Counts vs. Deconvoluted Mass (amu)
44000 44500 45000 45500 46000 46500 47000 47500 48000 48500 49000 49500 50000 50500 51000 51500 52000 52500 53000 53500 54000 54500 55000
5 x10
0
0.2
0.4
0.6
0.8
1
1.2
1.4
1.6
1.8
2 52755.64
52918.11
52553.59 53081.26
Counts vs. Deconvoluted Mass (amu)
52400 52600 52800 53000 53200 53400 53600 52200
Application Note
10 This item is intended for Research Use Only. Not for use in diagnostic procedures.
Figure 8. A) Mass spectrum of Fab fragment of mAb.
B) Deconvoluted mass of Fab fragment of mAb.
Column(dimension) Amount of sample injected onto column Reference
HPLC-Chip (43 × 0.075 mm) 5-10 ng This note and [4]
Cap LC,C8 (50 × 1 mm) ~ 4 µg [3]
Poroshell C8 (75 × 2.1 mm) ~200 ng [4]
Table 2. Sample load on different columns.
5 x10
0
0.25
0.5
0.75
1
1.25
1.5
1265.3752
1299.5473
1335.6141 1232.9565
1373.7449
1202.1551
1414.1268 1172.8591
1456.9391
1144.9538
1502.4368
1118.3572 1550.8752
1602.5404
1092.9598
1521.9702
Counts vs. Mass-to-Charge (m/z)
1075 1100 1125 1150 1175 1200 1225 1250 1275 1300 1325 1350 1375 1400 1425 1450 1475 1500 1525 1550 1575 1600 1625 1650
Fab fragments
6 x10
0
0.5
1
1.5
2
48046.09
52755.52
Counts vs. Deconvoluted Mass (amu)
44000 45000 46000 47000 48000 49000 50000 51000 52000 53000 54000 55000
A
B
www.proteomics-lab.com
Primary Characterization of a Monoclonal Antibody Using Agilent HPLC-Chip Accurate-Mass LC/MS Technology
11
Conclusions
Rapid and sensitive characterization of an intact mAb and its
fragments at low nanogram levels has been demonstrated
using Agilent’s microfl uidic HPLC-Chip/MS system coupled to
the Agilent 6520 Accurate-Mass Q-TOF MS platform. The high
sensitivity and sub-10 ppm mass accuracy of the nanofl ow LC/
MS system enabled identifi cation of mAb heterogeneity, con-
fi rmation of mAb deglycosylation, and identifi cation of Fab and
Fc fragments. This approach is ideal for the routine analysis of
small amounts of expensive and valuable biopharmaceuticals.
References
1. www.drugresearcher.com.
2. Gadgil HS, Pipes GD, Dillon TM, Treuheit MJ, Bondarenko PV. J Am Soc Mass Spectrom. 2006 Jun; 17(6):867-72.
3. Gadgil HS, Bondarenko PV, Pipes GD, Dillon TM, Banks D, Abel J, Kleemann GR, Treuheit MJ. Anal Biochem. 2006 Aug; 355(2):165-74.
4. Dayin Lin and Hongbin Liu, Protein Society 2008 Poster 236, HPLC-Chip QTOF Analysis of MAb.
Application Note
Buy online:www.agilent.com/chem/store
Find an Agilent customer center in your country:www.agilent.com/chem/contactus
U.S. and Canada [email protected]
Asia Pacifi [email protected]
This item is intended for Research Use Only. Not for use in diagnostic procedures. Information, descriptions, and specifi cations in this publication are subject to change without notice.
Agilent Technologies shall not be liable for errors contained herein or for incidental or consequential damages in connection with the furnishing, performance, or use of this material.
© Agilent Technologies, Inc. 2008
Published in the U.S.A. December 16, 2008
5990-3445EN
About Agilent Technologies
Agilent Technologies is a leading supplier of life science research systems that enable scientists to understand complex biological processes, determine disease mechanisms, and speed drug discovery. Engineered for sensitivity, reproducibility, and workfl ow productivity, Agilent’s life science solutions include instrumentation, microfl uidics, software, microarrays, consumables, and services for genomics, proteomics, and metabolomics applications.