Embed Size (px)
Citation preview

PRICING OF POSTAL SERVICES IN INDIA
I;. ;- 'd~i?
L,' . .
NATIONAL INSTITUTE OF PUBLIC FINANCE AND POLICY

present study was commissioned by & &pert Committee on Exwllence in Postal
Rdinlstry of Comunka t ion~ m m g w n t of India in February 1988. The f-8 of @e terms of reference of the study was on auomg principles for determining the structwm of tariff foa':.l.rsuious swrvicos provided by the Indian Postal Department. I n several important respects postal services part&
'
of the character of a public utility, and their prfcw gives rise to htricate issues. Questions
[ of d&iency and equity come up in a complex way. The study addresses these issues anatyti- ally, erldng due note ofthe available literature on the bubject. .
T$G study provides certain analytical methods for fur- postal tariffs in India. F$n&, it cr i t idy evaluatesethe current pfactiees of fbring postal tariffs by the Indian Postal Dqatbnent. It then presents alternative stmiarbs of pricing with ill~stratfens using Indian. data. In particular, illustrations of c o ~ , $ i n g the f ~ s t best/cro~subsi~y-free
r prices and second best Rarnsey prices for postal rarv&S in India are provided. Finally, a &Wed review of methods of public utility pricing is attempted.
we. believe this is perhaps one of the first attempts to suggest ways of designing the
I
strumre of the postal tariff in the country on ratioad principles. We hope the study will be of intern# and use not only to policy-makers but alrw, t ~ , the wider academic community working iathhirerr. . .

PRICING OF POSTAL SERVICES
ININDU

PRICING OF POSTAL
SERVICES IN INDIA
Raghbendra Jha
M.N. Murty
Satya Paul
National Institute Of Public Finance And Policy
18/2 Satsang Vihar Marg, Special Institutional Area
New Delhi 110 067

PRICING OF POSTAL SERVICES IN INDIA
By Raghbendra Jha, M.N. Murty, Satya Paul
© 1990 National Institute of Public Finance and Policy
First published 1990
Published by National Institute of Public Finance and Policy, 18/2 Satsang Vihar Marg.Special Institutional Area. New Delhi 110 067. Printed by Comtext Print Services andLaser Typeset by Printo Craft. 1798. Giani Bazar, Koda Mubarakour. New Delhi 110 003Phone : 697536, 2206063.

Preface
The National Institute of Public Finance and Policy is an autono
mous non-profit organisation whose primary functions are to
undertake research, consultancy and training in the field of public
economics and related policy.
The present study was commissioned by the Expert Committee
on Excellence in Postal Services, Ministry of Communications,
Government of India in February 1988. The focus of the terms of
reference ofthe study was on evolving principles for determining
the structure of tariff for various services provided by the Indian
Postal Department. In several important respects postal services
partake of the character of a public utility, and their pricing gives
rise to intricate issues. Questions ofefficiency and equity come up
in a complex way. The study addresses these issues analytically,
taking due note ofthe available literature on the subject. We believe
this is perhaps one ofthe first attempts to suggest ways ofdesigning
the structure ofthe postal tariffin the country on rational principles.
We hope the study will be of interest and use not only to policy
makers but also to the wider academic community working in this
area.
The study was planned and conducted by Raghbendra Jha,
M.N. Murty and Satya Paul. The report was also drafted by the
three authors jointly.
The Governing Body of the Institute does not take any
responsibility for the views expressed in the report. That responsibility
lies with the Director and more particularly the authors.
AMARESHBAGCHI
Director

Acknowledgements
This is a report ofa project on Postal Finances and TariffPolicy in
India. We arc grateful to the Department of Posts, Government of
India for financial assistance. We also acknowledge with thanks the
comments of Amaresh Bagchi and participants in two seminars :
one at NIPFPand the other atthe Department ofPosts. A Sahoohas
given us some statistical assistance during the later stages of the
work while Shikhar Maan has provided excellent secretarial assistance
throughout this study. We express our sincere thanks to them.
Raghbendra Jha
M.N. Murty
Satya Paul

Contents
Page
Preface v
Acknowledgements VI
Chapter 1. An Introduction to the Setting of
Postal Tariffs
1. Introduction 12. Aggregate Issues 23. Micro Issues 44. Conclusion 8
2. A Critique of Current Practices for Fixing
Postal Tariffs in India
1. Introduction 92. Problems of Setting Postal Rates 93. Problems of Costing 104. Problems of Deficit *15. Problems of Capacity Expansion 12
6. Problems of Data 12
3. Summary and Recommendations
1. Introduction . *32. Pricing of Individual Postal Services 133. Deficits of Indian Postal Department 184. Financing of Indian Postal Department 18
5. Revision of Tariffs by IPD 196. Conclusions 20
4. Efficiency of Indian Postal Services
1. Concept of Efficiency and Data for its
Estimation 222. Estimates of Efficiency Index 32
3. Conclusions 34

5. Pricing Rules for Postal Services
1. Cross-Subsidy-Free/First Best Prices for
Postal Services 36
2. Distributional Equity and Prices for
Indian Postal Services 44
3. Conclusions 53
6. Block Pricing for Indian Postal Services
1. Introduction 55
2. Block Prices for Letter 56
3. Block Prices for Parcel Services 60
".. Block Prices for Money Orders 62
5. Conclusions 63
7. Approaches to Public Utility Pricing
1. Introduction 64
2. Subsidy-Free Prices 65
3. Computation of Subsidy-Free Prices 68
4. Cross-Subsidisation with Balanced Budget
for a Welfare Maximising Public Utility 74
5. Aumann-Shapley Prices for a Multi-Product
Public Utility and Price Subsidies from
General Revenue 76
6. Conclusions 79
Appendix I Appendix Tables 81
Appendix II Notes on Tables presented in the Report 91
References 97
1. An Introduction to the
Setting of Postal Tariffs
1. Introduction
The Post is one of the organic bases of social relations and
consequently, of civilisation. As an indispensable aid to the
development of industry and commerce and as the most important
agency for disseminating information among the people, it plays
a predominant part in the economic life of our nation. The Post
Office touches the lives of people more intimately than, perhaps,
any other government agency.
Given the vital importance of the Office, it follows that the
pricing of its services is a matter of serious concern. It also
follows that pricing is only one facet of the economics of post
offices. Quality and type of service, the ability to anticipate
demand for various categories of postal services, the ability to
absorb new technologies in the field of communication and
transport, and the capacity to adjust to these and other changes
and grow harmoniously are equally important indicators of the
economic health of the postal system.
These are all extremely important aspects of the economics
of postal services. Unfortunately, however, apart from some
studies, and colloquia reports sponsored by the Universal Postal
Union and a few other studies there does not exist much analytical/
empirical work on these problems. Far too often there has been
a tendency to study the problems of postal services within the
framework of the theory of public utility services. Even so, such
work for the Indian post office is almost non-existent
While the study of postal problems within the theory of

2 PRICING OF POSTAL SERVICES IN INDIA
public utilities has undoubtedly yielded some insights, most
practical observers of the postal system would feel that the
postal services have sufficient special characteristics to merit
independent treatment.
In this report we concentrate mainly on the problems of
pricing and related issues of postal services. We study trends in
costs and output, efficiency and pricing mechanisms of the
Indian Postal Department (IPD).1 Moreover, we offer suggestions
for improvements in the pricing structure by examining the
problems of cross-subsidy-free/first best prices and second best
prices for a public utility with revenue and equity objectives.
Issues relating to demand are taken up within the context of
second best Ramsey pricing. An eclectic view of pricing of
postal services as a part of general revenue policies of the
government is taken in a new approach outlined in this paper.
We also offer some ideas on how to improve the data base of the
Indian post office so that meaningful research can be carried on
on a sustained basis.
In the present chapter we attempt a review of some of the
principles of postal tariff fixing that have been discussed in the
literature. The emphasis here is on a survey of issues involved
and no attempt is made, in particular, to assess the performance
of these principles in different contexts.
Broadly speaking, the problem of postal tariff fixing has
been considered at two levels. First, there is what we shall call
the aggregate or sectoral concern. Second is the more micro
concern about pricing of individual items of the postal services
and the relationship between such prices. We will discuss each
of these issues in turn.
2. Aggregate Issues
The principal concern here seems to be whether the post
office can "legitimately" earn a return over its cost. It is realised
1. Henceforth in this text, IPD.
SETTING OF POSTAL TARIFFS 3
that in most instances the post office has a virtual monopoly
over its services. It is possible, therefore, to have a tariff structure
that will yield positive profits. The counter argument to this is
that postal services are an indispensable tool of mass
communication so that benefits from them are typically
underestimated. A tariff structure that seeks to earn monopoly
profits may stifle demand and thus have adverse effects particularly
in a developing country like India. At colloquia organised by the
Universal Postal Union, representatives of many countries have
argued against the post office earning substantial profits. However,
increasingly it is being realised that uncritical acceptance of
large subsidies to the post office is also unjustified.
Enlightened post office administrators all over the world
favour a postal tariff structure that yields "adequate" revenue
and ensures maximum possible traffic. To some extent these
goals are conflicting and there does not seem to be a well
defined consensus on how to resolve this conflict In appraising
it, however, the following factors should be kept in mind.
If the postal department is, by virtue of the spread of mass
communication argument, running large losses, these losses must
be adequately justified. The policy maker/budget planner should
be convinced that the public funds committed to covering the
losses are being made good use of.
Secondly, the spread ofmass communication argument should
not be allowed to become a cover for inefficiency of the postal
system. Unfortunately this has probably tended to happen in the
Indian case. However, the nature of the technology of the postal
services is such that because ofjoint production there are substantial
economies of scale so that the inefficiency observed in the postal
department is of the nature of scale inefficiency. This problem
is examined in detail in our discussion of inefficiency in the
Indian postal system in Chapter 3.
A general subsidy to the postal services ought to be sharply
distinguished from cross-subsidisation within the postal services.

4 PRICING OF POSTAL SERVICES IN INDIA
Whereas the former can be justified to some extent in terms of
some of the arguments advanced above, it is, as has been argued
repeatedly in this report, hard to justify the latter. A wrong
pricing structure within the postal services might lead to a
misallocation of resources within the postal services and lead to
larger losses in the aggregate.
There is a popular fallacy that low postal rates (and hence
large postal losses) are beneficial in that they facilitate economic
development, while raising them to a level which will cover the
real cost of the service, including depreciation and replacement
of equipment, is inflationary. It is possible, however, that low
rates by distorting demand and upsetting the balance between
productivity and the real value of the service to the user, might
actually fuel inflation. Similarly, one has to evaluate the inflationary
impact of the subsidy given to the post office. The subsidies to
postal services may result in a rise in the prices of some other
commodities if such subsidies are financed by either increasing
commodity taxes or deficit financing. One must also remember
that the resulting inflation would penalise non-users as well,
hence there would be some kind of inequity built into this.
3. Micro Issues
Under this heading our principal concern is with the structure
of prices and costs within the postal department
Many commentators have observed that costing techniques
need to be improved. For instance, there might be too much
emphasis on estimated cost functions for calculating prices whereas,
in reality it might be difficult to ascribe costs unambiguously. In
other words, allocating costs among the various items of the
postal service by estimating a cost function might be restrictive.
Several commentators have, therefore, suggested independent
methods of allocating costs. For instance, the British administrators
conducted periodic sampling to find out the allocation of overall
staff hours among various items of the postal services. These
percentages were then applied to the relevant salary bill. Similar

SETIMNG OF POSTAL TARIFFS 5
conventions were applied to vworking areas and vehicles, and in
this wiy the costs were allocated- However, this example showed
clearly that in a certain sense such information was not very
useful because it could be demonstrated that eliminating one of
those services had an insignificant effect on overall costs. All
that was achieved was the elimination of a source of revenue
without achieving a cut in expenditure proportional to that
reduction in revenue. In an attempt to get out of this difficulty,
a number of experiments were carried out; studies on the longer
term evaluation ofmarginal costs were conducted throughout the
UK with very detailed analysis of the work related to traffic
levels and flows. A study was commissioned to produce a
common classification for both variable and fixed costs. The
results were not very encouraging and such detailed sampling
techniques have been given tip.
Given the agnosticism with respect to both econometric cost
function estimation and detailed sampling, many observers have
favoured the use of simple pricing techniques like marginal cost
pricing or variable cost pricing. Nonetheless, over the years
these econometric estimation techniques and sampling methods
have led to the development of a suitable data base and better
understanding of the cost structure of postal services. In India,
however, considerable work needs to be done along these lines.
Our approach to pricing has been threefold. We have first
reviewed pricing within the post office as a Pareto-optimizing
exercise. Cross-subsidy-free prices have been estimated. The
argument here is simply that unless each constituent service of
the post office does at least as well as it would in a coalition of
any smaller size it must be functioning inefficiently in the
Paretean sense.
Another approach extends this idea to some extent. It is
argued that there is a fundamental difference between cross-
subsidy-free prices in the traditional sense and pricing in the
postal services. Whereas efficiency within the postal service
demands that cross-subsidy-free prices be used for accounting
6 PRICING OF POSTAL SERVICES IN INDIA
purposes, our concern for mass information may require that
consumers pay lower prices for some items and higher prices for
some others. In this case we recommend that while cross-subsidy-
free prices be used within the post office, the final consumer
prices can be different and these differences can be looked upon
as ordinary indirect taxes/subsidies. This is the so-called eclectic
approach which we have discussed at length in Chapter 4.
Yet another approach to postal pricing that has been much
discussed in the literature and also in this report is the so-called
second best Ramsey pricing. Here there is a specific admission
that Pareto-efficient pricing is being given up and one is functioning
in the realm of second best Standard second best formulae
relating pricing of different products to their respective price
elasticities of demand and redistributive objectives of government
have been derived and used in several countries.
However, there are some problems with applying this approach
in a simple manner. For instance, in Canada it has been discovered
that there is a strong correlation between the size of customer
and his sensitivity to prices. High-Volume users often have
considerable resources and, therefore, may opt for alternative
means for the conveyance of information. Their demand is often
quite price elastic. In Canada, and several other countries, the
post office implemented quantity dependent prices. Such a policy
does, of course, sound discriminatory but the counter-arguments
that have often been put forward are: (i) This discrimination
would help maintain a high level of traffic and optimise revenue.
This was in the best interest of all. (ii) Since the provision of
postal services invariably involves economies of scale, large-
volume users effect some savings for the post office. It would be
fair, it is argued, to return some of these savings.
Furthermore, demand for postal services is also sensitive to
several other variables. In Germany it has been discovered that
general economic trends, seasonal variations and dates of elections
significantly influence demand. In India one could safely add the
timing of the marriage season to this list

SETTING OF POSTAL TARIFFS 7
Another problem with accurately estimating demand for
postal services is that postal tariff rates change only infrequently.
In Germany, for instance, postal prices are often termed political
prices. In India, too, postal prices particularly of those items that
are used in large measure by the less affluent sections of society,
are difficult to increase because such increases, it is feared, may
adversely affect the fortunes of the political party in power.
This kind of constraint has led to some discussion about the
composition of the authority that regulates postal tariffs. In
several countries the idea of setting up an independent authority
to fix postal rates in the light of the public interest has been put
forward. But even in such countries the constitution and rules of
such an authority are governed by the appropriate legislative
bodies. Some countries require these authorities to hold public
hearings before postal rates are changed.
In India, however, no such authority exists and postal prices
have remained "political prices" for long periods of time. There
is certainly some need here to move in the direction of creating
an authority that could oversee postal tariffs and costs in a more
objective manner.
One must also realise that the setting of postal tariffs is only
one aspect of the overall price and cost problems of the post
office. Equally important problems are, among others, the
absorption of new technology and the corresponding adjustment
of prices and costs; and the forecasting of demand of existing
and new (yet unknown) postal services.
To some extent the post office merely reacts to these changes.
If trains run at greater speed the post gets delivered sooner.
However, particularly in the area of designing new products and
effecting improvements in office management technology, the
post office has a responsibility. If the post is to compete successfully
with newer means of communication, it has to, perhaps, be
committed to serious and ongoing market research. In India we
have been lagging behind in this respect. The post office could

8 PRICING OF POSTAL SERVICES IN INDIA
easily have anticipated the boom in the courier service business
much earlier, for instance.
The identification of new sources of demand can of course
give some flexibility to the post office in setting rates. So can
finer segmentation of Hhe existing post Thus, for instance, it
may be possible to disciiiminate between ordinary book post and
greetings cards and a higher tariff may safely be applied to the
latter.
In these and other areas much work needs to be done in
India. Unfortunately, the data base for analysing the performance
of the postal services is quite poor and subject to wide margins
of error. In this regard there is considerable work to be done. It
is beyond the scope of the present report to comment on the
structure of the data to be compiled and, indeed, for which a
proper infrastructure still remains to be built.
4. Conclusion
In this introduction to our report, we have discussed some of
the considerations that have figured prominently in the academic
and organisational literature on postal tariffs. It has been emphasised
that both with regard to the pricing of individual items and the
overall deficit/surplus position of the postal budget, there are a
number of opinions. We have attempted an evaluation of some
of these arguments and found that it is hard, a priori, to
unambiguously favour one approach or the other. As a matter of
fact, we have found that post offices in many countries have
used different arguments.

2. A Critique of Current Practices
for Fixing Postal Tariffs
in India
1. Introduction
In this chapter we try to highlight some of the weaknesses of the
current practices for fixing postal tariffs in India. Such weaknesses
may be broadly classified under five headings:
(i) Problems of setting postal rates
(ii) Problems of costing
(iii) Problems of evaluating and justifying postal deficits
(iv) Problems of capacity expansion
(v) Problems with data
2. Problems of Setting Postal Rates
The pricing strategy followed by IPD can be described as
one involving cross-subsidisation and an overall budgetary deficit.
We must first point out that the extent of cross-subsidisation
actually involved is different from the IPD's measure of cross-
subsidisation for the following reasons:
(a) The IPD follows, in our view, an inappropriate method
of allocating joint costs and
(b) there is a difference between the economic cost and the
cost adopted by IPD.
The principles followed by the postal departments in the

10 PRICING OF POSTAL SERVICES IN INDIA
advanced countries to fix the postal tariffs cannot be replicated
unconditionally in a developing country like India. Full cost
prices with the balanced budget that are mostly adopted by the
developed countries may not be appropriate for India since the
postal services are the only means of communication available
to poor people separated by long distances geographically.
Therefore, social objectives like the rapid dissemination of
information and the income distribution in the country can also
be the basis for fixing the postal tariffs in India apart from the
cost effectiveness. In this context, the pricing schemes involving
either cross-subsidisation with the balanced budget for BPD or
price subsidies to certain postal services with the budgetary
deficits of IPD financed from the general revenue become relevant
options for fixing the postal tariffs in India. The current practice
of financing the deficits of IPD from the general revenues
of the government may be legitimised, if the deficits are shown
to be the result of price subsidies to meet the social objectives.
This may be achieved if the annual budget of IPD is prepared
and presented to Parliament as the railway budget is
presented.
The current method of pricing followed by IPD (cross-
subsidisation with budgetary deficits) is arbitrary because subsidies
for certain services and mark-ups for the other services are fixed
without careful economic evaluation. The present report puts
forward four pricing strategies that could be followed and discusses
their welfare properties.
3. Problems of Costing
An additional problem is the evaluation of costs. Since the
IPD is a multi-product firm a significant portion of the costs are
joint. Broadly speaking, the IPD distinguishes three categories
of costs, viz., (i) directly attributable costs, (ii) indirectly attributable
costs and, (iii) joint or non-attributable costs. The IPD allocates
joint costs by the criterion of relative volume. But, as argued in
Chapter 7, this method is arbitrary and does not yield efficient
cost-based prices for the postal services. The literature on the

FIXING POSTAL TARIFFS n
problem of public utility pricing suggests that it is better to
allocate joint costs by the method of attributable cost. Indeed,
this is the principle adopted in this report. As argued in Chapter
7, this method ensures efficient cost-based prices for certain
types of cost functions. The key to the implementation of this
method is the proper identification and measurement of attributablecosts for various postal services.
One can find fault with the IPD's treatment of cost of capital
as well as its treatment of depreciation. In this report we have
tried to circumvent these difficulties in a manner that is consistent
with sound empirical practice. The methodology adopted for
costing is made explicit in this report and it is to be hoped that
IPD would, broadly, follow the same approach.
4. Problems of Deficit
As has been discussed, the pricing and costing practices
followed by IPD are such that it is hard to justify the deficit
in welfare theoretic terms. The deficits of the IPD have to
be evaluated along with surplus/deficits of other government
departments if we are to ensure the best use of public funds.
However, although an exercise involving the evaluation of
the overall budgetary policies of the government is outside the
scope of the present report, we must ensure that deficits of the
IPD are the outcome of efficient costing methods and a
pricing strategy that has a sound rationale in welfare theoreticterms.
As argued above, this is difficult to ensure with the essentially
ad hoc pricing and costing practices adopted by IPD. On the
operational side, since it has been possible for IPD to obtain
funds at almost any time, it could be the case that IPD deficits
have become harder to control in addition to being impossible
to rationalise.
With the approaches followed in this report, no such
arbitrariness in the treatment of deficits is possible.

12 PRICING OF POSTAL SERVICES IN INDIA
5. Problems of Capacity Expansion
The supplies of various services by IPD are demand
constrained. The data on output and cost of IPD during the
period 1950-51 to 1982-83 show that IPD has planned its expansion
in disregard of the demand for its services. The increased expansion
of capacity coupled with the economies of scale ofjoint production
has contributed to the presence of excess capacity in the IPD.
Therefore, matching of capacity expansion with the growth of
demand for its services should be an important consideration for
the planned development of IPD in the future.
6. Problems with Data
The data presented by IPD leave much to be desired. For
instance, if one examines the traffic demand figures one realises
that for unregistered traffic the demand is highly exaggerated.
Moreover, different statements prepared by IPD (e.g., Annual
Reports and Statistical Digests of IPD) give widely divergent
estimates of traffic demand for the same year.
The IPD aims at setting prices to effect some redistribution
of income in society. However, whether this has happened, or
indeed, is possible can be discovered only after a thorough
investigation of the demand for postal items by different income
categories. But the data for such an investigation are simply non
existent. These data can be collected by IPD on an annual basis
for a representative sample of households in the Indian economy.
The IPD should make all efforts to develop a sound data base
and collect these data.

3. Summary and Recommendations
1. Introduction
In formulating the principles of postal tariff policy two issues
are of prime concern. These are (i) the basis for pricing of
various postal services; (ii) an economic evaluation of the claim
of the IPD on the general revenues of the government. In this
chapter we present a summary of our recommendations and
analysis of these issues and recommendations based on the
results of the analysis. Additionally we comment on some aspects
of the financing of the IPD.
2. Pricing of Individual Postal-Services
At the broadest level there are three possible approaches to
the pricing of individual postal services. These are: (i) "political"
rates, (ii) commercial rates, and (iii) economic rates. Postal
pricing in India seems to have been based on an amalgam of all
three approaches, but not in any rational manner. The principle
behind the political rates appears to be that prices of postal
services have an important social function and, therefore, social/
political considerations prevail over others in their determination.
Typically, then, the problem of costing postal services would not.
be of much relevance in their pricing.
Commercial rates tend to exploit, for profit, the position of
the post office as a monopoly supplier of postal services.
Correspondingly, costing is a relevant consideration although
the objective of the postal department in this case is, explicitly,

14 PRICING OF POSTAL SERVICES IN INDIA
to earn a positive return over cost and not necessarily maximising
it.
Postal services being in the nature of a public utility constituting
a basic infrastructure for development, its pricing purely on
commercial principles might not maximise social welfare. At the
same time, prices unrelated to costs or at least a clear accounting
to costs often leads to waste and inefficient use of scarce resources.
Also, pricing on political considerations alone without any regard
for costs may confer unduly large benefits on sections who do
not deserve it and place the burden on weaker sections. Hence
the need for basing the prices of postal services on economic
principles, whereby the services provided by post offices do not
lead to waste and inefficiency and at the same time the objectives
of social justice are also taken duly and explicitly into account
In this report we purport to concentrate exclusively on
economic rates. In designing these economic rates some well
defined norms of social welfare are invoked. The theoretical
basis for such norms are discussed at some length in Chapter 7
of this report.
We provide a set of four approaches to the economic pricing
of postal services. These are :
i. First bestlcross-subsidy-free prices with a balanced budget
for the postal department.
With this method prices of individual postal services reflect
fully allocated costs. Correspondingly the budget of the postal
department is exactly balanced.
The basic rationale behind this approach is that the pricing
structure should be such that each constituent service of the IPD
must earn at least as much as it would as a separate service or
constituent of any smaller group of services. If this (potential)
alternative is visualised as competitive supply, then it would
follow that the postal department would be supplying its services
in the most efficient manner.

SUMMARY AND RECOMMENDATIONS 15
ii. Two-tier pricing with cross-subsidy-free prices and an
overall subsidy-the eclectic approach.
Cross-subsidy-free prices, although efficient, might involve
"high" prices for several items. In the case of IPD a perusal of
Table 5.6 of Chapter 5 will readily indicate this to be the case.
Such prices, it may be argued, conflict with some other
objectives ofthe government, e.g., caring for the poor (redistribution
of incomes) or widest dissemination of information through the
use of postal services. If, for instance, it is felt that the full cost
prices of items used in relatively large amounts by the less well-
off sections of society are too high, there might be a case for
subsidising some of these items.
The approach taken in this report to tackle this problem is
the following: For purposes of internal accounting within the
IPD, cross-subsidy-free prices are used. This ensures efficiency
within the postal department itself. For purposes of fixing the
consumer prices however the government is free to levy tax/
subsidy on these first best accounting prices. That is to say, the
equity objectives are taken care of by transfers from the general
budget. This 'eclectic* approach then combines efficiency within
the postal department with the redistributive objectives of the
government Under certain circumstances this approach has some
desirable welfare properties.
iii. Second best prices.
If (competitive) efficiency is not the sole consideration, then
there can be at least two reasons why prices of postal services
can be different from cross-subsidy-free prices: (a) The IPD may
not be a monopoly or a competitor in all markets and (b) the
government may have specific redistributive objectives.
In such cases it might become necessary to compute second
best prices for postal services. This computation involves a clear
enunciation of government's welfare function that takes into
account the governmental objectives like equity and resource

16 PRICING OF POSTAL SERVICES IN INDIA
mobilisation. This welfare function is maximised with respect to
postal prices and this maximisation is subject to an overall
budgetary constraint of the govemmenL Since this maximisation
is subject to the budget constraint, the resulting postal prices are
second best optimal. We would typically expect them to involve
lower prices for distributionally significant items such as letter
cards and post cards and higher prices for less significant items
such as registered letters in comparison to first best prices. In
Table 5.17 (Chapter 5) we provide detailed estimates of second
best optimal prices on the assumption of certain weightage
pattern for services based on considerations like distributive
justice.
• In Chapter 6 we recommend dual prices for certain postal
services from the point of view of balanced regional development
and regional income distribution. In particular, we recommend
concessional prices for demands for postal services originating
from less developed regions in the country. We believe that this
dual pricing scheme is practicable and can be implemented
without additional financial burden on IPD.
iv. Cross-subsidisation with overall budgetary deficit
This approach is currently being practised by IPD. In Table
5.10 of Chapter 5 we present estimates of cross-subsidisation of
major services provided by the IPD. In Table 5.11 of Chapter 5
the corresponding budgetary deficits are reported.
This method does not have any welfare optimality properties
unless it can be demonstrated that the existing subsidies and the
budgetary deficit are derived from a specific welfare maximisation
exercise, e.g., the second best approach outlined above. In any
event, all pricing strategies that prescribe cross-subsidisation
involve the risk that successful competitive services may eventually
be provided by private agencies.
Our purpose in describing the four approaches to pricing is
to clearly articulate the possibilities available to the IPD. For
obvious reasons we single out first best and second best pricing

SUMMARY AND RECOMMENDATIONS 17
strategies for exhaustive discussion in this report. So far as the
eclectic approach is concerned, taxes/subsidies on individual
postal services have to be set as part of the overall budgetary
policies of the government In other words, taxes/subsidies on
individual postal services have to be evaluated along with the
taxes/subsidies on commodities in general. Since redistributive
concerns form the raison d etre, for a departure from first best
pricing in the eclectic approach, a broad principle of such departure
could be to subsidise those services that are used in disproportio
nately large measure by the poor and tax those that are used
relatively more by the more affluent sections of society.
As we had remarked earlier, cross-subsidisation with a
budgetary deficit for EPD has no claim to welfare optimality
unless it can be demonstrated that this approach corresponds to,
say, second best pricing. Hence we realise that first best or
second best pricing rules are me bases that any sound pricing
strategy must adopt Correspondingly, in this study we undertake
an exhaustive study of first and second best pricing rules.
Average price computations under these two regimes are
reported in Table 5.6 (Chapter 5) for first best prices (for the
years 1981-82 to 1985-86). There is some reason to believe that
price schedules for some postal services must be such that
marginal prices may differ from average prices. This may be
because government may want to discriminate among categories
of buyers by their quantum of purchases for redistributive reasons.
Additionally, it could be argued that typically larger volume
users display greater elasticity of demand than smaller volume
users. Since larger volume users help the IPD to exploit economies
of scale, it would only be fair to return to such users some of the
savings they help attain. In Tables 6.18 to 6.21 (Chapter 6) we
report marginal prices computed as per the declining block
scheme that are consistent with the average prices reported in
Chapter 5.
These calculations summarise our recommendations with
respect to the pricing of individual services supplied by the IPD.

io PRICING OF POSTAL SERVICES IN INDIA
3. Deficits of the IPD
A virtue of economic pricing is that pricing policies and
deficits have to be analysed jointly. In the eclectic approach,
deficit that results must be justified because taxes/subsidies on
individual postal services are evaluated along with taxes/subsidies
in general. In the second best approach, revenues from postal
services are evaluated against revenues from other sources, e.g.,
indirect taxes. Hence it is no longer necessary to think of the
deficits of the IPD as the excess of expenditure over receipts.
However, in the case of the pricing policy that is actually
practised, viz., cross-subsidisation with overall deficit, the deficit
is essentially the residual. Further, in the case of the IPD, there
is some inconsistency in the data because the sum of the deficits/
surpluses on individual postal services does not add up to the
overall deicit of the IPD. The estimates of deficit as reported in
Table 5.11 of Chapter 5 are derived from the Appropriation
Accounts. Our estimates of deficit are different from those of the
IPD because our notion of cost is economic cost which must
include cost on account of all factors of production, e.g., labour,
capital and materials, whereas in the case of the IPD only
accounting costs are considered.
In any event it is not possible to justify this deficit in terms
of any welfare calculus unless it can be demonstrated that the
pricing structure is derived from, say, a second best optimisation
exercise. Our exercises suggest that the pricing practised by IPD
does not follow any rational principle and is the outcome of ad
hoc decisions made over the years without any attempt to take
an overall look or rationalise the structure. As a result one
notices an overall deficit subsidised by the general budget along
with surpluses derived from services v/Ynchprimafacie are usedmainly by the Department
4. Financing of the IPD
In its 1968 Report to the Administrative Reforms Commission,
the Working Group on Post and Telegraphs had emphasised that

SUMMARY AND RECOMMENDATIONS 19
the P & T Department should present its own budget to Parliament.
It had further recommended that (the then) P & T department
should be made accountable for its revenue and expenditure. The
present practice in IPD seems to be that although this department
does maintain separate accounts it can potentially draw upon the
general revenues of the government at almost any time. Many
observers have expressed the view that such latitude is inimical
to financial accountability.
Short of making the IPD an independent corporation, it is
possible to increase its financial accountability by making it
possible for the IPD to draw, ordinarily, only from a revolving
fund. The government can help set up the fund and all surpluses
of the IPD can be credited to it It is felt in some quarters that
this practice might restrain IPD claims on the general exchequer.
The idea of a revolving fund merits attention from financial
analysts and accountants. As economists we can say that creation
of such a fund does not obviate the necessity of a sound and
rational price policy. Year-to-year deficits will still have to be
justified.
5. Revision of Tariffs by IPD
The frequency with which IPD may revise its tariffs is an
important issue. There is an argument that postal prices should
not be changed very frequently. It is contended that stable postal
prices help in lowering inflationary expectations. Further, since
certain items of the post are used predominantly by the poorer
sections of society, frequent hikes in postal rates may be
regressive.
However, we find the counter-arguments more tenable. Postal
tariffs should not remain out of line with postal costs for too
long. This is particularly important in the case of the eclectic
approach where taxes/subsidies on individual postal items have
to be evaluated against taxes/subsidies on other items in the
general budget of the government Moreover, the social cost of

20 PRICING OF POSTAL SERVICES IN INDIA
the deficits of the IPD have to be evaluated as part of the overall
policies of the government. Furthermore, frequent revisions of
tariffs of IPD need not mean that the tariff structure would
become regressive. This is because it is always possible to
subsidise items that are largely used by the poorer sections and
tax those that are used by the richer sections of society.
We, therefore, recommend that IPD may revise its tariffs
annually by following any one of these procedures:
(a) Using the method described in Section 1 of Chapter 5 the
estimation of full cost prices for postal services may be
attempted by IPD every year, taking into account changes in
the prices of labour, capital and material inputs. Adopting
full cost prices as base prices, subsidies for some services
and mark-ups for the other services may be fixed so that IPD
balances its budget and realises its various social objectives.
This results in the cross-subsidisation with balanced budget
for IPD as described in detail in Section 2 of Chapter 5 and
Section 4 of Chapter 6.
(b) Alternatively, IPD may set the prices for its services by
preparing and presenting an annual budget to Parliament as
its sister department, Railways, does in India. The preparation
and presentation of annual budget by IPD will provide it
autonomy to fix prices for its services and also facilitate
public scrutiny and debate over its policies. In this process,
the budgetary deficits created by the pricing policies of IPD
to achieve various social objectives will have prior approval
of Parliament and the public. This procedure is akin to the
eclectic approach described in Section 5 of Chapter 7 for the
postal budget, like the budget of Railways, will be very
much part of the annual budget of the Union Government
6. Conclusions
In this chapter we have briefly commented on the approach
to postal tariffs that is adopted in this report We have also

SUMMARY AND RECOMMENDATIONS 21
commented briefly on IPD's deficits as well as on a suggestion
for improving the financial accountability of IPD.
The plan of the rest of the report is as follows. In Chapter
4 we define an index of productivity of IPD and trace its
development over the period 1950-51 to 1983-84. In Chapter 5
we compute average first best and second best (with balanced
budget) prices for IPD for a few representative years. In Chapter
6 we present our estimates of marginal (declining block) prices
under these two regimes. Chapter 7 details various approaches to
public utility pricing and discusses the theoretical rationale for
adopting the four pricing strategies detailed in the chapter.

4. Efficiency of Indian
Postal Services
1. The Concept of Efficiency and Data for its Estimation
A commonly held belief is that the Indian Postal Department(IPD) has been operating inefficiently. In this chapter, we try to
comment on this popularly held belief by making estimates of
productivity of real resources used in the Postal Departmentduring the period 1950-51 to 1983-84.
The IPD supplies a large number of services jointly comprisingunregistered and registered mail items, and services likepostal insurance, savings banks accounts and savings certificates.Suppose we have an estimate of the supply of various servicesby the postal department in a given year in homogeneous units;such as, post card equivalents. Given also an estimate of resourcecost of IPD expressed, say, in rupees in a given year, we may
obtain an estimate of productivity of a rupee spent in thepostal department in that year. By comparing the productivity
estimates so made for different years, we may be in a positionto comment on productivity changes in IPD over a longer periodof time.
The estimation of output of IPD in post card equivalentunits requires data on the quantities of various services offeredand their prices. For example, if postal services are supplied
in the free market and market prices represent revealedpreferences of users of these services, the post card equivalentunits of postal services supplied can be estimated by takingpost card as numeraire. But the postal services in India as

EFFICIENCY OF INDIAN POSTAL SERVICES 23
well as in many other countries are supplied by public utilities
at regulated prices. If the regulated prices are any guide to
revealed preferences of society for postal services, the post card
equivalent units of supply of these services can be estimated by
again taking post card as numeraire.
We have obtained from IPD data on the regulated prices
for the various postal services in India during the period
1854-1987. A close look at this data shows that most of these
prices have been changing quite infrequently. Table A.I in
the Appendix provides detailed data on traffic demands
for various postal services in India during the period 1950-51
to 1983-84. The traffic demands data for the registered postal
items give the actual demands while the traffic demand for
unregistered postal items are the estimates. Given the highly
exaggerated data about the traffic demands for unregistered mail
which are obtained by a periodic enumeration of a selected
number of post offices in the country, IPD has attempted to
make realistic estimates of unregistered traffic by using the data
on the actual revenue collected from various unregistered mail
items.1 Given these data, we may be in a position to estimate the
supply of postal services in post card equivalent units during the
period under study: 1950-51 to 1983-84. Since these estimates
depend upon the structure of societal preferences as reflected in
the regulated prices of postal services and regulated prices have
been changing over time, they may not be comparable over time.
However, if we rely on the estimates of productivity per rupee
to comment on the efficiency of IPD during 1950-51 to 1983-
84 we will need estimates of the supply of postal services in
comparable units over time.
One method of arriving at comparable estimates over time
for the supply of postal services is to have societal preferences
1. The actual revenue collected from the unregistered mail items constitutes
approximately 35 per cent of revenue estimated from these items, using data
from enumeration during the years 1980-81 to 1985-86.

24 PRICING OF POSTAL SERVICES IN INDIA
for postal services (revealed through regulated prices) during
a particular year as standards. Adopting, say, the regulated
prices of the year 1950-51 as standards, and given the estimates
of traffic demands for various services for all the years
during 1950-51 to 1983-84, we may obtain comparable
estimates of supply of postal services in post card equivalent
units. But as mentioned earlier, the data on traffic demands for
unregistered mail are not reliable. However, we have reliable
data on the revenue realised by the IPD during the period 1950-
51 to 1983-84 from Appropriation Accounts of Department of
Post and Telegraph. These revenue figures may approximately
represent output supplied by the Department of Posts if they are
corrected for index numbers of regulated prices of postal
services. Column (5) of Table 4.1 and Column (4) of Table 4.2
respectively provide information about the revenue of IPD and
price index number of postal services. Using this information,
we have estimated the revenue at constant prices and reported
it in Column (3) of Table 4.3. The revenue at constant prices so
estimated may approximately represent output of IPD in
rupees at constant prices and be comparable over time. Now,
by dividing the revenue at constant prices by the price of a
post card in the year 1950-51, we have made estimates of
postal services in post card equivalent units which are comparable
over time. These estimates are provided in Column (4) of
Table 4.3.
The resource cost of providing postal services in India
during a given year can be estimated given the data about
capital stock, labour employment, material inputs used, the
price of capital services, wage rates and prices of material
inputs for IPD. The Annual Reports and Appropriation Accounts
published by IPD provide data about capital stock and
annual expenditure on wages and salaries and material inputs
for IPD, as given in Appendix Table A.3. Given an estimate of
value of capital stock at constant prices (K,,1) and the price of
capital services of a rupee worth of capital at constant
prices (pkl), the cost of capital services for IPD in a given

EFFICIENCY OF INDIAN POSTAL SERVICES 25
Table 4.1
Estimates of Total Economic Cost and Gross
Revenue at Current Prices of Indian
Postal Department
(Rs. in Million)
Year
(1)
Cost of Capital
Services
(2)
Other
Costs
(3)
Total
Cost
(4)
Total Revenue
(5)
1950-51
1951-52
1952-53
1953-54
1954-55
1955-56
1956-57
1957-58
1958-59
1959-60
1960-61
1961-62
1962-63
1963-64
1964-65
1965-66
1966-67
1967-68
1968-69
1969-70
1970-71
1971-72
1972-73
0.94
0.98
0.96
1.08
1.28
1.44
1.61
4.24
2.31
3.19
2.93
3.04
3.38
3.84
3.75
4.73
4.90
5.29
5.85
6.87
7.59
10.40
11.21
230.0
258.7
279.1
288.0
305.3
321.3
335.2
391.7
394.7
415.5
452.4
484.3
558.8
590.9
670.1
766.6
865.8
968.1
1086.8
1124.0
1242.2
1321.5
1461.3
230.94
259.68
280.06
289.08
306.58
322.74
336.81
395.94
397.01
418.69
455.33
487.34
562.18
594.74
673.85
771.33
870.70
973.39
1092.65
1130.87
1249.79
1331.90
1472.60
210,4
220.4
241.4
265.3
279.3
294.2
327.4
348.8
378.7
392.2
407.8
456.2
509.5
566.2
593.2
660.0
701.5
742.3
939.8
978.1
1105.4
1106.4
1182.5
(Cortid. next page)

26 PRICING OF POSTAL SERVICES IN INDIA
Year
(1)
1973-74
1974-75
1975-76
1976-77
1977-78
1978-79
1979-80
1980-81
1981-82
1982-83
1983-84
1984-85
1985-86
Cost of Capital
Services
(2)
11.16
10.22
930
1033
12.11
13.99
14.15
15.18
16.30
19.09
23.02
28.63
3238
Other
Costs
(3)
1639.1
1973.3
2344.6
2476.8
23343
2631.8
2527.6
3794.9
4433.7
5169.2
5705.2
6351.2
7252.0
Total
Cost
(4)
1650.26
198332
2354.10
2487.33
2346.61
2645.79
2541.75
3810.08
4450.00
5188.29
5728.22
6379.83
7284.58
TotalRevenue
(5)
13423
1420.7
16783
1939.6
2069.0
2391.7
2592.2
2708.4
3094.1
3780.1
4345.4
4414.1
4768.4
Table 4.2
Index Number of Wage Rate/Capital Cost
Postal Tariff
Year
1950-51
1951-52
1952-53
1953-54
1954-55
1955-56
1956-57
Wage Rate
100
96.41
97.91
100.58
97.63
95.96
91.44
Capital Cost
100
110
117
115
114
111
108
Postal Tariff
100
100
100
111
111
111
116
(Contd. next page)

EFFICIENCY OF INDIAN POSTAL SERVICES 27
Year
1957-58
1958-59
1959-60
1960-61
1961-62
1962-63
1963-64
1964-65
1965-66
1966-67
1967-68
1968-69
1969-70
1970-71
1971-72
1972-73
1973-74
1974-75
1975-76
1976-77
1977-78
1978-79
1979-80
1980-81
1981-82
1982-83
1983-84
Wage Rate
99.08
98.69
96.13
101.84
104.58
111.13
113.08
129.02
151.35
166.36
200.15
200.92
202.95
212.27
227.60
249.67
277.25
334.28
392.65
390.53
398.05
465.41
465.77
521.63
565.33
660.31
760.89
Capital Cost
267
127
155
133
133
138
139
134
148
152
160
152
149
151
183
154
154
178
173
173
172
177
181
191
196
209
220
Postal Tariff
125
125
125
125
129
129
133
138
138
138
148
171
187
204
213
217
221
250
254
303
303
332
351
371
376
381
433

28 PRICING OF POSTAL SERVICES IN INDIA
Table 43
Estimates of Economic Cost and Revenue at
1950-51 Prices and Index of Economic Efficiency of
Entire Postal Services
Year
(1)
1950-51
1951-52
1952-53
1953-54
1954-55
1955-56
1956-57
1957-58
1958-59
1959-60
1960-61
1961-62
1962-63
1963-64
1964-65
1965-66
1966-67
1967-68
1968-69
1969-70
Total Total
Economic Revenue
Cost
(2) (3)
(In Rs. million)
230.94
264.89
288.52
289.06
312.62
328.20
353.29
381.89
388.82
417.56
433.10
454.89
467.05
512.16
522.30
517.70
534.40
507.51
564.05
575.21
210.4
220.4
241.4
239.1
251.6
265.0
282.2
279.0
303.0
313.8
326.2
353.6
395.0
425.7
429.9
478.3
508.3
501.6
549.6
523.0
Post Card
Equivalent
of Total
Revenue
(4)
( Nos.)
4488.5
4701.9
5749.8
5100.8
5538.1
5653.3
6020.3
5952.0
6464.0
6694.4
6958.9
7543.5
8426.7
9081.6
9171.2
10203.7
10843.7
10700.8
11724.8
11157.3
Revised
Productive
Efficiency
(5)
(Nos.)
19.44
17.75
19.93
17.65
17.72
17.23
17.04
15.59
16.62
16.03
16.07
17.35
18.04
17.73
17.56
19.71
20.29
21.08
20.79
19.40
(Contd.
Index of
Economic
Efficiency
(6)
1.00
0.91
1.03
0.91
0.91
0.89
0.88
0.80
0.85
0.82
0.83
0.89
0.93
0.91
0.90
1.01
1.04
1.08
1.07
0.99
next page)

EFFICIENCY OF INDIAN POSTAL SERVICES 29
Year
(1)
1970-71
1971-72
1972-73
1973-74
1974-75
1975-76
1976-77
1977-78
1978-79
1979-80
1980-81
1981-82
1982-83
1983-84
Total Total
Economic Revenue
Cost
(2) (3)
(In Rs. million)
608.03
606.38
613.58
592.04
597.94
617.99
655.40
608.23
625.89
628.39
812.53
860.74
910.01
873.51
541.9
519.4
544.9
607.5
568.3
660.8
640.1
682.8
720.4
738.5
730.0
812.1
873.0
950.9
Post Card
Equivalent
of Total
Revenue
(4)
(Nos. )
11560.5
11080.5
11624.5
12960.0
12123.7
14097.1
13653.3
14139.7
15368.5
15754.7
15573.3
17324.8
18624.0
20285.8
Revised
Productive
Efficiency
(5)
(Nos. )
19.01
18.27
18.95
21.89
20.28
22.81
20.83
23.25
24.56
25.07
19.17
20.13
20.47
23.22
Index of
Economic
Efficiency
(6)
0.98
0.94
0.97
1.13
1.04
1.17
1.07
1.20
1.26
1.29
0.98
1.04
1.05
1.19
year can be estimated as
(1)
Following a method prescribed by Jorgenson and Griliches,
the price of capital services can be estimated as
Pk- = iy + <y - -s- (2)
where RJ is the rate of return on capital in the year t,

30 PRICING OF POSTAL SERVICES IN INDIA
d^ is the rate of depreciation of capital in the year t,
is the rate of appreciation of value of capital, where Pk is dpjdt.
We have used data on rates of return on long-term government
bonds and securities during the period 1950-51 to 1986-87 as
estimates of R^. The annual reports of IPD provide data on
depreciation. Using these data and the data on capital stock, we
have obtained the estimates of dkt. Table 4.4 provides the estimates
of R^, d^ and pkl for IPD during the years 1950-51 to 1986-87.
In the estimation of pkl we have not attempted the correction for
the appreciation of the value of capital stock. Table 4.1 provides
Table 4.4
Estimates of Average Rate of Return on Long Term
Government Securities and Rate of Depreciation
and Estimates of Price of Capital Services for IPD
(in percentages)
Year
(1)
1951-51
1951-52
1952-53
1953-54
1954-55
1955-56
1956-57
1957-58
1958-59
1959-60
1960-61
1961-62
1962-63
Annual Average
Rate of Return
(2)
3.11
3.56
3.94
4.00
4.06
4.07
4.02
3.96
3.98
4.13
4.08
4.07
4.30
Rate of Depreciation
(3)
1.11
1.10
0.98
0.86
0.73
0.63
0.54
0.97
1.39
2.39
1.53
1.53
1.53
(Contd.
Total
(4)
4.22
4.66
4.92
4.86
4.79
4.70
4.56
4.93
5.37
6.52
5.61
5.60
5.83
next page)

EFFICIENCY OF INDIAN POSTAL SERVICES 31
Year
a)
1963-64
1964-65
1965-66
1966-67
1967-68
1968-69
1969-70
1970-71
1971-72
1972-73
1973-74
1974-75
1975-76
1976-77
1977-78
1978-79
1979-80
1980-81
1981-82
1982-83
1983-84
1984-85
1985-86
1986-87
Annual Average
Rate of Return
(2)
4.32
4.48
5.07
5.28
5.25
5.04
5.04
5.15
5.37
5.37
5.37
6.16
6.28
6.24
6.24
6.42
6.57
6.96
7.22
7.73
8.24
9.22
9.94
10.19
Rate of Depreciation
(3)
1.53
1.18
1.16
1.14
1.52
1.39
1.25
1.22
2.37
1.12
1.13
1.24
1.02
1.07
1.00
1.05
1.06
1.10
1.07
1.09
1.05
0.96
1.13
1.29
Total
(4)
5.85
5.66
6.23
6.42
6.77
6.43
6.29
6.37
7.74
6.49
6.50
7.40
7.30
7.31
7.24
7.47
7.63
8.06
8.29
8.82
9.29
10.18
11.07
11.48
estimates of cost of capital services, labour and other costs and
total resource cost at current prices during the period 1950-51 to

32 PRICING OF POSTAL SERVICES IN INDIA
1986-87 for IPD. The estimates of real resource cost of IPD have
to be obtained by making the corrections in the estimates of cost
at current prices for the index numbers of prices of capital
services, wages and salaries and material inputs. Table 4.2 provides
estimates of index numbers of price of capital services and
wages and salaries for the postal department during the period
1950-51 to 1986-87 while the index numbers of prices of material
inputs for IPD are assumed to be the wholesale price index
numbers of paper and paper products in India. After making the
corrections foi these index numbers, the real resource cost estimates
for IPD are obtained as given in Column (2) of Table 4.3.
2. Estimates of Efficiency
The estimates of output per rupee of resource cost spent by
IPD are given in Column (5) of Table 4.3 while Column (6) of
the same table provides the index numbers of productivity/
efficiency of postal department. Before we comment on the
estimates of productivity of IPD, we have to recognise that the
supplies of postal services in India are demand constrained.
Given the existence of joint costs and the increasing returns to
scale in joint production in the provision of these services, there
may be an excess capacity in the Department of Posts in a given
situation. Therefore, falling productivity of IPD in the fifties
may be a reflection of the increasing of excess capacity during
this period. The fifties have witnessed the growth of both cost
and output for IPD, but output growing at a lower rate than cost
Given the existence of excess capacity in early fifties, the growing
demand for postal services in India might have been met efficiently
during the later years of the fifties by increasing the expenditure
of joint cost nature at a rate lower than the rate of growth of
output. However, in the sixties and seventies, even though the
costs of IPD and the demands for its services were increasing,
it would appear that the demand-constrained supplies of postal
services were such that the economies of scale ofjoint production
were exploited beneficially. This phenomenon is reflected in a
gradual increase in the output per rupee of resource cost incurred

EFFICIENCY OF INDIAN POSTAL SERVICES 33
by IPD during this period. Estimates of productivity of IPD
show that the same development has been discerned during the
early eighties.
Now, looking at the efficiency index of IPD which is estimated
by taking the year 1950-51 as base, there is a fall in the efficiency
index during the fifties followed by gradual rise during the
sixties. During the sixties, IPD was more efficient than it was in
1950-51 during the four-year period 1965-66 to 1968-69. During
the early seventies IPD was less efficient that it was in 1950-51.
Since 1973-74, there was a gradual rise in the efficiency of IPD,
culminating in the highest efficiency for all the time during
the year 1978-79. In fact IPD is 29 per cent more efficient in
1978-79 than it was in 1950-51. After a sudden fall in the year
1980-81, the efficiency of IPD has registered a gradual increase
in the eighties.
Thus, a properly computed index of efficiency of overall
productivity clearly establishes the proposition that there has
been a long-term improvement in the efficiency of the IPD.
Once this is accepted it is important to identify the source(s) of
this improvement. In order to do this we regressed log of total
economic costs (Ct) against log of composite output in post
card equivalent units (Q) and time (t). The results of that
regression are given below. The time period covered is 1950-51
to 1983-84.
lnCt = 0.616 lnQ^ 0.0033 t
(0.253) (0.004)
R2 = 0.942
(Figures in parentheses denote standard errors)
This regression presumes that the sources of improvement in
efficiency can be traced to economies of scale and (neutral)
technical progress.

34 PRICING OF POSTAL SERVICES IN INDIA
We find that the elasticity of cost with respect to output is
less than one and significant. Hence clearly there are economies
of scale in the IPD. Moreover, the coefficient on time (t) is very
small and insignificant. Hence technical progress cannot explain
the improvement in efficiency.
We must also note the fact that the increase in efficiency has
been fluctuating over the years. These vicissitudes have been
ascribed to differences in the rate of growth of output as compared
to the rate of growth of costs. These, in turn, are linked to two
salient features of the IPD: (i) output is often demand-constrained
and (ii) there has been an uneven expansion of capacity and,
consequently, joint cost.
3. Conclusions
The commonly held belief that the efficiency of IPD has
been falling over time does not find support from the estimates
of productivity of the department for the period 1950-51 to
1983-84. The estimates of output of IPD (expressed in post card
equivalent units) per rupee of resource cost show that there was
a fall in the productivity of IPD during the fifties while it has
been gradually rising since the beginning of the sixties. The
index of productivity of IPD is 1.19 in 1983-84 with the year
1950-51 as base and the index in fact has become as high as 1.29
in the year 1979-80. There have been increasing returns to scale
in IPD as indicated by an estimate of the elasticity of cost with
respect to output (amounting to 0.616 during the period 1950-51
to 1983-84). We may therefore consider the inefficiency of IPD
as one of scale inefficiency which increased in the fifties but has
been followed by gradual decrease since the sixties.

5, Pricing Rules for Postal Services
1. Cross-Subsidv-Free/First Best Prices for Postal Services
In the literature on pricing in public enterprises, marginal cost
pricing is generally regarded as a first best/Pareto optimal rule.
However, for a multi-product firm this may not be the best pricing
rule. There are two reasons for this: (i) It may be difficult or even
impossible, a priori, to allocate the costs among the various
products; and (ii) since joint production often involves economies
of scale there is always the risk that, ifleft to the free market, these
enterprisesmaybecome natural monopolies. Forboth these reasons
such enterprises must be regulated.
The next question, naturally, is: What should be the cost
minimising (optimal) prices forjointly supplying commodities by
a publicly regulated utility such as IPD? Given the long-run cost
function for a public utility like EPD, the costminimising orthe first
best prices for a given service can be computed as a weighted
average of marginal costs of that service at different scales of
operation of the firm.1 The weights in this case are defined by the
normalised incremental scales ofan expanding firm. In the case of
a short-run cost function of a public utility, we should distinguish
between the variable cost and the fixed cost which may also be a
joint cost. The variable cost component of the price of a given
. servicejointly supplied withotherservices, maybecomputed as the
weighted averageofmarginal costs ofthis service at differentlevels
of operation of the firm. But the identification of joint/fixed cost
component ofthe price of a given service poses formidable problems.
The methods that are normally used for cost accounting among
1. Sec Chapter 7, Section 3, for details.

36 PRICING OF POSTAL SERVICES IN INDIA
various services of a firm having output or revenue as basis are
arbitrary in that they may not yield first best or cross-subsidy-free
prices. However, there is one method, the attributable cost method,
for the allocation ofjoint costs amongvarious services which yields
first best prices or cross-subsidy-free prices for public utilities
having a particular class of cost functions.2 Following this method
the cross-subsidy-free prices (p.) may be computed by using the
following formula.
P=(Ci+ !!q> xJ) i=l,2,...,N (1)
where
p.: Cross-subsidy-free price of i* service
Cj: Per unit attributable cost
q.: Quantity of i* service supplied
J : Joint cost
A : Attributable cost
The data supplied by IPD about its cost structure during the
years 1980-81 to 1985-86 provide details about various components
of cost to each service. Some of the components may be regarded
as joint costs while others are attributable costs to each service. We
have no knowledge ofthe method followed by IPD for distributing
joint costs among different services while calculating the average
costs reported in Table 5.1. We have estimated attributable cost of
each service by assuming that cost of printing and stationery and
transport cost (by Railway Mail Service, Surface and Air) are
2. Sec Chapter7, Section 3, for details.

PRICING RULES FOR POSTAL SERVICES 37
attributable costs. Then an estimate of joint costs of postal
service is obtained by deducting the estimate of total attributable
costs from the estimate of total economic cost reported in column
(4) ofTable 4.1. Given these estimates, we have made estimates of
cross-subsidy-free prices for different postal services in India
during the period 1981-82 to 1985-86. Table 5.2 presents these
estimates.
A comparison of Tables 5.1 and 5.2 reveals that the estimates
of cross-subsidy-free prices are significantly different from the
estimates ofper unit costs marie by IPD for different services. The
cross-subsidy-free prices are higher for all first class and second
class unregistered mail services than theperunitcosts calculatedby
IPD. The differencesmayinthemain be attributed to some arbitrary
method used by IPD for distributing joint costs among various
services.
Table 5.3 provides estimates of average revenue per unit for
different postal services. These may be regarded as implicit tariff
rates for postal services which can be slightly different from
statutory rates fixed by IPD for the first class and second class
unregistered mail. However, for the registered mail they are averages
since statutory rates vary with weight/amount of the mail. Now, a
comparison ofimplicit tariffrates in Table 5.3 shows that the tariff
structure of IPD is substantially different from the structure of
cross-subsidy-free prices. Therefore the tariff structure of IPD for
each year during 1981-82 to 1985-86 contributes to significant
cross-subsidisation. The unregistered first class mail consisting of
post cards, letter cards and letters and the second class mail
comprising newspapers and other articles enjoy a fairly large
subsidy at the cost ofregisteredmail items. Forexample, during the
year 1985-86, the implicit tariffs for post cards, letter cards and
letters are respectively given as Re. 0.18,0.35 and 0.70 while their
corresponding cross-subsidy-free prices are Re. 0.87, Rs. 1.27 and
1.29. For a registered newspaper (single) the cross-subsidy-free
price is Rs. 1.56 while the postal tariff is only Re. 0.11 during the
year 1985-86.
38 PRICING OF POSTAL SERVICES IN INDIA
Table
Estimates of Total
Item
Postcards
Letter cards
Letters
Regd. newspapers
(i) Single
(ii) Bundle
Book post
(i) Book patterns
On) Printed Books
1981-82
0.45
0.50
0.51
0.51
0.61
0.54
0.64
(iii) Other periodicals 0.69
Parcels
Registration
Value payables(VPP)
Insurance
Acknowledgements
MO
TMO
IPO
Savings Bank
Saving Certificates
BRLs
Recorded delivery
3.89
3.23
1.94
4.73
0.40
4.29
4.01
2.09
2.27
3.28
4.45
-
5.1
Per Unit Cost of
Postal Services
1982-83
0.50
0.56
0.57
0.58
0.69
0.61
0.72
0.78
4.40
3.58
2.37
4.87
0.45
4.66
4.53
2.32
2.50
3.47
4.47
-
1983-84
0.54
0.59
0.60
0.66
0.81
0.70
0.85
0.93
5.73
3.91
2.68
5.26
0.48
5.26
5.31
2.66
2.98
4.13
5.92
1.92
1984-85
0.61
0.71
0.69
0.75
0.93
0.79
0.97
1.06
6.63
4.32
2.96
5.89
0.55
5.93
5.82
3.02
3.25
4.43
6.29
3.24
(inRs.)
1985-86
0.67
0.77
0.76
0.82
1.01
0.88
1.06
1.16
7.20
4.88
2.48
6.67
0.61
6.83
6.54
3.51
3.48
5.48
-
3.59

PRICING RULES FOR POSTAL SERVICES 39
Table 5.2
Cross-Subsidy-Free Prices for Postal Services
Item
Postcards
Letter cards
Letters
Regd. newspapers
(i) Single
(ii) Bundle
Other unregd. articles
(i) Book patterns
(ii) Printed books
1981-82
0.61
0.77
0.82
0.84
1.18
0.91
1.23
(iii) Other periodicals 1.41
Registration
Acknowledgement
Parcels
VPP
Insurance
MO
TMO
IPO
Savings Banks
Saving Certificates
BRLs
Recorded delivery
3.09
0.47
7.41
0.27
3.74
0.76
0.76
0.61
0.31
0.11
0.37
-
1982-83
0.66
0.91
0.94
1.00
1.41
1.07
1.47
1.67
3.52
0.55
8.79
0.27
4.12
0.88
0.88
0.64
0.35
0.19
0.36
-
1983-84
0.71
0.89
0.94
1.24
1.93
1.33
1.93
2.23
3.53
0.54
12.94
0.23
3.93
0.84
0.84
0.57
0.30
0.15
0.35
0.14
1984-85
0.73
1.12
0.96
1.32
1.99
1.41
2.08
2.40
3.59
0.57
14.23
0.46
4.38
0.91
0.91
0.99
0.34
0.14
0.42
3.54
(in Rs.)
1985-86
0.87
1.27
1.15
1.56
2.33
1.69
2.44
2.81
4.33
0.69
16.65
1.29
5.79
1.27
1.27
1.25
0.60
0.25
0.30

40 PRICING OFPOSTAL SERVICESININDIA
Table 5.3
Average Revenue on Tariff of Postal Services
(inRs.)
Item
Post cards
Letter cards
Letters
Regd. newspapers
(i) Single
(ii) Bundle
Book post
(i) Book patterns
(ii) Printed books
(iii) Other periodicals
Parcels
Registration
VPP .
Insurance
Acknowledgement
MO
TMO
IPO
Savings banks
Saving certificates
BRLs
Recorded delivery
1981-82
0.15
0.25
0.51
0.07
0.20
0.38
0.19
4.47
4.28
2.29
1.27
5.36
0.30
2.89
2.80
0.25
1.95
2.63
4.48
-
1982-83
0.16
0.33
0.66
0.10
0.26
0.43
0.28
0.48
4.19
2.75
1.25
5.37
0.30
3.50
2.80
0.33
1.93
2.59
4.70
-
1983-84
0.16
0.35
0.71
0.10
0.26
0.44
0.29
0.50
5.73
2.75
1.27
5.26
0.30
3.73
2.84
0.41
2.19
2.97
4.77
1.00
1984-85
0.17
0.35
0.69
0.10
0.27
0.44
0.28
0.51
5.64
2.75
2.39
8.43
0.30
3.71
2.65
0.48
3.33
4.82
4.91
1.00
1985-86
0.18
0.35
0.70
0.11
0.30
0.53
0.33
0.45
7.24
2.75
2.28
7.56
0.30
4.30
2.67
0.46
3.96
5.87
-
1.00

PRICING RULES FOR POSTAL SERVICES 41
Table 5.4 provides the estimates of rates of subsidies for the
first class mail and the registered newspapers (single) during the
period 1981-82 to 1985-86.
Newspapers have the highest per unit subsidy followed
by letter cards, post cards and letters. Table 5.5 provides
mark-up over cross-subsidy-free prices for some of the registered
mail services. For most of the registered mail items (with the
exception of parcels, registered letters and IPOs), there are
positive mark-ups over cross-subsidy-free prices. During
1985-86, money orders, savings banks and savings
certificates have mark-ups respectively of Rs. 3.03, 3.36
and 5.62
Table 5.6 provides estimates of total subsidies/profits for
different postal services during the period 1981-82 to 1985-86.
Out of 17 services reported in the table there were 7 profit-
earning services during the year 1985-86. Table 5.7 provides our
estimates and the estimates of IPD for budgetary deficit of the
Department of Post Our estimated deficits are substantially
higher than the estimates of IPD. The differences between these
two estimates are attributable to differences in the definition
adopted by IPD. The differences between our cost estimates
and cost estimates of IPD arise mainly because of differences
with respect to treatment of cost of capital services and inter
departmental transfers. Our estimate of cost of capital
services includes depredation as well as return on capital in
the alternative uses in the economy while IPD takes only
depreciation as the cost of capital services. Inter
departmental payments like recoveries made by IPD for the
agency services like postal savings and savings certificates,
are mere transfer flows which will not be relevant for the
estimation of economic cost of IPD. For example, if these
payments are made by the Ministry of Finance, they should be
almost treated as a subsidy given by this Ministry to IPD for
providing these services.

42 PRICING OFPOSTALSERVICESININDIA
Table 5.4
Rates of Subsidies for First Class Mail and
Registered Newspaper (Single)
Item
Postcards
Letter cards
Letters
Newspapers
(single)
(bundle)
1981-82
(1)
-0.46
-0.52
-0.31
-0.77
•0.98
1982-83
(2)
-0.50
-0.58
-0.28
-0.90
-1.15
1981-84
(3)
-0.55
-0.54
-0.23
-1.13
-1.67
Table 5.5
1984-85
(4)
-0.56
-0.77
-0.27
-1.22
-1.72
1985-86
(5)
-0.69
-0.92
-0.45
-1.45
-2.03
Estimates of Mark-Ups Over Cross-Subsidy Free Prices
for Some Registered Mail Services in India During
1981-82 to 1985-86
Item
wfc ■ -»-
tVKB
Registcsalleam
VPP
InsoraKe
Money orders
IPOt
Savings banks
Savings certificates
BRLs
1981-82
0)
-3.13
-0.80
0.99
1.62
2.13
-0.36
1.64
151
4.11
1982-83
(2)
-4.60
-0.77
0.98
1.25
2.62
-031
1.58
2.40
4.34
1983-84
(3)
-7.21
-0.78
1.04
1.33
2.89
-0.16
1.89
2.82
4.41
1984-85
(4)
-8.59
-0.84
1.93
4.05
2.80
-0.51
2.99
4.68
4.93
198SS6
. (5)
-9.41
-1.58
0.99
1.77
3.03
-0.79
3.36
5.62
-

PRICING RULES FOR POSTAL SERVICES 43
Table 5.6
Cross-Subsidisation of Postal Services
(Rs million)
Item
1. Post cards
2. Letter cards
3. Letten
4. Regd fetters
0) Single
(ii) Bundle
5. Book pest
0) Book pattern
(ii) Printed books
(iii) Other periodicals
6. Parcels
7. Registration
8.VPP
9. Insurance
10. Acknowledgements
11. MO
11TMO
13. IPO
14. Savings banks
15. Saving certificates
16.BRLS
17. Recorded delivery
1981-82
-437.55
-450.39
-443.21
-162.93
-31.26
-129.11
-46.49
-22.00
^194.37
-194.56
+1147
+13.77
-29.61
+252.83
+5.54
-5.80
+350.14
+2933
+48.91
-
1982-83
-487.67
-485.98
-439.83
-214.56
-40.94
-147.39
-50.46
-26.06
-294.86
-197.43
+1235
+10.88
-49.11
+31938
+6.81
-5.30
+362.14
+36.48
+64.67
-
1983-84
-527.01
-468.2
-332.44
-25436
-56.11
-21936
-74.78
-40.66
-423.95
-207.87
+1127
+13.17
-46.78
+360.67
+7.51
-3.31
+402.00
+51.61
+53.36
+7.05
1984-85
-487.26
-621.02
-38534
-267.67
-7<*37
-22181
-.76.68
-41.01
-4231
-23135
+22.97
+38.48
-52.73
+365.96
+7.56
-10.46
+679.93
+126.83
+63.60
+21.59
1985-86
-62131
-776.02
-649.40
-335.53
-7034
-28192
-94.74
-54.99
-580.60
-421.86
+10.49
+16.64
-79.09
+378.45
+8.18
-18.96
+803.04
+19538
-
+6.16

44 PRICING OFPOSTAL SERVICES ININDIA
Table 5.7
Estimates of Budgetary Deficits of IPD
(Rs. million)
Item
IK) Estimates
Our Estimates
1981-82
881.5
1355.9
1982-83
839.9
1408.2
1983-84
732.3
1382.8
1984-85
1242.5
1935.7
1985-86
1635.5
2516.2
Therefore, our estimates of costs are fully attributable to
resources usedby IPD, namely, labour, capital andmaterial inputs.
But whatevermay be the magnitudes ofthese deficits, they have to
be financed from the general revenues of Union Government.
Given that there have been substantial budgetary deficits even
after allowing cross-subsidisation by the department, the problem
is to determine the tolerable level of budgetary deficit for IPD.
Since budgetary deficits have to be met from the general revenue,
there is a trade-off between cross-subsidisation and budgetary
deficit The optimum levels of cross-subsidisation and budgetary
deficits forIPDhave to be determined as part ofthe overall revenue
policy of the government. The next section discusses some issues
related to this problem..
Finally we recommend the following rule forcomputing cross-
subsidy-free prices for its services:
Rule 1: Cross-subsidy-free prices for a public utility with joint
production are the first best prices or Pareto optimal
prices. In computing these prices for the Indian postal
services, die attributable costmethod as described above
canbe followed fordetermining thejointcostcomponent
of the price of each service.
2. Distributional Equity and PricesforIndian Postal Services
We. have observed in the preceding section that the actual
tariffs/prices charged by the postal department are different from

PRICING RULES FOR POSTAL SERVICES 45
the cross-subsidy-freeprices foritsvarious services. Also,there has
been a budgetary deficit for IPD (even after cross-subsidisation)
which has had to be financed from general revenues ofthe government.
The question that arises then is: Why does IPD have prices for its
services which are substantially different from the cross-subsidy-
free prices?
In the theoiy ofpublic sector pricing there are various arguments
for the deviations from the first best marginal cost prices. Several
such arguments are also relevant for a public utility supplying
jointly many commodities. Some such arguments are:
a. Deviations from cross-subsidy-free prices may be
necessitated because ofdifferences in the market structure
for different services. In several market situations the IPD
does not enjoy monopoly power. Therefore, a, crucial
distinction may have to be made between monopoly services
and competitive services. Some services of IPD may also
be provided by private agencies. For example, private
agendes supply parcel services as well as courier services
for first class mail. Also, with the existence of a well
developed banking system the supply process of money
order services, postal savings and postal orders have to be
fixed after taking into account supply prices of similar
services charged by banks. To protect its share of the
market for these services, IPD may have to supply
these services at subsidised (competitive) prices while
charging (near) monopoly prices for other services. Given
the revenue constraint of IPD, this may result in cross-
subsidisation.
b. The IPDmay like to fix its prices after taking into account
the effects ofthese on the equity and efficiency objectives
of the government, and the overall budgetary situation.
Such prices are known as second best or Ramsey prices.
In this sectionwe estimate these prices forsome categories
of postal services. Below we describe the methodology
adopted.

46 PRICING OF POSTAL SERVICES ININDIA
The postal services in general may be regarded as necessities
with very inelastic demand with respea to price and income which
is confirmed by the following estimated demand function for the
postal services in India.
In D= 5.835 -0.401 In p +0.116 In Y +0.0591
[5.236] [-3.920] [0.663] [7.047] (2)
[1.115] [0.102] [0.175] [0.008]
R2 = 0.986, DWS= 1.512
where
D : Total demand for postal services expressed in post
card equivalent units.
p : Index number of postal tariffs.
Y : Gross national product at constant prices.
t : Time.
(Figures in brackets give respectively t ratios and standard
errors.)
This demand function is estimated using time-series data from
1950-51 to 1983-84. The own price elasticity ofdemand for postal
services in India is -0.401 whiJe the income elasticity is 0.116 with
an exponential time trend of 0.059. The own price elasticity and
exponential time trend are statistically significant at 5 per cent
level. Given the poor quality of the data, we have not attempted to
estimate a complete demand system for Indian postal services to
test for inter-service substitution possibilities. As such, one may
expect statistically significant cross-price elasticities of demand
among first class mail services like letters, letter cards and post
cards. Also the first class mail items being very essential
services, demand for them can be relatively inelastic with respect
to prices and income in comparison to demand for registered
mail items.
To compute second best prices we need data about consumer

PRICING RULES FOR POSTAL SERVICES 47
expenditure on each mail item by income/expenditure classes to
comment on the relative importance of a given service from the
point of view of distributional equity. Such data are simply not
available^but there existestimates ofthe distribution ofdemandfor
some postal services by various sectors like Government, Business
and Households during the year 1986-87. A Report on Postal
Traffic Survey conducted by the Department ofPosts, Government
of India provides these estimates. Table 5.8 provides estimates of
percentage distribution oftraffic originating from different sectors
for first class mail items while Table 5.9 provides the same
information for registered mail items. In the case of first class
mail services, households' demand accounts for 89.78 per cent of
post cards and letter cards, 49.32 per cent of envelopes and
72.73 per cent of total unregistered mail while the respective
demands ofbusiness account for9.27,35.04 and 19.87 percent and
of government account for 0.95, 15.64 and 10.60 per cent
Table 5.10 provides estimates of distribution of postal traffic by
rural and urban sectors.
From the point of view of income distribution, government
is assumed to favour household demand over demand by business
and its own demand. In order to compute second best prices taking
into account governmental distributional preferences for various
services, we consider three hypothetical scenarios of structure of
governmental preferences. The distributional preferences of
government depend upon its value judgement about income
distribution in the economy. Each scenario represents a certain
degree of governmental preferences for income distribution.
The three scenarios A, B and C can be ordered in terms of
degree of governmental distributional preferences in the sense
that C implies stronger distributional preferences than B and B
than A. Table 5.11 presents the income distributional weights
to demands for postal services by government, business and
households under three scenarios, assuming in each case
preferences of government for its own demand for postal services
as numeraire.
48 PRICING OFPOSTAL SERVICES ININDIA
Table 5.8
Unregistered Mail By Users During 1986-87
Users
Government
Business
Households
Post Cards.
Letter card
0.95
9.27
89.78
Envelopes
15.64
35.04
49.32
Secondary
unregd.
10.60
20.77
68.63
Total
unregd.
7.40
19.87
72.73
Unregd.
Parcels
57.62
29.97
12.41
Table 5.9
Percentage Distribution of Various Categories of Registered
Post by Users During 1986-87
Users
(1)
Government
Business
Households
Users
Government
Business
Households
RegcL
Letters
(2)
20.21
50.22
29.57
VPLetters
(3)
9.92
48.58
41.60
Utilisation
ofVP Parcel
(7)
13.44
17.65
68.91
Insured
Letters
(4)
4.88
8..82
86.30
Insured
Parcel
(8)
6.22
63.91
29.87
Insured
VP Parcel
(5)
0.94
11.21
87.85
Insured
VPP
(9)
4.97
81.99
13.04
Utilisation
ofParcel
(6)
44.59
37.44
17.97
MO
(10)
3.59
13.62
82.79

PRICING RULES FOR POSTAL SERVICES 49
Table 5.10
Percentage Distribution of Various Postal Services
by Rural and Urban Sectors in India
1. Postcards
2. Inland letter
3. Envelopes
4. Registered newspapers
5. Book post
6. Registered letters
7. VP letters
8. Insured letters
9. Insured V P letters
Urban
62.3
63.8
71.2
77.02
78.05
87.5
89.19
93.73
0.67
Rural
37.7
36.2
28.8
22.98
21.95
12.5
10.81
6.27
0.33
Now the distributional characteristic (R) of i* postal service
can be estimated as
Rj = b1wlj + b2w2j + b3w3j (3)
where
bj: Distributional weight to traffic demand ofi* sector, i =
1,2,3.
wy: Proportion of i* sector's demand in total demand for j*
service.
Table 5.12 provides the estimates ofdistributional characteristics
of inland letter cards, envelopes, registered newspapers and book
post, registered letters, VP letters and insured letters under alternative
scenarios ofincome distributional preferences of government As
expected, inland letter cards are distributionally more important
with the highest distributional characteristic. Then follow insured
letters, registered newspapers, envelopes, etc., in declining order

50 PRICING OF POSTAL SERVICES ININDIA
from the point of view of income distribution. Registered letters
have the least priority with the lowest income distributional
characteristic in two of the scenarios.
Table 5.11
Distributional Weights (bl} to Postal Tariff Demands
for the Three Sectors under Alternative Scenarios
Sector
1. Government
2. Business
3. Households
b
A
1.00
0.75
1.25
1.00
Scenarios
B
1.00
0.50
1.50
1.00
C
1.00
0.25
1.75
1.00
Table 5.12
Estimates of Distributional Characteristics of Postal
Services under Alternative Scenarios
Scenario Inland Envelopes Registered Registered VPL Insured
letter. newspapers letters letters
<fc bookpost
(1) (2) (3) (4) (5) (6) (7)
A .
B
C
1.201
1.403
1.604
1.036
1.071
1.107
1.120
1.239
1.359
0.948
0.897
0.845
0.923
0.925
0.928
1.193
1.385
1.578
Source : Estimated as explained in the text
For a public utility having equity and efficiency objectives and
a revenue constraint in fixing prices for its services, the optimal
(second best) prices (p) can be estimated by using the following
formula:

PRICING RULES FOR POSTAL SERVICES 51
Pt-m, = (l-'bRi), i=l,2,...,N (4)
Pi tell
where
m.: Cross-subsidy-free price/full cost price of i-th service,
p. : Consumer of i-th service.
■%{ : Own price elasticity of demand for the i-th service,
b : Average of income distributional weights.
Using this formula, p, can be estimated given the estimates of
m,, R., b and er We have obtained the estimate of aggregate price
elasticity of demand for postal services as -0.401 which we
assume to be the same for all the services. Table 5.2 and S.12
respectively provide estimates of m, and R, for different postal
services while Table 5.11 provides estimates of Bj and b
under alternative scenarios. Given all these estimates, we
have obtained the estimates of second best prices for some of
the postal services for the year 1985-86, as given in Table
5.13.
A comparison of second best prices with first best/
cross-subsidy-free prices shows that, out of six services we have
considered in Table 5.13, only two services, viz., registered letters
and VP letters have second best prices higher than the cross-
subsidy-free prices. As expected, inland letter cards have highest
subsidy followed by insured letters, registered newspapers and
envelopes.

52 PRICING OF POSTAL SERVICESININDIA
Table 5.13
Estimates of Second Best Prices for Various Postal
Services under Alternative Scenarios During 1985-86
(inRs.)
Scenario
(1)
A
B
C
Inland
letter
(2)
0.85
(-0.50)
0.63
(-1.01)
0.51
(-1.51)
Envelopes Registered
(3)
1.06
(-0.09)
0.97
(-0.18)
0.91
(-0.27)
newspapers
& bookpost
(4)
1.20
(-0.30)
0.98
(-0.60)
0.82
(-0.90)
Registered VPL
letters
(5)
4.98
(0.13)
5.85
(0.26)
6.98
(0.38)
(6)
1.45
(0.11)
1.59
(0-19)
1.57
(0.18)
Insured
letters
(7)
3.91
(-0.48)
2.95
(-0.96)
2.37
(-1.44)
Note Figures in parentheses represent the ratio ofdifference
between consumer price and full cost price and the
consumer price.
Source : Estimated as explained in the text
Comparison of the estimates of second best prices for alternative
scenarios about income distributional preferences of government
indicates that the price subsidies on post cards, insured letters,
registered newspapers and envelopes have increased and the mark
up over full cost price is increased for registered mail as distributional
preferences of government grow stronger (for example a change
from scenarioA to scenario C). Given a balanced budget constraint
for IPD, this indicates cross-subsidisation among postal services.
Thatmeans profits earned from the registered letters have to be used
by IPD to subsidise inland letter cards, registered newspapers, etc.

PRICING RULES FOR POSTAL SERVICES 53
3. Conclusions
One of the important characteristics of IPD is that it has been
having cross-subsidisation with budgetary deficits. That means
price subsidies to some of its services are financed partly from
cross-subsidisation and partly from general revenue. The cross-
subsidy-free prices that are estimated using the attributable cost
method forcomputingjoint costcomponentofprice ofeach service
are much different from the actual prices charged by IPD for its
services. All the first class mail items, newspapers, parcels, registered
letters, and IPOs have subsidies while VPP, insurance, money
orders, savings banks, savings certificates etc., have the actual
prices higher than the cross-subsidy-free (full cost) prices. The
estimates ofbudgetary deficits that are made taking cross-subsidy-
free prices as base are much higher than the budgetary deficits
declared by IPD during the period 1981-82 to 1985-86. This may
be attributable to differences between our estimates of economic
cost and estimates made by IPD.
The main problem then is to look for the justification of
subsidies for some services at the cost of higher prices for other
services anda budgetary deficit Cross-subsidisationis shownto be
justified if the IPD as a public utility has the objectives of efficiency,
equity and a balanced budget We also considered two other
alternative scenarios ofsubsidies for some ofthe postal services. In
one scenario, we had subsidies for some services with a matching
budgetary deficit of IPD and this deficit was financed from the
general revenues of the government. Another scenario considered
was the one that represents the current practices of IPD for fixing
prices forits services, i.e., subsidiestocertain services the financing
of which is shared by cross-subsidisation and budgetary deficits
made good from the general revenue.
As they are very essential, postal services shouldhave very low
price elasticity ofdemand. The price elasticity ofaggregate demand
for the Indian postal services is -0.401. the estimates of sectoral
distribution of demand for postal services show that household

54 PRICING OF POSTAL SERVICES IN INDIA
sector consumes 72.73 per cent of unregistered mail services and
29.57 per cent of registered mail services. If the govemment/IPD
has distributional preferences in favour of consumption of postal
services by household sectorin comparison to its own consumption
and consumption by business sector, these preferences have to be
reflected in the prices it charges for various services. Estimates of
prices for Indian postal services underthree alternative scenarios of
income distributional preferences ofthe government show that first
class mail items, newspapers, etc., have price subsidies while the
registered letters have prices higher than the full cost prices.
Therefore, ifIPD has an equity objective with a revenue constraint,
subsidies for some of its services are justified at the cost of prices
higher than full cost prices for other services.

6. Block Pricing for Indian
Postal Services
1. Introduction
Currently, IPD charges differential prices for several of their
services depending on their value or weight The services having
block prices by weight arc: tetters, book packets, parcels, newspapers,
etc. while money orders, postal orders have block prices by value.
Table 6.1 provides information about block prices charged by IPD
during the year 1985-86 for some of its services.
There are several arguments for justifying block pricing by
IPD for some of its services. First of all, the cost of supplying a
service mayvary with the weight orvalue ofthe service. Secondly,
there may be private market alternatives for bulk services, in
terms of weight or value so that IPD has to offer concessional
prices to keep its share of market of these services. Thirdly,
concessional prices can be charged in respect ofservices which are
known to be availed of more by the poorer sections on equity
considerations.
In the case ofletters, books, newspapers and parcels, the cost
of providing the services may increase with the weight. Also,
there' may be private market alternatives for bulk services in
wtaght so that IPD has to fix the prices at concessional rates to
keejy its share of market Therefore, depending upon the relative
weights that IPD gives to these opposing factors, the prices for
(fiherent blocks of a given service often have to be fixed at
varying rates.

56 PRICING OF POSTAL SERVICES ININDIA
"Though this has not been tried in practice, it is also possible
to have differential prices for a given service according to source
of demand. Ifit has the objective of distributional equity, there is
a justification for having differential prices for a given service
depending upon whether its demand originates from rural or
urban sectors, developed regions or backward regions, and
business or household sectors in the economy. For example, (the
case of IPD charging) different prices can be charged for traffic
originating from developed regions and backward regions of the
country. Depending upon a well defined criterion, one may be in
the position to identify certain pockets of the country as
developed and others as less developed IPD can thus have dual
prices for a given service: a lower price for less developed
regions to promote the objective of reducing regional disparities.
For registered mail originating from different regions, dual
pricing scheme can be easily implemented while it may be
necessary to make special efforts to implement it for unregistered
mail. Post offices in the less developed regions may be supplied
with specially embossed post cards, inland letters and envelopes
with concessional prices notified on them which would be valid
if the cards etc., are mailed through a post office in a backward
region.
2. Block Prices for Letters
Letter is an important service which has differential prices
fixed by IPD by weight classes. Column (5) of Table 6.1 shows
the actual prices for letters charged by IPDby weight classes during
the year 1985-86. These prices range from Rs. 0.35 to Rs. 1.65
for weights Varying from 10 to 100 grams. On the other hand,
the estimated cross-subsidy-free prices by weight classes, as
given in column (4) of Table 6.2, range from Rs. 0.20 to Rs. 3.80
as the weight of the letter varies from 10 grams to 100 grams.
These cross-subsidy-free prices are estimated by assuming that
the supply cost of letters increases in direct proportion to their
weight.

BLOCKPRICING FOR INDIANPOSTAL SERVICES 57
Table 6.1
Block Prices Charged by IPD During the Year 1985-86
Item
Registration Fee
(a) Fee
(b) Stationery charge
Insurance Fee
(a) Upto Rs. 100/-
(b) Per Rs. 100/- thereafter upto Rs. 5,000/-
(c) Per Rs. 1000 thereafter upto Rs. 10,000/-
Money Order
(a) Per Rs. 10/- upto Rs. 20/-
(b) Per Rs. 20/- beyond Rs. 20/-
VPP Posting Fee
(&) Upto Rs. 10/-
(b) Exceeding Rs. 10 upto Rs. 20/-
(c) Exceeding Rs. 20/-
Demurrage charge on V P Articles
For detei'tion beyond 7 days
(a) Parcels
(b) Other articles
Indian Postal Orders
(a) For each upto Rs. 10/-
(b) For each upto Rs. 20/-
(c) For each upto Rs. 30/-
(d) For each upto Rs. 40/-
(e) For each upto Rs. 50/-
(f) For each upto Rs. 100/-
Rate charged
2.00
0.10
1.00
0.50
3.00
0.25
0.50
0.50
1.00
1.50
0.25
0.15
0.20
0.40
0.60
0.80
1.00
2.00

58 PRICING OF POSTAL SERVICES IN INDIA
Table 6.1 (Cont'd.)
Item (in grams)
Letters
(a) Upto lOgms
(b) For every lOgms thereafter
Book Patterns, Sample Parcel
(a) Upto 50gms
(b) Every added 25gms in excess
Book Packets containing Printed Books
(a) Upto lOOgms
(b) For added 50gms or part thereof
Parcels
(a) For first 500gms
(b) Every added 500gms or part thereof
Book Packets containing Periodicals (Registered)
(a) For first lOOgms
(b) Every added 50gms or part thereof
Newspapers (Single copies)
(a) Upto 50gm
(b) Upto lOOgm
(c) Every added lOOgms or part thereof
Newspapers (Multiple copies)
(a) Upto lOOgms
(b) Per every added lOOgms or part thereof
Rate charged
(Rs.)
0.50
0.20
0.30
0.15
0.15
0.10
3.00
3.00
0.25
0.30
0.05
0.15
0.10
0.15
0.10

BLOCKPRICING FOR INDIANPOSTAL SERVICES 59
Table 6.2
Estimated and Actual Rate Charged According to Various
Slabs for Letter Mail Services During the Year 1985-86
Weight
slabs
(in gms.)
(1)
0-10
10-20
20-30
30-40
40-50
50-60
60-70
70-80
80-90
90-100
100-300
Average
weight
(2)
5
15
25
35
45
55
65
75
85
95
200
Relative
frequency
(Rs.)
(3)
44.0
17.5
10.0
7.5
5.0
3.6
3.2
2.4
1.6
1.0
4.2
Estimated Actual
Cross- Prices
subsidy-free
Prices
(Rs.)
(4)
0.20
0.60
1.00
1.40
1.80
2.20
2.60
3.00
3.40
3.80
7.99
(5)
0.35
0.45
0.60
0.75
0.90
1.05
1.20
1.35
1.50
1.65
4.65
Estimated Prices
with a distinction
between Fixed and
Variable costs
(Rs.)
(6)
0.95
1.04
1.12
1.21
1.29
1.37
1.45
1.53
1.62
1.71
2.58
In actual practice, it may be the case that the cost of supplying
a letter may be fixed and has to be incurred by IPD irrespective of
the weight of the letter. In the case of letters, with the exception of
transport cost (airmail, RMS and surface), all other costs may be
taken as fixed costs. Column (6) ofTable 6.2 provides estimates of
prices oflettersby weightclasses assuming that transportcosts vary
with respect to weight These costs differ significantly from the
estimates of costs given in columns (4) and (5) of the same table.
Given the price of Rs. 0.95 for a letter weighing 10 grams, the
estimates show that price increases by 9 paise per every 10 grains
increase in weight, whereas in the case ofprices actually charged by

60PRICING OF POSTAL SERVICES IN INDIA
IPD, given the price of Rs. 0.35 for aletter weighing 10 grams, theprice increases by 15paiseforevery 10grams increase in the weight
of the letter. Therefore, the differences in the estimates of prices
presented in columns (5) and (6) are attributable partly to differences
in the fixed cost and partly to differences in incremental prices
across the blocks.
Given that IPD practises differential pricing for letters by
weight classes, though in an arbitrary fashion, we recommend that
any one of the methods described may be followed above for fixing
these prices. However, we are more inclined towards the method
that distinguishes between fixed and variable costs with respect to
the weightofthe letter. Differential pricing forletters from the point
ofview of distributional equity may, however, be followed if there
is any evidence to show that letters in the lower weight categories
are used relatively more by the poor than those of higher weight.
3. Block Prices for Parcel Services
The actual prices charged by IPD for parcels bearing different
weights are at the rate ofRs. 3.00 per 500 grams in 1985-86. But the
estimated cross-subsidy-free prices are muchhigher than the actual
prices as can be seen from columns (4) and (5) of Table 6.3. The
cross-subsidy-free price is Rs. 10.68 per 500 grams.
In the case of parcels also we may assume all costs with the
exception of transport cost to be constant with respect to weight.
Transport costincreases with weight/volume ofthe parcel. Column
(6) of Table 6.3 presents estimates of prices of parcels by weight
classes assuming that the transport cost per every 500 grams is
estimated to be Rs. 2.51 using the data for 1985-86. The fixed cost
of a parcel is estimated to be Rs. 12.77 while the variable cost
increases at the rate ofRs. 2.51 for every 500 grams increase in the
weight ofa parcel. On this basis, the price ofa parcel shouldincrease
from Rs. 14.03 to Rs. 34.11 as the parcel size increases from 250
to4250 grams, as can be seen in column (6) ofTable 6.3. However,
if we have prices based on incremental/marginal costs only, the
price changes from Rs. 1.26 to Rs. 21.42 as the weight of parcel

BLOCKPRICING FOR INDIANPOSTAL SERVICES 61
increases from 250 to4250grams. Column (7) ofTable 6.3 presents
these estimates. As we can observe from columns (5) and (6), the
discrepancy between the actual rates charged by IPD and the prices
based on marginal costs is much less in relation to discrepancies
between the other estimates and the actual prices.
It is recommended that one of the procedures described above
may be adopted for fixing the prices for postal services. We feel
again, that as in the case of letters, the method that distinguishes
between variable cost and fixed cost with respect to the weight of
a parcel is superior as it is based on sound economic logic.
Table 6.3
Estimated and Actual Rate Charged According to Various
Slabs on Parcel Services During the Year 1985-86
Weight
slab
range
(in gnu.)
(1)
0-500
500-1000
1000-1500
1500-2000
2000-2500
2500-3000
3000-3500
3500-4000
4000-4500
Average
value
(2)
250
750
1250
1750
2250
2750
3250
3750
4250
Relative
frequency
(3)
51.91
24.75
10.04
5.74
2.48
1.66
1.01
0.88
1.53
Estimated
Cross-sub
sidy-free
Prices
(Rs.)
(4)
5.38
16.14
26.90
37.66
48.42
59.18
69.94
80.71
91.47
Actual
Prices
(Rs.)
(5)
3.00
6.00
9.00
12.00
15.00
18.00
21.00
24.00
27.00
Estimated
Prices
with a dis
tinction
between
Variable &
Fixed costs
(Rs.)
(6)
14.03
16.54
19.05
21.56
24.07
26.58
29.09
31.60
34.11
Estimated
Prices
based on
Marginal
cost
(Rs.)
(7)
1.26
3.78
6.30
8.82
11.34
13.86
16.38
18.90
21.42

62 PRICING OF POSTAL SERVICES ININDIA
4. Block Prices for Money Orders (MOs)
IPD charges differential prices for money orders by value
classes. Actual commission charged by IPD for MOs during the
year 1985-86 varies from Re. 1.00forRs.50toRs.24forRs. 1000
as can be seen from column (5) ofTable 6.4. The cross-subsidy-free
prices estimated under the assumption that cost of supplying MO
services increases with the value of MO are much lower than the
actual price. But given the peculiar characteristic ofMO services,
one cannot assume that the cost is an increasing function of the
value ofMO. For IPD the cost ofsupplyingMO service may be the
same irrespective of the value ofMO unless one assumes a rapid
increase in th*. risk factor with the rise in the value of the MO.
Table 6.4
Estimated and Actual Rate of Commission Charged
According to Various Slabs on MO
During the Year 1985-86
Value of
MO slab
wise
(Rs.)
(1)
0-50
50-100
100-200
200-300
30O400
400-500
500-600
600-700
700-800
800-900
900-1000
Average
value
(2)
25
75
150
250
350
450
550
650
750
850
950
Relative
frequency
(3)
34.85
24.32
16.83
8.57
3.63
4.82
1.83
1.0
1.3
0.5
2.35
Estimated Actual
Cross- Prices
subsidy-free
Prices
(Rs.)
(4)
0.20
0.59
1.18
1.97
2.76
3.55
4.34
5.13
5.92
6.71
7.50
(Rs.)
(5)
1.00
2.00
4.00
6.50
9.00
11.50
14.00
16.50
19.00
21.50
24.00
Estimated Prices
with a distinction
between Fixed and
Variable costs
(Rs.)
(6)
2.00
2.00
2.00
2.00
2.00
2,00
2.00
5.00
5.00
5.00
5.00

BLOCKPRICING FOR INDIAN POSTAL SERVICES 63
The distribution of cost of supplying MO services in direct
proportion to the value ofMOs may be justifiable only if IPD has
other considerations like equity. In this case there may be a case for
arguing that people living in rural India may avail this service for
sending small amounts of money to their kith and kin mainly
because they do not have access to banking. However, MOs
involving larger amounts of money have to compete with the
banking system in rural as well as in urban areas. The information
relating to fees charged by commercial banks in India for demand
drafts ofvarious denominations is given in column (6) ofTable 6.4.
In order to compare these rates with the rates given in columns (4)
and (5) of Table 6.4, we have to add to them the postal charges for
sending a demand draft to the receiver. The differential charges for
MOs by value classes have to be fixed keeping in mind all these
considerations.
5. Conclusions
In this chapter we have discussed the rationale for variable
marginal prices forselected postal items such as letters, parcels and
money orders. In designing these block prices the postal authorities
have to pay attention to the link between the cost of these services
and their weight/value, and the price structure of competitive
services.
As with several other areas of operation of IPD, detailed
statistical work needs to be done in order to better quantify the
factors that affect variablemarginal prices. Detailed information on
joint and variable costs, the distribution of costs by weight/
value and the tariff structure for competitive services should be
obtained in order to develop a better structure of tariff for the
services of IPD.

1. Approaches To Public
Utility Pricing
1. Introduction
This chapter is an attempt to review some important problems in
the theory of public utility pricing with particular emphasis on
postal services. Some of these problems have their genesis in a
distinguishing characteristic of many public utilities : joint
production of several items with increasing returns to scale. This
poses the difficult problem of allocation of joint costs among
these items.
There are two interrelated but analytically separable issues
here:
(i) The fact that there are increasing returns to scale may
lead to the development of the 'natural' monopoly.
(ii) Because several items are being jointly supplied, each
such item must have adequate incentive to stay with the
'monopoly' or, alternatively, be able to face the competition
from another agency that may be supplying just this
item or a subset of such items. Any regulation of this
'monopoly' must pay heed to these issues.
One method of regulation that is able to give due emphasis
to both these issues and which has been the subject of intense
scrutiny in the literature is the so-called cross-subsidy-free prices
which are Pareto aptimal. Another such regulatory mechanisrr

APPROACHES TO PUBUC UTILITY PRICING 65
is second best Ramsey pricing. In the following sections of this
chapter we discuss some of the these pricing schemes for supplying
public utility services.
The plan of the remaining part of this chapter is as follows.
In Section 2 we consider the problem of determining the first
best prices for a public utility that produces many goods jointly.
In particular, we examine the proposition that subsidy-free prices
are Pareto optimal. In Section 3 we study Aumann-Shapley
prices which, it is claimed, are subsidy-free and have certain
other desirable properties as well. Section 4 considers the problem
of second best pricing of public utilities in the sense that the
problem of cross-subsidisation is ignored and the public utility
maximises a welfare function subject to a pre-specified budget
constraint Section 5 presents a case in which we have Aumann-
Shapley prices for the public utility and welfare maximising
subsidy/tax-inclusive prices for final consumers of utility services
and the final section provides conclusions.
2. Subsidy-Free Prices
An important characteristic of many public utilities is that
they provide many goods/services simultaneously and the cost
of producing, these goods/services are not completely allocable
among them. The genesis of the problem lies in the fact that
there are economies of scale in joint production which are left
unexploited, if each item is produced by a different producer.
The overall cost «f provision of postal services would be higher
if first class mail services like post cards were produced by one
agency and parcel service was provided by another and so on.
Suppose the postal department provides N services, levels of
which are denoted by qx , . . . , q^ If C(qt , . . . , qN) is the
cost of providing these services, then it follows that this cost
would be lower than the cost that could be attained by the
arrangement that permits the provision of these services by more
than one agency, i.e., for every subset S of these N services it
must be true that

66 PRICING OF POSTAL SERVICES IN INDIA
CCq, ,...., qN) < C, (qx,.... %) + CM (q,+1,. . . , qN) (1)
where C§ (.) is the cost of providing S services at the required
levels ql , , c^ and , correspondingly, CSh (.) is the cost
of providing the other services at the pre-specified levels.
In a market with free entry and free exit, inequality (1)
implies that it is profitable to supply all services by one firm.
But in an unregulated situation, the firm may become a 'natural'
monopoly charging prices which are Pareto inefficient. The
problem then is to look for a pricing scheme to regulate the firm
for yielding Pareto efficient outcomes. Faulhaber (1975) has
derived in a pioneering paper one such set of pricing rules using
the theory of cooperative games. If we designate each service as
a player in a cooperative game, given the inequality (1), it is
profitable to have a grand coalition rather than forming smaller
and less profitable sub-coalitions of players and services. Then
the problem is to find out the prices which will induce and
preserve the grand coalition, i.e., the single supplier arrangement
For example, in the case of Indian postal services, although the
various services of the Post Office are technically not free to
form smaller sub-coalitions, there is still the problem that it
might be profitable for other (private) agencies to provide some
of these services. In either case, in the absence of right structure
of prices, the grand coalition is potentially unstable.
Suppose that such a set ofprices which induces each constituent
service to stay in the grand coalition has been found. What must
be its characteristics? These must relate to (for any constituent
services) profitability inside and outside the grand coalition. Let
Pt, , pN be the prices for these N services that induce all
of them to stay in the grand coalition. Assuming independent
demands, the demand for service i at price p. is q. (p.) for i = 1,
2 . . . , N. Then it must be true that
N
X p. q. - C(qx , qN) = * (.) = 0 (2)
i = 1

APPROACHES TOPUBUC UTILITYPRICING 67
S
and that L p, q, £ C^ , . . . , q.) (3)
i= 1
for any subset S of N services. By substracting (3) from (2) we
have
i= 1
i.e., the revenue contributed by the set of services S^N
should be at least as great as the added cost of supplying S.
The prices satisfying the inequality (4) are called subsidy-free
prices.
'If the provision of any commodity (or group of commodities)
by multi-commodity enteiprise subject to a profit constraint
leads to prices for the other commodities no higher than they
would pay by themselves, then the price structure is subsidy-
free. Thus, a subsidy-free price structure insures that the provision
of each commodity by the enterprise is Tareto Superior1 to non-
provision" (Faulhaber, 1975). Since a set of subsidy-free
prices defined above induces rational players in the game to
cooperate and is stable against all possible coalitions, it belongs
to the core of the game. An immediate corollary is that this
solution is also Pareto optimal so far as these N services are
concerned.
If we did not have cross-subsidy-free prices, some services
would be subsidising others and, since they could do better in
smaller coalitions, there would be incentives for the former to
leave the grand coalition. Also, there could be incentives for
some new agencies to supply those services that are subsidising
others in the grand coalition. If cross-subsidisation does exist,
then it follows that these agencies could profitably compete.
Cross-subsidy-free prices are efficient prices. TTiey also ensure
that the grand coalition breaks even.

68 PRICING OF POSTAL SERVICES ININDIA
3. Computation of Subsidy-Free Prices
If costs of production in a multi-product public utility were
fully allocable among the various services, then cross-subsidy-
free prices would require each service to have a price that just
covers its own cost Hgure 1 represents the long-run cost structure
of one of the services offered by a multi-product firm. Then the
question is, what is the price for the services that cover the full
cost at any given level of supply. This price may be defined as
, 1 6C(tqlt tq , tq,,)
o 8qldti=l,2,...,N (5)
where C, (q,, o^ . . . q^ is the long-run cost function with 0 <
t < !. At the level of production q,* the total cost of q. is given
as
fir
which is equivalent to the shaded area in Figure 1. If pt (i = 1,
2 , . . . , N) are full cost prices, we have
LRMC
LRAC

APPROACHES TOPUBUC UTILTTYPRICING 69
N N c
s pi(ql*)qi*= 2 J V — *k (6)i = 1 i = 1 o q'
The prices defined in (5) are known as Aumann-Shapley prices
(A-S prices).1 For a cost-minimising firm with decreasing or
constant returns to scale, A-S prices and marginal cost prices are
the same. At cost-minimising quantity q., the price that is equal
to marginal cost is also theA-S price that covers full cost, as can
be seen in Figure 1. Also, for a single-product firm, the price
defined in (5) is same thing as average cost However, in the
case of a multi-product firm;with joint variable cost in the long
run, the sharing ofjoint costs by different commodities is implicit
in A-S prices which are free from cross-subsidisation. These
prices may be used by regulated monopolies and public and
quasi-public agencies to allocate the joint cost of production to
different commodities produced by them. To compute A-S prices,
only the cost structure and output vector must be known.
Billera and Heath (1982) and Mirman and Tauman (1982)
have proposed an axiomatic approach to cross-subsidy-free or A-
S prices for multi-product public utility. They have shown that
A-S price mechanism is the only price mechanism which sasu'sfies
the following five axioms for continuously differentiable cost
functions with no fixed cost components.
1. Cost Sharing : The prices Of various commodities of a multi-
product firm are such that they cover the full cost of production
N
£ ^ qs = C (q, , qN)
i= 1
i.e., the total cost is equal to total, revenue.
2. Rescaling : If the scales of measurement of commodities are
1. See R. J. Aumann and L.S. Shapley (1974) and LJ. BMera, D.C. Heath
and J. Raanan (1979).

70 PRICING OF POSTAL SERVICES ININDIA
changed, then the prices are changed accordingly. If the cost
functions of a multi-product firm differ only with respect to
scales of commodities
G(X, , . . . , XN) =
then
PCX,) = Xp(q.), i = 1, 2 N.
3. Consistency : Each unit of the same good has the same price.
If prices depend only upon cost functions and not demand
functions, being the same good will mean, the good with samecost
N
Let C (qx , .... qN) = G( Z q)
i = 1
then
N
P, = P ( Z q), i = 1, 2 N.
i= 1
4. Positivity : If a cost function C increases at least as rapidly
as the cost function G with respect to quantities of commodities,
then the prices determined for C should be at least as high asthose determined for G.
6C 6G*
tf-T- > — , i = 1, 2 N
5. Additivity : If a cost function can be broken down into two
components say C and G* (e.g., management and production),
then calculating the price determined by the cost function for
any level of production can be done by adding the price determined
by C and G* respectively for that level of production. Thatmeans

APPROACHES TO PUBUC UTILITYPRICING 71
Pl (C+G*) = P, (Q + P, (G*) i = 1, . . . , N
A-S prices that satisfy these axioms can be computed given the
long-run cost functions with no fixed-cost elements. However,
the short-run cost functions have fixed-cost components which
are normally joint costs for a multi-product firm. In this case
allocation of fixed costs among different commodities may be
possible, given the information about both long-run and short-
run cost functions. Given the envelope theorem of long-run cost
functions, the efficient portion of short-run technology coincides
with long-run technology used by the firm. Using A-S prices for
the long-run cost function, an allocation of fixed cost associated
with the efficient (short-run) technology can be determined.
Suppose the cost function is given by
G (q, , . • • , qN) = C (q, , q^ + F (7)
where C and F are respectively variable and fixed costs. A-S
prices with long-run cost functions are given by
1 dq,
§2 N
which cover both variable cost and fixed cost We can then
compute another set of prices p,, i = 1,2... N which cover only
variable cost as
jl SCftq, tqj dU=12 N (9)
1 o dq,
Then we have
N
£ (Pl-Pl)q1 = G(qi q^-CCq^.-./q^F (10)i = 1
which obviously means that (p{ - pj) is that part of price which
may be thought of as covering fixed cost F.
In actual situations, there may be problems in allocating
fixed costs among various commodities produced by a multi-

72 PRICING OF POSTAL SERVICES ININDIA
product firm. For example, when actual demands deviate from
the expected demands for various commodities, short-run
technology, which is optimal for the expected demand, may not
necessarily be optimal with respect to actual or realised demand
in the long-run. In this case the long-run cost function is irrelevant
for the allocation of fixed cost in the short- run. Therefore, fixed
costs must be allocated directly from the short- run cost function.
However, the prices computed using normally used arbitrary
methods based on relative outputs, gross revenue or attributable
cost2 for allocating fixed joint costs among various commodities
violate some or all of the five axioms described above.
Mirman, Samet and Tauman (1983) have proposed amendments
in additivity axiom (Axiom 5) with the addition of Axiom 6 to
show that there exist modified A-S prices for a short-run cost
function that satisfy this new set of axioms.
Axiom 5* : If the short-run cost function of a multi- product firm
is given by
G = C(q, <Q + F
and C is decomposed into Clt C2 , . . . , CM
where f. = ■—- (Relative output method)
Pi
Pi(Relative revenue method)
C.(Attributable cost method).

APPROACHES TO PUBLIC UTILITYPRICING 73
M
such that X C^ = C, then it is possible to decompose
j= 1
M
F into Flf F2 ..... FM such that I Fj = F and
M
P (C + F) =
where p is a N x 1 vector of prices.
Axiom 6 : The part F, of fixed cost F that is associated with
component C, of variable cost C should be at least as large as FJ
whenever the part Cj of C is at least as large as C. That means
Cj £ C, implies F, > Fj
There now exists a price mechanism that satisfies axioms 1, 2,
3, 4, 5* and 6 which is given as
P, = (l+— p*. i=l, 2, N (11)
where Pi* = jo
are the A-S prices associated with variable cost We can see
immediately that the modified A-S prices in (11) are the prices
derived by distributing fixed cost in proportion to allocable
variable cost among different commodities of a multi-produa
firm. We can alternatively write (11) as
P * 9i f FPi = + -J i = 1, 2 N (12)
where f = p»* q'N
1 Pi* Hii = 1

74 PRICING OF POSTAL SERVICESININDIA
Hence for a multi-product public utility having cost function
satisfying axioms 1, 2, 3, 4, 5* and 6, the prices derived by
attributable cost method are subsidy-free.
4. Cross-subsidisation with Balanced Budget for a Welfare
Maximising Public Utility
We have observed in Sections 2 and 3 of Ch. 6 that A-S
prices or cross-subsidy-free prices for a public utility are supply
determined or prices calculated taking into account information
about cost structure of a multi-product firm. However, prices
determined by a welfare maximising firm with a balanced budget
with either efficiency or equity objective may not be cross-
subsidy-free. The familiar Ramsey price mechanism suggests
that price-cost mark-up for a commodity supplied by a publicly
regulated firm should be inversely proportional to its own price
elasticity of demand. Assuming constant returns to scale in
production and interdependent demands for a multi-product firm
(take for example a firm producing two commodities), Ramsey
price mechanism is described by the following fonnulae (if the
firm has both efficiency and equity objectives).3
Pl-ml
Pi
p2-m2
P2
e22
eil
(bRx
(bR,
cn
-1)-
-1)-
e22"
ei2 (bR2
Ek A
e21 (bRj
ei2C21
-1)
-1)(14)
where p, : price of i-th commodity
m. : constant marginal cost of i-th commodity
e..: elasticity of demand for i-th commodity with respect
to price of j-th commodity
3. See Feldstein (1972) and Murty (1987)

APPROACHES TO PUBUC UTIUTYPRICING , 75
H
b = I bTH average of income distributionalh= 1 v
weights where bh is the income distributional weight
assigned to the h-th individual, (h = 1, 2 . . . H)
H
Rj = I q* bh distributional characteristic of
h = 1
i-th commodity where q.h is consumption of i-th
commodity by h-th individual and
H
If demands are independent (cross-price effects are zero) we
have
Pl-ml
Pi
p2-m2
P2
(bR,
(bR,
e22
-1)
-1)
(1-bR,)
leul
(1-bR,)
1 Cj, I
The Ramsey price mechanism described in equations (13*) and
(14*) clearly brings out the trade-off between equity and efficiency
objectives in determining the welfare maximising prices for a
publicly regulated multi-product firm. If a commodity is
distributionally more important (having higher R.) its price will
be relatively lower, given the demand elasticity. However, a
commodity which is distributionally more important may be
having lower elasticity of demand because it is a necessity. The
lower demand elasticity means higher price cost mark-up for that
commodity as implied by formulae (13*) and (14*).

76 PRICING OF POSTAL SERVICESIN INDIA
The assumption of constant returns to scale may not be
tenable in the case ofpublic utilities like Postal Services, Electricity
Supply, etc. As explained in Sections 2 and 3, there may be
increasing returns to scale for a multi-product firm supplying
postal services. In this general case, Ramsey price mechanism
may be described by the following equations4
e-Pi C1 e-i
m2 cf2 1-bR,
where e^ : Own price elasticity of supply of i-th commodity
e^ : own price elasticity of demand of i-th commodity
i = 1, 2.
It is now clear that in the case of a budget-balancing multi-
product firm with equity and efficiency objectives, the optimal
prices are not cross-subsidy-free. Some commodities have to be
fixed prices higher than their marginal costs for giving subsidies
to other commodities. Alternatively we may consider a case in
which a public utility has access to the revenue raised through
commodity taxes, income taxes, etc., to finance its production.
The second best prices of a public utility will then be determined
after taking into account the social cost of raising revenue
through pricing of its services, commodity taxes, income taxes,
etc.5
5. Aumann-Shapley Prices for a Multi-Product Public Utility
and Price Subsidies from General Revenue
We have shown in Sections 2 and 3 of Ch. 6 that cross-
subsidisation by a public utility results in Pareto inefficient
4. See Jha and Murty (1987).
5. See Murty (1983).

APPROACHES TOPUBUC UTILITY PRICING 77
prices and cross subsidisation is inevitable for a welfare maximising
utility with efficiency and equity objectives. The problem then
is to examine whether it is possible to have a case in which a
public utility has Pareto efficient prices and welfare maximisation
with equity and efficiency objectives is achieved through general
revenue policies of government. In the literature of optimal
commodity taxation we know that with the assumption of constant
returns to scale in private production, there are constant producer
prices which are Pareto efficient and there exist second best
consumer prices/taxes for a welfare maximising government
with equity and efficiency objectives that meet a pre-specified
government revenue requirement. But if we have utility services
in the economy, with increasing returns to scale in their production,
public regulation may be necessary to provide these services at
Pareto efficient/first best prices. Assuming that a publicly regulated
utility is guided solely by Pareto efficient prices and the private
sector production takes place with constant returns to scale,
welfare maximising taxes/subsidies on public utility services and
private sector commodities can be determined subject to a
government revenue constraint.
Let there be n private sector commodities and m public
utility.services in the economy and constant returns to scale in
private production and increasing returns to scale in the production
of the services provided by a publicly regulated joint product
firm so that it has Pareto efficient prices for its services, A-S
prices which are defined for given levels of supply of these
services. On the other hand, private sector commodities have
constant producer prices which are equal to their marginal costs.6
The consumer prices are now defined for the private sector
commodities as
p.= d.+ tj i= 1 ... . , N (17)
6. Marginal costs for private sector commodities are constant because of the
assumption of constant returns in production.

78 PRICING OF POSTAL SERVICES ININDIA
where p. d. and ^respectively represent consumer prices, product
prices and taxes.
In the case of the public utility which supplies goods j, j =
N + 1 ,..., N + M their producer prices are already fixed by
consideration of fully distributed cost, e.g., A-S prices. Let d., j
= N+lf...,N + Mbethe levels of these prices. As we have
seen in Sections 2 and 3 these meet the requirement that each d.
corresponds to a level of supply of commodity/service j. If dj
were to change so would the supply of commodity j and vice
versa. It is also clear that we have assumed that demand is
always forthcoming to meet the supply implied by A-S price d.,
j = N+l,...,N + M.
The government is, however, free to price these commodities
in a different manner for the consumers. We can assume that
these commodities/services are procured by the government at
prices d. which is then free to tax/subsidise various constituents
of the public utility's service. The assumption that demand will
be forthcoming to meet the supply is again implicit Thus final
consumer prices are
p. = d. + tjj = N+ 1 , N + M (17)
where Pj are the consumer prices and t. are the tax/subsidy
rates. The overall revenue constraint of the government is now
defined as :
N + M
I t,qs =R (18)i = 1
where qit i = 1 ,... , N, N + 1 ,. . ., N + M are the quantities
of commodities demanded in the economy and R is the exogenously
given revenue requirement of the government The welfare function
of the government is now defined as
W(VlfVa VJ (19)
where Vh = Vh ( Px PN, Pn+1 , . . . , PN+M, Ih) is the

APPROACHES TO PUBLIC UTILITY PRICING 79
indirect utility function of the h-th individual and \ is his
income.
Maximisation of (19) subject to (18) with respect to t{ yields
welfare maximising t. for the given level of production of public
utility services. Hence in this approach once cross-subsidy-free
prices for the public utility are determined, the government
evaluates these public utility services along with other goods in
the economy. The second best problem solved at this stage gives
us welfare maximising tax/subsidy rates for private sector
commodities and public utilities services which meet the
specific equity and efficiency objectives of the government while,
at the same time, meeting the revenue requirements of the
government.
7.6 Conclusions
We have discussed alternative pricing schemes (first best or
second best) for a multi-product public utility with joint costs
and increasing returns to scale. The first best prices are cross-
subsidy-free or A-S prices. The A-S prices can be computed
given the long run cost functions of a multi-product public
utility. However, in the case of short-run cost functions with a
distinction between fixed and variable costs, the A-S prices can
be computed only for a class of cost functions. The cross-
subsidy-free prices in this case correspond to prices computed
with the familiar attributable cost method for a multi-product
public utility.
The second best or Ramsey prices are not cross-subsidy-free.
For a welfare maximising public utility with balanced budget,
these prices are inevitable. Given the alternative sources of
revenue like commodity taxes and income taxes to finance the
public utility production, the welfare maximising prices for utility
services with the assumption of balanced budget for public
utility may not be globally optimal. For fixing globally optimal
public utility prices we have to consider the social cost of raising

80 PRICING OF POSTAL SERVICESININDIA
revenue through prices of public utility services, and other public
sector commodities and income taxes, commodity taxes, etc. to
fund public utility production.
We have suggested a pricing scheme for public utility services
that takes A-S prices as the first best producer prices and subsidised
or tax inclusive prices as consumer prices. In an economy having
a public utility, private sector production, increasing returns to
scale for public utility and constant returns to scale in private
production, A-S prices for the public utility and prices that are
equal to marginal costs (constant) for private sector commodities
are Pareto optimal prices for given level of production of public
utility services. Given these prices for public utility services and
private sector commodities, the second best prices d la Ramsey
can be determined by the welfare maximising govemment with
revenue, efficiency and equity objectives.

APPENDIX I
Table A.1
Traffic Demands of Postal Services
(Figures in million nos.
in India
in physical unit)
Year
(1)
LETR
(2)
POCR
(3)
LECO
(4)
Total RGNP
(Single + Bundle)
(5)
1950-51
1951-52
1952-53
1953-54
1954-55
1955-56
1956-57
1957-58
1958-59
1959-60
1960-61
1961-62
1962-63
1963-64
1964-65
1965-66
1966-67
1967-68
1968-69
1969-70
1970-71
305.90
299.25
316.40
322.70
318.15
364.70
390.60
399.00
412.30
424.90
447.30
466.55
521.15
577.50
606.55
659.05
650.30
655.20
655.55
712.25
731.50
324.10
331.45
348.60
376.25
365.40
415.10
444.85
466.90
513.80
532.70
552.65
593.60
672.00
710.15
719.25
728.70
742.00
726.60
694.05
670.95
687.75
6.65
20.65
36.40
41.65
56.00
57.40
75.95
75.95
96.60
122.70
122.50
151.20
176.05
226.80
273.35
278.95
317.80
348.25
349.65
381.15
394.10
46.90
55.30
60.20
64.75
66.50
66.15
68.50
68.95
69.30
77.35
88.20
93.45
98.70
113.05
129.50
128.45
130.20
127.75
119.35
127.75
133.70
(Cont'd.)

82 PRICING OF POSTAL SERVICES IN INDIA
Year
(1)
1971-72
1972-73
1973-74
1974-75
1975-76
1976-77
1977-78
1978-79
1979-80
1980-81
1981-82
1982-83
1983-84
Year
1950-51
1951-52
1952-53
1953-54
1954-55
1955-56
LETR
(2)
746.55
745.15
798.70
823.20
716.80
910.70
745.35
1005.20
1094.10
1155.00
1289.40
1278.20
1398.90
Table
OTUN
POCR
(3)
693.00
716.45
730.10
722.05
744.80
731.15
747.60
772.10
799.05
868.00
907.55
952.35
974.05
LECO
(4)
414.05
425.25
442.05
483.00
509.60
562.10
618.10
620.55
673.40
746.90
826.00
835.10
898.80
A.1 (Cont'd.)
Total of book patterns,
printed books & other
periodicals
(6)
82.95
88.55
96.60
94.85
108.50
111.30
INSL
(7)
2.84
2.95
3.13
2.97
2.85
2.80
Total RGNP
(Single + Bundle)
(5)
135.80
137.55
153.30
155.40
61.35
166.60
168.35
182.70
187.25
218.40
233.10
264.95
61.45
INSP
(8)
0.88
0.89
0.95
0.89
0.89
1.17
(Cont'd.)

APPENDIX 1 83
Year
1956-57
1957-58
1958-59
1959-60
1960-61
1961-62
1962-63
1963-64
1964-65
1965-66
1966-67
1967-68
1968-69
1969-70
1970-71
1971-72
1972-73
1973-74
1974-75
1975-76
1976-77
1977-78
1978-79
1979-80
1980-81
1981-82
1982-83
1983-84
OWN
Total of book patterns,
printed books & other
periodicals
(6)
128.80
129.85
130.20
149.80
158.55
159.95
170.80
207.80
218.75
226.45
241.50
246.40
238.70
240.45
248.85
245.35
247.10
254.80
260.75
260.05
264.60
263.20
274.75
301.00
332.85
372.05
370.65
358.40
INSL
(7)
2.75
2.66
2.80
2.89
2.97
3.15
3.35
3.34
3.64
3.66
4.09
4.14
4.06
4.32
4.45
4.52
4.74
4.79
4.45
4.68
4.57
4.85
5.00
5.13
5.36
5.76
5.93
7.24
INSP
(8)
1.26
1.11
1.10
1.11
1.14
1.23
1.30
1.27
1.32
1.47
1.52
1.57
1.57
1.55
1.53
1.59
1.70
1.80
1.86
2.00
1.87
1.95
2.06
2.18
2.41
2.64
2.71
2.70

84 PRICING OFPOSTAL SERVICES ININDIA
Year Parcel
(9)
Table
Registration
(10)
A.1 (ContM.)
Acknowledgement
ORDL ORDA
(11) (12)
Total of Money
Money OrdersJTMO
(13)
1950-51
1951-52
1952-53
1953-54
1954-55
1955-56
1956-57
1957-58
1958-59
1959-60
1960-61
1961-62
1962-63
1963-64
1964-65
1965-66
1966-67
1967-68
1968-69
1969-70
1970-71
1971-72
1972-73
1973-74
1974-75
1975-76
1976-77
53.22
56.72
62.09
62.57
64.57
69.70
72.48
71.12
75.68
80.24
84.62
93.58
99.87
104.97
110.78
121.82
125.48
131.15
133.76
135.97
138.75
142.81
146.10
150.70
145.57
160.92
170.42
8.16
4.99
5.03
5.47
5.86
9.93
9.68
9.18
10.31
11.12
12.06
12.88
13.82
14.43
14.24
15.11
16.06
16.20
16.03
16.11
15.64
15.15
15.23
15.78
14.40
13.58
13.84
51.32
53.89
56.26
58.01
61.49
65.05
67.39
66.92
71.98
74.98
75.82
80.21
85.53
94.20
91.23
91.33
94.24
96.42
95.54
94.38
94.54
102.38
99.83
99.25
96.19
103.72
106.63
(Cont'd.)

APPENDIX I 85
Year
1977-78
1978-79
1979-80
1980-81
1981-82
1982-83
1983-84
Year
Parcel
(9)
62.1
64.1
S8.8
IPOs
(14)
Registration
(10)
186.97
197.87
199.25
207.93
222.24
236.43
244.67
Table
BRLs
(15)
Acknowledgement
ORDL
(11)
14.69
15.90
15.83
16.46
17.35
16.74
22.50
ORDA
(12)
174.2
181.9
194.9
A.I (Cont'd.)
Recorded
deliveries
(16)
VPL
(17)
Total of Money
Money OrderslTMO
(13)
107.87
108.29
108.70
111.77
119.35
122.06
-
VPP POSA
(18) (19)
1950-51
1951-52
1952-53
1953-54
1954-55
1955-56
1956-57
1957-58
1958-59
1959-60
1960-61
1961-62
1962-63
3.82
7.11
8.29
9.16
10.95
3.16
3.68
3.21
3.43
3.46
3.39
3.68
4.08
4.80
1.41
1.35
1.17
1.13
3.92
3.82
3.27
3.15
3.06
3.05
3.37
3.59
4.09
4.45
4.83
5.07
5.38
6.00
6.38
6.92
7.72
8.45
9.21
9.48
10.03
(Cont'd.)

86 PRICING OF POSTAL SERVICES ININDIA
Year
1963-64
1964-65
1965-66
1966-67
1967-68
1968-69
1969-70
1970-71
1971-72
1972-73
1973-74
1974-75
1975-76
1976-77
1977-78
1978-79
1979-80
1980-81
1981-82
1982-83
1983-84
IPOs
(14)
16.1
17.1
20.7
BRLs
(15)
11.9
14.9
12.1
Recorded VPL
deliveries
(16) (17)
4.03
5.26
5.74
7.92
8.48
7.27
6.74
5.41
5.74
5.57
6.56
6.34
4.30
5.00
7.34
7.85
8.17
8.57
8.2
VPP
(18)
3.78
3.92
3.52
3.48
3.88
3.36
3.13
2.73
2.25
2.68
2.55
2.62
2.34
2.10
2.35
2.44
2.35
2.58
POSA
(19)
10.49
12.10
13.73
15.19
16.97
18.39
1972
20.58
21.80
23.11
24.98
27.80
29.50
25.05
26.40
25.09
28.92
33.41
38.05
39.94
-
Abbreviations used in Table A.1
LETR
POCR
Letter
Post Cards

APPENDIX I
LECO
RGNP
OTUN
ORDA
ORDL
MO
TMO
VPL
VPP
POSA
SB
SC
87
Letter Cards
Registered Newspapers
Other Unregistered Articles
Ordinary Registered Letters
Ordinary Registered Articles
Money Orders
Telegraphic Money Orders
Value Payable Letters
Value Payable Parcels
Postal Savings
Postal Savings Banks (No. of Accounts)
Postal Savings Certificates
Table A.2
Estimates of Capital Stock and Employment for IPD
Year
1950-51
1951-52
1952-53
1953-54
1954-55
1955-56
1956-57
1957-58
1958-59
1959-60
1960-61
Capital Stock Capital Stock
Current at Constant
Prices Prices
(1950-51)
(Rs. in million)
27.9
29.0
30.7
34.9
41.3
47.7
56.0
61.6
71.9
83.7
93.8
27.9
26.31
24.27
27.69
33.29
38.04
43.81
46.66
53.42
60.70
64.90
Estimated Total
No. of Persons
Employed
(in actual nos)
116853
131826
141523
145723
157799
170701
181079
129970
201687
217897
229219
(Cont'd.)

88 PRICING OF POSTAL SERVICES ININDIA
Year
1961-62
1962-63
1963-64
1964-65
1965-66
1966-67
1967-68
1968-69
1969-70
1970-71
1971-72
1972-73
1973-74
1974-75
1975-76
1976-77
1977-78
1978-79
1979-80
1980-81
1981-82
1982-83
1983-84
Capital Stock Capital Stock
Current at Constant
Prices Prices
(1950-51)
(Rs. in million)
100.1
111.5
130.8
152.9
163.8
175.8
190.3
223.6
272.2
319.4
384.3
456.5
521.7
548.1
608.4
672.7
781.2
920.3
1050.0
1205.3
1395.3
1628.1
1946.2
67.49
72.01
8134
91.91
94.34
94.77
97.03
112.89
135.45
147.78
206.75
214.28
213.07
171.33
161.45
178.73
20736
232.28
229.97
233.67
243.88
268.40
307.36
Estimated Total
No. of Persons
Employed
(in actual nos)
237543
256217
273996
286719
292507
301435
309809
318478
333560
358659
367926
369892
382822
397252
411348
422121
439006
455161
486800
510949
552665
561419
573100

APPENDIX 1 89
Table A.3
Index Number of Wages for Postal and Telegraph
Department (Combined)
Year
1950-51
1951-52
1952-53
1953-54
1954-55
1955-56
1956-57
1957-58
1958-59
1959-60
1960-61
1961-62
1962-63
1963-64
1964-65
1965-66
1966-67
1967-68
1968-69
1969-70
1970-71
1971-72
1972-73
1973-74
Wage BUI
2626
2856
3114
3294
3462
3681
3721
4230
4473
4707
5246
5586
6399
6963
8313
9949
11269
13935
14380
15161
17109
18819
20754
23852
Total No.
of Persons
Employed
194755
219710
235871
242571
262999
284501
301778
316617
336145
363162
382032
395906
427029
456660
477865
487513
502391
516349
530797
555934
597765
613210
616486
638036
Wage BUI
per worker
1348.36
1299.90
1320.21
1356.28
1316.35
1293.84
1232.94
1335.99
1330.68
1296.12
1373.18
1410.09
1498.49
1524.77
1739.61
2040.77
2243.07
2692.76
2709.13
2727.12
2862.16
3068.93
3366.49
Index of Wage
taking
1950-51=100
100.00
96.41
97.91
100.58
97.63
95.96
91.44
99.08
98.69
96.13
101.84
104.58
111.13
113.08
129.02
151.35
166.36
200.15
200.92
202.25
212.27
227.60
249.67
277.25
(Cont'd.)

PRICING OF POSTAL SERVICES ININDIA
Year
1974-75
1975-76
1976-77
1977-78
1978-79
1979-80
1980-81
1981-82
1982-83
1983-84
Wage BUI
29842
36297
37750
39270
44844
50954
59896
70213
83309
97993
Total No.
of Persons
Employed
662087
685580
703535
731676
758602
811334
851582
921108
935698
955167
Wage BUI
per worker
4507.26
5294.34
5265.76
5367.13
5911.04
6280.27
7033.50
7622.67
8903.41
10259.25
Index of Wage
taking
1950-51=100
334.28
392.65
390.53
398.05
438.41
465.77
521.63
565.33
660.31
760.89

APPENDIX H
Notes on Tables in the Report
Table 4.1 Estimates of total Economic Cost and Gross Revenue
at Current Prices of IPD.
This table is presented for the period 1950-51 to 1985-86
under the heads of cost of capital services, other costs, total costs
and total revenue. The figures for cost of capital services, other
costs and total cost are taken from Annual Reports of Department
of Posts and Telegraph (1950-51 to 1983-84) and Department of
Posts (1984-85 to 1985-86).
The figures for total revenue are collected from the
Appropriation Accounts of Department of Posts and Telegraph
(1950-51 to 1983-84) and Department of Posts (1984-85 to
1985-86).
Table 42 Index Number of Wage Rate/Capital Cost/Postal
Tariff.
For preparing the wage rate index, data on wages, salaries,
allowances, etc., were taken from Annual Reports and
Appropriation Accounts of IPD. Base year for the calculations is
1950-51.
The index of postal tariffs was prepared from tariff rate
figures supplied to us by IPD. We averaged these figures and
constructed an index number with 1950-51 as base.
The index of cost of capital services was computed with
figures from Annual Reports and Appropriation Accounts.
Table 4. 3 Estimates of Economic Cost and Revenue
These estimates are presented under the heads of (i) total
economic cost, (ii) total revenue, (iii) post card equivalent of

92 PRICING OF POSTAL SERVICESININDIA
total revenue, (iv) production efficiency, (v) index of economic
efficiency.
The figures in columns (2) and (3) are deflated. The deflator
used is general price index with 1950-51 as base.
Post card equivalent of total revenue is calculated by dividing
total revenue in column (3) expressed in 1950-51 prices by the
1950-51 price of a post card. Productive efficiency is then
defined as
Column (4)
Column (2)
An index of economic efficiency is calculated by constructing
an index of productive efficiency with 1950-51 as base.
Table 4.4 Estimates of Average Rate of Return and Rate of
Depreciation
Estimates of average rate of return are collected from the
Report on Currency and Finance published by RBI.
Rate of depreciation is calculated by dividing the amount of
depreciation by the value of capital stock of IPD.
Table 5.1 Estimates of total per unit cost of postal services
are prepared from the statement showing the cost,
revenue per article and profit/loss on each service,
prepared by IPD.
Table 5.2 Cross-Subsidy Free Prices.
The source for these computations is the same as the one for
Table 5.1.
Per unit total cost of each item has two components:
(i) attributable cost and (ii) joint cost
The following costs are attributable: (a) RMS charges,

APPENDIX II 93
(b) printing and stationery charges, and (c) transport charges.
Joint cost components are (a) per day operation charges, (b)
per day supervision charges, (c) accommodation, (d) administration,
and (e) accounts and audit.
Table 53 Average Revenue on Tariff of Postal Services
The source for this Table is the same as that for Tables 5.1
and 5.2.
Table 5.4 Rates of Subsidies for First Class Mail and
Registered Newspapers (single) and
Table 5.5 Estimates of Mark-Ups Over Cross-Subsidy-Free
Prices for some registered mail services.
These Tables are computed on the basis of figures reported
in Tables 5.2 and 5.3.
Table 5.6 Cross-Subsidisation of Postal Services.
Method of Computation
The rate of cross-subsidisation is computed in Tables 5.4
and 5.5 for all the seventeen services, supplied by the IPD for
the period 1981-82 to 1985-86. Then each rate is multiplied by
its respective traffic figure for each year.
Table 5.7 Estimates of Budgetary Deficit of IPD.
IPd estimates are reported from the Appropriation Accounts
of Department of Posts and Telegraph for the period 1981-82 to
1983-84 and Department of Posts for the period 1984-85 and
1985-86.
Our cost estimates are different because they include the cost
of capital services and treat recoveries from other agencies (e.g.,
Ministry of Finance) as mere transfers. Hence our economic cost
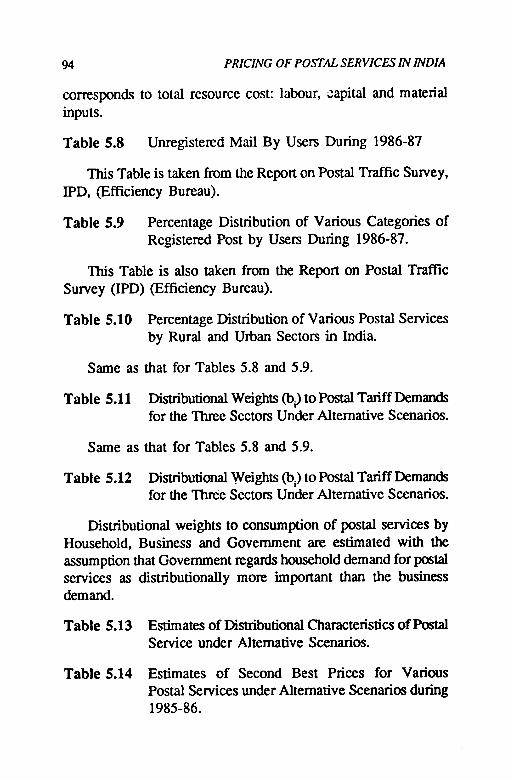
94 PRICING OF POSTAL SERVICES IN INDIA
corresponds to total resource cost: labour, capital and material
inputs.
Table 5.8 Unregistered Mail By Users During 1986-87
This Table is taken from the Report on Postal Traffic Survey,
IPD, (Efficiency Bureau).
Table 5.9 Percentage Distribution of Various Categories of
Registered Post by Users During 1986-87.
This Table is also taken from the Report on Postal Traffic
Survey (IPD) (Efficiency Bureau).
Table 5.10 Percentage Distribution of Various Postal Services
by Rural and Urban Sectors in India.
Same as that for Tables 5.8 and 5.9.
Table 5.11 Distributional Weights (h) to Postal Tariff Demands
for the Three Sectors Under Alternative Scenarios.
Same as that for Tables 5.8 and 5.9.
Table 5.12 Distributional Weights flx) to Postal Tariff Demands
for the Three Sectors Under Alternative Scenarios.
Distributional weights to consumption of postal services by
Household, Business and Government are estimated with the
assumption that Government regards household demand for postal
services as distributionally more important than the business
demand.
Table 5.13 Estimates of Distributional Characteristics of Postal
Service under Alternative Scenarios.
Table 5.14 Estimates of Second Best Prices for Various
Postal Services under Alternative Scenarios during
1985-86.

APPENDIX II 95
Table 6.1 Block Prices Charged by IPD During 1985-86.
These arc taken from Postal Tariff Rate List Series 1854 to
1.1.1987 supplied by the Department of Posts (IPD).
Tables 6J2
and 63 Estimates and Actual Rates Charged According to
Various Slabs for Letter Mail Service and Parcel
Services, respectively for the year 1985-86.
Estimated as explained in the text
Table 6.4 Estimated and Actual Rate of Commission Charged
according to Various Slabs on MOs during the
Year 1985-86.
Estimated as explained in the text
Table A.1 Traffic Demand.
Traffic demand figures arc collected from Annual Report of
Department of P and T (for the period 1950-51 to 1983-84) as
well as from the Statistical Digest of IPD.
There are several problems with these figures:
(i) For unregistered traffic the figures are highly exaggerated.
<ii) Different statements prepared by IPD give very different
estimates of traffic demand for the same year.
We have consistently used the figures in the Annual Reports
and Statistical Digests of IPD.
Table A.2 Estimates of Employment
reported figures are taken from the Annual Reports.
An estimate of total number of persons employed is made in
the following way. We have (separate) estimates of employment

96 PRICING OF POSTAL SERVICES ININDIA
in IPD and Department of Telegraph for 1984-85. We assume
that the ratio of employment in the two departments was the
same throughout the period. Hence from the figures for P & T
for the period 1950-51 to 1983-84 we obtain estimates of
employment within IPD alone.
Table A.3 Index Number of Wages for P & T.
Figures under the heading of wage level and total number of
persons employed are taken from the Annual Reports of Department
ofP&T(from 1950-51 to 1983-84) and from the Report of IPDfor the remaining years.

REFERENCES
Annual Reports, 1950-51 to 1983-84, Department of Posts and
Telegraph, Ministry of Communication, Government of India.
Annual Reports, 1984-85 to 1987-88, Department of Posts, Ministry
of Communication, Government of India.
Aumann, R.J and L.S. Shapley (1974), Values of Non-atomic
Games, Princeton University Press, Princeton, New, Jersey.
Billera, L.J. and D.C. Heath (1982), Allocation of S^arstf £p§ts:
A Set of Axioms Yielding a Unique Procedure, Mathematicsof Operations Research, pp. 32-39.
Brown, Stephen J. and David S. Sibly (1986) : The Theory of
Public Utility Pricing, Cambridge University Press, ^
Faulhaber G.R. (1975), Cross-Subsidisation : Pr-ing in
Public Enterprises, American Economic Review, Vol. 165,
pp. 966-77.
Feldstein, M.S. (1972), "The Pricing of P»t$c Jnjsnn^tQ
Goods", Journal of Public Economics, Vol. 1, pp. 4$-72.
India, Administrative Reforms Commission (I960), Report on
Posts and Telegraphs, 1970, p. 82, Chairjnan - K.
Hanumanthaiya.
India, Administrative Reforms Commission, Working Group on
Posts and Telegraph (1968), Chairman -Ram Kishan, E$hi,
1969.
India, Appropriation Accounts, 1950-51 to 1983-84 (Department
of Posts and Telegraph), Government of India, New Delhi.

98 PRICING OF POSTAL SERVICES ININDIA
India, Appropriation Accounts, 1984-85 to 1986-87, Department
of Posts.
India, Communications (Department of) Posts and Telegraphs
(Board), Memorandum Showing the Proposed Version of
Postal and Telegraphs Tariffs, Delhi.
India, Posts and Telegraphs Accounts (Enquiry Committee
on ~ ) 1931, Chairman-Cowasjee Jehangir.
India, Tariff Enquiry Committee, Department of Posts and
Telegraph, Mahavir Tyagi's Report, July, 1968.
International Bureau of the Universal Postal Union, Berne, General
Principles of Rate Fixing, Study 2/305 of the Consultative
Council of Postal Studies (various other reports of the same
organisation), 1974.
Jha, Raghbendra and M.N. Murty (1987), "Distributional Equity
and Optimal Prices for the Public Sector - The Flexible Co
efficients Case", Energy Economics, January, pp. 46-54.
Jorgenson, D.W. and Z. Grilichess (1967), "The Explanation of
Productivity Change", Review of Economic Studies, 34,
249-83.
Mirman, L.J., Samet D, and Y. Tauman (1983), "Axiomatic
Approach to the Allocation of a Fixed Cost through Prices,
BeO Journal of Economics Vol. 14(1), pp. 139-151.
Mirman, C.J. and Y. Tauman (1982), "Demand Compatible
Equitable Cost Sharing Prices", Mathematics of Operations
Research, pp. 40-66.
Mukherjee, B.N., "A Note on Early Postal System", Journal of
Asiatic Society (Bombay) pp. 54-55 1979-80.
Murty, M.N. (1983), "Distributional Equity, Indirect Taxation
and Optimal Structure of Prices for Public Sector Commodity",

REFERENCES "
Working Paper E/106/84, Institute of Economic Growth,
Delhi, India.
Murty, M.N. (1987), Trices for Public Bectricity Supply inIndia : Efficiency, Distributional Equity and Optimal
Structure", Economic and Political Weekly, October 10,
pp. 1762-1769.
Samet, D., Y. Tauman and I. Zang (1983), "An Application ofthe Aumann-Shapley Prices for Cost Allocation in
Transportation Problems, Mathematics of Operations
Research.
Sams, H.A., Post Office of India in the Great War, Bombay,
Times Press, 1922.
Statistical Digest, Department of Posts and Telegraph, Ministryof Communications, Government of India, 1976-77 to 1983-
84, The Manager, Press, Government of India, Aligarh.
O

NATIONAL INSTITUTE OF FWANCE AND POLICY, New Dew. autonmous, noh-proat o r g e t i o n whim main functions m to cury out rs'- & conrultmcy work for govoramenta and-impart ' training to the officials of various govcnmim~ in public f-ce and relllted Mds of poky. .In addition to' undertaking od$d rune&;"' work; the Institute strives to fulfil the role of vehicle for transferring the result* of apg$i
re* of public finanat.
4 research to policy making in the cwntry in the:$, ,
:;* . .
- Ibe Institute also acts as a fomm w W of'fieials belonging to the Central-and Strts Gavements, representatives. of the pdvate sector, leading financial institutions d m d e m k h can exchange ideas md id"* tioa .With this end in view, amham cmd conferences are orgmbd by thq Institute f m thne to time. However, its main activities nlr% to research conducted on its own initiative mde^ that sponsored by the member governments. (Publications of the Institute am listed on the jacket back.)

LIST OF PUBLICATIONS
Incidence of Indirect Taxation in India 1973-74 (1 981) Rs. 10
Trends and Issues in Indian Fedoral Fjnance (1 981 ) (Allied Publishers) Rs. 60
Wes Tax System in Bihar (1 981 ) (Somaiya Publications) Rs. 80
Incidence of Indirect Taxation in India 1973-74 - (Hindi Version) (1 981) Rs. 20
Measurement of Tax Effort of State Governments 1m-76 - (1 982) (Somaiya Publications) Rs; 60
Impact of the Personal Income Tax (1 982) Rs. 35
Resource Mobilisation in the Private Corporate a t o r a (1 982) Rs. 50 .
Fiscal Incentives and Corporate Tax Saving (1 983) Rs. 40
Tax Treatment of Private Trusts , (.I 983) Rs. 140
Central Gov~nment Expenditure: Growth, Structure and Inmet (196061 to 797879)
' -
55984) Rs. 80 . .
Entry Tax as Alternative to Octroi (1 984) Rs. 80
Information System and Evasion of Sales Tax in Tamil Nadu (1 981) Rs. 50
Evasion of Excise Duties in India: Studies of Copper, Plastics and Cottan Textile Fabrics
(1986) Rs. 180 Aspects of the Black Economy in India
(also known as the "Black Money Report") (1 986) Reprint Edition Rs. 270
lnffation Accounting and Corporate Taxation (1 987) pS. 90
Sales Tax System in West &ngil (1 987) Rs. 90
Rural Development Allowance (Section 35CC of me Income-tax Act 1961)
A Review (1 988) paperback Rs. 40 Sales Tax System in Delhi
(198%) Rs. 240 1-nvestment Allowance
(Section 32 A of the Income-tax Act, 1961) a A Study (1 989) Rs. 100
Stimulative Effects of Tax Incentive for Charitable Contributions
A Study of Indian Corporate Sector (1 989) Rs. 100