Embed Size (px)
Citation preview
www.pwc.com/globalmoneytree
www.pwc.in
PricewaterhouseCoopers India Pvt Ltd
MoneyTreeTM India Report Q3 2016
Technology Institute
This special report provides summary results of Q3 ’15, Q2 ’16, and Q3 ’16.
Data provided by Venture Intelligence
PwC MoneyTree India – Q3 2016 2
Table of contents
1. Overview 3
2. Analysis of PE investments 4
Investments by industry 5
Investments by stage of development 7
Investments by region Q3 ’15, Q2 ’16 and Q3 ’16 8
Top 20 PE deals Q3 ’16 9
3. Analysis of PE exits 10
Exits by industry 11
Exits by type Q2 ’15, Q1 ’16 and Q2 ’16 12
Top five PE exits Q3 ’16 13
4. Active PE firms 14
5. Sector focus – IT & ITeS sector 15
Total PE investments 16
Investments by stage of development 18
Investments by region 19
Investments by subsector 20
PE exits in the sector 21
Definitions 22
PwC MoneyTree India – Q3 2016 3
1. Overview
The first nine months of 2016 witnessed 12.7 billion USD worth of private equity investments across 473 deals, as compared to 15.9 billion USD across 628 deals in the first nine months of 2015, indicating a 20% decline in deal value and a 25% decline in deal volume.
As compared to the second quarter of 2016, despite a slight decline in the number of deals, deal values were up by 4%, with investments worth 4.3 billion USD across 131 deals as compared to 4.2 billion USD across 156 deals in Q3. Late and Growth stage investments accounted for the majority of funding this quarter, contributing 84% in terms of value.
Investments in this quarter were dominated by the Banking, financial services & insurance (BFSI) sector which accounted for 45% of the total investment value, with 1.9 billion USD across 20 deals. The Information technology & IT-enabled services (IT & ITeS) sector was the second largest sector in terms of value with 1.2 billion USD invested across 68 deals. Healthcare & life sciences and Engineering & construction were other sectors that witnessed increased activity and could attract further investment in the last quarter of the year.
Exit activity picked up considerably as compared to the previous quarter, with 2.3 billion USD across 63 exits. Strategic sales accounted for 62% of the total exit value; an almost four-fold increase as compared to the previous quarter. This quarter also witnessed four private-equity-backed IPOs.
The IT & ITeS sector witnessed significant consolidation, with exits valued at 0.8 billion USD, the majority being strategic sales. This was closely followed by the Healthcare & life sciences sector with o.7 billion USD across 10 exits.
We expect some volatility in the near future as investors assess the implications of the recently concluded US Presidential elections, US Federal Bank stance on rates, and the possibility of the Trans Pacific Partnership being implemented. Having said so, private equity firms continue to express interest in India on account of government reforms and strong macroeconomic indicators. The long-term story for India remains strong with rapid reforms being introduced by the current government. There may be a pause created by the demonetisation scheme introduced by the government. Investors will be in wait-and-watch mode to digest the sectoral impact of the scheme and thereafter we expect capital inflows to be strong.
Sanjeev Krishan Leader, Private Equity and Transaction Services PwC India
PwC MoneyTree India – Q3 2016 4
2. Analysis of PE investments
Total equity investments in PE-backed companies
The third quarter of 2016 has given a strong push to the Indian private equity (PE) investment space.
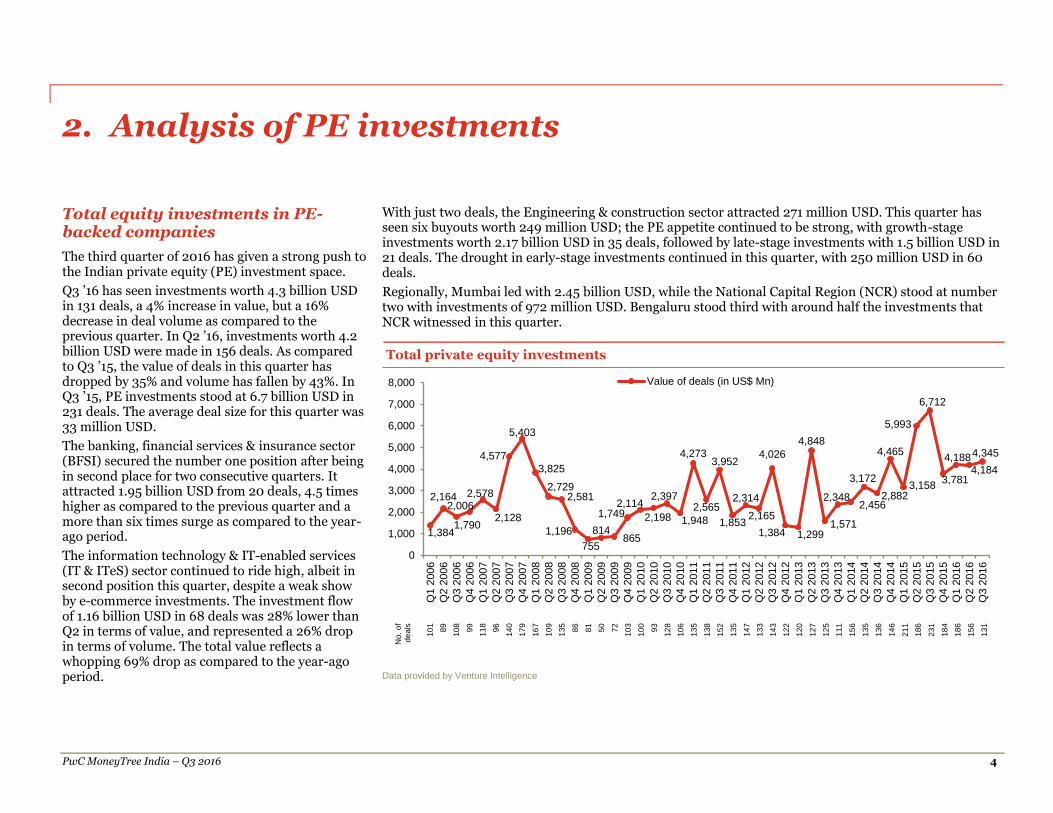
Q3 ’16 has seen investments worth 4.3 billion USD in 131 deals, a 4% increase in value, but a 16% decrease in deal volume as compared to the previous quarter. In Q2 ’16, investments worth 4.2 billion USD were made in 156 deals. As compared to Q3 ’15, the value of deals in this quarter has dropped by 35% and volume has fallen by 43%. In Q3 ’15, PE investments stood at 6.7 billion USD in 231 deals. The average deal size for this quarter was 33 million USD.
The banking, financial services & insurance sector (BFSI) secured the number one position after being in second place for two consecutive quarters. It attracted 1.95 billion USD from 20 deals, 4.5 times higher as compared to the previous quarter and a more than six times surge as compared to the year-ago period.
The information technology & IT-enabled services (IT & ITeS) sector continued to ride high, albeit in second position this quarter, despite a weak show by e-commerce investments. The investment flow of 1.16 billion USD in 68 deals was 28% lower than Q2 in terms of value, and represented a 26% drop in terms of volume. The total value reflects a whopping 69% drop as compared to the year-ago period.
With just two deals, the Engineering & construction sector attracted 271 million USD. This quarter has seen six buyouts worth 249 million USD; the PE appetite continued to be strong, with growth-stage investments worth 2.17 billion USD in 35 deals, followed by late-stage investments with 1.5 billion USD in 21 deals. The drought in early-stage investments continued in this quarter, with 250 million USD in 60 deals.
Regionally, Mumbai led with 2.45 billion USD, while the National Capital Region (NCR) stood at number two with investments of 972 million USD. Bengaluru stood third with around half the investments that NCR witnessed in this quarter.
Total private equity investments
No.
of
de
als
10
1
89
10
8
99
11
8
96
14
0
17
9
16
7
10
9
13
5
86
81
50
72
10
3
10
0
93
12
8
10
6
13
5
13
8
15
2
13
5
14
7
13
3
14
3
12
2
12
0
12
7
12
5
11
1
15
6
13
5
13
6
14
6
21
1
18
6
23
1
18
4
18
6
15
6
13
1
Data provided by Venture Intelligence
1,384
2,164
1,790
2,0062,578
2,128
4,577
5,403
3,825
2,7292,581
1,196
755
814865
1,7492,114
2,198
2,397
1,948
4,273
2,565
3,952
1,853
2,314
2,165
4,026
1,384 1,299
4,848
1,571
2,3482,456
3,172
2,882
4,465
3,158
5,993
6,712
3,781
4,1884,184
4,345
0
1,000
2,000
3,000
4,000
5,000
6,000
7,000
8,000
Q1 2
006
Q2 2
006
Q3 2
006
Q4 2
006
Q1 2
007
Q2 2
007
Q3 2
007
Q4 2
007
Q1 2
008
Q2 2
008
Q3 2
008
Q4 2
008
Q1 2
009
Q2 2
009
Q3 2
009
Q4 2
009
Q1 2
010
Q2 2
010
Q3 2
010
Q4 2
010
Q1 2
011
Q2 2
011
Q3 2
011
Q4 2
011
Q1 2
012
Q2 2
012
Q3 2
012
Q4 2
012
Q1 2
013
Q2 2
013
Q3 2
013
Q4 2
013
Q1 2
014
Q2 2
014
Q3 2
014
Q4 2
014
Q1 2
015
Q2 2
015
Q3 2
015
Q4 2
015
Q1 2
016
Q2 2
016
Q3 2
016
Value of deals (in US$ Mn)
Analysis of private equity investments
PwC MoneyTree India – Q3 2016 5
Investments by industry Q3 ’15, Q2 ’16 and Q3 ’16
The BFSI sector dominated this quarter, a change from the dominance of the IT & ITeS sector in the second quarter of the year. In just 20 deals, this sector attracted 1.94 billion USD, which is 4.5 times higher than the 440 million USD in 13 deals it attracted in the previous quarter and more than six times higher than the 317 million USD in nine deals it received in Q3 ’15.
The IT & ITeS sector occupied the number two position and witnessed a reasonably good deal flow in this quarter, with 68 deals worth 1.16 billion USD compared to 92 deals worth 1.6 billion USD in the previous quarter, but much lower than the 3.72 billion USD in 135 deals seen in Q3 '15.
“BFSI has seen significantly higher investment quarter on quarter even as overall investment flow is lower. We expect that distressed asset players, fintechs, real estate funds and even non-banking financial companies (NBFCs) may see continuing investment despite global and domestic head winds for Indian deals in the next few quarters.”
Bharti Gupta Ramola Leader, Financial Services PwC India
“This quarter saw two major developments, the US Elections and the demonetisation scheme by the Indian government, which might have significant long-term impact on the Technology and eCommerce industry. In terms of activity in the IT & ITeS space, deals continue to happen, albeit at a slower pace. This year has seen the startup market undergoing a valuation correction, and several startups have begun controlling their burn rate and are focusing on strong unit economics. The Fintech space saw several marquee investments this quarter and we saw the addition of another Indian company in the list of Unicorn startups, when Hike Messenger raised USD 175 million, at a valuation of 1.4 billion USD.”
Sandeep Ladda Leader, Technology PwC India
Analysis of private equity investments
PwC MoneyTree India – Q3 2016 6
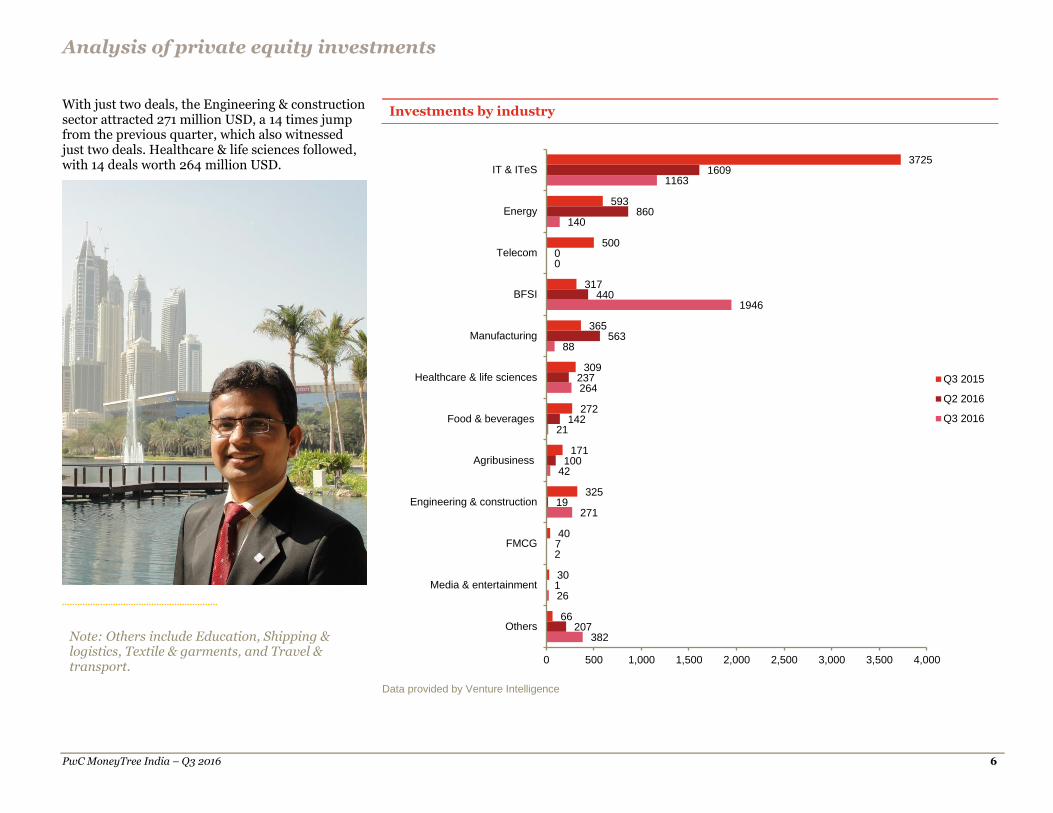
With just two deals, the Engineering & construction sector attracted 271 million USD, a 14 times jump from the previous quarter, which also witnessed just two deals. Healthcare & life sciences followed, with 14 deals worth 264 million USD.
Investments by industry
Data provided by Venture Intelligence
382
26
2
271
42
21
264
88
1946
0
140
1163
207
1
7
19
100
142
237
563
440
0
860
1609
66
30
40
325
171
272
309
365
317
500
593
3725
0 500 1,000 1,500 2,000 2,500 3,000 3,500 4,000
Others
Media & entertainment
FMCG
Engineering & construction
Agribusiness
Food & beverages
Healthcare & life sciences
Manufacturing
BFSI
Telecom
Energy
IT & ITeS
Q3 2015
Q2 2016
Q3 2016
Note: Others include Education, Shipping & logistics, Textile & garments, and Travel & transport.
Analysis of private equity investments
PwC MoneyTree India – Q3 2016 7
Investments by stage of development Q3 ’15, Q2 ’16 and Q3 ’16
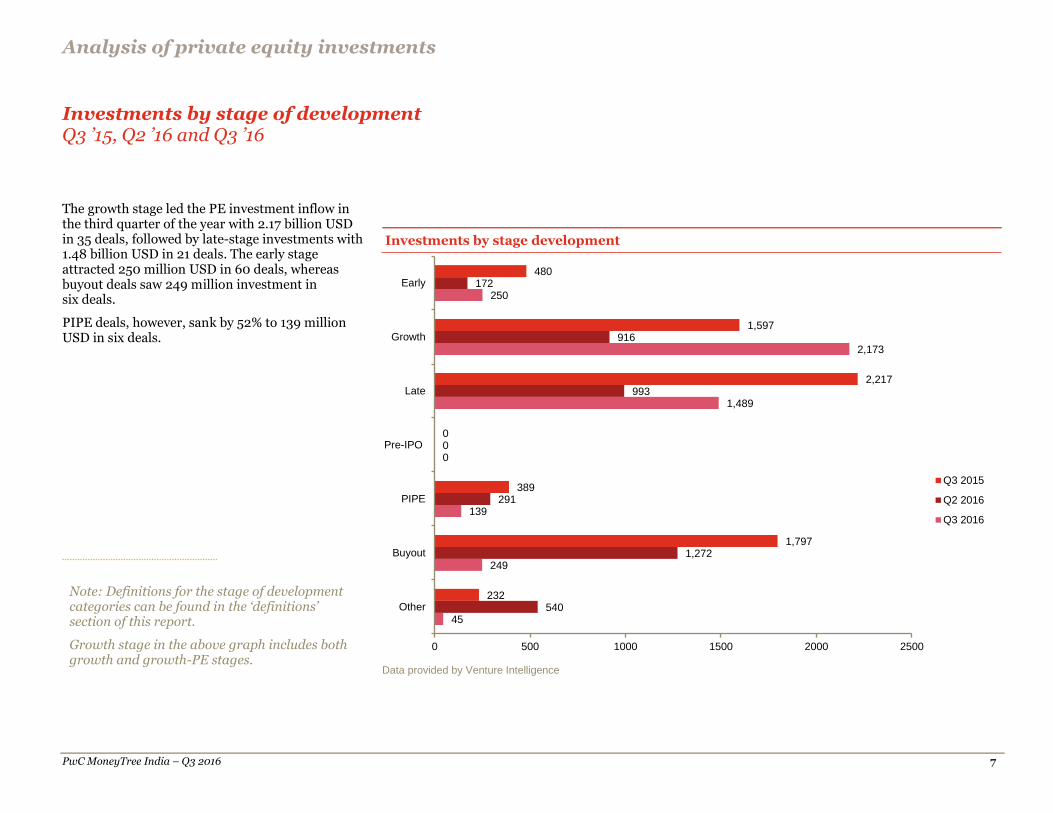
The growth stage led the PE investment inflow in the third quarter of the year with 2.17 billion USD in 35 deals, followed by late-stage investments with 1.48 billion USD in 21 deals. The early stage attracted 250 million USD in 60 deals, whereas buyout deals saw 249 million investment in six deals.
PIPE deals, however, sank by 52% to 139 million USD in six deals.
Data provided by Venture Intelligence
45
249
139
0
1,489
2,173
250
540
1,272
291
0
993
916
172
232
1,797
389
0
2,217
1,597
480
0 500 1000 1500 2000 2500
Other
Buyout
PIPE
Pre-IPO
Late
Growth
Early
Q3 2015
Q2 2016
Q3 2016
Investments by stage development
Note: Definitions for the stage of development categories can be found in the ‘definitions’ section of this report.
Growth stage in the above graph includes both growth and growth-PE stages.
Analysis of private equity investments
PwC MoneyTree India – Q3 2016 8
Investments by region Q3 ’15, Q2 ’16 and Q3 ’16
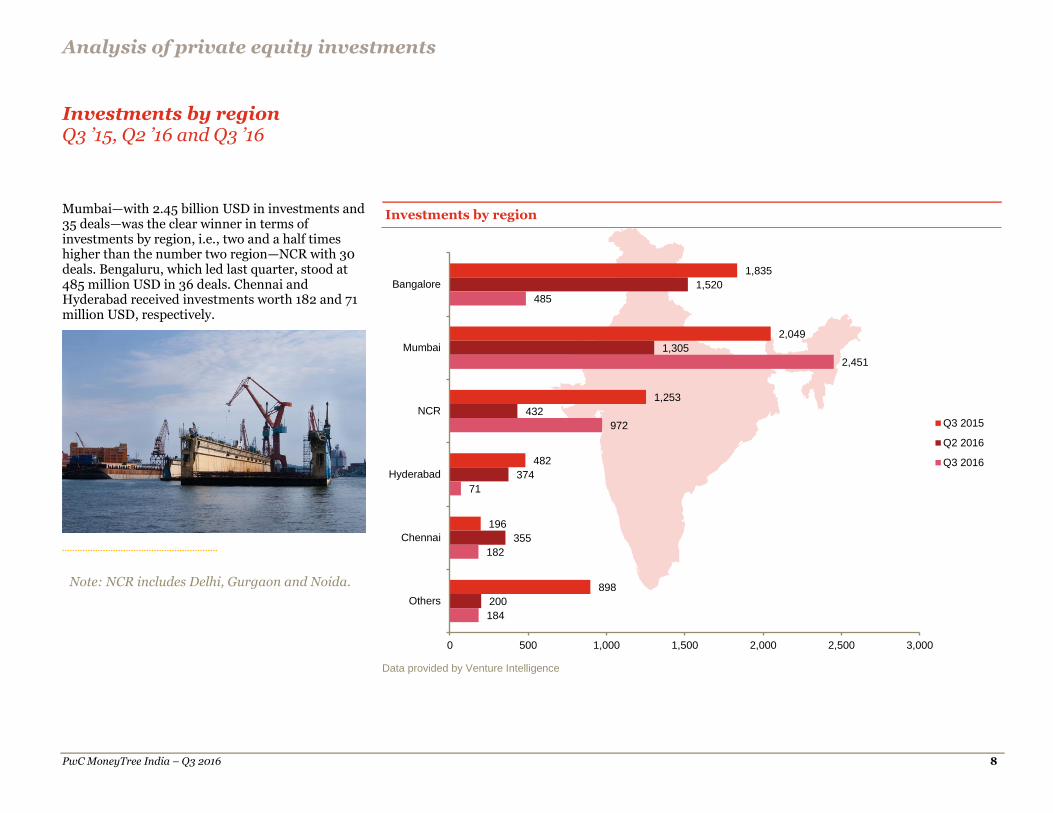
Mumbai—with 2.45 billion USD in investments and 35 deals—was the clear winner in terms of investments by region, i.e., two and a half times higher than the number two region—NCR with 30 deals. Bengaluru, which led last quarter, stood at 485 million USD in 36 deals. Chennai and Hyderabad received investments worth 182 and 71 million USD, respectively.
Data provided by Venture Intelligence
1,835
2,049
1,253
482
196
898
1,520
1,305
432
374
355
200
485
2,451
972
71
182
184
0 500 1,000 1,500 2,000 2,500 3,000
Bangalore
Mumbai
NCR
Hyderabad
Chennai
Others
Q3 2015
Q2 2016
Q3 2016
Investments by region
Note: NCR includes Delhi, Gurgaon and Noida.
Analysis of private equity investments
PwC MoneyTree India – Q3 2016 9
Top 20 PE deals Q3 ’16
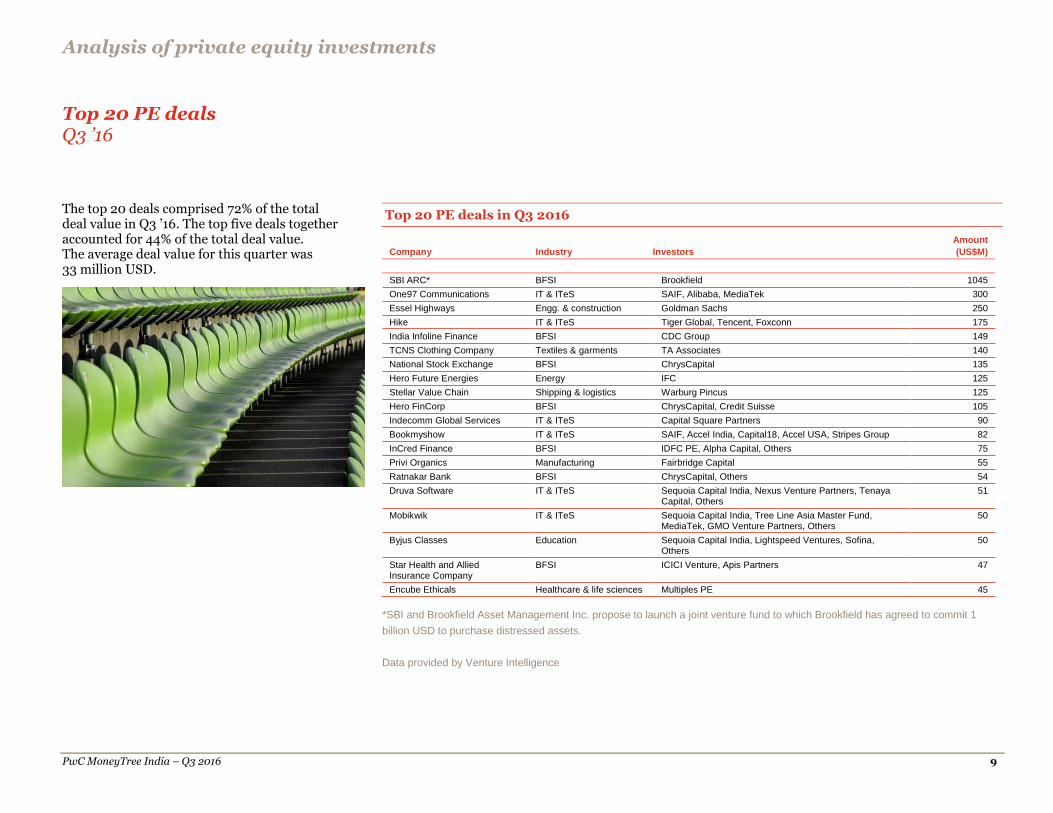
The top 20 deals comprised 72% of the total deal value in Q3 ’16. The top five deals together accounted for 44% of the total deal value. The average deal value for this quarter was 33 million USD.
Top 20 PE deals in Q3 2016
Company
Industry
Investors
Amount
(US$M)
SBI ARC* BFSI Brookfield 1045
One97 Communications IT & ITeS SAIF, Alibaba, MediaTek 300
Essel Highways Engg. & construction Goldman Sachs 250
Hike IT & ITeS Tiger Global, Tencent, Foxconn 175
India Infoline Finance BFSI CDC Group 149
TCNS Clothing Company Textiles & garments TA Associates 140
National Stock Exchange BFSI ChrysCapital 135
Hero Future Energies Energy IFC 125
Stellar Value Chain Shipping & logistics Warburg Pincus 125
Hero FinCorp BFSI ChrysCapital, Credit Suisse 105
Indecomm Global Services IT & ITeS Capital Square Partners 90
Bookmyshow IT & ITeS SAIF, Accel India, Capital18, Accel USA, Stripes Group 82
InCred Finance BFSI IDFC PE, Alpha Capital, Others 75
Privi Organics Manufacturing Fairbridge Capital 55
Ratnakar Bank BFSI ChrysCapital, Others 54
Druva Software IT & ITeS Sequoia Capital India, Nexus Venture Partners, Tenaya Capital, Others
51
Mobikwik IT & ITeS Sequoia Capital India, Tree Line Asia Master Fund, MediaTek, GMO Venture Partners, Others
50
Byjus Classes Education Sequoia Capital India, Lightspeed Ventures, Sofina, Others
50
Star Health and Allied Insurance Company
BFSI ICICI Venture, Apis Partners 47
Encube Ethicals Healthcare & life sciences Multiples PE 45
*SBI and Brookfield Asset Management Inc. propose to launch a joint venture fund to which Brookfield has agreed to commit 1
billion USD to purchase distressed assets.
Data provided by Venture Intelligence
PwC MoneyTree India – Q3 2016 10
3. Analysis of PE exits
Total PE exits Q3 ’16
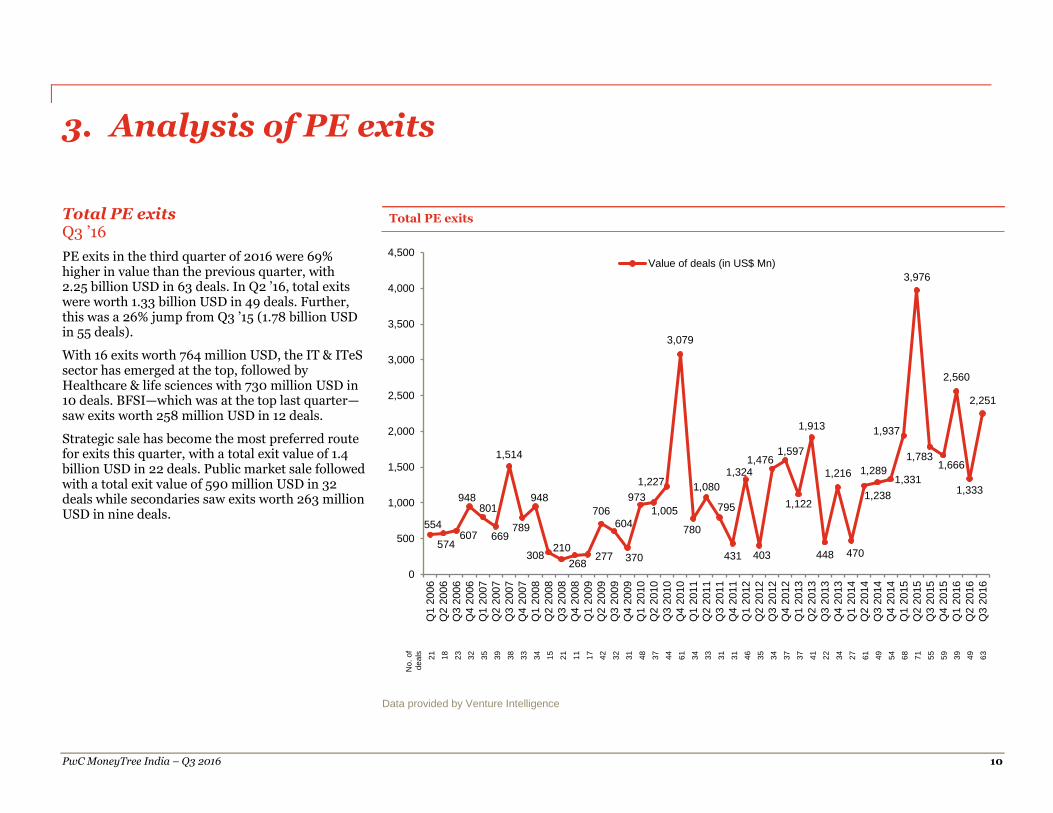
PE exits in the third quarter of 2016 were 69% higher in value than the previous quarter, with 2.25 billion USD in 63 deals. In Q2 ’16, total exits were worth 1.33 billion USD in 49 deals. Further, this was a 26% jump from Q3 ’15 (1.78 billion USD in 55 deals).
With 16 exits worth 764 million USD, the IT & ITeS sector has emerged at the top, followed by Healthcare & life sciences with 730 million USD in 10 deals. BFSI—which was at the top last quarter—saw exits worth 258 million USD in 12 deals.
Strategic sale has become the most preferred route for exits this quarter, with a total exit value of 1.4 billion USD in 22 deals. Public market sale followed with a total exit value of 590 million USD in 32 deals while secondaries saw exits worth 263 million USD in nine deals.
Total PE exits
No.
of
de
als
21
18
23
32
35
39
38
33
34
15
21
11
17
42
32
31
48
37
44
61
34
33
31
31
46
35
34
37
37
41
22
34
27
61
49
54
68
71
55
59
39
49
63
Data provided by Venture Intelligence
554
574607
948801
669
1,514
789
948
308210
268277
706
604
370
973
1,005
1,227
3,079
780
1,080
795
431
1,324
403
1,4761,597
1,122
1,913
448
1,216
470
1,238
1,2891,331
1,937
3,976
1,7831,666
2,560
1,333
2,251
0
500
1,000
1,500
2,000
2,500
3,000
3,500
4,000
4,500
Q1 2
006
Q2 2
006
Q3 2
006
Q4 2
006
Q1 2
007
Q2 2
007
Q3 2
007
Q4 2
007
Q1 2
008
Q2 2
008
Q3 2
008
Q4 2
008
Q1 2
009
Q2 2
009
Q3 2
009
Q4 2
009
Q1 2
010
Q2 2
010
Q3 2
010
Q4 2
010
Q1 2
011
Q2 2
011
Q3 2
011
Q4 2
011
Q1 2
012
Q2 2
012
Q3 2
012
Q4 2
012
Q1 2
013
Q2 2
013
Q3 2
013
Q4 2
013
Q1 2
014
Q2 2
014
Q3 2
014
Q4 2
014
Q1 2
015
Q2 2
015
Q3 2
015
Q4 2
015
Q1 2
016
Q2 2
016
Q3 2
016
Value of deals (in US$ Mn)
Analysis of PE exits
PwC MoneyTree India – Q3 2016 11
Exits by industry Q3 ’15, Q2 ’16 and Q3 ’16
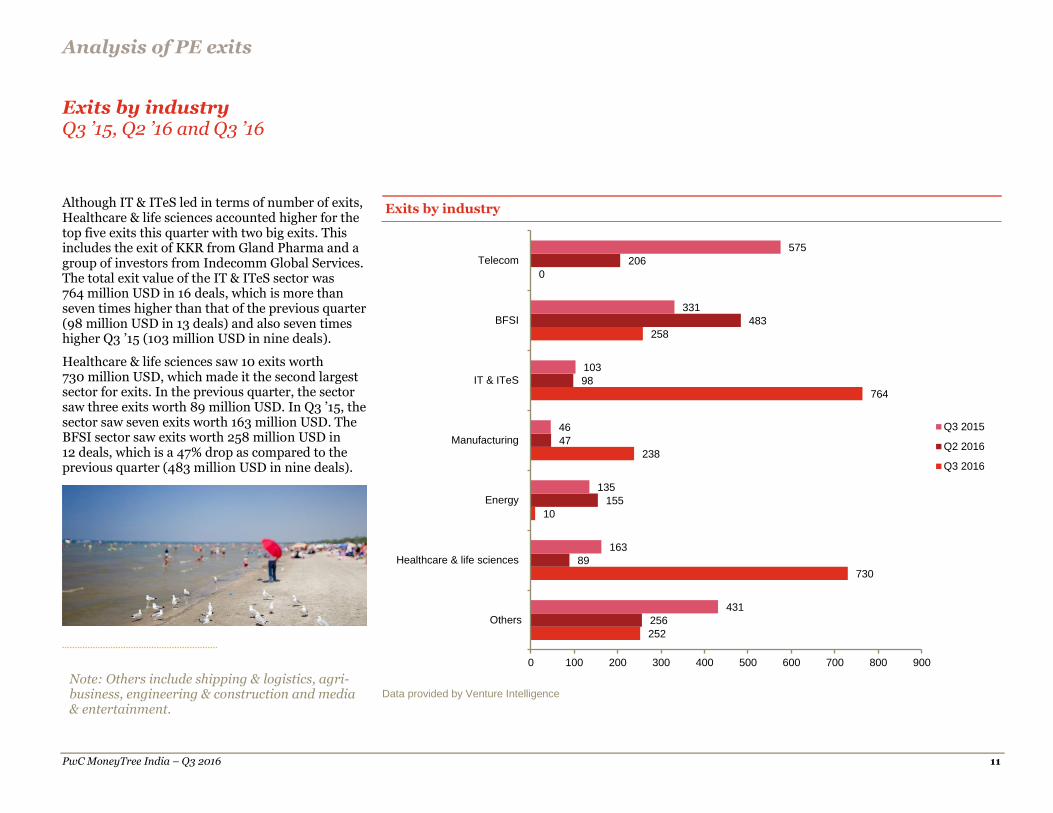
Although IT & ITeS led in terms of number of exits, Healthcare & life sciences accounted higher for the top five exits this quarter with two big exits. This includes the exit of KKR from Gland Pharma and a group of investors from Indecomm Global Services. The total exit value of the IT & ITeS sector was 764 million USD in 16 deals, which is more than seven times higher than that of the previous quarter (98 million USD in 13 deals) and also seven times higher Q3 ’15 (103 million USD in nine deals).
Healthcare & life sciences saw 10 exits worth 730 million USD, which made it the second largest sector for exits. In the previous quarter, the sector saw three exits worth 89 million USD. In Q3 ’15, the sector saw seven exits worth 163 million USD. The BFSI sector saw exits worth 258 million USD in 12 deals, which is a 47% drop as compared to the previous quarter (483 million USD in nine deals).
Data provided by Venture Intelligence
252
730
10
238
764
258
0
256
89
155
47
98
483
206
431
163
135
46
103
331
575
0 100 200 300 400 500 600 700 800 900
Others
Healthcare & life sciences
Energy
Manufacturing
IT & ITeS
BFSI
Telecom
Q3 2015
Q2 2016
Q3 2016
Exits by industry
Note: Others include shipping & logistics, agri-business, engineering & construction and media & entertainment.
Analysis of PE exits
PwC MoneyTree India – Q3 2016 12
Exits by type Q2 ’15, Q1 ’16 and Q2 ’16
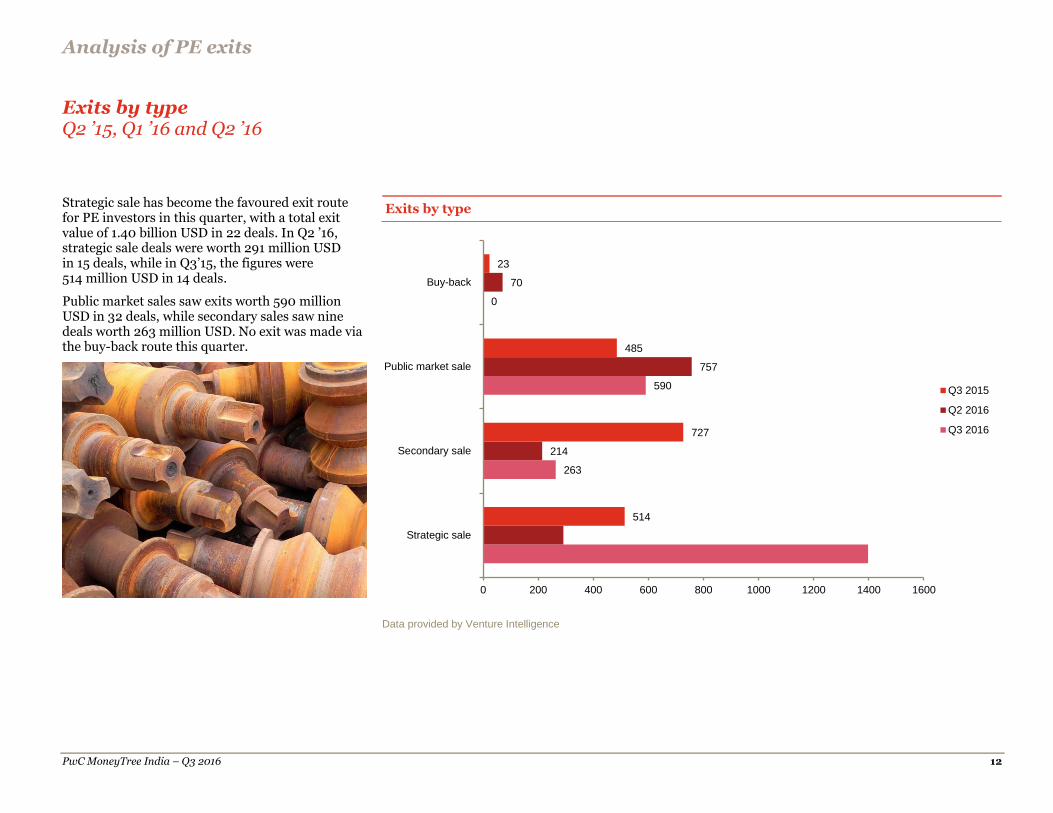
Strategic sale has become the favoured exit route for PE investors in this quarter, with a total exit value of 1.40 billion USD in 22 deals. In Q2 ’16, strategic sale deals were worth 291 million USD in 15 deals, while in Q3’15, the figures were 514 million USD in 14 deals.
Public market sales saw exits worth 590 million USD in 32 deals, while secondary sales saw nine deals worth 263 million USD. No exit was made via the buy-back route this quarter.
Data provided by Venture Intelligence
263
590
0
214
757
70
514
727
485
23
0 200 400 600 800 1000 1200 1400 1600
Strategic sale
Secondary sale
Public market sale
Buy-back
Q3 2015
Q2 2016
Q3 2016
Exits by type
Analysis of PE exits
PwC MoneyTree India – Q3 2016 13
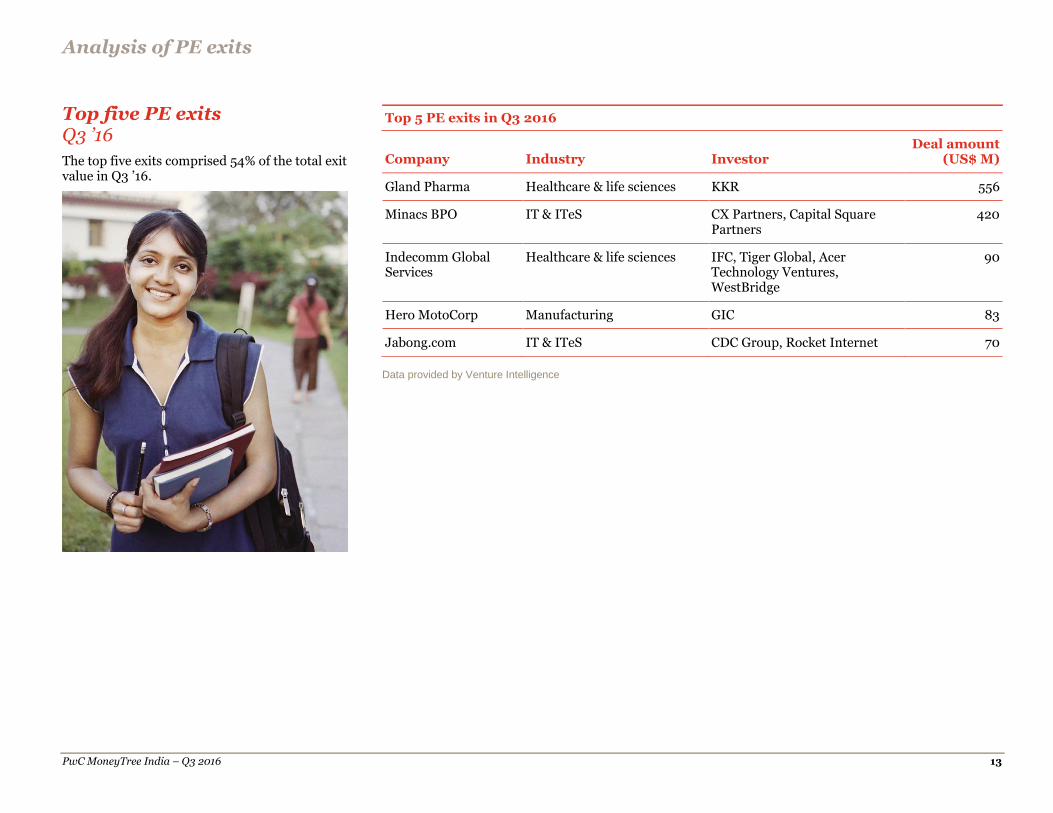
Top five PE exits Q3 ’16
The top five exits comprised 54% of the total exit value in Q3 ’16.
Top 5 PE exits in Q3 2016
Company Industry Investor Deal amount
(US$ M)
Gland Pharma Healthcare & life sciences KKR 556
Minacs BPO IT & ITeS CX Partners, Capital Square Partners
420
Indecomm Global Services
Healthcare & life sciences IFC, Tiger Global, Acer Technology Ventures, WestBridge
90
Hero MotoCorp Manufacturing GIC 83
Jabong.com IT & ITeS CDC Group, Rocket Internet 70
Data provided by Venture Intelligence
PwC MoneyTree India – Q3 2016 14
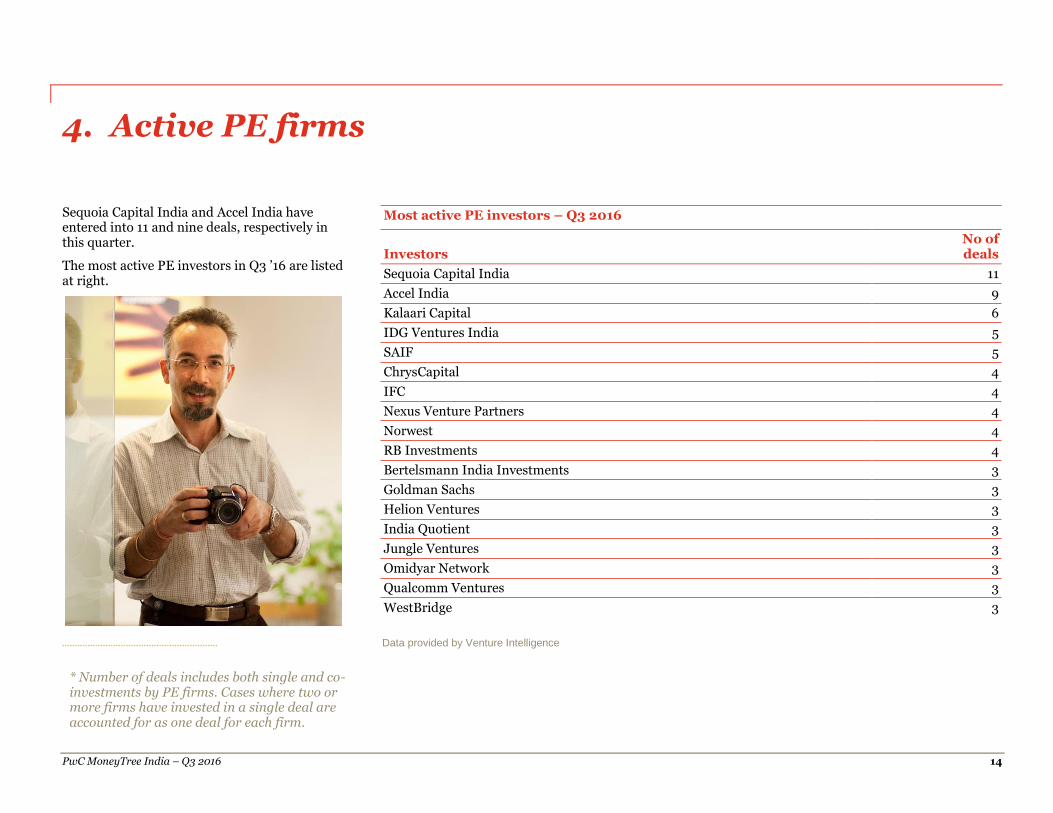
4. Active PE firms
Sequoia Capital India and Accel India have entered into 11 and nine deals, respectively in this quarter.
The most active PE investors in Q3 ’16 are listed at right.
Data provided by Venture Intelligence
* Number of deals includes both single and co-investments by PE firms. Cases where two or more firms have invested in a single deal are accounted for as one deal for each firm.
Most active PE investors – Q3 2016
Investors No of deals
Sequoia Capital India 11
Accel India 9
Kalaari Capital 6
IDG Ventures India 5
SAIF 5
ChrysCapital 4
IFC 4
Nexus Venture Partners 4
Norwest 4
RB Investments 4
Bertelsmann India Investments 3
Goldman Sachs 3
Helion Ventures 3
India Quotient 3
Jungle Ventures 3
Omidyar Network 3
Qualcomm Ventures 3
WestBridge 3
PwC MoneyTree India – Q3 2016 15
5. Sector focus – IT & ITeS sector
The technology sector in India is undergoing a significant change driven by movements in demand and supply equations, and technological disruption as well as socioeconomic and geopolitical factors. Recently, Nasscom lowered its IT export growth target to 8-10% for 2016-17; at the beginning of the year Nasscom had projected a 10-12% growth rate for the Indian IT & ITeS market.* The change in business environment is being influenced by the forces of global macroeconomic headwinds, e.g., the US election, Brexit, oil price fluctuations and volatility in currency and financial markets, whereas the demand-supply equation is being impacted by trends like IT outsourcing and vendor consolidation. In terms of trends, business-driven technology spending has been growing at a faster rate than traditional spending. Digitalisation is transforming business models as companies look to reinvent themselves while traditional outsourcing is inching towards next-gen IT outsourcing, where the focus is on integrated services delivery, artificial intelligence, automation and cloud. The technological breakthrough megatrends are manifesting themselves in a proliferation of technologies. PwC’s Essential Eight, a shortlist of emerging technologies to watch out for, have the potential to transform business models across all industries and drive significant organisational change. These emerging technologies are directly impacting businesses and are changing buyer behavior, making it business-centric. Buying decisions are now being strongly influenced by business leaders, in addition to the IT leaders in an organisation, as companies realise the impact of technologies like 3D printing, robotics and the Internet of Things on their organisations. To remain relevant and to succeed, an emerging technology strategy will have to be a part of every company’s corporate strategy. Another important business development this quarter has been the Indian government’s demonetisation scheme which banned notes of higher denominations in order to curb the flow of black money and corruption. The scheme is likely to help build a cash-less economy, thereby helping businesses to pursue higher growth in digital driven areas. Along with the upcoming Goods and Services Tax (GST) launch, these initiatives are likely to help strengthen the economy and improve the ease of doing business in India. An important growth area in terms of deals activity this quarter has been the Mobile Wallets subsector and recent government initiatives have triggered the strong adoption of electronic payments. We have seen explosive growth for digital transactions and usage of mobile wallets by consumers and mobile in point of sale (PoS) by merchants. Mobile wallets are being used for a variety of purposes from bill payments to food delivery and travel. Further, the launch of a unified payment interface (UPI) will make transactions easier and aid in overall growth. Mobile Wallet companies will have to focus on customer retention and building customer loyalty as well as challenges around cyber security. Achieving scale with positive unit economics and acquiring greater wallet share of the target customer segment will also be important for the growth of the subsector. Sandeep Ladda Leader, Technology PwC India *http://economictimes.indiatimes.com/tech/ites/nasscom-cuts-it-export-growth-forecast-to-8-10-for-2016-17/articleshow/55457227.cms
Sector focus – IT & ITeS sector
PwC MoneyTree India – Q3 2016 16
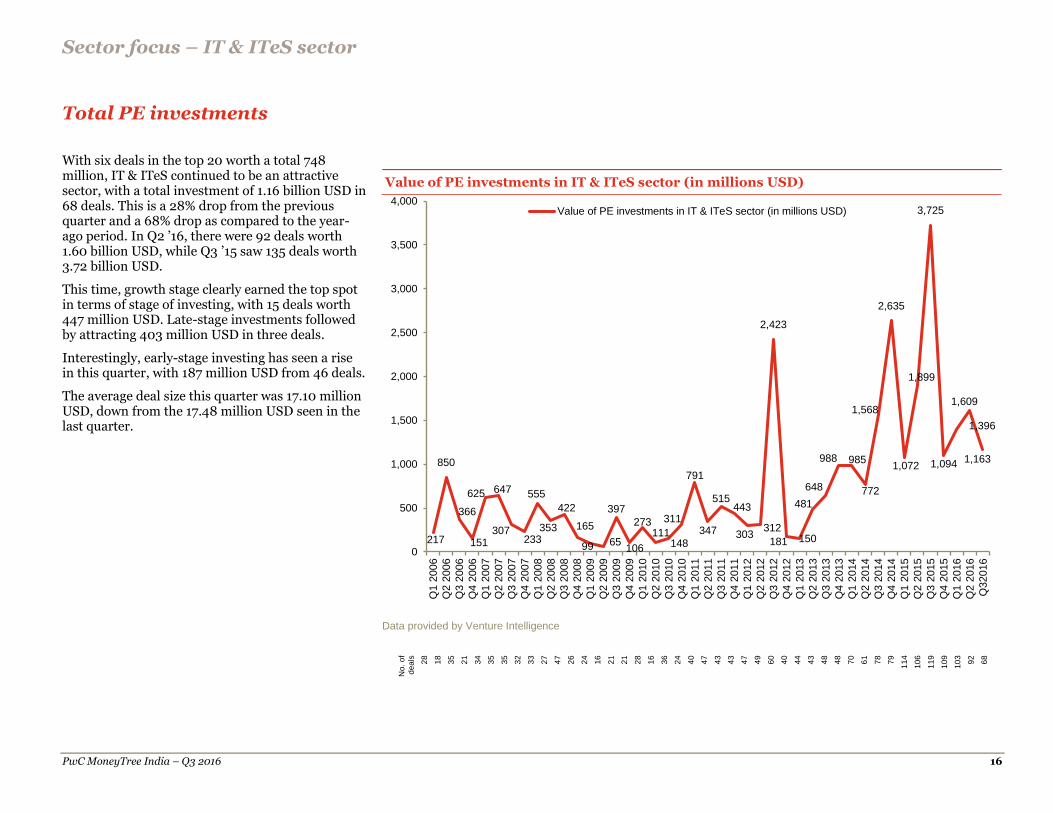
Total PE investments
With six deals in the top 20 worth a total 748 million, IT & ITeS continued to be an attractive sector, with a total investment of 1.16 billion USD in 68 deals. This is a 28% drop from the previous quarter and a 68% drop as compared to the year-ago period. In Q2 ’16, there were 92 deals worth 1.60 billion USD, while Q3 ’15 saw 135 deals worth 3.72 billion USD.
This time, growth stage clearly earned the top spot in terms of stage of investing, with 15 deals worth 447 million USD. Late-stage investments followed by attracting 403 million USD in three deals.
Interestingly, early-stage investing has seen a rise in this quarter, with 187 million USD from 46 deals.
The average deal size this quarter was 17.10 million USD, down from the 17.48 million USD seen in the last quarter.
Data provided by Venture Intelligence
No.
of
de
als
28
18
35
21
34
35
35
32
33
27
47
26
24
16
21
21
28
16
36
24
40
47
43
43
47
49
60
40
44
43
48
48
70
61
78
79
11
4
10
6
11
9
10
9
10
3
92
68
217
850
366
151
625 647
307233
555
353
422
165
99 65
397
106
273111
148
311
791
347
515443
303312
2,423
181 150
481
648
988 985
772
1,568
2,635
1,072
1,899
3,725
1,094
1,396
1,609
1,163
0
500
1,000
1,500
2,000
2,500
3,000
3,500
4,000
Q1 2
006
Q2 2
006
Q3 2
006
Q4 2
006
Q1 2
007
Q2 2
007
Q3 2
007
Q4 2
007
Q1 2
008
Q2 2
008
Q3 2
008
Q4 2
008
Q1 2
009
Q2 2
009
Q3 2
009
Q4 2
009
Q1 2
010
Q2 2
010
Q3 2
010
Q4 2
010
Q1 2
011
Q2 2
011
Q3 2
011
Q4 2
011
Q1 2
012
Q2 2
012
Q3 2
012
Q4 2
012
Q1 2
013
Q2 2
013
Q3 2
013
Q4 2
013
Q1 2
014
Q2 2
014
Q3 2
014
Q4 2
014
Q1 2
015
Q2 2
015
Q3 2
015
Q4 2
015
Q1 2
016
Q2 2
016
Q32016
Value of PE investments in IT & ITeS sector (in millions USD)
Value of PE investments in IT & ITeS sector (in millions USD)
Sector focus – IT & ITeS sector
PwC MoneyTree India – Q3 2016 17
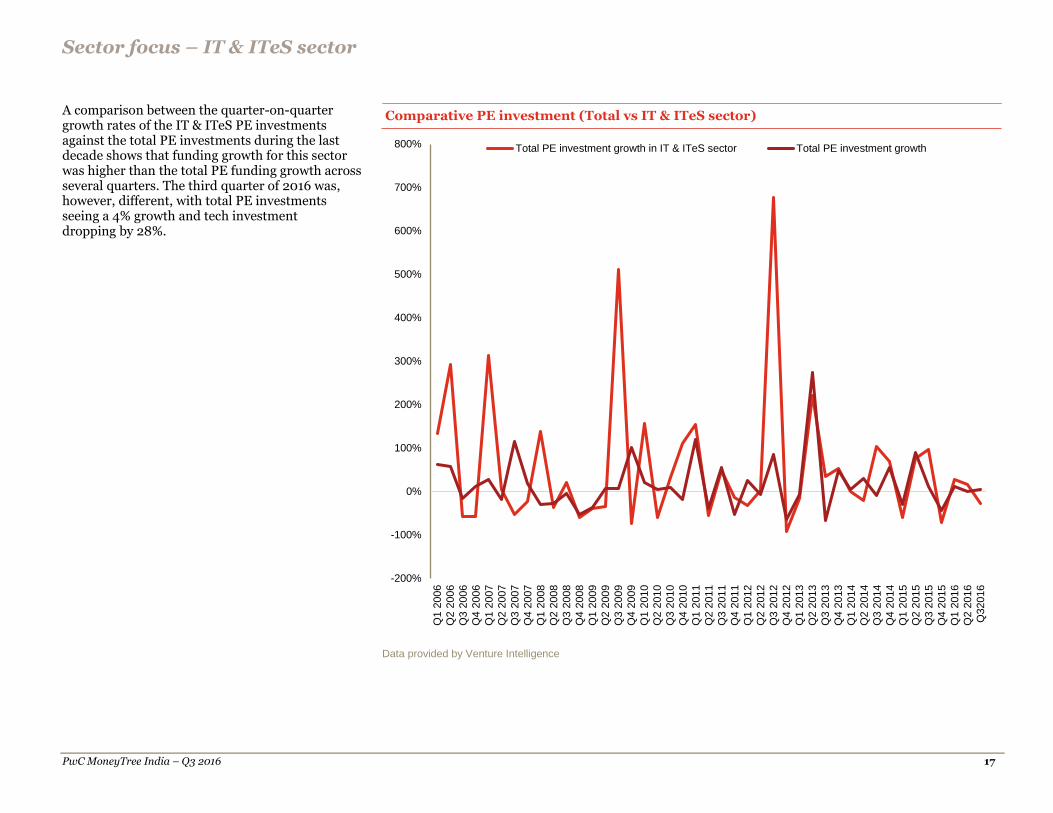
A comparison between the quarter-on-quarter growth rates of the IT & ITeS PE investments against the total PE investments during the last decade shows that funding growth for this sector was higher than the total PE funding growth across several quarters. The third quarter of 2016 was, however, different, with total PE investments seeing a 4% growth and tech investment dropping by 28%.
Data provided by Venture Intelligence
-200%
-100%
0%
100%
200%
300%
400%
500%
600%
700%
800%
Q1 2
006
Q2 2
006
Q3 2
006
Q4 2
006
Q1 2
007
Q2 2
007
Q3 2
007
Q4 2
007
Q1 2
008
Q2 2
008
Q3 2
008
Q4 2
008
Q1 2
009
Q2 2
009
Q3 2
009
Q4 2
009
Q1 2
010
Q2 2
010
Q3 2
010
Q4 2
010
Q1 2
011
Q2 2
011
Q3 2
011
Q4 2
011
Q1 2
012
Q2 2
012
Q3 2
012
Q4 2
012
Q1 2
013
Q2 2
013
Q3 2
013
Q4 2
013
Q1 2
014
Q2 2
014
Q3 2
014
Q4 2
014
Q1 2
015
Q2 2
015
Q3 2
015
Q4 2
015
Q1 2
016
Q2 2
016
Q32016
Total PE investment growth in IT & ITeS sector Total PE investment growth
Comparative PE investment (Total vs IT & ITeS sector)
Sector focus – IT & ITeS sector
PwC MoneyTree India – Q3 2016 18
Investments by stage of development Q3 ’15, Q2 ’16 and Q3 ’16
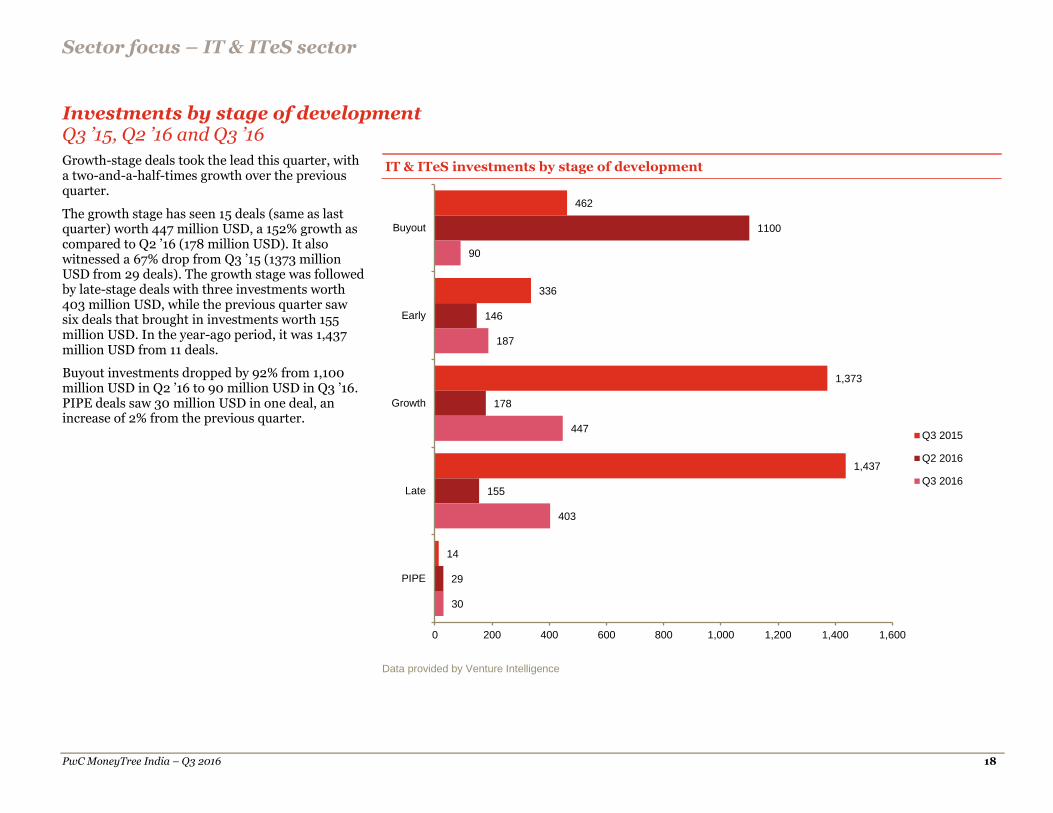
Growth-stage deals took the lead this quarter, with a two-and-a-half-times growth over the previous quarter.
The growth stage has seen 15 deals (same as last quarter) worth 447 million USD, a 152% growth as compared to Q2 ’16 (178 million USD). It also witnessed a 67% drop from Q3 ’15 (1373 million USD from 29 deals). The growth stage was followed by late-stage deals with three investments worth 403 million USD, while the previous quarter saw six deals that brought in investments worth 155 million USD. In the year-ago period, it was 1,437 million USD from 11 deals.
Buyout investments dropped by 92% from 1,100 million USD in Q2 ’16 to 90 million USD in Q3 ’16. PIPE deals saw 30 million USD in one deal, an increase of 2% from the previous quarter.
Data provided by Venture Intelligence
462
336
1,373
1,437
14
1100
146
178
155
29
90
187
447
403
30
0 200 400 600 800 1,000 1,200 1,400 1,600
Buyout
Early
Growth
Late
PIPE
Q3 2015
Q2 2016
Q3 2016
IT & ITeS investments by stage of development
Sector focus – IT & ITeS sector
PwC MoneyTree India – Q3 2016 19
Investments by region Q3 ’15, Q2 ’16 and Q3 ’16
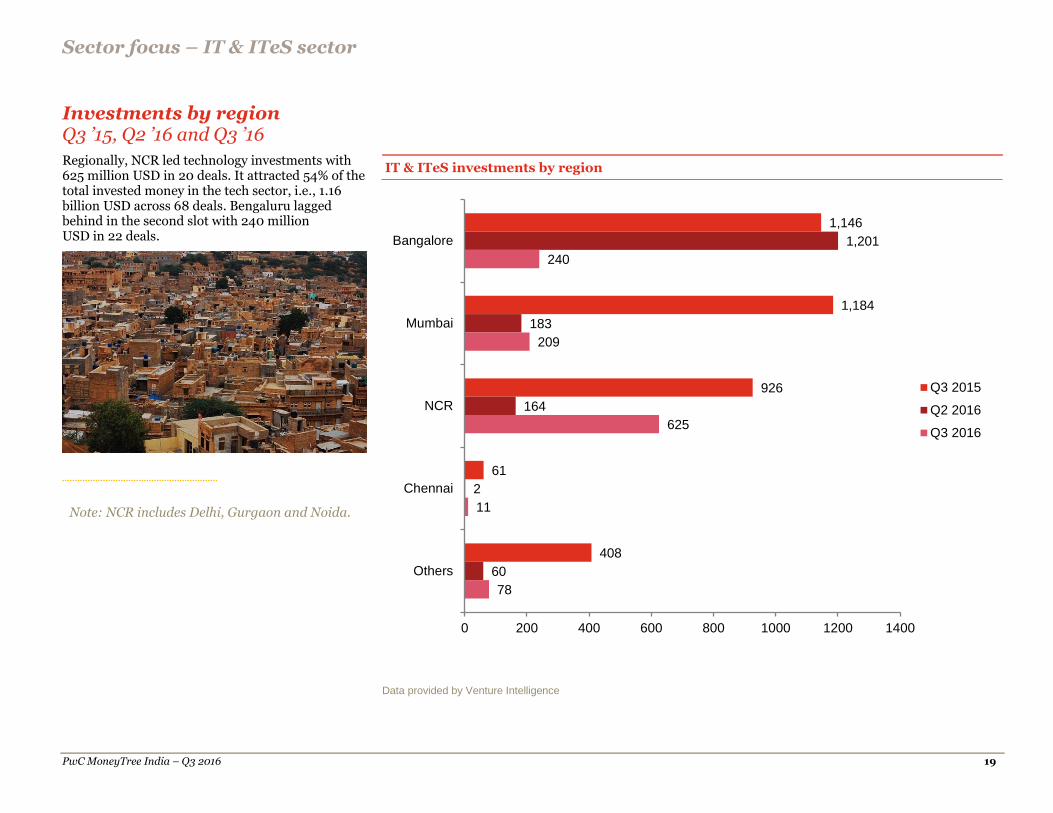
Regionally, NCR led technology investments with 625 million USD in 20 deals. It attracted 54% of the total invested money in the tech sector, i.e., 1.16 billion USD across 68 deals. Bengaluru lagged behind in the second slot with 240 million USD in 22 deals.
IT & ITeS investments by region
Data provided by Venture Intelligence
1,146
1,184
926
61
408
1,201
183
164
2
60
240
209
625
11
78
0 200 400 600 800 1000 1200 1400
Bangalore
Mumbai
NCR
Chennai
Others
Q3 2015
Q2 2016
Q3 2016
Note: NCR includes Delhi, Gurgaon and Noida.
Sector focus – IT & ITeS sector
PwC MoneyTree India – Q3 2016 20
Investments by subsector Q3 ’15, Q2 ’16 and Q3 ’16
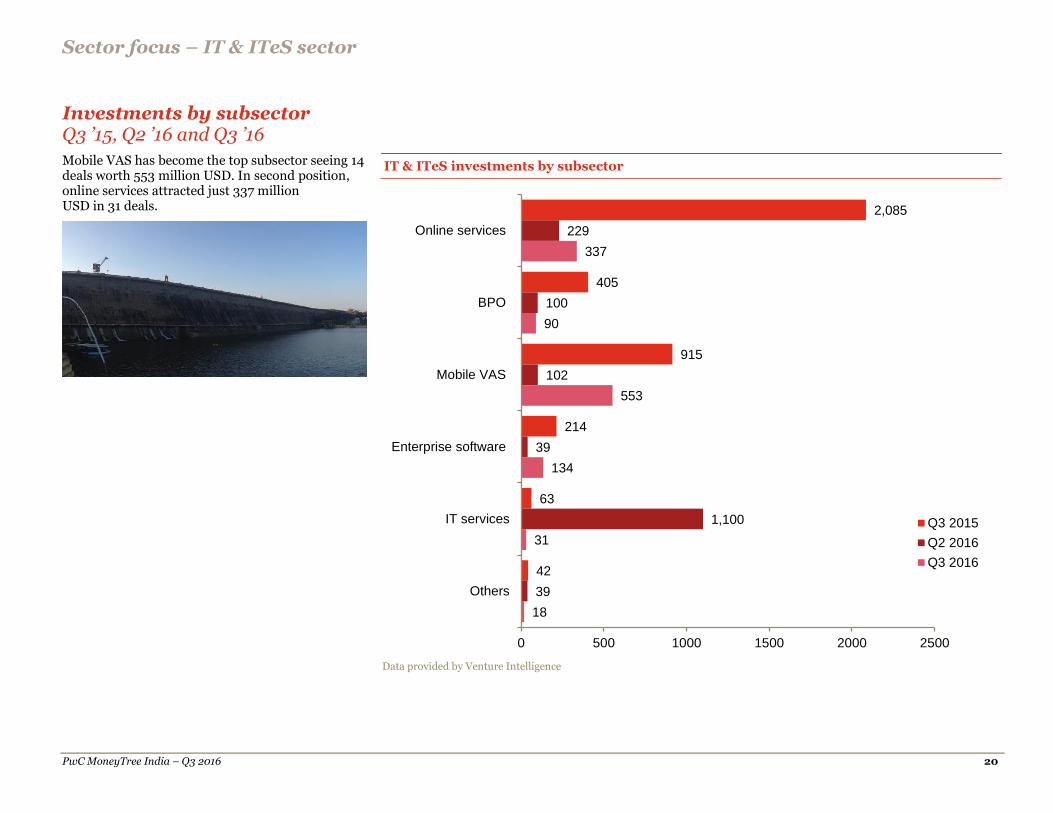
Mobile VAS has become the top subsector seeing 14 deals worth 553 million USD. In second position, online services attracted just 337 million USD in 31 deals.
Data provided by Venture Intelligence
2,085
405
915
214
63
42
229
100
102
39
1,100
39
337
90
553
134
31
18
0 500 1000 1500 2000 2500
Online services
BPO
Mobile VAS
Enterprise software
IT services
Others
Q3 2015
Q2 2016
Q3 2016
IT & ITeS investments by subsector
Sector focus – IT & ITeS sector
PwC MoneyTree India – Q3 2016 21
PE exits in the sector Q2 ’15, Q1 ’16 and Q2 ’16
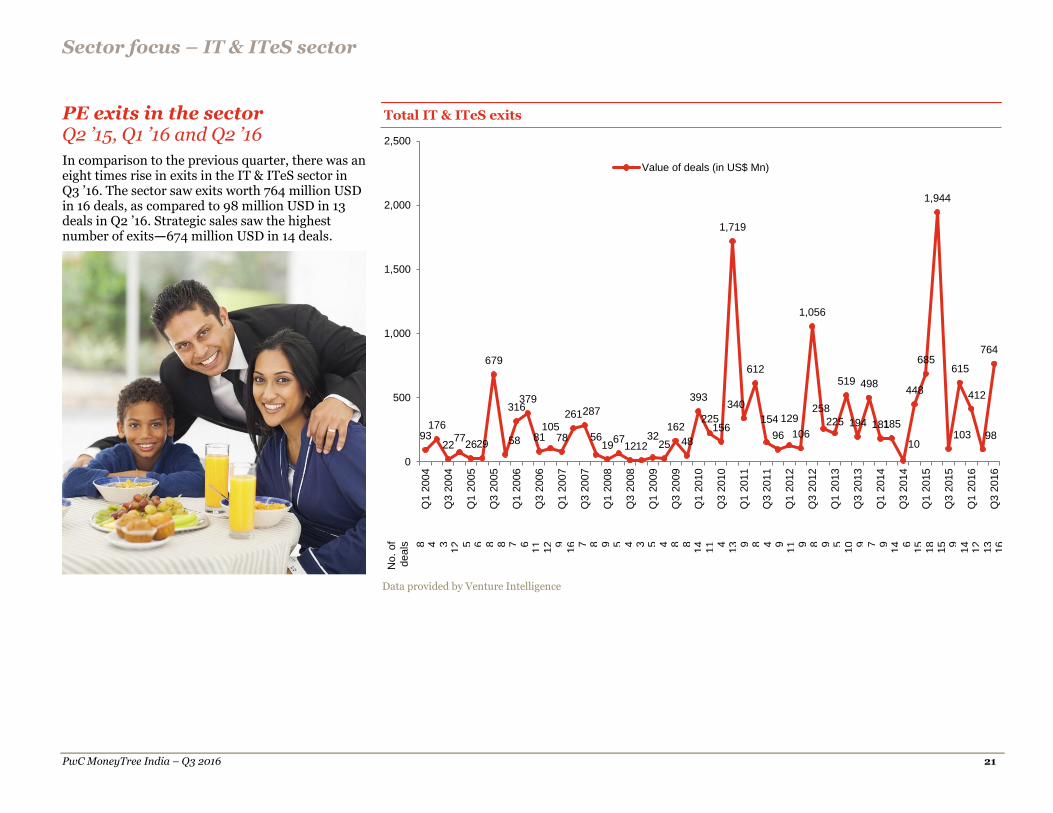
In comparison to the previous quarter, there was an eight times rise in exits in the IT & ITeS sector in Q3 ’16. The sector saw exits worth 764 million USD in 16 deals, as compared to 98 million USD in 13 deals in Q2 ’16. Strategic sales saw the highest number of exits—674 million USD in 14 deals.
No.
of
deals
8
4
3
12
5
6
8
8
7
6
11
12
9
16
7
8
9
5
4
3
5
4
8
8
14
11
4
13
9
8
4
9
11
9
8
9
5
10
9
7
9
14
6
15
18
15
9
14
12
13
16
Data provided by Venture Intelligence
93176
2277
2629
679
58
316379
81105
78
261287
5619
671212
3225
162
48
393
225156
1,719
340
612
154
96
129
106
1,056
258
225
519
194
498
181185
10
448
685
1,944
103
615
412
98
764
0
500
1,000
1,500
2,000
2,500
Q1 2
004
Q3 2
004
Q1 2
005
Q3 2
005
Q1 2
006
Q3 2
006
Q1 2
007
Q3 2
007
Q1 2
008
Q3 2
008
Q1 2
009
Q3 2
009
Q1 2
010
Q3 2
010
Q1 2
011
Q3 2
011
Q1 2
012
Q3 2
012
Q1 2
013
Q3 2
013
Q1 2
014
Q3 2
014
Q1 2
015
Q3 2
015
Q1 2
016
Q3 2
016
Value of deals (in US$ Mn)
Total IT & ITeS exits
PwC MoneyTree India – Q3 2016 22
Definitions
Stages of development
Early stage – This refers to the first or second round of institutional investments in companies that adhere to the following:
Less than five years old
Not part of a larger business group
Investment is less than 20 million USD
Growth stage – This refers to investments of less than 20 million USD. Also, investments meeting the following criteria are considered to be in the growth stage:
Third or fourth round funding of institutional investments
First or second round of institutional investments in companies that are more than 5 years old and less than 10 years old or spin-outs from larger businesses
Growth stage PE: This includes the following:
First or second round of investments worth 20 million USD or more
Third or fourth round funding in companies that are more than 5 years old and less than 10 years old, or subsidiaries or spin-outs from larger businesses
Fifth or sixth round of institutional investments
Late stage – This comprises the following:
Investment in companies that are a decade old
Seventh or later round of institutional investments
PIPEs – The following constitute PIPEs:
PE investments in publicly listed companies via preferential allotments or private placements
Acquisition of shares by PE firms via the secondary market
Buyout – This is an acquisition of controlling stake via purchase of stakes of existing shareholders.
Buyout–large – This includes buyout deals of 100 million USD or more in value.
Other – This includes PE investments in special purpose vehicle (SPV) or project-level investments.
Types of PE exits
Buyback – This includes the purchase of PE or VC investors’ equity stakes by either the investee company or its founders or promoters.
Strategic sale – This includes the sale of PE or VC investors’ equity stakes (or the entire investee company itself) to a third-party company (which is typically a larger company in the same sector).
Secondary sale – Any purchase of PE or VC investors’ equity stakes by another PE or VC investors constitutes secondary sale.
Public market sale – This includes the sale of PE or VC investors’ equity stakes in a listed company through the public market.
Initial public offering (IPO) – This includes the sale of PE or VC investors’ equity stake in an unlisted company through its first public offering of stock.
www.pwc.com/globalmoneytree www.pwc.in
Contacts
Sandeep Ladda Leader, Technology PwC India [email protected]
Sanjeev Krishan Leader, Private Equity PwC India [email protected]
This report was researched and written by the following:
Pradyumna Sahu Executive Director, Markets & Industries PwC India [email protected]
Jitesh Bijlani Sector Driver, Technology PwC India [email protected]
About PwC’s Technology Institute
The Technology Institute is PwC’s global research network that studies the business of technology and the technology of business with the purpose of creating thought leadership that offers both fact-based analysis and experience-based perspectives. Technology Institute insights and viewpoints originate from active collaboration between our professionals across the globe and their first-hand experiences working in and with the technology industry.
About PwC
At PwC, our purpose is to build trust in society and solve important problems. We’re a network of firms in 157 countries with more than 223,000 people who are committed to delivering quality in assurance, advisory and tax services. Find out more and tell us what matters to you by visiting us at www.pwc.com.
www.pwc.com
PricewaterhouseCoopers and Venture Intelligence have taken responsible steps to ensure that the information contained in the MoneyTreeTM report has been obtained from reliable sources. However, neither of the parties can warrant the ultimate validity of the data obtained. Results are updated periodically. Therefore, all data is subject to change at any time. Before making any decision or taking any action, you should consult a competent professional adviser.
This content is for general information purposes only, and should not be used as a substitute for consultation with professional advisors.
©2016 PwC. All rights reserved. PwC refers to the PwC network and/or one or more of its member firms, each of which is a separate legal entity. Please see pwc.com/structure for further details.