Embed Size (px)
Citation preview

Prices for Local Area Network Equipment Mark Doms Federal Reserve Bank of San Francisco Chris Forman Graduate School of Industrial Administration, Carnegie Mellon University June 2003 Please send correspondence to [email protected] or [email protected]. We are grateful to Carol Corrado, Shane Greenstein, Jack Triplett, and participants at the Brookings Workshop on Communications Output and Productivity and 2001 NBER Summer Institute for helpful comments and assistance. We wish to thank Jason Coburn, Jonathan Eller and Susan Polatz for outstanding research assistance. We also wish to thank Gregory Goldstein and Robert Drzyzgula for sharing their expertise about computer networks. The statements and results in this paper do not necessarily reflect the views of the Federal Reserve.

Abstract
In this paper we examine quality-adjusted prices for local area network (LAN)
equipment. Hedonic regressions are used to estimate price changes for the two largest classes of
LAN equipment, routers and switches. A matched model was used for LAN cards and the prices
for hubs were inferred by using an economic relationship to switches. Overall, we find that
prices for the four groups of LAN equipment fell at a 17 percent annual rate between 1995 and
2000. These results stand in sharp contrast to the PPI for communications equipment that is
nearly flat over the 1990s.
Key words: price index; hedonic; communications equipment

I. Introduction Local area networking (LAN) equipment routes information between computers and
plays a part in every message sent and received over the Internet. Rapid technical change in
LAN equipment and the subsequent declines in prices was one of the necessary ingredients to the
widespread diffusion of computer networks and the explosion in the popularity of the Internet.
As can be seen in table 1, nominal spending on LAN equipment grew very rapidly during
the 1990s, complementing investments in computers and peripherals and in software. In 1991,
spending on LAN equipment was below $2 billion. By 2000, sales of LAN equipment in the
United States totaled close to $16 billion dollars to become one of the single largest categories
within communications equipment. One could argue that without the technological advances in
LAN equipment, communication would be much costlier than it is today, and the benefits society
has received from the information technology revolution would be significantly reduced.
Although technical change in LAN equipment was one of the key inputs to the spurt in
information technology investment in the late 1990s, there has been no prior work to measure
price changes in LAN equipment. Previous authors have shown that lack of accurate price data
can have important implications for estimating growth and productivity. For instance, Jorgenson
and Stiroh (2000) found that changing the estimated rate of price declines in communications
equipment could add nearly 0.1 percentage point to average annual GDP between 1990 and
1998.1
Given the importance of LAN equipment, we investigate the rate of price declines in
LAN equipment in the late 1990s. We present the results of an analysis of price changes for four
of the most important types in LAN equipment: routers, switches, LAN cards, and hubs. We use
hedonic regressions to estimate price changes for the two largest classes of LAN equipment,
routers and switches. We use matched models for LAN cards and the prices for hubs were
inferred by using an economic relationship to switches. We use manufacturer product catalogs
and third-party product reports to estimate hedonic regressions, and use privately compiled price
estimates in our matched models. Gathering the data for this project was difficult, and the
difficulty no doubt help explains why there has not been more work in this area. In fact, one can
view this project as one small battle in the “house-to-house” combat that is necessary to improve
1 Other authors have shown how the lack of accurate price data for consumer goods has led to mismeasurement of the CPI. See, for example, Boskin et. al. (1996) and Hausman (1999).
1

price measures that are used in the National Income and Product Accounts (Shapiro and Wilcox
1996).2
Our results show that price declines in LAN equipment were robust, with a sizable
impact on estimates on the real growth in communications equipment investment. We find that
prices of the four groups of LAN equipment fell at double-digit rates in the last half of the 1990s.
Routers fell an average of about 14 percent between 1995 and 1999, although results vary
considerably across router classes. Prices for switches fell faster than routers, averaging an
annual decline of about 22 percent. The prices for LAN cards dropped at an annual average rate
of 18.3 percent. We estimate that the prices for hubs, the smallest portion of the LAN category,
fell an average of 19 percent. Between 1995 and 1999, our estimate of the price index for all
LAN equipment fell an average of 17 percent--pulled down by switches and hubs but held up by
routers. These results stand in sharp contrast to the PPI for communications equipment that is
nearly flat over the 1990s, and would create an upward revision to real investment growth rates
for communications equipment and non residential investment of 2.4 and 0.2 percentage points,
respectively.
We show that price declines vary a great deal over different segments of the router
market. We discuss how this variation depends on factors such as market concentration,
switching costs, and the penetration of the new technology. Although we are unable to test the
relationship, our data are unique because they suggest how switching costs can affect the rate of
price declines at different stages in the diffusion of a new technology. Thus, our paper also
contributes to the recent hedonic literature examining the relationship between market structure
and price declines.3
II. Local Area Networks II.1. Overview of LAN equipment
The basic manner in which LAN equipment transmits data packets is similar to that
which circuit switches use to transmit voice messages. A common language, or protocol, is used
so that communications can be sent from a sender to a receiver. This language is translated by
various means into a signal that travels over a physical medium, such as copper wire, fiber optic
2 In fact, the results presented in this paper have already been incorporated by the Bureau of Economic Analysis in the GDP statistics.
2

cable, or over the airwaves. Because of the physical impossibility of maintaining direct
communications links between every possible sender and receiver of data, network traffic travels
over the physical medium through a series of nodes that, like circuit switches in the telephone
communications infrastructure, act to guide and regulate traffic over the network.
LAN equipment directs traffic between computers, making possible email transmissions,
Internet browsing, and file sharing with co-workers. LANs are used to connect small groups of
users who are usually located physically close to one another and who may often wish to utilize a
shared resource such as a printer or some other peripheral. Users in a LAN are often grouped not
only physically but also functionally, so that the most frequent contacts for a user within a LAN
will usually be other users within the same LAN.
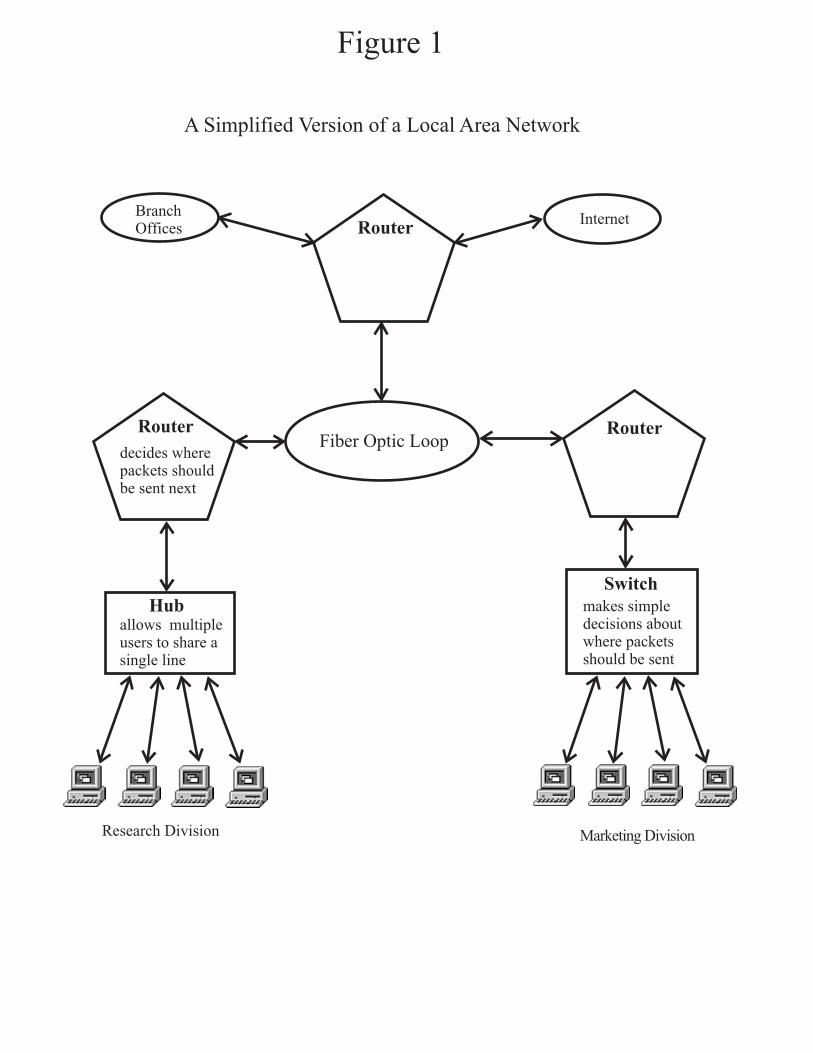
To make some sense of the various LAN devices, figure 1 has a simplified and partial
diagram of a prototype network for a company. We use this diagram to describe the four classes
of LAN equipment we study: routers, switches, LAN cards, and hubs. When an email is sent
from a computer in the Marketing Division (the bottom right of the figure), the computer breaks
the message into pieces, called packets. The packets are sent through the computer’s LAN card,
a device that physically connects the PC to the computer network. The packets then go to a
switch. Switches act as filters, making decisions on where a packet should go. For instance, if a
file is to be printed, the packets of information can stay in the LAN and are not sent out to the
broader network. Switches operate like circuit switches in the public telephone network, acting
as nodes that take incoming traffic and redirect it to its final destination. Switches are advanced
products, sometimes containing hundreds of ports and capable of redirecting millions of packets
of information a second.
The switch sends the email message to a router that oversees the Marketing Division.
Routers are usually the “brains” behind any network. A router is a sophisticated device that
decides how packets should travel through the network. If the message is intended for a
coworker, the router sends the message back down the network. In the case of an email to
someone outside the site, the message will be sent along a fiber optic loop, hit another router, and
is sent out to the Internet.
Like switches, routers direct packets of information across a network. However,
differences in the ways that routers and switches work give routers some added functionality
3 See, for example, Gandal (1994), Brynjolfsson and Kemerer (1996), and Harchaoui and Hamdad (1995).
3

over switches. Routers are able to optimize network traffic, and are able to determine the best
path for a packet traveling through the network. Routers have management and security features.
Network managers use routers to identify congestion within a network, and use security features
in routers to keep networks safe from hackers.
When an email is sent from one of the member of the Research Division (the bottom left
portion of the figure), packets are again sent through a LAN card. They next travel to a hub.
Hubs are used to connect computers in a LAN, or to allow many computers to share a network
line. Hubs perform similar tasks as routers and switches. Unlike switches or routers, however,
hubs do not filter packets. While still commonly used, hubs are much simpler devices than either
routers or switches, generally lacking many of the management features as well as the filtering
capabilities of those products.
II.2. Growth in Data Communications Equipment Spending
By the early 1990s, sales of LAN equipment soared, boosted by the migration of
corporate information systems from mainframe to client/server (C/S) computing platforms.
Figure 2 shows the growth in end user spending on LAN equipment. Routers, hubs, and LAN
cards had been introduced years before in the 1980s. Sales of routers continued to grow steadily,
driven in part by the growing popularity of the Internet. Sales of LAN cards eventually flattened
as the number of new network nodes began to reach saturation and continued declines in prices
muted revenue gains. Sales of hubs climbed then fell as switches slowly supplanted them.
Switches became popular in 1994 as a solution to increasing congestion that was
plaguing corporate networks and the Internet. The technology underlying the brainy routers,
although important to generating the features that had made them so successful, was judged too
slow in some instances to route the increasing volume of traffic in high-speed networks. As
figure 2 shows, switches have grown explosively since 1994, becoming by far the fastest
growing segment among LAN equipment.
However, despite this rapid growth – and the large body of work that has calculated
quality-adjusted prices for computers and peripherals – there has been very little measurement
work on communications equipment and no prior study examining LAN prices.4 Government
4 For prior research on computer prices see, for example, Cole et. al. (1986), Berndt, Griliches, and Rappaport (1995), Berndt and Rappaport (2001), Chwelos (2001).
4

statistics that measure price changes in communications equipment use matched model
techniques that may fail to adequately capture quality change. Figure 2 shows that among LAN
equipment, the fastest rate of growth occurred among routers and switches, classes of equipment
for which product complexity and rapid technical change make quality adjustment most difficult.
II.3. Previous Prices for LAN and Communications Equipment
We explore prices for LAN equipment because there is a widespread belief that official
measures for prices in the more aggregate category of communications equipment do not
accurately capture quality changes.5 This belief stems from two major sources. First, prior
research in related areas of telecommunications equipment (telephone switches) showed quality-
adjusted prices fell much faster than had previously been measured by government statistics
(Flamm 1989; Grimm 1996). Second, LAN equipment shares several inputs with other high-tech
products. Many of these inputs, such as semiconductors, have had rapid rates of price declines.
Once we get a better handle on what has happened to prices for LAN equipment, we will then be
better able to address questions on how investment in communications equipment affects output
measurement, and how communications equipment investment may be related to the acceleration
in aggregate productivity growth observed in the late 1990s.
Table 2 presents summaries of some official price measures for communications
equipment and computers during the past decade. The table shows the average annual percent
change in prices for the selected series for the 1990-1995, 1995-2000, and the 1990-2000
periods. The PPI for overall communications equipment grows slightly (0.3 percent per year)
over the 1990s. The PPI does not have a category for LAN equipment. The PPI category most
similar to LAN is equipment is “other data communications equipment,” which was compiled
between 1995 and 2000. The prices for this category decreased at an average rate of 0.1 percent,
slightly slower than the overall communications equipment aggregate over this time period. The
deflator BEA uses for its PDE communications equipment category falls faster, declining 1.8
percent between 1995 and 2000.6
In sharp contrast to the official prices indexes for communications equipment, the official
prices for computers have fallen very rapidly in the 1990’s. Between 1995 and 2000, the BEA
5 For instance, such claims are made by Gordon (1990) and Jorgenson and Stiroh (2000).
5
measure for PDE computer prices fell an average of over 22 percent. This faster rate of decline
is due to the work government statistical agencies have done using hedonics to adjust for quality
change in computers.
II.4. Market Structure in LAN Equipment
As we show below, the increasing concentration of the market for LAN equipment may
have influenced the evolution of prices. Like many infant industries, the market structure for
LAN equipment was very fragmented during the formative years of its evolution. However, as
the industry matured in the 1990s, this quickly changed. A small number of hardware firms, lead
by Cisco Systems (hereafter referred to as Cisco), 3Com, Bay Networks, and Cabletron, came to
dominate most segments of the market.7 As the market matured, the technical features of
individual products (such as processor speed and memory) were increasingly less important to
buyers. More important were demand-side notions such as ease of installation and integration
with existing systems, and broader measures of customer service and technical support. The
increasing importance of these “softer” product characteristics favored a more concentrated
market structure.
As noted above, this pattern of “shakeout” is common in new industries, and has been
explored extensively in prior research (e.g., Gort and Klepper 1982; Klepper 1996). In the LAN
equipment industry, there is evidence that shakeout occurred because of users’ desire for
interoperability across LAN equipment devices. In the early 1990s there was a proliferation of
new products and vendors, but little standardization across products in things such as software,
protocols, and hardware interfaces. This lack of standardization made network management and
design difficult. Networking vendors claimed to support common protocols such as Ethernet or
TCP/IP, however in practice products were often incompatible.8 Since many firms only offered
a small range of LAN equipment products, buyers incurred sizable switching costs when
purchasing from multiple vendors. Moreover, while the underlying technology of LAN
equipment was improving tremendously, levels of service provided by vendors to configure and
6 One reason that the BEA Communications Equipment index fall faster is that it is based in part on a hedonic price index for digital telephone switches developed by Grimm (1996). 7 Nortel acquired Bay Networks in 1998 to become Nortel Networks. 8 TCP/IP is the primary protocol used to transmit messages through the Internet. For evidence on interoperability problems among LAN equipment see, e.g., Bunnell (2000).
6

maintain systems were not. New start-up firms had the technology to provide impressive new
products, but did not have the staff or the training to provide support.
Many users hoped to eliminate interoperability problems by purchasing from fewer
vendors. They also wanted greater service and support from their vendors. These buyer
demands, combined with the strong cash flows and high stock values of LAN firms, helped
ignite a wave of consolidation in the industry. The trend towards industry consolidation, as well
as the industry practice of major players acquiring industry start-ups to fill gaps in existing
product lines, was further boosted by the introduction of LAN switches. Existing players who
had no switch offering, such as Cisco, rapidly acquired smaller switch producers. For example,
in 1996 Cisco paid $4.7 billion for StrataCom Incorporated, a producer of switches, to gain entry
into the market for LAN switches. More recently, LAN equipment manufacturers made multi-
billion dollar acquisitions in 2000 and 2001 to gain access to optical technologies.
Consolidation eventually became so extensive that one firm, Cisco, dominated large parts
of the LAN equipment industry. Table 3a presents the top four firms in the four major areas of
LAN equipment for 1996 and 1999. Cisco’s market share in routers and switches increased
steadily; by 1999, Cisco had 77 percent of the router market. Cisco also had a large presence in
the switch market, although not as large as that for routers. In 1996, Cisco commanded about 30
percent of LAN switch sales, and by 1999 that figure had increased to about 47 percent.
III. Price Indexes for Routers In this section we describe and present results from a hedonic analysis of routers. We use
hedonic regressions instead of matched model price indexes because of frequent entry and exit of
models between sampling periods in our data. Frequent entry and exit of products makes
matching difficult and creates a “new goods” bias, a problem that results in price indices being
overstated. Use of hedonic regressions alleviates some of the new goods bias by redefining
goods in terms of their characteristics and estimating the rate of price change, controlling for the
set of observable product characteristics. Because the effects of the new goods bias worsens as
the time frame of the sampling period increases, use of hedonic regressions may be especially
propitious when you are unable to sample frequently (Aizcorbe, Corrado, and Doms 2000). Our
data on routers is annual, and there are many products that enter and exit the market during the
course of a year.
7

However, it is well known that hedonic methods are not without their own problems.
For instance, Trajtenberg (1989) and Pakes (2002) note there are several aspects of the new
goods problem that increase consumer utility but are not reflected in price indexes generated
from hedonic regressions or matched models. Hedonic based price indexes are also generally
unable to provide an exact measure of the consumer welfare generated by quality change in a
good.9 The results from the hedonic method can unfortunately vary depending on the set of right
hand side variables and model specification. With those usual caveats in mind, the hedonic
method is well known and is one of the most common methods employed for estimating quality-
adjusted price changes. Moreover, the data requirements and equilibrium assumptions for
hedonics are less stringent than those used in models that calculate the compensating variation
directly by estimating consumer preferences and market equilibrium.10
III.1 Data and characteristics selection
The hedonic method requires data on the prices and characteristics of the goods in
question. While hedonic studies of IT goods like PCs often use data from magazines (e.g.,
Chwelos 2001; Nelson et. al. 1994) or data from third-party consultants (e.g., Berndt, Griliches,
and Rappaport 1995; Pakes 2002), these sources were inadequate for our purposes. These
sources typically contained too few models to construct a reasonable sample, contained little
information on product characteristics, and often contained products that were not representative
of the market (in particular Cisco, by far the largest vendor, was typically underrepresented).11
Instead of these more traditional sources, we collected data from Cisco catalogs for the summer
quarters of 1995-1998. Prices for 1999 were collected directly from the firm’s World Wide Web
site.12 Our data are exclusively from Cisco. However, Cisco’s market share varied from 59.5
percent to 73.5 percent over our sample period, so that our data should be representative of price
movements in the market. We were unsuccessful in obtaining comparable data for routers made
by other firms.
9 Feenstra (1995) identifies the circumstances under which hedonic regressions can provide an exact measure of the change in consumer welfare. Pakes (2002) shows that hedonic price indexes can bound the true compensating variation. 10 See, for example, Trajtenberg (1989), Petrin (1999), and Nevo (2000). 11 For a more complete discussion of the problems of these data sources, as well as a broader discussion of our data collection methods for routers, see Forman and Doms (1999). 12 The prices are list rather than transaction prices. However, after speaking with industry participants, we have found little evidence that the gap between list and transaction prices have changed significantly over time.
8

A second issue related to the proper unit of observation: system or component. While
low end routers often came completely pre-assembled, buyers often had great flexibility in
choosing the features bundled with midrange and high end routers. Among these higher end
product classes, buyers could often choose between over 40 interface modules that supported
different networking protocols, and buyers had wide latitude in deciding the number of modules
they purchased. Given a choice of router model, buyers could also decide between varying
memory, power sources, and input/output controllers. We were unable to estimate price indexes
for individual router components because for some product characteristics, the location of the
characteristic (e.g., processor box or module) varied by model.13 As a result, we considered only
routers that were “fully loaded” with modules. In other words, all routers in the regression were
configured with as many modules as the machine had available ports.14 In general, all routers
considered were configured with a processing engine, memory, interface ports or modules, and
an input/output controller. Software was generally not included because yet we had no way of
controlling for quality differences in software products.15 In cases where multiple configurations
were available for a given component (i.e., the amount of memory included in the router or the
type of interface module), we would consider models with all possible configurations. Prices
were determined by summing the list prices of all components.
Following industry convention, we break our data into four major categories of routers:
Small Office/Home Office (SOHO), Low End, Midrange, and High End. Small Office/Home
Office routers are personal models designed primarily to connect a remote user to the corporate
network.16 Branch offices of corporations use Low End models to organize traffic within the
branch and to connect branches to a corporate network. Midrange routers are the brains behind
many small to mid-size corporate networks, and High End routers are typically used only by
large multinational corporations or Internet Service Providers (ISPs). More recently, multi-
gigabit routers have come onto the market, but there was not enough data on these routers to
13 Chwelos (2001) shows that estimating hedonics of systems of components in microcomputers may yield different answers than aggregating the results of individual estimations. The reason is potential interaction between system components. Here we aggregate to the system level because of heterogeneity in the location of characteristics across routers. 14 Some interface modules were built so that additional modules could, in turn, be built on to them. We did not consider routers with this extra layer of “add-ons,” as such further add-ons tended to be the exception. 15 In a small number of cases, list prices included a bundled version of Cisco’s Internetworking Operating System (IOS) software, thus prices by necessity included the price of software. 16 More recently, routers in this category have been used to set up home networks, whether they be wired or wireless.
9

include in our analysis. Also, these multi-gigabit routers would have been a very small portion
of the router market for the time period we examine.
We use engineering data on the main components of the router as our characteristics
variables.17 Table 4A lists these variables used along with their means and standard deviations
by router class. Bandwidth measures the theoretical maximum bandwidth, measured in megabits
per second (Mbps), that the router is capable of networking. In other words, Bandwidth
represents the total amount of network data that can be sent to the router at one time, and is
found by summing the theoretical maximum data throughput from each of the cables connected
to the router. The Bandwidth variable is a measure of the data capacity capable of being sent
through the router, however it says nothing about the speed with which that data will be
processed.
Other variables include the number of ports available for network interface modules,
processor speed, standard DRAM memory, and FLASH memory. Processor speed is measured
in megahertz, while DRAM and FLASH memory are measured in megabytes. We also include a
dummy variable that indicates whether the router has a DC power source.
We also include dummy variables to indicate the year and market segment of a particular
router. Table 4B provides a list of the dummy variables and their sample means. We include
time dummies for 1995, 1996, 1998, and 1999. We also include dummies that indicate whether
the router is included in the SOHO, Low End, Midrange, or High End markets. The last dummy
in the table is one if the router is in the Midrange or High End of the market and zero otherwise,
and will be used to allow coefficients on the characteristic variables to vary across different parts
of the product spectrum.
III.2. Hedonic estimation and results
The hedonic method provides little guidance in the way of a priori restrictions on
specification of the model. We confront three major specification issues. First, there are a
variety of functional forms from which to choose. Like many other hedonic studies, we
17 As in hedonic studies of computers, there exist two classes of attributes that one may use for the vector of characteristics. One class of characteristics variables uses data from performance studies to measure attributes such as the speed of the device (in our case, packet throughput) or, perhaps, reliability (in the case of routers, packet loss rate). A major problem with the use of such benchmark studies is that the manufacturers themselves often sponsor them. Under these conditions, it is unsurprising that the “best” router is usually the one from the manufacturer sponsoring the study.
10

consistently found that log-log models were superior to other functional forms and only those
results will be discussed.18 Second, there is a question as to whether the relationship between
prices and characteristics is stable across the four major router product classes. Last, we ask if
the shadow prices of product characteristics are constant through time. Given the vast technical
change in these products, consumers’ valuation of characteristics may have changed as product
characteristics have improved. The last two specification issues are addressed in the two sections
below.
III.2.1. Parameter stability across router classes
We expect there is likely to be some difference in buyer’s valuation of product
characteristics across product classes, particularly between the very high and low ends of the
product spectrum. As noted above, routers at either extreme of the product spectrum serve very
different purposes and target very different audiences, implying, as Triplett (1989) notes, that the
contour of the hedonic surfaces are likely to be different.19
One way of testing the hypothesis of parameter stability is to compute F-tests. However,
as Berndt, Griliches, and Rappaport (1995) note, when samples are large and standard test
procedures employed (as they are in this case), F-tests may reject simplifying parameter
restrictions on purely statistical grounds. We follow their procedure of applying 0.01
significance levels to F-tests and examine the change in root mean squared error (RMSE) to
determine whether the hypothesis of parameter stability should be rejected. As in their paper, we
require two conditions to reject the hypothesis of parameter stability: (1) the p-value of the F-
18 We compared the results of seven different functional forms using standard goodness-of-fit measures. Further description on this, as well as our analysis of parameter stability across products and time, is provided in Forman and Doms (1999). 19 To see this, it may be useful to examine an example. Consider the cost of an ethernet port across the four categories in our data in 1999. In our hedonic regressions, because ethernet lines have bandwidth of 10 Mbps, this would translate into the cost of 10 Mps of BANDWIDTH. In the High End sample, a 6-port ethernet processor module configured for a High End Cisco 7500 router had a list price of $16,000, for an approximate cost of $2666.67 per ethernet port. Among the 7200 series routers, which are included in both the High End and Midrange samples, the cost of a 4-port ethernet module was $4500, or $1125 per port. However, in the Low End of our sample, the cost of a complete Cisco 2501 router which included both an ethernet and two serial ports was $995, while in the SOHO category the cost of a complete Cisco 1005 router with one ethernet and one serial port was $395. Although the conclusions one can draw from an example such as this are limited, it does suggest one should be careful about assumptions of parameter constancy.
11

tests must be less than .01 and (2) the change in RMSE from moving to an unrestricted
regression must be greater than 5%.
We divided our sample into high end (consisting of High End and Midrange) and low end
(consisting of Low End and SOHO) products and test for parameter constancy across the two
groups. The results suggested we should allow parameters to vary across the two sample groups.
We also investigated the hypothesis that the coefficients on the characteristics variables should
be allowed to vary across all four segments. Unfortunately, in the early years of the sample there
was insufficient variation in the product characteristics variables within a given segment and
year to obtain reliable parameter estimates.
In our baseline model we allow parameters to vary between the higher (High End and
Midrange) and lower (SOHO and Low End) ends of the product spectrum but not across all
product classes. This specification also fits within our knowledge of the industry. The lower end
of the spectrum, consisting of the SOHO and Low End segments, consist primarily of self-
contained routers selling mostly for under $3,000. Branch offices and individuals use these
models to connect to a corporate network. In contrast, the Midrange and High End segments
serve as the “brains” behind a firm’s central corporate network; their prices can sometimes run
into hundreds of thousands of dollars. We expect the relationship between parameters and price
to vary across these two groups. However, the dividing line between SOHO and Low End
products and between Midrange and High End is often unclear. In fact, our classification
system, which is the same used by industry consulting group Dataquest, places some model
series in two different market segments.20 For instance, the determination of whether a Cisco
1600 series belongs in the SOHO or Low End category depends on whether the router includes
an optional WAN Interface Card (WIC). Moreover, the Cisco 7202 and 7204 models, both
members of the 7200 series, are included within the Midrange group, while the 7206 is classified
as a High End product.
III.2.2. Parameter stability through time
There are typically three methods used to estimate hedonic regressions. First, one can
estimate yearly regressions and allow parameter estimates to vary by year. Second, one can
12

estimate pooled regressions holding coefficients constant over adjacent two-year time periods.
Last, one can estimate a single pooled regression over the entire sample period. Estimating
pooled regressions will, of course, have the advantage of improved efficiency if the hypothesis of
parameter stability is correct. Pakes (2002) notes that while pooled regressions sometimes
engender a bias because of shifts in the hedonic surface over time, they will sometimes be
preferred when sample sizes are small and the bias is more than compensated by lower variance
in the estimated price index.21
To examine the hypothesis of parameter stability through time we again use F-tests and
examine the change in RMSE by moving from the restricted to unrestricted regression estimates.
We first examine the hypothesis of parameter stability across all four years. F-tests reject this
hypothesis at greater than the 1% level, and the change in RMSE is over 9.6%. The comparison
between our yearly and adjacent years regression models is not as clear cut; F-tests reject the
hypothesis of parameter stability at the one percent level in all cases, however the improvement
in RMSE is often less than the 5% level suggested by Berndt, Griliches, and Rappaport (1995).
Because of this, this section will present the results from the adjacent year regressions.22
20 Cisco divides its product line both into product series and then models within that series. For instance, the Cisco 2501 is a particular model within the 2500 series. Models within the same series often share common characteristics, such as memory or processor speed. 21 Recent papers have examined the incidence of parameter stability in hedonic regressions and the implications for price index measurement. Berndt and Rappaport (2001) find evidence of parameter instability in desktop and laptop PCs. Heravi and Silver (2002) use scanner data to examine the incidence of parameter instability in a variety of household goods, and find evidence of instability and noticeable effects on imputed Laspeyres and Paasche price indexes. 22 Results of each of the tests and yearly regressions are included in Forman and Doms (1999).
13

III.2.3. Router results
Table 5 presents the results from the adjacent year regressions. These results will be used
for price index computation later in this section. The variable DHE represents the dummy for
Midrange and High End products, and is interacted with log(Bandwidth), log(Number of ports
available), log(FLASH memory), log(Processor speed), log(DRAM memory), and a dummy
variable for DC power source. These interaction terms are provided to allow for varying
coefficients across the lower and higher ends of the product spectrum. In our adjacent year
regressions, we include year dummies interacted with product spectrum dummies for SOHO,
Low End, Midrange, and High End routers and use these variables to estimate second-period
prices. Standard errors are in parentheses and are calculated using the White (1980)
heteroskedasticity-robust procedure.
Table 6 shows the price indexes derived from the regressions. Pakes (2002) notes that
because the parameters of a hedonic regression reflect the results of a complex equilibrium
process, there is no reason to expect a positive relation between price and characteristics of
goods that are thought to be desirable. Accordingly, we will not discuss the coefficient results on
the hedonic regression, and focus our analysis on the price index results. We last calculate price
indexes by exponentiating the dummy coefficients on the time dummies in our adjacent year
regressions. As is well known, price indexes calculated using these methods are biased, and we
employ the standard correction of adding to the coefficient one half times the squared standard
error (Triplett 1989).
The last lines in table 6 show our composite, chain weighted, router index based on North
American sales for the four router categories. This index was created by chain-weighting the
four individual router indexes. Overall, router prices fell an average of 13.6 percent between
1995 and 1999. In other words, router prices fell much more rapidly than recent government
estimates for the communications sector. However, comparing our results to other recent
hedonic studies, prices of routers fell much more slowly than prices of computing equipment.
As a comparison, BEA’s Communications Equipment price index fell 1.8 percent between 1995
and 2000, while BEA’s index for Computers and Peripheral Equipment fell 22.2 percent over the
same period. Using pooled hedonic price regressions, Berndt and Rappaport (2001) show prices
for desktop and mobile personal computers fell at an average rate of 41.1 percent and 31.4
percent over 1994-1999. Below we discuss potential reasons for these differences in the rates of
14

router and computer price declines. We will also address the significant variation we observe in
the rate of price declines across router classes.
• Differences between computers and routers: One reason for the difference in the
rate of price declines between computers and routers may be differences in the rate of decline in
semiconductors. Aizcorbe, Flamm, and Khrushid (2001) show that the prices of semiconductor
inputs in computers have fallen faster than semiconductor inputs in communications equipment.
Moreover, they estimate that semiconductors account for a greater share of variable costs in
computers than in communications equipment. Because semiconductor prices have fallen so
rapidly, this translates into larger declines in prices for computers than for routers. Using data
from 1998, they show that declines in semiconductors contributed anywhere from 16.1 to 23.8
percentage points to the 40.3 percent decline in computer prices in that year. In contrast, they
show semiconductors contributed between 5.7 and 10.0 percentage points to the 29.5 percent
decline in LAN prices in 1998.23 They conclude that differences in semiconductor input price
declines can explain almost all of the variation in price changes between computers and LAN
equipment in 1998.
• Differences among classes of routers: Table 6 shows that each of the four router
classes declined at significantly different rates between 1995 and 1999. In particular, Midrange
prices rose 3.2 percent while prices for the other three categories fell between 16.1 and 24.7
percent.24 We believe that differences in market structure helps to explain the different growth
rates.
For one, we believe that the presence of switching costs in routers has influenced their
rate of price declines. Klemperer (1995) shows how learning and compatibility costs between
existing systems and new purchases can lead to switching costs in changing vendors. Such
switching costs can cause buyers to exhibit “brand loyalty” and so increase the likelihood of
repeat purchases from incumbent vendors. The trade press generally regards switching costs in
the market for routers and switches to be significant (e.g., Tolly, 2000; Wickre, 1996; Petrosky,
1996). Forman (2002) has used discrete choice models to demonstrate the existence of switching
23 Aizcorbe, Flamm, and Khurshid (2001) cite the Federal Reserve Board’s Industrial Production index described in Corrado (2001). This index used the LAN price index in this paper as an input. 24 We believe the apparent rise in Midrange prices probably captures flatness in price declines over our sample. We carefully examined the routers and modules in this segment and found little evidence of price changes over our sample for the vast majority of products.
15

costs in this market, showing that vendor incumbency can increase the probability of purchase
from a vendor from 14 percent to 25 percent.
When switching costs are present, the seller’s optimal strategy is often to set prices low in
early periods to capture a large installed base of “locked-in” customers (Klemperer 1995; Farrell
and Klemperer 2001). If sellers are unable to identify new and repeat customers, prices in later
periods will depend on the fraction of new and repeat buyers.25 The literature generally shows
that the larger the share of repeat buyers, the more likely sellers will charge high prices in later
periods to reap the benefits of their installed base.
This dynamic pricing strategy is fully consistent with our results. The product lines in the
midrange segment are among the oldest in the market. Moreover, they are the products sold to
Cisco’s most faithful customers—large enterprises (Bunnell 2000). We believe that Cisco
maintained flat prices in Midrange routers to capture rents among its most loyal customers. In
contrast, the High End router market was new and growing rapidly over 1995-1999. Cisco had a
large market share, however most growth came from new customers. In contrast to the
Midrange market, prices fell rapidly (-16.1 percent). SOHO and Low End products, because of
their simplicity, had among the lowest switching costs.
Second, the effects of high concentration in the Midrange segment may have contributed
to the flatness in prices. Table 3b shows that in 1996 and 1999, Cisco’s market share in the
Midrange segment was 66.6 percent and 79.6 percent: Cisco’s second highest for both years.
Although it had a higher market share in High End routers, new product entry from smaller
players such as Juniper Communications limited Cisco’s market power. If market shares and
market power were greatest in the Midrange segment, then most static and dynamic theories of
oligopoly pricing would suggest that price-cost margins in this market would be elevated. In
contrast, the most competitive router segment is SOHO, and that is the category that has the
highest average price declines.
25 Sellers will sometimes be able to identify new and repeat buyers. When this is the case, the optimal strategy is for sellers to charge high prices to repeat buyers to exploit their ex-post absence of outside options. This alternative scenario is also fully consistent with the pattern of prices we observe in the market.
16

IV. Price Indexes for Switches IV.1. Data and Characteristics Selection for Switches
The analysis of switches closely follows that of routers, with some exceptions. Because
Cisco’s market share is smaller in switches than it is in routers (table 3a), we thought it was
important to obtain data from additional vendors. Moreover, because switches are simpler
devices than routers, traditional data sources contained sufficient information. We used price
and characteristics data from Datapro’s “Comparison Column Reports”, a service that compares
switches from a variety of vendors. The reports typically list a series of switches across columns
and the rows in the reports contain information on the characteristics of the switches, such as
number of ports, interfaces, et cetera. As a check, we compared the Datapro data against Cisco
product catalogues for Cisco switches and generally found that the two sources of data for Cisco
switches agreed.
Several problems were encountered in collecting this data. First, not all reports contained
the same information on characteristics, and many observations had to be dropped due to
inadequate information on the characteristics of the switch. Second, we were not able to obtain
data for 1998. Third, our sample in 1997 is small (18 observations).26 Finally, like routers, the
prices in the reports are list prices rather than transaction prices. We were able to gather usable
data for a total of 366 observations from 1996 to 2000.
Table 7 presents summary statistics for the LAN switch database. Like routers, measures
of performance are difficult to come by. We were unable to collect data on the type of processor
or memory chip in switches as we did in routers. However, we were able to obtain information
on the number and types of interface ports in each switch. These are the primary dimensions
along which speed and quality are judged in switches. For each type of interface port, we
included both a dummy indicating the presence of that port type as well as the log of the number
of ports available. We control for 10, 100, and 1,000 megabit Ethernet ports, FDDI (fiber
distributed data interface) ports, and ATM (asynchronous transfer mode) ports.
We were also able to collect some additional data on the capabilities of switches.
Switches vary by whether they have layer 3 switching capability and single mode fiber
26 Entries in the comparison column reports were updated when Datapro issued a review of the product report. Entries that had not been reviewed were simply carried over from previous reports. To eliminate biases from data error, we dropped observations that were duplicates of the previous report. Many of the observations in the 1997 report were copies of the 1996 report with no change.
17

capability. Layer 3 capability indicates that the switch is capable of performing functions on the
third layer of the Open Systems Interconnection (OSI) communication model. Generally,
switches operate on layer 2 of the OSI model; layer 3 capability indicates, among other things,
that the switch is on the technical frontier. Single mode fiber is optical fiber used to carry a
single ray of light, thus single mode fiber indicates a type of FDDI capability.
Many of the switches in our sample had a wide array of characteristics--enabling them to
speak a variety of languages and operate at varying speeds. We included all switch models in the
regressions and did not segment the data into classes, as we did with routers. Although there is a
very wide range in speed, sophistication, and capacity across switches, we were unable to find a
small number of clearly defined market segments in switches as we did in routers.27
IV.2. Switch Results
Table 8 presents the results from a pooled regression and from adjacent year
regressions.28 Not shown in the table is a list of firm dummy variables. Using the dummy
variables from the adjacent year regressions, we found the average annual price decrease was
21.9 percent, a faster rate of decline than that for routers. The pooled regression results generate
a nearly identical result of 22.2 percent. Thus, it appears that prices for switches fell substantially
faster than that for routers.
We spoke with several buyers of networking gear and they confirmed our results; they
felt that switch prices have fallen faster than routers prices. Again, we feel that market structure
provides one reason for the different rates of price declines. As shown in table 3a, the switch
market is much less concentrated than the router market. Cisco has far less market power, and
no firm is dominant in the same way that Cisco is in the router market. If firms in a competitive
market price more aggressively, then this will lead to more rapid rates of price declines.
The presence of switching costs may also help to explain the pattern of price declines in
the switch market. Forman (2002) has shown that switching costs can influence switch vendor
selection. Figure 2 shows that the switch market achieved critical mass in 1995 and grew
explosively throughout the late 1990s. If switching costs play a role in vendor selection, then the
27 We did experiment with different product groupings, but found no clear advantage to doing so. Additionally, the samples by year were small (especially for 1997), so dividing the sample greatly increased the standard errors of our estimates. 28 Annual regressions were not run because of the small samples, especially in 1997.
18

models described above on dynamic pricing under switching costs suggest that switch vendors
will compete aggressively in the early years of the market to obtain market share and an installed
base of locked-in users. In other words, the rapid price declines in switches may reflect early
period market competition among Cisco, 3Com, and Nortel Networks to obtain greater ex post
market power in future years.
V. Price Indexes for LAN Cards The third component of local area network equipment that we examine is LAN cards, the
device in a computer that is physically connected to a computer network. Like routers and
switches, LAN cards vary in terms of speed and interfaces. Unlike routers and switches, LAN
cards have a very small set of characteristics, and the data are fairly homogenous within each of
the categories for which we have data.29
We obtained data on LAN cards comes from Dataquest, another industry consulting
group and subsidiary of the Gartner Group, Inc. Dataquest tracks price and revenue for the
world LAN card market; we display 1995 through 2000 data in table 9. Prices in table 9 are
average prices for the relevant category, and are obtained by dividing revenue by total shipments
for each year.
Because LAN cards are fairly homogenous within each category and there is little
technical change within existing categories, the new goods bias is not as large as with other LAN
equipment. As a result, we can use traditional matched-model indexes to measure price changes
in LAN cards. We computed a chain-weighted, matched-model price index with this data.
Prices for LAN cards fell an average of 18.3 percent per year between 1995 and 2000.
VI. Price Indexes for Hubs The final components of LAN equipment, hubs, are simple devices that have been
replaced over the years by switches. We have not performed an analysis of hubs like that of
routers and switches for several reasons. First, we had a difficult time in obtaining data that
contained prices and characteristics. Second, the importance of hubs in total LAN expenditures
has decreased over time, so we allocated our own resources in getting better measures on prices
29 LAN cards do not have varying number of ports, nor do they generally have important product characteristics beyond the protocols they are able to interface with.
19

20
for switches and routers. In 2000, spending on hubs accounted for only 4 percent of total LAN
expenditures.
For hubs we use an admittedly crude approach. The approach examines the relationship
between changes in the price per port for switches and compares that to the price per port for
hubs. The reason we exploit this relationship is that we have price per port data for hubs and for
switches, but no price data for hubs themselves. The price per-port measures are Fisher indexes
based on data for a handful of switch and hub classes.
Figure 3 presents these data. Between 1996 and 2000, the price per-port measures for
switches fell at an annual average rate of 34.7 percent whereas the price per-port measure for
hubs fell 30.1 percent. We construct a price index for hubs by taking the ratio of the two Fisher
per-port indexes and multiplying by the switch price index. Since the per-port index for hubs
doesn’t fall as fast as the per-port measure for switches, the price index for hubs doesn’t fall as
fast as that for switches. From 1996 to 2000, we estimate that the prices for hubs fell at an
annual average rate of 19.0 percent. We admit this is the weakest result in the paper, but, as
pointed out before, the nominal share of hubs in LAN equipment has been declining and became
very small, so the effect of errors in our hubs index will not have a large effect on our overall
results.
VII. Our LAN Price Index and Implications Using the results from the previous sections, we calculate that the LAN equipment price
index fell at a 17 percent annual rate between 1995 and 2000, about 16 percentage points faster
than if the BLS PPI for communications equipment was used.
We next used our LAN equipment index to estimate the impact this revised price index
would have on real investment in the National Accounts. As we stated in the beginning of this
paper, LAN equipment is a relatively small portion of private equipment and software spending.
Therefore, the effects that this index would have on much larger aggregates will be limited.
Nonetheless, we estimate that the real growth rate for certain investment aggregates would be
boosted in non-trivial ways. For instance, the real growth of communications equipment would
be boosted by an average of 2.4 percentage points a year between 1995 and 2000 by using our
index. The comparable figure for total information processing equipment would be about 0.6
percentage points per year. For total non-residential investment, the average real growth rate

21
would be boosted by 0.2 percentage points per year. It is important to note that the results of this
paper have already been incorporated into the NIPAs, and that real growth rates for investment in
communications equipment and for non-residential investment have been revised upwards as a
consequence of them.
VIII. Conclusions There is good reason to believe that prices for communications equipment are
mismeasured, in part, because of rapid technological change. In this paper, we examined prices
for just one area of communications equipment, LAN equipment. We found that prices fell quite
quickly during the later half of the 1990s, although not as quickly as prices of computers. We
found that there was a good deal of variation across various LAN categories. This variation
appears to be consistent with stories we have heard about the structure of the industry, as well as
recent studies on input prices and buyer behavior in this market.
We view our research into LAN equipment pricing as one step towards better
understanding what actually happened to prices for communications equipment more generally.
As shown above, accurate measurement of these prices can have important implications for
measurement of investment and productivity growth.

22
References Aizcorbe. A., C. Corrado, and M. Doms (2000) “Constructing Price and Quantity Indexes for High Quality Goods,” Working Paper, Board of Governors of the Federal Reserve System. Aizcorbe, A., K. Flamm, and A. Khurshid (2002) “The Role of Semiconductor Inputs in IT Hardware Price Decline: Computers vs. Communications, “ FEDS Working Paper 2002-37. Berndt, E. R., Z. Griliches, and N. Rappaport (1995) “Econometric Estimates of Price Indexes for Personal Computers in the 1990’s” Journal of Econometrics 68 (1): 243-268. Berndt, E. R. and N. Rappaport (2001) “Price and Quality of Desktop and Mobile Personal Computers: A Quarter Century Historical Overview,” American Economic Review 91(2): 268-273. Boskin, M., E. Dulberger, R. Gordon, Z. Griliches, and D. Jorgenson (1996) “Toward a More Accurate Measurement of the Cost of Living,” Final Report to the Senate Finance Committee, December 4. Brynjolfsson, Erik and Chris Kemerer (1996) “Network Externalities in Microcomputer Software: An Econometric Analysis of the Spreadsheet Market” Management Science 42(12): 1627-1647. Bunnell, David (2000) Making the Cisco Connection: The Story Behind the Real Internet Superpower. New York: John Wiley and Sons. Chwelos, P. (2001) “Approaches to Performance Measurement in Hedonic Analysis: Price Indexes for Laptop Computers in the 1990’s” Working Paper, University of British Columbia. Cole, R., C. Chen, J.A. Barquin-Stolleman, E. Dulberger, N. Helvacian, and J.H. Hodge (1986) “Quality-Adjusted Price Indexes for Computer Processors and Selected Peripheral Equipment,” Survey of Current Business 66: 41-50. Corrado, C. (2001) “Industrial Production and Capacity Utilization: The 2000 Annual Revision,” Federal Reserve Bulletin, March. Farrell, Joseph and Paul Klemperer (2001) “Coordination and Lock-in: Competition with Switching Costs and Network Effects,” Working Paper, available on-line at www.paulklemperer.org. Feenstra, Robert (1995) “Exact Hedonic Price Indexes” Review of Economics and Statistics, 77(3): 634-653. Flamm, Kenneth (1989) “Technological Advance and Costs: Computers versus Communications” in Robert Crandall and Kenneth Flamm, eds. Changing the Rules:

23
Technological Change, International Competition, and Regulation in Communications. Washington: The Brookings Institution. 13-61. Forman, C. (2002) “Switching Costs, Network Effects, and Networking Equipment: Compatibility and Vendor Choice in the Market for LAN Equipment,” Proceedings of the Twenty-Third International Conference on Information Systems, p. 685-696. Forman, C. and M. Doms (1999) “Price Declines and Consumer Welfare Benefits in Computer Networking Equipment,” Working Paper, Kellogg School of Management, Northwestern University. Gandal, Neil (1994) “Hedonic Price Indexes for Spreadsheets and an Empirical Test of the Network Externalities Hypothesis” RAND Journal of Economics 25(1): 160-170. Gordon, Robert J. (1990). The Measurement of Durable Goods Prices. National Bureau of Economic Research Monograph. Gort, M. and S. Klepper (1982) “Time Paths in the Diffusion of Product Innovations,” Economic Journal 92 (September): 630-653. Grimm, Bruce (1996) “A Quality Adjusted Price Index for Digital Telephone Switches,” Working Paper, Burea of Economic Analysis. Harchaoui, Tarek and Malika Hamdad (2000) “The prices of classical recorded music: a hedonic approach” International Journal of Industrial Organization 18: 497-514. Hausman, Jerry (1999) “Cellular Telephone, New Products, and the CPI” Journal of Business and Economic Statistics 17(2): 188-194. Heravi, Saeed and Mick Silver (2002) “On the Stability of Hedonic Coefficients and their Implications for Quality-Adjusted Price Change Measurement,” Working Paper, Cardiff Business School, Cardiff, UK. Jorgenson, Dale and Kevin Stiroh (2000), “Raising the Speed Limit: U.S. Economic Growth in the Information Age”, Brookings Papers on Economic Activity, v.0, pp. 125-211. Klemperer, Paul (1995) “Competition when Consumers Have Switching Costs,” Review of Economic Studies, 62: 515-539. Klepper, Steven (1996) “Entry, Exit, Growth, and Innovation over the Product Life Cycle” American Economic Review 86(3): 562-583. Luzio, E. and S. Greenstein (1995) “Measuring the Performance of a Protected Infant Industry: The Case of Brazilian Microcomputers” Review of Economics and Statistics. 622-633.

24
Nelson, Randy, Tim Tanguay, and Christopher Patterson (1994) “A Quality-Adjusted Price Index for Personal Computers” Journal of Business and Economic Statistics 12(1): 23-31. Nevo, Aviv (2001) “New Products, Quality Changes, and Welfare Measures Computed From Estimated Demand Systems” NBER Working Paper #8425. Pakes, Ariel (2002) “A Reconsideration of Hedonic Price Indices with an Application to PCs” NBER Working Paper #8715. Petrin, A. (1999) “Quantifying the Benefits of New Products: The Case of the Minivan” Working Paper, Graduate School of Business, University of Chicago. Petrosky, Mary (1996) “Cisco pursues a vision of being all things to all users” Network World Fusion. Shapiro, M. and D. Wilcox (1996) “Mismeasurement in the Consumer Price Index: An Evaluation,” in B.S. Bernanke and J.J. Rotemberg, eds. NBER Macroeconomics Annual. Cambridge, MA: MIT Press. Tolly, Kevin (2000) “Lack of proven switch interoperability hurts aggressors” online article on the Tolly Group web page. Trajtenberg, M. (1989) Economic Analysis of Product Innovation: The Case of CT Scanners. Cambridge, Massachusetts: Harvard University Press. Triplett, J. (1989) Price and Technical Change in a Capital Good: A Survey of Research on Computers. in D. Jorgenson and R. Landau, eds. Technology and Capital Formation. Cambridge, MA: MIT Press. 127-213. White, H. (1980) “A heteroskedasticity-consistent covariance matrix estimator and a direct test for heteroskedasticity” Econometrica 48: 817-838. Wickre, Paul (1996) “Stick to true standards-based solutions” Network World Fusion, 1996.
BranchOffices
Router Router
Router
Fiber Optic Loop
Internet
Switch
Hub
allows multipleusers to share asingle line
decides wherepackets shouldbe sent next
makes simpledecisions aboutwhere packetsshould be sent
Research Division Marketing Division
Figure 1
A Simplified Version of a Local Area Network

Figure 2: End User Spending on Local Area Network Equipment
0
2,000
4,000
6,000
8,000
10,000
12,000
14,000
16,000
18,000
1991 1992 1993 1994 1995 1996 1997 1998 1999 2000
(in $
Mill
ions
)
Hubs
Routers
Switches
LAN Cards
Total

Figure 3: Price Indexes for Hubs and Switches (Index 1996 = 100)
1996 1997 1998 1999 20000
20
40
60
80
100
120
0
20
40
60
80
100
120
Hedonic Switch Price Index, AAGR = -21.9%Chain-Weighted Price Per Port Switch Index, AAGR = -34.7%Chain-Weighted Price Per Port Hub Index, AAGR = -30.1%
1997 1998 1999 2000-50
-40
-30
-20
-10
-50
-40
-30
-20
-10
Hedonic Switch Price Index, Percent Change From Preceding YearChain-Weighted Price Per Port Switch Index, Percent Change From Preceding YearChain-Weighted Price Per Port Hub Index, Percent Change From Preceding Year

Table 1Investment in Information Processing Equipment and Software
Billions of Dollars
1991 1992 1993 1994 1995 1996 1997 1998 1999 2000 1991-2000 1995-2000
Total information processing 181.4 197.5 215.0 233.7 262.0 287.3 325.2 363.4 402.3 446.9 10.5 11.3 Software 56.6 60.8 69.4 75.5 83.5 95.1 116.5 140.1 162.5 179.4 13.7 16.5 Communication equipment 45.7 47.8 48.2 54.7 60.0 65.6 73.7 81.2 93.7 116.6 11.0 14.2
LAN Equipment 1.7 2.8 4.5 5.8 7.8 10.5 11.4 13.1 14.0 15.7 28.3 15.1 Computers and peripheral equipment 37.7 43.6 47.2 51.3 64.6 70.9 79.6 84.2 90.4 93.3 10.6 7.6 Instruments 24.2 26.6 28.7 29.3 31.3 33.3 33.3 36.3 38.2 40.6 5.9 5.3 Other 17.2 18.7 21.6 22.9 22.5 22.4 22.1 21.6 17.5 17.0 -0.1 -5.4Source: National Income and Product Accounts and authors' calculations
Average AnnualGrowth Rates (%)

1990-1995 1995-2000 1990-2000BLS PPI Communications Equipment 1.17 -0.63 0.27BLS PPI "Other Data Communications Equipment" 1.63 0.50 1.02
BEA Communication Equipment 1 -1.49 -1.84 -1.66BEA Computers and Peripheral Equipment -13.44 -22.22 -17.95
1. This is the BEA deflator before the LAN results were incorporated.
Table 2: Official Price Measures for Communications Equipment and Computers(Average Annual Percent Change)

Table 3aMarket Share of Four Largest Firms by LAN Equipment Type
1996 1999Firm Market Share Firm Market Share
Routers Cisco Systems 54.6% Cisco Systems 77.0%Bay Networks Inc. 10.3% Nortel Networks 6.9%Ascend Communications Inc. 9.2% Fujitsu 2.5%3Com 6.4% 3Com 2.4%
Switches Cisco Systems 29.6% Cisco Systems 46.8%3Com 21.2% 3Com 12.6%Cabletron Systems Inc. 11.0% Nortel Networks 8.7%Bay Networks Inc. 9.9% Fore Systems 6.4%
LAN Cards 3Com 33.2% 3Com 35.4%IBM 13.7% Intel 23.2%Standard Microsystems Inc. 6.9% IBM 4.9%Madge Networks 5.8% Xircom 4.7%
Hubs Bay Networks Inc. 24.5% 3Com 30.3%3Com 18.8% Nortel Networks 16.7%Cabletron Systems Inc. 14.7% D-Link Systems 7.4%IBM 4.8% Intel 4.3%
Source: Dataquest
Cisco Router Market Shares by Segment
1996 1999Router Segment Market Share Router Segment Market ShareSOHO 29.4% SOHO 53.0%Low End 55.1% Low End 69.8%Midrange 66.6% Midrange 79.6%High End 67.8% High End 87.2%Source: Dataquest
Table 3b

Mean Std Dev Minimum MaximumSmall Office/Home Office (SOHO) RoutersPrice ($) 769 244 395 1,399 Bandwidth (Mbps) 17.8 13.1 10.1 40.2Number of ports available 0.0 0.0 0.0 0.0FLASH memory (MB) 1.3 2.4 0.0 8.0Processor speed (MHz) 27.9 5.2 16.0 33.0DRAM memory (MB) 2.8 1.8 1.0 8.0DC power source 0.00 0.00 0.00 0.001=YES 0=NO
Low End RoutersPrice ($) 4,301 1,861 895 8,195 Bandwidth (Mbps) 54.3 63.9 1.5 372.2Number of ports available 1.0 0.9 0.0 3.0FLASH memory (MB) 6.9 1.8 2.0 8.0Processor speed (MHz) 31.7 9.9 20.0 50.0DRAM memory (MB) 14.4 10.1 2.0 24.0DC power source 0.43 0.50 0.00 1.001=YES 0=NO
Midrange RoutersPrice ($) 41,526 16,707 4,600 78,550 Bandwidth (Mbps) 284.6 187.5 1.0 630.0Number of ports available 3.7 0.6 2.0 4.0FLASH memory (MB) 14.4 6.1 4.0 20.0Processor speed (MHz) 157.3 59.2 40.0 263.0DRAM memory (MB) 28.4 7.6 8.0 32.0DC power source 0.12 0.33 0.00 1.001=YES 0=NO
High End RoutersPrice ($) 85,900 47,705 38,200 326,900 Bandwidth (Mbps) 539.7 258.9 7.5 1460.0Number of ports available 6.2 1.6 3.0 11.0FLASH memory (MB) 16.8 3.6 4.0 20.0Processor speed (MHz) 187.2 66.3 25.0 300.0DRAM memory (MB) 30.8 4.3 16.0 32.0DC power source 0.00 0.00 0.00 0.001=YES 0=NO
Table 4(a): Summary Statistics for RoutersRouter Characteristics by Market Segment

1995 Dummy 0.020 SOHO Dummy 0.008
1996 Dummy 0.057 Low End Dummy 0.069
1998 Dummy 0.254 Midrange Dummy 0.465
1999 Dummy 0.669 High End Dummy 0.458
Dummy for Midrange 0.923or High End
Table 4 (b)Sample Means of Dummy Variables

Variable 1995-1996 1996-1998 1998-1999SOHO Dummy 5.254 4.874 8.354
(0.195) (1.303) (0.447)
Low End Dummy 6.267 3.919 8.513(0.718) (1.682) (0.493)
Midrange Dummy 7.755 6.341 6.515(0.126) (0.125) (0.121)
High End Dummy 9.113 6.986 6.632(0.168) (0.139) (0.129)
Year Dummy * SOHO Dummy 0.013 -0.934 -0.256(0.068) (0.247) (0.126)
Year Dummy * Low End Dummy 0.181 -0.995 -0.078(0.089) (0.221) (0.054)
Year Dummy * Midrange Dummy 0.119 0.005 -0.001(0.032) (0.042) (0.013)
Year Dummy * High End Dummy -0.082 -0.445 -0.177(0.028) (0.040) (0.015)
log(Bandwidth) 0.229 0.189 0.042(0.048) (0.047) (0.014)
DHE * log (Bandwidth) -0.045 -0.035 0.098(0.049) (0.049) (0.015)
log(Number of ports available) 0.439 0.433 0.368(0.069) (0.053) (0.049)
DHE * log(Number of ports available 0.482 0.576 0.795(0.076) (0.072) (0.064)
log(FLASH Memory) -0.363 1.055 0.212(0.385) (0.359) (0.100)
DHE * log(FLASH Memory) -0.441 -1.213 -0.025(0.387) (0.362) (0.103)
log(Processor speed) 0.483 0.344 -0.767(0.000) (0.382) (0.122)
DHE * log(Processor speed) -0.241 -0.125 1.152(0.025) (0.383) (0.123)
log(DRAM Memory) -0.573 0.557 0.645(0.117) (0.062) (0.044)
DHE * log(DRAM Memory) 0.630 -0.208 -0.920(0.131) (0.087) (0.063)
DC power source 0.139 0.171 0.1501=YES 0=NO (0.073) (0.058) (0.031)
DHE * DC power source -0.056 -0.213 -0.1851=YES 0=NO (0.079) (0.071) (0.043)
N 399 1,595 4,744 R2 0.9802 0.9204 0.9174
Table 5: Adjacent Year Hedonic Regression Models for Routers

Table 6Price Indexes For Routers Based on Adjacent Year Regressions
1995 1996 1998 1999 A.A.G.R.1
SOHO Index 1.000 1.015 0.411 0.321 -24.72 (Percent change) 1.50 -59.48 -21.94
Low End Index 1.000 1.203 0.456 0.422 -19.40 (Percent change) 20.26 -62.11 -7.39
Midrange Index 1.000 1.127 1.133 1.133 3.16 (Percent change) 12.67 0.59 -0.06
High End Index 1.000 0.921 0.591 0.495 -16.11 (Percent change) -7.88 -35.85 -16.18
All Routers Index 2 1.000 1.066 0.622 0.557 -13.62 (Percent change) 6.56 -23.57 -10.55
1. Average annual growth rate.2. The "All Routers Index" was created by chain-weighting the four component indexes.

Variable Mean Std Dev Minimum Maximum1996 Dummy 0.347 0.477 0 1
1997 Dummy 0.049 0.216 0 1
1999 Dummy 0.230 0.422 0 1
2000 Dummy 0.374 0.485 0 1
10 MBPS Ethernet 0.791 0.407 0 11=YES 0=NO
log(number of 10 MBPS ports) 2.114 1.305 0 6.223
100 MBPS Ethernet 0.558 0.497 0 11=YES 0=NO
log(number of 100 MBPS ports) 0.458 1.010 0 4.382
1,000 MBPS Ethernet 0.228 0.420 0 11=YES 0=NO
log(number of 1,000 MBPS ports) 0.172 0.513 0 2.485
FDDI Capability 0.236 0.425 0 11=YES 0=NO
Number of FDDI ports 1.108 9.205 0 168
ATM Capability 0.149 0.357 0 11=YES 0=NO
Number of ATM Interfaces 0.125 0.639 0 10
Layer 3 Capability 0.379 0.486 0 11=YES 0=NO
Single Mode Fiber Capability 0.014 0.116 0 11=YES 0=NO
Table 7: Summary Statistics for LAN Switches

1996-2000 1996-1997 1997-1999 1999-20001997 Dummy -0.180 -0.189 NA NA
(0.128) (0.121)
1999 Dummy -0.900 NA -0.572 NA(0.11) (0.208)
2000 Dummy -1.005 NA NA -0.227(0.096) (0.105)
10 MBPS Ethernet -1.263 -0.829 -1.029 -1.6651=YES 0=NO (0.169) (0.202) (0.373) (0.244)
log(number of 10 MBPS ports) 0.391 0.143 0.402 0.595(0.048) (0.057) (0.111) (0.069)
100 MBPS Ethernet -0.284 -0.302 -0.105 -0.0911=YES 0=NO (0.075) (0.083) (0.185) (0.112)
log(number of 100 MBPS ports) 0.119 0.143 0.083 0.112(0.047) (0.089) (0.086) (0.056)
1,000 MBPS Ethernet 0.419 NA 0.159 0.3671=YES 0=NO (0.113) (0.235) (0.126)
log(number of 1,000 MBPS ports) 0.307 NA 0.45 0.34(0.082) (0.15) (0.088)
FDDI Capability 0.192 0.091 0.219 0.3291=YES 0=NO (0.085) (0.080) (0.19) (0.181)
Number of FDDI ports -0.012 -0.005 -0.013 -0.028(0.004) (0.003) (0.005) (0.021)
ATM Capability 0.047 -0.051 0.359 0.8721=YES 0=NO (0.108) (0.105) (0.309) (0.236)
Number of ATM Interfaces 0.247 0.216 -0.394 -0.466(0.056) (0.046) (0.431) (0.305)
Layer 3 Capability 0.529 0.339 0.554 0.6941=YES 0=NO (0.084) (0.099) (0.175) (0.120)
Single Mode Fiber Capability 1.203 1.223 1.198 1.1061=YES 0=NO (0.295) (0.452) (0.593) (0.421)
N 366 145 101 220
R2 0.740 0.537 0.678 0.796
Table 8: Hedonic Regression Models for LAN Switches

Table 9Average Price and Revenue for Different Types of LAN Cards
Average annualgrowth rate
1995 1996 1997 1998 1999 2000 (percent)10-Mbps Revenue ($ millions) 2,651 2,836 1,990 886 478 278 Price ($/card) 115 101 73 51 41 37 -20.2100-Mbps Revenue 142 736 1,879 2,582 2,826 3,023 Price 199 143 110 79 66 56 -22.41,000-Mbps Revenue 2 34 70 152 Price 2,111 850 735 681 -31.4Token-Ring Revenue 1,236 1,131 1,099 843 472 350 Price 310 283 228 196 169 174 -10.9FDDI Revenue 136 160 121 84 51 26 Price 1,123 1,069 904 838 751 731 -8.2ATM Revenue 43 66 79 98 73 75 Price 964 614 653 562 432 437 -14.7Wireless Revenue 105 188 316 488 Price 327 340 275 250 -8.6Matched Model Price Index
1.00 0.87 0.66 0.49 0.41 0.36 -18.3
Reported data is for the world market.