Embed Size (px)
Citation preview
Feb. 2016. Vol. 6, No.4 ISSN 2307-227X
International Journal of Research In Social Sciences © 2013-2016 IJRSS & K.A.J. All rights reserved www.ijsk.org/ijrss
26
PRICE VOLATILITY TRANSMISSION BETWEEN OPEC AND
NON-OPEC OILS, A WAVELET BASED APPROACH.
¹MS. ALEXANDER SOUZA BLOCK¹, ²DR. MARCELO BRUTTI RIGHI, ³DR. DANIEL
ARRUDA CORONEL,
1Pampa Federal University
2Universidade Federal do Rio Grande do Sul
3Santa Maria Federal University
Email: ¹[email protected], ²[email protected], ³[email protected]
ABSTRACT
The importance of measuring volatility cannot be ignored. Equally important is to understand how
volatility is transmitted between markets and assets. Using the wavelets methodology, this study seeks to
analyze at different frequencies, the direction and magnitude of volatility transmission in the crude oil
produced by OPEC countries and other producing and exporting countries that are not part of this
organization (non-OPEC. This approach contributes to the literature identifying the crude oil volatility in
different frequencies and in its origin, the producing countries. This way is possible to provide information
for Energy Policy Makers, investors and researchers about the two groups of suppliers, helping them to
define strategies of purchase, trade, storage and hedging.
Key-words: Price volatility transmission, OPEC and non-OPEC crude oils behavio, Frequency analysis.
1. INTRODUCTION
Since the 1986 oil price shock, the behavior of
these prices has become a daily concern for
governments and investors. Trading in crude oil
also changed, attracting numerous types of market
participants, not just the parts with commercial
interests, but also those who treat oil as a form of
investment. In recent years the role negotiation
became even wider and accessible. At the same
time, there is a relatively easy access to several
markets, particularly European and North
American markets.
On the world stage of oil, OPEC (Organization of
Petroleum Exporting Countries) plays a central role
in discussions about pricing and supply global
demand. Founded in 1960 by Iran, Iraq, Kuwait,
Saudi Arabia and Venezuela, in 2013 has 14
members, all major world producers. Aiming to
coordinate and unify petroleum policies of member
countries, ensuring fair and stable prices for the
producing countries, an efficient and regular supply
of petroleum to consuming nations and a fair return
for those investing in the industry (OPEC, 2012).
Despite having approximately 78% of proven
world reserves of oil (OPEC Annual Statistical
Bulletin, 2012), all member countries are
considered underdeveloped and are located mostly
in the Middle East and North Africa, regions of
great political instability and social. In this context
one should note the five major shocks in oil prices
due to this instability: 1956 with the nationalization
of the Suez Canal, 1973 with the Yom Kippur War,
1979 due to the Iranian revolution and 1991 with
the Gulf War I.
The majority of OPEC members are located in
regions of great political instability, social and
economic. As it is known, the Gulf region is very
rich in oil resources, being responsible for about
60% of U.S. imports of crude oil. Successive wars,
terrorists attacks and every kind of instability is
directly reflected on crude oil price.
However it must be considered that seven of the 15
largest oil producers are outside of OPEC (EIA,
2012). In 2006 these countries were: Russia, USA,
China, Mexico, Canada, Norway and Brazil.
However many non-OPEC producers are faced
with wells that are rapidly depleting. Some major
producers such as the United States, Mexico and
Norway, have experienced a decline in production
in recent years. However, the overall figures for
non-OPEC producers are reinforced by significant
increases in production in Brazil, Canada, and
Russia.
Feb. 2016. Vol. 6, No.4 ISSN 2307-227X
International Journal of Research In Social Sciences © 2013-2016 IJRSS & K.A.J. All rights reserved www.ijsk.org/ijrss
27
The importance of measuring volatility cannot be
ignored. Equally important is to understand how
volatility is transmitted between markets and
assets. In oil markets, agents often have exposure
to a large number of different types of crude oil,
with different prices and volatilities and enabling
them to build portfolios consisting of different
varieties of this commodity.
Notable paper verified these questions about
international crude oil markets. Weiner (1991)
results suggested that the world oil market is far
from unified and crude oil prices do not move
together around the world. However, more studies
tend to support that oil markets behave like one
common market (Adelman (1992); Gulen (1999);
Ewing and Harter (2000); Engle and Granger;
(1987), Bachmeier and Griffin (2006))
From a different point of view Salisu and Fasanya
(2012) employed the tests developed by Liu and
Narayan (2010) to detect structural breaks in data
series. This evidence suggests that oil volatility is
not uniform in time presenting persistence and
leverage effects. This kind of evidence shows some
necessity of investigate crude oil volatility from a
time variable point of view since its behavior is
changed because of the considered time window.
Therefore, using the wavelets methodology, this
study seeks to analyze at different frequencies, the
price volatility relations in the crude oil produced
by OPEC countries and other producing and
exporting countries that are not part of this
organization (non-OPEC). This way you can
understand the functioning of this important market
and answer the following question: How volatility
behaves in relations between the different types of
oil and how it is transmitted between OPEC
members and non-OPEC producers?
This approach brings two main contributions to the
literature: (1) We present the OPEC and non-OPEC
volatilities correlations in different frequencies and
(2) present the price volatility transmission
between these producers. This way is possible to
provide information for Energy Policy Makers,
investors and researchers about the two groups of
suppliers, helping them to define strategies of
purchase, trade, storage and hedging.
This paper is structured as follows. Section 2
provides a review of the selected studies and aims
to demonstrate how the wavelets methodology can
bring a new perspective to this issue. In Section 3
we describe the data and period analyzed, and
present the econometric model developed in this
paper. The application, estimation and comparison
with previous studies are presented in Section 4
with some tables and figures. In Section 5 we draw
some important policy conclusions about the
volatility relations among crude oil producers’
countries.
2. WAVELETS APPLICABILITY
The interaction of a variable with the changes of
the environment may result in a universe of
relationships, difficult to be observed and
understood In this sense, the filtering methods in
finance and economics are useful tools to identify
certain features and behavior of time series.
Decomposing the series is possible to extract
seasonality, trends and noise. Thus, Wavelets are
an interesting methodology to decompose time
series in different frequencies and reveal more
information.
The method uses a wavelet basic function called
mother wavelet, which is expanded and contracted
to capture local characteristics in time and
frequency. The wavelet filter is long in time when
capturing low frequency events, and short in time
when capturing events of high frequency. Through
combinations to expand and contract the "mother
wavelet", you can capture all the information
present in a time series (Gençay et al., 2002). Thus,
the wavelet fits through a range of frequencies, to
capture and locate features events that are local in
time. This makes this method an excellent tool for
time series analysis, especially non-stationary.
Capobianco (2003) investigated this potential for
decomposing financial volatility processes. The
results indicate that wavelets and derived
functional dictionaries may play an important role
in detecting hidden features and the dependence
structures.
Looking to demonstrate the contributions of
wavelet methodology to correlations analysis,
Razdan (2004) studied the correlations between
Bombay stock index (BSE) and National stock
index (NSE). As known the traditional correlation
coefficient between these indices is 99310.r ,
indicating that the BSE index is strongly correlated
with NSE index. However using the Wavelet
correlation coefficient he was capable to show that
this correlation changes as the time scale, including
Feb. 2016. Vol. 6, No.4 ISSN 2307-227X
International Journal of Research In Social Sciences © 2013-2016 IJRSS & K.A.J. All rights reserved www.ijsk.org/ijrss
28
being negative. This found highlights the
applicability of wavelets in reveal new information.
Souza and Silva (2010), employed wavelet analysis
to remove high frequency price movements of oil
price, then using hidden Markov model, they were
capable to forecast the probability distribution of
the price return accumulated over the next days and
infer future price trends.
Power and Turvey (2010) analyzed the long-range
dependence in the volatility of 14 commodities
futures prices including crude oil. Using wavelets
to decompose in time scales and Hurst coefficient,
was not possible to reject the null hypothesis that
the long memory parameter H has been constant
over the entire sample characterizing no long-range
dependence. Unlike the findings of Alvarez-
Ramirez et al (2008) were no evidences of the
existence of a trend in the time-varying Hurst
coefficient for any of the commodity futures.
Wavelets can be especially useful to investigate
reanalyze old questions with divergent results,
given its capacity to revel more time-series
information. Benhmad (2012) used a wavelet
approach to study the linear and nonlinear Granger
causality between the real oil price and the real
effective U.S. Dollar exchange rate. The series
decomposition reveled seven frequency bands with
different causality relations each. This approach
show that previous studies were capable to detect
only the relation present at the analyzed frequency,
and the wavelets decomposition expand the
researched universe.
Several papers had divergent results when analyzed
the relationship between crude oil price changes
and stock market returns. Combining wavelet
analysis and Markov Switching Vector
Autoregressive (MS-VAR) model to explore the
Impact of the crude oil shocks on the stock market
returns for UK, France and Japan, Jammaz & Aloui
(2010), shows the efficiency of wavelet to filtering
series and determining the behavior of the stock
market volatilities. Applying this technique, they
were able to extract the driving dynamics of crude
oil prices and to bring out past events that were not
originally visible.
Using wavelets methodology we are able to
identify the behavior of crude oil volatility in
different frequencies. This approach can be
especially meaningful to understand the
transmission direction; supplying market
participates with more precise information.
3. METHODOLOGY
3.1 Wavelets filtering methodology
According to Gençay et al. (2002) a wavelet ψ (t) is
a function of time (t) wich obeys two basic rules,
known as wavelet admissibility condition. The first
condition ensures that ψ (f) goes to zero quickly as
f→0. This first condition can be expressed by
,0)(
dtt (1)
The second condition imposed on a wavelet
function is unit energy, that is,
,1|)(| 2
dtt (2)
In order to quantify the function change at a
particular frequency and at a certain point in time
the mother-wavelet ψ (t) is dilated and translated,
s
ut
stsu
1)(, (3)
Where: u and s are, respectively, the time location
and scale parameters or frequency ranges. The
continuous wavelet transform (CWT) is a function
),( suW which is obtained by projecting the
original function x (t) in the mother wavelet
)(, tsu ,
.)()(),( , dtttxsuW su (4)
In order to assess variations in large-scale basis (ie
a low frequency), a large value for s must be
chosen, and vice versa. Applying CWT for a
continuous location and scale parameters of a
function, it is possible to extract a set of "basic"
components.
3.2 Transmission and Granger causality
The Granger causality test (1961) has
Feb. 2016. Vol. 6, No.4 ISSN 2307-227X
International Journal of Research In Social Sciences © 2013-2016 IJRSS & K.A.J. All rights reserved www.ijsk.org/ijrss
29
been applied in several economic and financial
studies, as an efficient methodology to detect the
direction of transmissions whether of prices,
currency exchange rates or volatilities. Wang
(2010) analyzed the volatility transmission between
U.S. industries. Using causality tests, the results
showed that the industrial base, producing
machinery, can be a source of risk that can affect
virtually all other sectors. Their results indicate that
traditional sectors like oil and automobile
apparently not seem to have great influence on
other major sectors. Bentzen (2007) used high
frequency data and causality tests to investigate the
relationship between WTI, Brent and Dubai. The
results demonstrate bidirectional transmissions,
which highlights the globalization of this market.
He et al. (2010) investigated the relationship
between economic activity and oil prices. They
found strong evidence of Granger causality
between these variables. Other applications of
Granger causality test can also be found in Hong
(2001), Bubak et. al (2011) Nishiyama (2011).
According Tsay (2008), the Granger causality test
is based on the assumption that the future cannot
cause the past nor the present . Thus, if Y
comes after X, then Y cannot cause X. Likewise if
X precedes Y, that does not mean that X causes Y.
Thus the test looks for an evidence of any of the
following events: i) X causing Y (X → Y), ii) Y
cause X (Y → X), iii) bi causality (Y → X and X
→ Y).
Thus, the test Granger causality checks whether
information contained in a time series explain the
occurrence of variations in the other series.
Formally, in the current study, the causality test is
represented as follow,
k
i
k
i
txitiyitixlt yxx1 1
,,,, (5)
k
i
k
i
tyitiyitixlt yxy1 1
,,,, (6)
where ltx , and
lty , represent the volatility,
squared return, of the OPEC and non-OPEC crude
oil price, in time t and in the frequency l, tx, and
ty , are white noise. Do not reject the null
hypothesis 0... ,2,1,0 kxyyH ,
in the regression equation (5) implies that the
volatility of OPEC crude oil prices do not Granger
cause the volatility of the price of non-OPEC crude
oil. Similarly, do not reject the null hypothesis,
0... ,2,1,0 kxxxH , in the
regression equation (6) implies that the volatility of
non-OPEC do not Granger cause the OPEP crude
oil volatility.
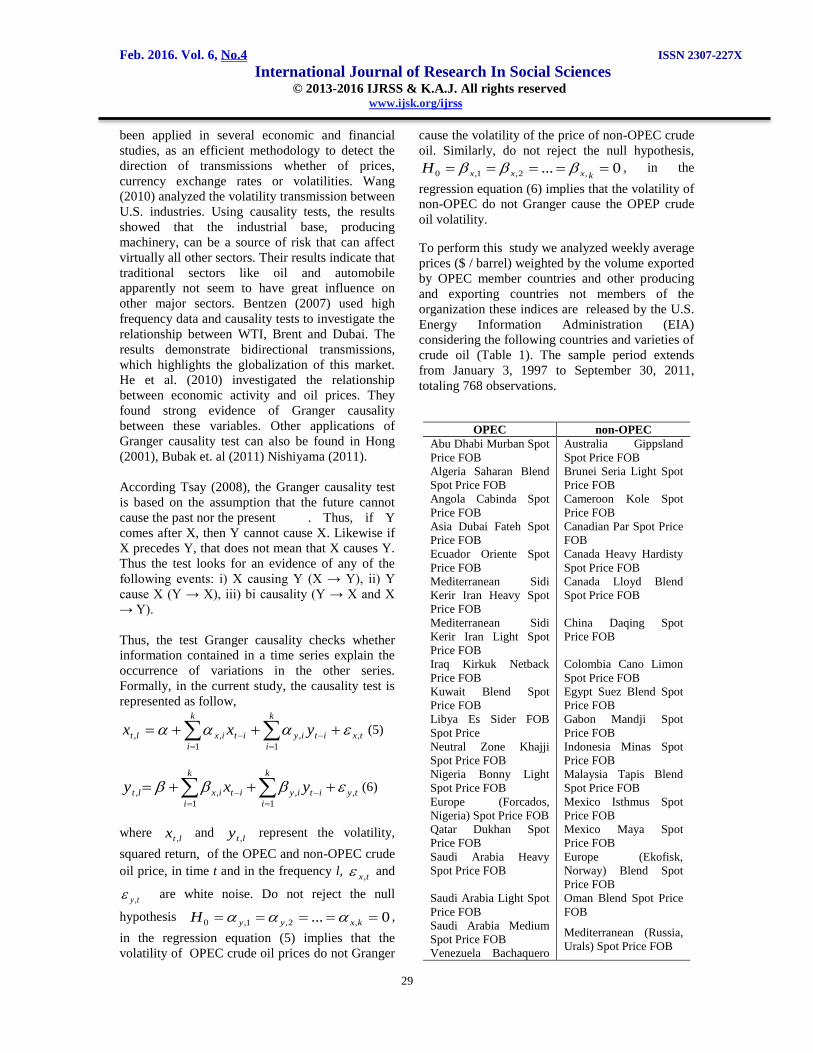
To perform this study we analyzed weekly average
prices ($ / barrel) weighted by the volume exported
by OPEC member countries and other producing
and exporting countries not members of the
organization these indices are released by the U.S.
Energy Information Administration (EIA)
considering the following countries and varieties of
crude oil (Table 1). The sample period extends
from January 3, 1997 to September 30, 2011,
totaling 768 observations.
OPEC non-OPEC
Abu Dhabi Murban Spot
Price FOB
Australia Gippsland
Spot Price FOB
Algeria Saharan Blend
Spot Price FOB
Brunei Seria Light Spot
Price FOB
Angola Cabinda Spot
Price FOB
Cameroon Kole Spot
Price FOB
Asia Dubai Fateh Spot
Price FOB
Canadian Par Spot Price
FOB
Ecuador Oriente Spot
Price FOB
Canada Heavy Hardisty
Spot Price FOB
Mediterranean Sidi
Kerir Iran Heavy Spot
Price FOB
Canada Lloyd Blend
Spot Price FOB
Mediterranean Sidi
Kerir Iran Light Spot
Price FOB
China Daqing Spot
Price FOB
Iraq Kirkuk Netback
Price FOB
Colombia Cano Limon
Spot Price FOB
Kuwait Blend Spot
Price FOB
Egypt Suez Blend Spot
Price FOB
Libya Es Sider FOB
Spot Price
Gabon Mandji Spot
Price FOB
Neutral Zone Khajji
Spot Price FOB
Indonesia Minas Spot
Price FOB
Nigeria Bonny Light
Spot Price FOB
Malaysia Tapis Blend
Spot Price FOB
Europe (Forcados,
Nigeria) Spot Price FOB
Mexico Isthmus Spot
Price FOB
Qatar Dukhan Spot
Price FOB
Mexico Maya Spot
Price FOB
Saudi Arabia Heavy
Spot Price FOB
Europe (Ekofisk,
Norway) Blend Spot
Price FOB
Saudi Arabia Light Spot
Price FOB
Oman Blend Spot Price
FOB
Saudi Arabia Medium
Spot Price FOB Mediterranean (Russia,
Urals) Spot Price FOB Venezuela Bachaquero
Feb. 2016. Vol. 6, No.4 ISSN 2307-227X
International Journal of Research In Social Sciences © 2013-2016 IJRSS & K.A.J. All rights reserved www.ijsk.org/ijrss
30
OPEC non-OPEC
17 Spot Price FOB
Venezuela Bachaquero
24 Spot Price FOB Europe (UK) Brent
Blend Spot Price FOB Venezuela Tia Juana
Light Spot Price FOB Table 1: Crude oil used in the composition of OPEC and
non-OPEC averages
Note: FOB denotes Free on Board, price without
additional costs as insurance or taxes.
In this work the squared log-return are chosen to
represent the volatility once it can be considered an
efficient measure of dispersion behavior, been
calculated according to equation (7): 22
1 )())/(log( ttt rpp (7)
Where pt and pt-1 are the crude oil prices indexes
in time t. According to Gençay et al. (2002) this
is an efficient proxy for volatility, once its
represent the price fluctuations in time, respecting
the main characteristics of volatility. Furthermore,
how it is not an estimation, does not
present estimation error, being ideal to be
decomposed by Wavelets.
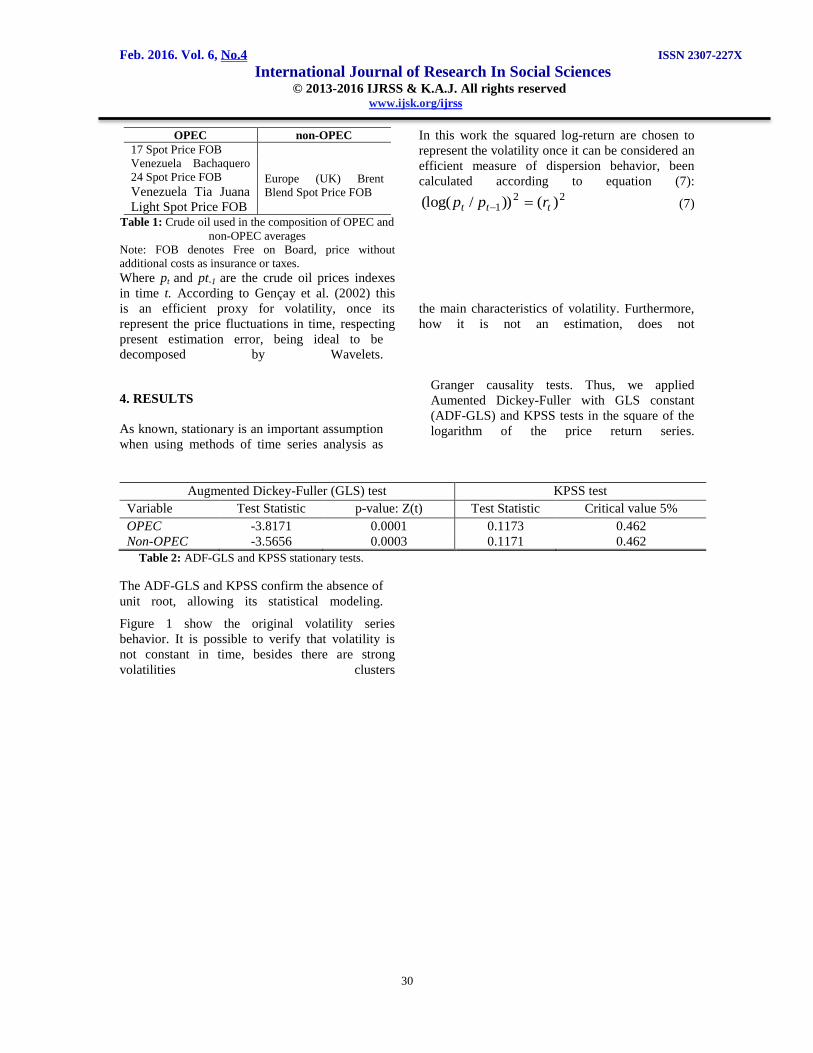
4. RESULTS
As known, stationary is an important assumption
when using methods of time series analysis as
Granger causality tests. Thus, we applied
Aumented Dickey-Fuller with GLS constant
(ADF-GLS) and KPSS tests in the square of the
logarithm of the price return series.
Augmented Dickey-Fuller (GLS) test KPSS test
Variable Test Statistic p-value: Z(t) Test Statistic Critical value 5%
OPEC -3.8171 0.0001 0.1173 0.462
Non-OPEC -3.5656 0.0003 0.1171 0.462
Table 2: ADF-GLS and KPSS stationary tests.
The ADF-GLS and KPSS confirm the absence of
unit root, allowing its statistical modeling.
Figure 1 show the original volatility series
behavior. It is possible to verify that volatility is
not constant in time, besides there are strong
volatilities clusters
Feb. 2016. Vol. 6, No.4 ISSN 2307-227X
International Journal of Research In Social Sciences © 2013-2016 IJRSS & K.A.J. All rights reserved www.ijsk.org/ijrss
31
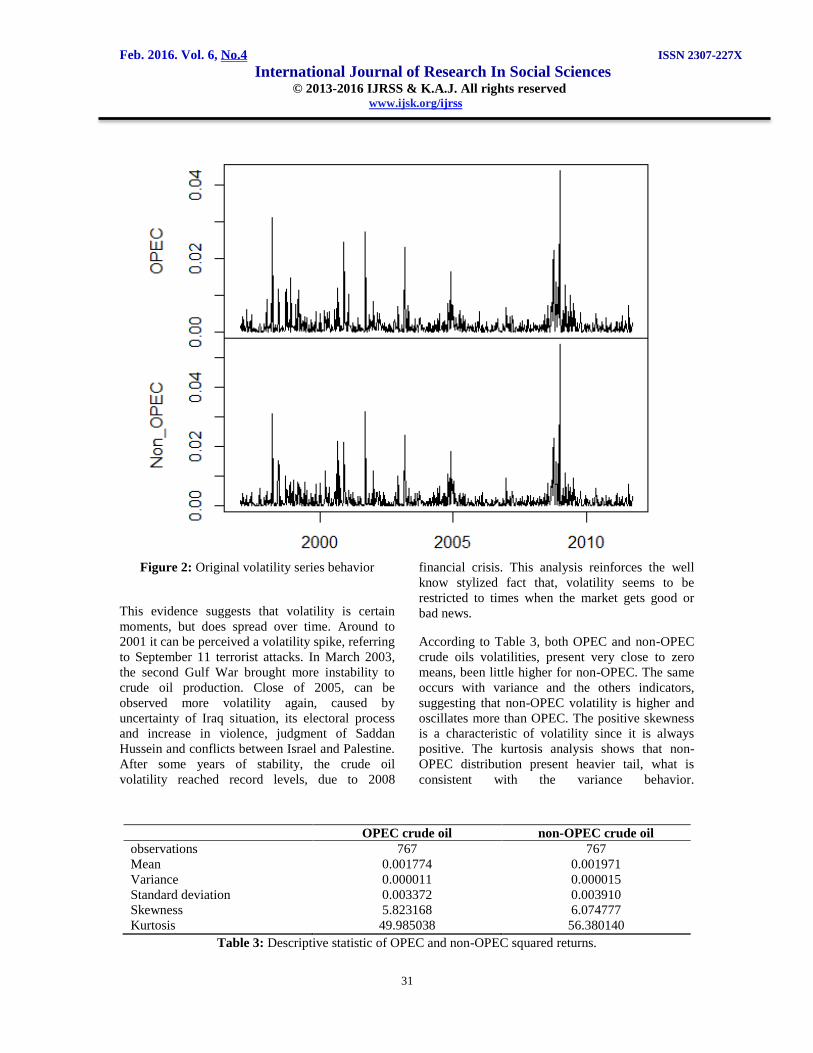
Figure 2: Original volatility series behavior
This evidence suggests that volatility is certain
moments, but does spread over time. Around to
2001 it can be perceived a volatility spike, referring
to September 11 terrorist attacks. In March 2003,
the second Gulf War brought more instability to
crude oil production. Close of 2005, can be
observed more volatility again, caused by
uncertainty of Iraq situation, its electoral process
and increase in violence, judgment of Saddan
Hussein and conflicts between Israel and Palestine.
After some years of stability, the crude oil
volatility reached record levels, due to 2008
financial crisis. This analysis reinforces the well
know stylized fact that, volatility seems to be
restricted to times when the market gets good or
bad news.
According to Table 3, both OPEC and non-OPEC
crude oils volatilities, present very close to zero
means, been little higher for non-OPEC. The same
occurs with variance and the others indicators,
suggesting that non-OPEC volatility is higher and
oscillates more than OPEC. The positive skewness
is a characteristic of volatility since it is always
positive. The kurtosis analysis shows that non-
OPEC distribution present heavier tail, what is
consistent with the variance behavior.
OPEC crude oil non-OPEC crude oil
observations 767 767
Mean 0.001774 0.001971
Variance 0.000011 0.000015
Standard deviation 0.003372 0.003910
Skewness 5.823168 6.074777
Kurtosis 49.985038 56.380140
Table 3: Descriptive statistic of OPEC and non-OPEC squared returns.
Feb. 2016. Vol. 6, No.4 ISSN 2307-227X
International Journal of Research In Social Sciences © 2013-2016 IJRSS & K.A.J. All rights reserved www.ijsk.org/ijrss
32
As know the OPEC is responsible for most crude
oil production, and how it is an Organization, all
members take decisions together, unlike what
occurs for non-OPEC countries, which do not have
a coordinated policy. This regulation from OPEC
side can offers some stability to the market. This
supply regulation is perceived for market agents
and it has a little reflex in the descriptive statistics.
Besides, OPEP countries are more traditional
producers and exporters and their reserves capacity
is already know, while non-OPEP countries has
most part of their reserves discovered during the
last few years, and the annual extracted volume is
not stable yet (a good example is Brazil, with huge
reserves in the pre-salt layer, but due to technical
complexity and high costs, they remain
unexplored). Despite of seven of the 15 largest oil
producers do not belong to OPEC, non-OPEP
countries are not big exporters, they consume the
most part of this production, and maybe that's can
be one of reason why their prices are more volatile.
In order to capture more information,
OPEC and non-OPEC volatility series were
decomposed using the Daubechies Wavelet LA(8).
According to Gençay (2002) the LA(8) present the
better fit to financial series behavior, especially
when one works with volatility. By applying this
formula, we decomposed in eight frequencies, D1
to D8, due to series lenght, considering frequencies
of 1, 2, 4, 8, 16, 32, 64 and 128 weeks respectively.
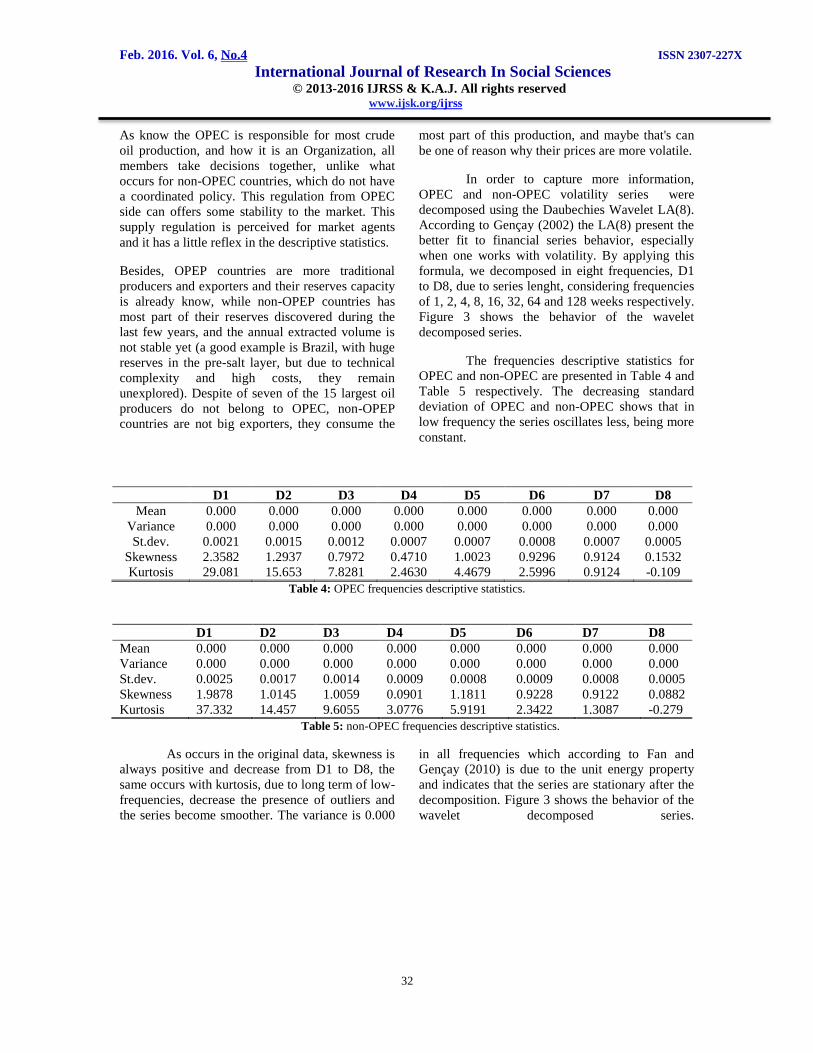
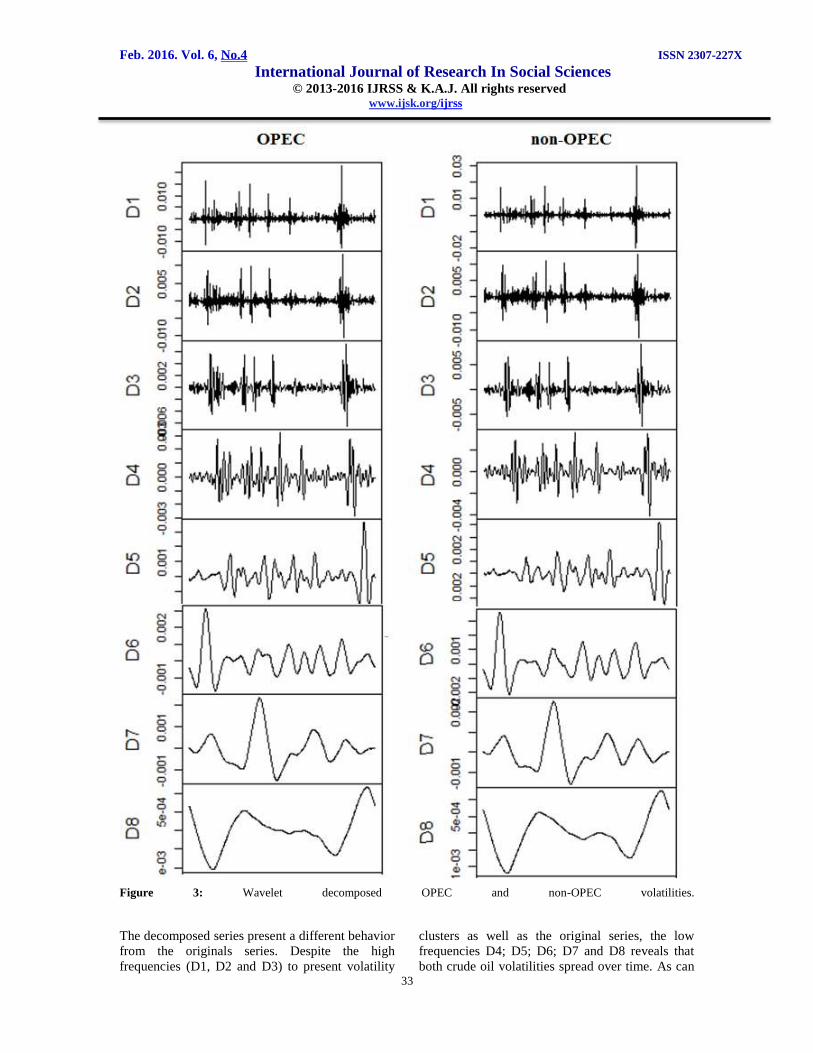
Figure 3 shows the behavior of the wavelet
decomposed series.
The frequencies descriptive statistics for
OPEC and non-OPEC are presented in Table 4 and
Table 5 respectively. The decreasing standard
deviation of OPEC and non-OPEC shows that in
low frequency the series oscillates less, being more
constant.
D1 D2 D3 D4 D5 D6 D7 D8
Mean 0.000 0.000 0.000 0.000 0.000 0.000 0.000 0.000
Variance 0.000 0.000 0.000 0.000 0.000 0.000 0.000 0.000
St.dev. 0.0021 0.0015 0.0012 0.0007 0.0007 0.0008 0.0007 0.0005
Skewness 2.3582 1.2937 0.7972 0.4710 1.0023 0.9296 0.9124 0.1532
Kurtosis 29.081 15.653 7.8281 2.4630 4.4679 2.5996 0.9124 -0.109
Table 4: OPEC frequencies descriptive statistics.
D1 D2 D3 D4 D5 D6 D7 D8
Mean 0.000 0.000 0.000 0.000 0.000 0.000 0.000 0.000
Variance 0.000 0.000 0.000 0.000 0.000 0.000 0.000 0.000
St.dev. 0.0025 0.0017 0.0014 0.0009 0.0008 0.0009 0.0008 0.0005
Skewness 1.9878 1.0145 1.0059 0.0901 1.1811 0.9228 0.9122 0.0882
Kurtosis 37.332 14.457 9.6055 3.0776 5.9191 2.3422 1.3087 -0.279
Table 5: non-OPEC frequencies descriptive statistics.
As occurs in the original data, skewness is
always positive and decrease from D1 to D8, the
same occurs with kurtosis, due to long term of low-
frequencies, decrease the presence of outliers and
the series become smoother. The variance is 0.000
in all frequencies which according to Fan and
Gençay (2010) is due to the unit energy property
and indicates that the series are stationary after the
decomposition. Figure 3 shows the behavior of the
wavelet decomposed series.
Feb. 2016. Vol. 6, No.4 ISSN 2307-227X
International Journal of Research In Social Sciences © 2013-2016 IJRSS & K.A.J. All rights reserved www.ijsk.org/ijrss
33
Figure 3: Wavelet decomposed OPEC and non-OPEC volatilities.
The decomposed series present a different behavior
from the originals series. Despite the high
frequencies (D1, D2 and D3) to present volatility
clusters as well as the original series, the low
frequencies D4; D5; D6; D7 and D8 reveals that
both crude oil volatilities spread over time. As can
Feb. 2016. Vol. 6, No.4 ISSN 2307-227X
International Journal of Research In Social Sciences © 2013-2016 IJRSS & K.A.J. All rights reserved www.ijsk.org/ijrss
34
be observed, wavelet decomposition reveals that
crude oil volatility does not keep isolated in one
single event, it is capable to contaminate the
following periods. This means that considering
longer periods of observation
,
once the series are strike by bad or god news,
volatility does not come back to the level before
keeping their effects on the market. From a
different point of view Jin et al. (2012) conclude
that only large shocks will increase expected
conditional volatilities. This can be confirmed
for wavelet decomposition, once the volatility
seems to be embodied in futures periods.
This result can bring new information to oil market
agents. Long-term investors can be subject to
volatility effects for long periods, while short-term
investors are subject only to volatility. That does
not mean that short-term investors are less exposed
to risk, but means that long-term investors must to
monitor events for longer periods.
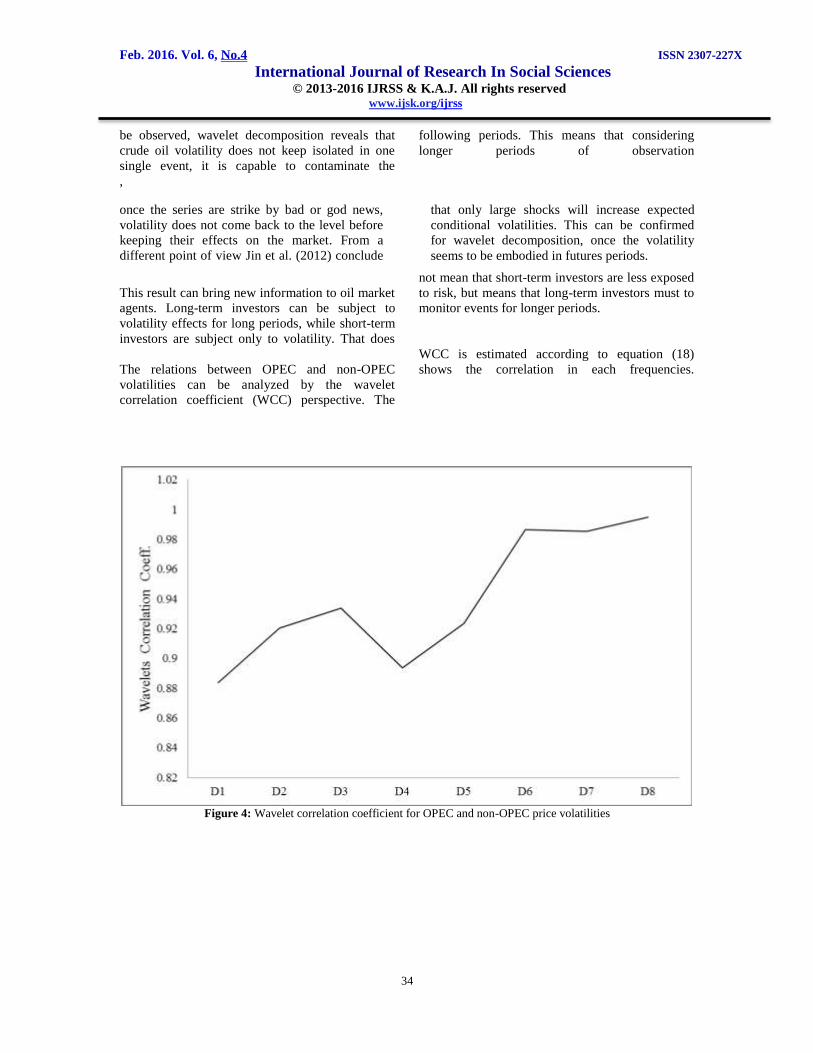
The relations between OPEC and non-OPEC
volatilities can be analyzed by the wavelet
correlation coefficient (WCC) perspective. The
WCC is estimated according to equation (18)
shows the correlation in each frequencies.
Figure 4: Wavelet correlation coefficient for OPEC and non-OPEC price volatilities
Feb. 2016. Vol. 6, No.4 ISSN 2307-227X
International Journal of Research In Social Sciences © 2013-2016 IJRSS & K.A.J. All rights reserved www.ijsk.org/ijrss
35
As can be observed the correlations grows in the
lower frequencies. In D1 we found the lower
correlation (r*=0.8838), and in the lower
frequency, D8 we found the higher correlation
(0.9950). This evidence shows that the
correlation, besides strong, is not constant over
time and points to the existence of volatility
adjustment mechanisms. In short term the
volatility is not the same for OPEC and non-
OPEC crude oils, however we can say that in
long term the volatility spreads for both oils
contaminating them equally.
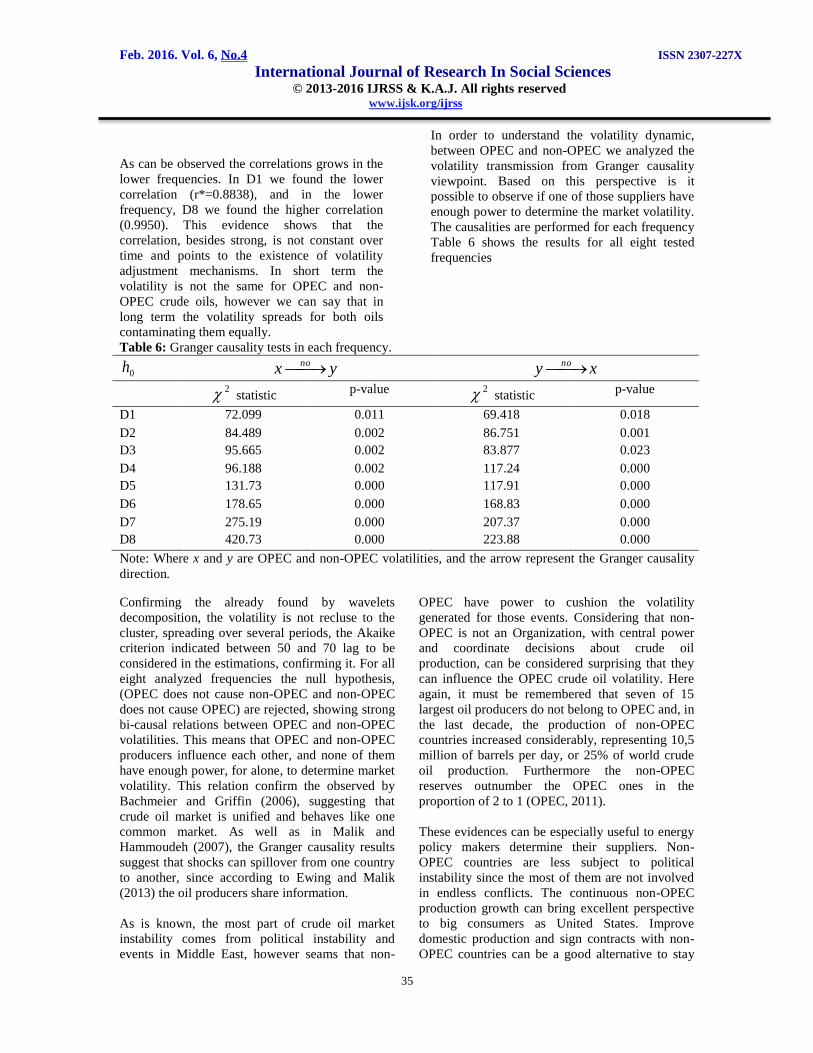
In order to understand the volatility dynamic,
between OPEC and non-OPEC we analyzed the
volatility transmission from Granger causality
viewpoint. Based on this perspective is it
possible to observe if one of those suppliers have
enough power to determine the market volatility.
The causalities are performed for each frequency
Table 6 shows the results for all eight tested
frequencies
Table 6: Granger causality tests in each frequency.
0h yx no xy no
2 statistic p-value 2 statistic
p-value
D1 72.099 0.011 69.418 0.018
D2 84.489 0.002 86.751 0.001
D3 95.665 0.002 83.877 0.023
D4 96.188 0.002 117.24 0.000
D5 131.73 0.000 117.91 0.000
D6 178.65 0.000 168.83 0.000
D7 275.19 0.000 207.37 0.000
D8 420.73 0.000 223.88 0.000
Note: Where x and y are OPEC and non-OPEC volatilities, and the arrow represent the Granger causality
direction.
Confirming the already found by wavelets
decomposition, the volatility is not recluse to the
cluster, spreading over several periods, the Akaike
criterion indicated between 50 and 70 lag to be
considered in the estimations, confirming it. For all
eight analyzed frequencies the null hypothesis,
(OPEC does not cause non-OPEC and non-OPEC
does not cause OPEC) are rejected, showing strong
bi-causal relations between OPEC and non-OPEC
volatilities. This means that OPEC and non-OPEC
producers influence each other, and none of them
have enough power, for alone, to determine market
volatility. This relation confirm the observed by
Bachmeier and Griffin (2006), suggesting that
crude oil market is unified and behaves like one
common market. As well as in Malik and
Hammoudeh (2007), the Granger causality results
suggest that shocks can spillover from one country
to another, since according to Ewing and Malik
(2013) the oil producers share information.
As is known, the most part of crude oil market
instability comes from political instability and
events in Middle East, however seams that non-
OPEC have power to cushion the volatility
generated for those events. Considering that non-
OPEC is not an Organization, with central power
and coordinate decisions about crude oil
production, can be considered surprising that they
can influence the OPEC crude oil volatility. Here
again, it must be remembered that seven of 15
largest oil producers do not belong to OPEC and, in
the last decade, the production of non-OPEC
countries increased considerably, representing 10,5
million of barrels per day, or 25% of world crude
oil production. Furthermore the non-OPEC
reserves outnumber the OPEC ones in the
proportion of 2 to 1 (OPEC, 2011).
These evidences can be especially useful to energy
policy makers determine their suppliers. Non-
OPEC countries are less subject to political
instability since the most of them are not involved
in endless conflicts. The continuous non-OPEC
production growth can bring excellent perspective
to big consumers as United States. Improve
domestic production and sign contracts with non-
OPEC countries can be a good alternative to stay
Feb. 2016. Vol. 6, No.4 ISSN 2307-227X
International Journal of Research In Social Sciences © 2013-2016 IJRSS & K.A.J. All rights reserved www.ijsk.org/ijrss
36
less subject to crude oil volatility, cushioning bad
news.
Another important political and economic
conclusion comes from the fact that non-OPEC
even not being an Organization and still be able to
influence the crude oil volatility. If important non-
OPEC producers and consumers as United States,
Canada, Norway, Brazil, Russia, Mexico and China
have coordinate oil policy this influence could be
stronger.
CONCLUSIONS
Since its foundation, OPEC is in the center of crude
oil supply, its decisions and policy has determined
the market volatility. Especially in the last three
decades, crude oil market has gone through many
turbulent periods. Conflict, terrorist attacks and
financial crises have increased the market
volatility. At the same time, new reserves have
been discovered, and new countries have gained
important roles in this scenario, and now seven of
the 15 largest oil producers do not belong to this
organization.
To understand the role of OPEC and non-OPEC
crude oil in the market volatility, this study
employed the Wavelets methodology to decompose
the series and realize a detailed frequency analysis
of volatility transmission in this market. It’s
possible to observe that crude oil volatility is not
restrict clusters, the frequency analysis reveal that
it spreads over time contaminating futures periods.
The correlation between OPEC and non-OPEC
price volatilities is not constant, changing in each
frequency. It is possible to observe that the wavelet
correlation coefficient grows in the lower
frequencies pointing to the existence of volatility
adjustment mechanisms, which are confirmed by
the volatility transmission analysis.
The strong bi-causal relation between OPEC and
non-OPEC crude oil volatilities confirms the found
by Bachmeier and Griffin (2006), and show
evidences that non-OPEC has e has as much force
as OPEC to influence the market volatility,
suggesting volatility spillovers between both.
Considering that non-OPEC is not an Organization,
with central power and coordinate decisions about
crude oil production, can be considered surprising
that they can influence the OPEC crude oil
volatility. If important non-OPEC producers and
consumers have coordinate oil policy this influence
could be stronger.
The increasing participation of non-OPEC
countries in the oil production can be the reason
behind this behavior. Those evidences can be
especially useful to energy policy makers
determine their suppliers, since Non-OPEC
countries are less subject to political instability
since the most of them are not involved in endless
conflicts.
To improve this research, we suggest the use of
structural breaks and copula function to model the
volatility. The absence of longer series, with
previous periods is a limitation of this study, since
was not possible to verify if this behavior was the
same before 1997.
References:
1. Adelman, M.A., 1992. Is the world oil
market ‘one great pool’? – Comment.
Energy J. 13 (1), 157–158.
2. Alvarez-Ramirez, J. Alvarez, E.
Rodriguez, G. Fernandez-Anaya, 2008.
Time-varying Hurst exponent for US
stock markets, Physica A 387 6159-6169.
3. Bachmeier, L.J., Griffin, J.M., 2006.
Testing for market integration crude, oil,
coal, and natural gas. Energy J. 27 (2),
55–71.
4. Benhmad, F. (2012). Modeling nonlinear
Granger causality between the oil price
and .U.S. dollar: A wavelet based
approach. Economic Modelling, 29,
1505–1514.
5. Bentzem, J. 2007. Does OPEC influence
crude oil prices? Testing for co-
movements and causality between
regional crude oil prices. Applied
Economics. v. 39, Issue 11.
6. Capobianco, E. 2003. Empirical volatility
analysis: feature detection and signal
extraction with function dictionaries.
Physica A, A319 495 – 518.
7. Cheung, C.S., Kwan, C., 1992. A note on
the transmission of public information
across international stock markets. J.
Bank. Finance 16, 831–837.
Feb. 2016. Vol. 6, No.4 ISSN 2307-227X
International Journal of Research In Social Sciences © 2013-2016 IJRSS & K.A.J. All rights reserved www.ijsk.org/ijrss
37
8. de Souza e Silva, E.G., Legeya, L., de
Souza e Silva E. A., 2010, Forecasting oil
price trends using wavelets and hidden
Markov models Energy Economics 32,
1507–1519.
9. Engle, R.F., Granger, C.W.J., 1987. Co-
integration and error correction:
representation, estimation and testing.
Econometrica 55, 251–276.
10. Ewing, B.T., Harter, C.L., 2000. Co-
movements of Alaskan North Slope and
UK Brent crude oil prices. Applied.
Economic. Letters. 7, 553–558.
11. Granger, C. W. J., 1961. Invetigating
causal relations by econometric models.
Econometrica, 37, 424 - 438.
12. Gulen, S.G., 1999. Regionalization in the
world crude oil market: further evidence.
Energy J. 20 (1), 125–139.
13. Hong Y. A. Test for volatility spillover
with application to exchange rates.
Journal of Econometrics, 103), pp. 183–
224, 2001.
14. Jammazi, R., Aloui, C. Wavelet
decomposition and regime shifts:
Assessing the effects of crude oil shocks
on stock market returns. Energy Policy 38,
1415–1435.
15. Jin, X., Lin S. X.; Tamvakis, M.; JIN, X.
et al. Volatility transmission and volatility
impulse response functions in crude oil
markets. Energy Economics, 34 (2012)
2125–2134.
16. Malik, F.; Hammoudeh, S. Shock and
volatility transmission in the oil, US and
Gulf equity markets International Review
of Economics and Finance 16, 357–368.
17. Narayan, P.K.,Popp,S., 2010. A new unit
root test with two structural breaks in
level and slope at unknown time. Journal
of Applied Statistics 37 (9), 1425–1438.
18. Ng, V.K., Chang, R.P., Chou, R.Y., 1991.
An examination of the behavior of Pacific
basin stock market volatility. In: Rhee,
S.G., Chang, R. (Eds.), Pacific Basin
Capital Markets Research, vol. II. Elsevier
Science Publishers, Amsterdam,.
19. Nishiyama Y., The term structure of CD
rates and monetary policy transmission.
Journal of Banking & Finance, 35, 82–94,
2011.
20. Organization of Oil Exporting Countries,
2011. OPEC Annuary,. Avaiable at
http://www.opec.org. Accessed at
2/13/2013.
21. Power, G.J. and Turvey C.G. (2010).
Long-range dependence in the volatility of
commodity futures prices: Wavelet-based
evidence. Physica A, 389, 79-90.
22. Razdan, A., 2004. Wavelet correlation
coefficient of ‘strongly correlated’ time
series. Physica A, 333, 335 – 342.
23. Salisu, A. A., Fasanya, I.O., 2013.
Modelling oil price volatility with
structural breaks. Energy Policy 52, 554–
562.
24. Souza e Silva, E. G., Legey, L. F., Souza e
Silva, E. A. (2010). Forecasting oil price
trends using wavelets and hidden Markov
models Energy Economics 32 1507–1519.
25. Tsay, R., S. 2008.. Analysis of Financial
Time Series. 3 ed. New Jersey.John Wiley
& Sons,
26. Wang, Z., 2010. Dynamics and causality
in industry-specific volatility. Journal of
Banking & Finance 34, 1688–1699.
27. Weiner, N., Extrapolation, Interpolation,
and Smoothing of Stationary Time Series.
Wiley, New York. 1949.