Embed Size (px)
Citation preview

Economic History Working Papers
No: 253/2016
Economic History Department, London School of Economics and Political Science, Houghton Street, London, WC2A 2AE, London, UK. T: +44 (0) 20 7955 7084. F: +44 (0) 20 7955 7730
Price shocks in disaster: the Great Kantō Earthquake in Japan,1923
Janet Hunter London School of Economics
Kota Ogasawara
Tokyo Institute of Technology,

LONDON SCHOOL OF ECONOMICS AND POLITICAL SCIENCE
DEPARTMENT OF ECONOMIC HISTORY
WORKING PAPERS
NO. 253 - NOVEMBER 2016
Price shocks in disaster: the Great Kantō Earthquake in Japan,19231
Janet Hunter2
London School of Economics
Kota Ogasawara3 Tokyo Institute of Technology
Abstract
This paper tests the operation of markets in the wake of a sudden exogenous shock in prewar Japan, the Great Kantō Earthquake of 1923. Using a unique monthly wholesale price dataset of provincial cities, we found that the earthquake had a positive impact on the price of rice and timber in the sample cities. Our results also indicate that the wholesale price of rice in cities in the northeast of Japan, which were more closely integrated with the affected region, experienced more significant price rises than those in western Japan. Nevertheless, although further research using retail as opposed to wholesale prices of goods is needed, these preliminary findings suggest that the diffusion of price instability outwards from the affected region was on a lesser scale than might have been expected. Keywords: Great Kanto Earthquake; Natural disaster; Price shocks; JEL Codes: N15; N35; N45; N95; Q5
1 An early version of this paper was presented at the Economic History seminar at LSE. We are grateful to participants at for their constructive comments. We
also thank Yuki Kawakubo and Yukitoshi Matsushita for their valuable comments.
2 Department of Economic History, London School of Economics and Political Science, Houghton Street, London, WC2A 2AE, London, UK (E-mail:
3 Department of Industrial Engineering and Economics, School of Engineering, Tokyo Institute of Technology, 2-12-1, Ookayama, Meguro-ku, Tokyo, 152-
8552, Japan (E-mail: [email protected]).

2
1. Introduction
The economic, social and political impact of natural disasters on developing
economies is a recurrent theme in the contemporary world. While much attention
has been paid to sustained and cumulative disasters, such as famines and flooding,
the impact of one-off disasters, such as earthquakes and tsunami, has also
attracted attention, particularly in developing economies in regions such as
Southeast Asia, Latin America and the Caribbean. And yet, contrary to the mass
of historical scholarship that has been undertaken on famines,4 scholarly work on
the economic impact of these one-off disasters in the past has, for whatever reason,
remained relatively limited. Where there have been studies, the analysis has often
been more focussed on the political economy, for example in the case of Pereira's
study of the 1755 Lisbon earthquake.5
Is it, then, that such events are of limited significance in the longer term
economic trajectory of a country or a region? Guidance on this point from social
science theories appears to be of limited value. Such work as has been done makes
clear that such shocks are likely to have a negative impact at least on short term
growth, but at the same time has confirmed that little analysis has been
undertaken of the mechanisms whereby this negative impact might be generated.6
Over the longer term, the effects of these short term shocks have been evaluated as
both contractionary and expansionary, and the issue remains somewhat open.
Certainly wealthier economies have tended to withstand such shocks better than
poorer ones.7 Evaluations have in most cases looked at the macroeconomic picture
in terms of GDP or incomes, but analysis of other indicators has been more limited,
as have any attempts to disaggregate the macroeconomic indicators. How the stage
of the business cycle might influence any measured impact, or how long it might
last, also remain unknown. There is, moreover, the perennial problem of how to
construct any appropriate counterfactual.
This paper seeks to contribute to the limited existing literature by focusing on
4 See eg. Amartya Sen, Poverty and Famines: an Essay on Entitlement and Deprivation (Oxford: Oxford University Press, 1983); Cormac O'Grada, Famine: a Short History (Princeton NJ: Princeton University Press, 2009).
5 Alvaro S.Pereira, `The Opportunity of a Disaster: the Economic Impact of the 1755 Lisbon Earthquake', Journal of Economic History 69, 2, June 2009, pp.466-499.
6 E.Cavallo & I.Noy, ‘The Economics of Natural Disasters – a Survey’, International Review of Environmental and Resource Economics 5, 1, 2011, pp.1-40.
7 Hideki Tōya & Mark Skidmore, ‘Economic Development and the Impacts of Natural Disasters’, Economics Letters 94, 2007, pp.20-25.

2
the mechanisms whereby this kind of one-off exogenous shock impacts on economic
transactions in the months and years immediately following the disaster. Our
assumption is that these shorter-term effects are likely to be crucial in determining
the longer-term impact of any such disaster on an economy. Our attention will be
focussed on the extent to which the effects of a geographically confined exogenous
physical shock, such as an earthquake, are diffused beyond the area that has been
physically affected by that shock. The potential for such geographical diffusion has
been well documented in the case of the damage inflicted on global supply chains
by the Great East Japan disaster of March 2011.8
A number of economic mechanisms may be associated with this geographical
diffusion. These mechanisms are in some ways distinct, but also to some extent
overlap with each other. One is the nature and operation of markets for goods and
services. Shortages of individual goods in the affected areas, for example, are likely
to result in an inflow of those same goods from neighbouring areas, thus
influencing the operation of markets over a much wider area. It seems likely that
this influence will be greater in an integrated market economy than in an economy
in which markets are less integrated and more fragmented, and in which fewer
individuals participate in market transactions. A second diffusion mechanism is
through physical and informational infrastructure. Limited communications
between the area of destruction and other areas, for example, may influence
transactions by reducing information flow and affecting decisions. Destruction of
transport facilities, such as ports, stations or roads, will of necessity alter flows of
goods and services, at least temporarily. Thirdly, this is clearly a case in which
institutions matter. Governments, companies and business organisations, for
example, will respond in diverse ways to any crisis of destruction and the need for
relief, and are unlikely to do so in isolation, or in ways that are limited purely to
the affected area. If revenue needs to be acquired for the purpose of rebuilding, for
example, the burden is unlikely to fall exclusively on those impacted by the
disaster, whose capacity to pay is in any case likely to be much reduced by the
contingency.
Our focus in the present paper is on the first of these three mechanisms,
namely the operation of markets in the wake of a sudden exogenous shock. Moving
below the macroeconomic level, our intention is to try and assess the impact of a
localised exogenous shock on the operation of wider markets for different goods
8 Vasco M.Carvalho, Makoto Nirei & Yukiko Umeno Sato, ‘Supply Chain Disruptions: Evidence from the Great East Japan Earthquake’, RIETI Discussion Paper Series 14-E-035, June 2014, accessed at http://www.parisschoolofeconomics.eu/IMG/pdf/14e03 5.pdfon16/03/2014.

3
and services. We will explore this through an investigation of the price changes for
a number of goods in the wake of that shock, and of the extent to which any price
changes appear to have been diffused beyond the area immediately exposed to the
shock. We seek to test two main assumptions. Firstly, it is apparent that a major
shock of this kind will impact negatively on the availability of some goods in the
immediate location, but it will also alter the demand schedule for certain goods,
meaning that demand may increase or decrease, depending on the good in question.
It follows that in the absence of price controls excess demand for some goods is
likely to increase the prices of those goods, while a decrease in demand for others
will have the opposite effect. Secondly, we hypothesize that price shocks of this
kind will be communicated outwards from the affected area, through the
mechanisms identified above, but that the scale of any price changes is likely to
diminish with increased distance from the epicentre of the disaster. The findings of
this paper support the accuracy of both these assumptions. They also suggest,
however, that for some goods the price changes were far greater than for others; for
some goods the changes appear to have been minimal. The extent of any changes,
moreover, varied considerably, and the price instability was in most cases of
relatively short duration.
2. The Great Kantō Earthquake of 1923 in Japan
We will seek to explore these hypotheses by using as a case study the Great Kantō
Earthquake of 1923 in Japan. The history of market integration in Japan goes
back a long way, and the country was by 1923 a relatively integrated market
economy. The vast majority of citizens across the archipelago were engaged in
market transactions on a day to day basis. A sophisticated national infrastructure,
much of it centred in the Kantō region around Tokyo, supported market
transactions. Traditionally market operations in the West of Japan had focussed
more around the Osaka region (Kansai), while those in the east and northeast had
focussed around the Tokyo region, but by the 1920s the increasing dominance of
the capital area had become more apparent in some aspects of the economy, and
the balance of power in the nation’s economy had decisively shifted eastwards.9
Nevertheless, it remained the case that when it came to daily transactions in a
whole range of goods the north-eastern regions of Japan were still in 1923
significantly more integrated with the Kantō area than were regions towards the
9 Carl Mosk, Japanese Industrial History (Armonk NY & London: M.E.Sharpe 2000).

4
west of the country.
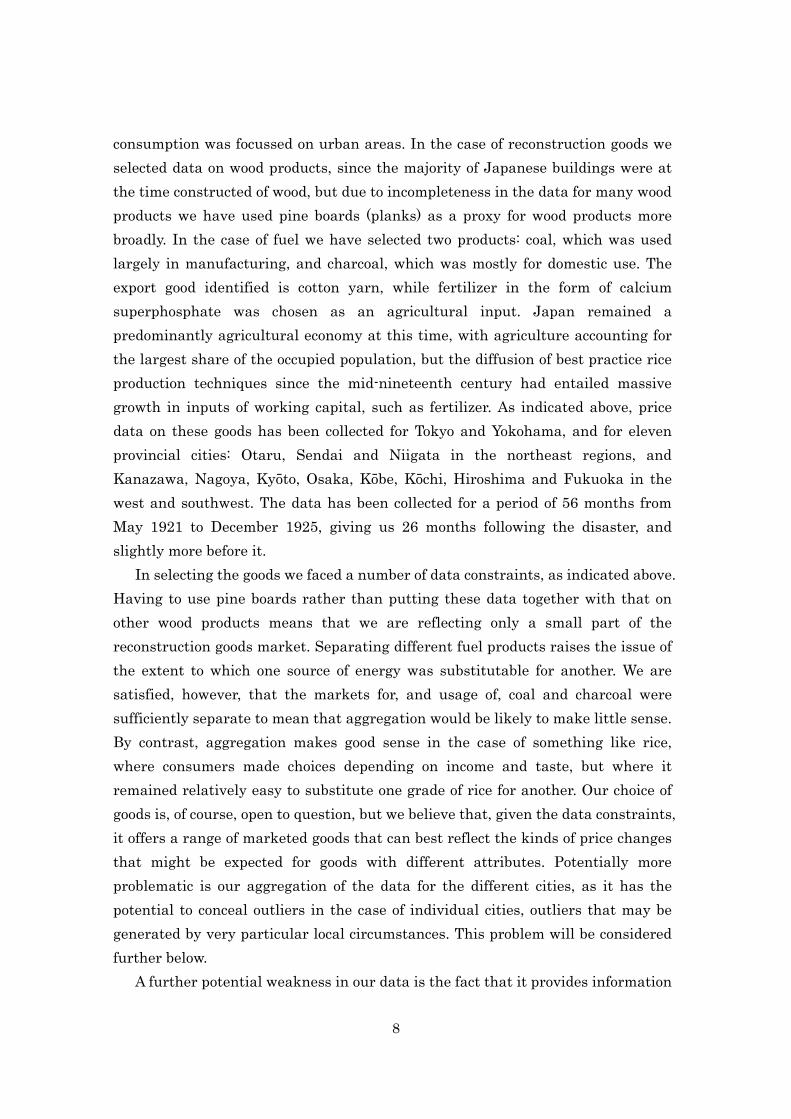
What became known as the Great Kantō Earthquake occurred shortly before
noon on 1st September, 1923. The epicentre of the 7.9 magnitude shock10 that
occurred was just south of Tokyo Bay. As shown in Figure 1, the size and location of
the tremor meant that it impacted the whole of the Kantō plain, including both the
capital city of Tokyo and the country’s major port of Yokohama. Tokyo was at the
time Japan’s largest city, with over 2 million residing in the metropolitan area by
1920. Yokohama, less than 40 kilometers away, had close on half a million
inhabitants. A further 4-5 million resided in the adjacent more rural jurisdictions
across the rest of the Kantō plain, and the region accounted for a significant
proportion of the country’s total urban population.11 The earthquake resulted not
only in large scale physical destruction and collapse, but in a tsunami in many
coastal areas, and huge conflagrations in both of the main cities. There are
estimated to have been well over 100,000 deaths, and total casualties exceeded
140,000. The vast majority of the deaths and casualties were due to firestorms
rather than the earthquake destruction or the tsunami.12 Pictures taken in the
immediate aftermath of the disaster suggest a scale of devastation comparable to
that after the bombing of Dresden or Hiroshima.
A number of works have appeared in both English and Japanese relating to the
Great Kantō Earthquake, but the majority of these works have focussed on the
social and political consequences of the disaster, or its ideological or artistic
construction. Schenking has explored in detail the politics of reconstruction after
the earthquake, while Weisenfeld and Bates have looked at the imagery and the
narrative associated with the event. We know something about its influence on
education, urban planning, and seismology, and Gregory Smits has integrated
some analysis of the event into his broader study of earthquakes in Japan’s
history.13 Research on the economic impact of the disaster, however, has remained
10 7 Moment Magnitude scale. 11 http://www.stat.go.jp/english/data/chouki/02.htm, Table 2-7 Population, Population Density,
Population of Densely Inhabited Districts and Area by Prefecture, All Shi and All Gun (1898-2005), accessed 28/07/2016.
12 For a general outline of the disaster see Naimushō Shakaikyoku, The Great Earthquake of 1923 in Japan (Tokyo: Sanshusha Press, 1926).
13 Gregory Clancey, Earthquake Nation: the Cultural Politics of Japanese Seismicity, 1868-1930 (Berkeley CA: University of California Press, 2006); Janet Borland, ‘Capitalising on Catastrophe: Reinvigorating the Japanese State with Moral Values through Education following the 1923 Great Kantō Earthquake’, Modern Asian Studies 40, 4, 2006, pp.875-907; Charles J.Schenking, The Great Kantō Earthquake and the Chimera of National Reconstruction in Japan (New York: Columbia University Press, 2013); Gennifer Weisenfeld, Imaging Disaster: Tokyo and the Visual Culture of Japan’s Great Earthquake of 1923 (Berkeley CA: University of California Press, 2012); Gregory Smits, When the Earth Roars: Lessons from the History of Earthquakes in Japan (Lanham MD: Rowman &

5
limited, perhaps because most economists and economic historians have taken the
view that its influence on Japan’s longer term growth and development was fairly
minimal. Certainly it is acknowledged that the disaster was a key factor in the
stop-go financial and monetary policy of Japan in the 1920s, that it also led to
financial dislocation, and that it contributed to the occurrence of a major financial
crisis in 1927. However, beyond the financial sphere there is less evidence of its
being of fundamental importance for the economy. The country’s key economic
indicators had largely reverted to trend by 1928, or, in some cases, earlier. The
longer-term impact of the disaster thus remains debateable, but there is at the
same time no doubt that in the months after the disaster it was perceived by
contemporaries to have had devastating economic consequences. It thus raises the
issue of how we can reconcile these contrasting images of short-term and longer
term impact.14
The acute economic problems perceived as having been caused by the disaster
also suggest that it is an appropriate case study for exploring the nature of the
short-term economic impact, something supported by the overall scale of what
occurred and the key location in which the event took place. In line with the
objectives indicated earlier, we therefore seek in this paper to ask three main
questions. Firstly, we ask what the effect of the disaster was on the prices of
different goods both in the devastated capital area and in cities in other parts of
Japan. Where changes are identified, we also seek to establish how quickly the
prices were stabilized. Secondly, we ask how far any changes in prices that
occurred in the different cities were correlated with each other. The third question
relates to geographical diffusion, namely the extent to which cities in regions closer
to the devastated area may have been more affected than those that were further
away, i.e. was the extent of any shock aligned with geographical distance from the
capital area.
In line with our earlier assumptions and the context of Japanese market
integration in the 1920s, we come to three more specific hypotheses that we
Littlefield, 2014); Alex Bates, The Culture of the Quake: the Great Kantō Earthquake and Taishō Japan (Ann Arbor MI: University of Michigan Center for Japanese Studies, 2015).
14 For some preliminary observations on this issue see Janet Hunter, “Extreme confusion and disorder”? The Japanese Economy in the Great Kantō Earthquake of 1923’, Journal of Asian Studies 73, 3, pp.753-773. For the impact of the disaster on agglomeration see Asuka Imaizumi, ’Tōkyō-fu Kikai Kanren Kōgyō Shūseki ni okeru Kantō Daishinsai no Eikyō: Sangyō Shūseki to Ichijiteki Shokku’, Shakai Keizai Shigaku 74, 4, 2008, pp.23-4; Tetsuji Okazaki, Kaori Itō & Asuka Imaizumi, ‘Impact of Natural Disasters on Industrial Agglomeration: the Case of the 1923 Great Kanto Earthquake’, CIRJE Discussion Paper, University of Tokyo, 2009, CIRJE-F-602. For the financial aspect see Nihon Ginkō Hyakunen Shi Hensan Iinkai, Nihon Ginkō Hyakunen Shi vol.3 (Tokyo: Nihon Ginkō, 1983).

6
propose to test empirically. Firstly, we expect any price changes in the Kantō
region (in Tokyo or Yokohama) consequent upon the disaster to be reflected in price
changes elsewhere in the Japanese islands. Secondly, we would expect cities
further away from the area of devastation to witness smaller price changes than
those occurring in cities nearer to the Kantō area. Finally, given the greater
integration between northeast Japan and the capital area, it seems likely that any
price changes in cities in the northeast would have been greater than those in
cities towards the west and south of Japan (which were more integrated with the
Osaka region).
3. Data and Methodology
3.1. Sample Characteristics
In order to explore our hypotheses we have assembled a monthly panel dataset of
11 provincial Japanese cities for the period May 1921 to December 1925. The cities
used in the analysis are Niigata, Nagoya, Kanazawa, Sendai, Kyoto, Osaka, Kobe,
Kōchi, Hiroshima, Otaru and Fukuoka. The location of these cities is shown in
Figure 1. As shown in the second column of Table 1, the average population of the
cities in our sample between 1921 and 1925 varied from 57,000 in Kōchi City to
over 1.6 million in Osaka. Limitations on available sources of price data mean that
we have not included in the sample a number of other cities with smaller
populations, but despite this limitation we are able to include data for a significant
part of Japan’s city population, as the total population in our sample cities
accounts for approximately 82% of the total population of all cities with more than
100,000 inhabitants in 1923, and approximately 58% of the population of all cities
with 50,000 or more inhabitants. If we include all cities in Japan in 1923, the
sample comprises approximately 47% of the city population.15
If we look at the geographical distribution of these cities shown in Figure 1, we
see that the cities are well distributed throughout the country, and not
concentrated in a specific district. The longitude and latitude of the southernmost
city in the sample, Fukuoka, are 130.40◦ and 33.59◦, while the equivalent locations
for the northernmost city, Otaru, are 140.98◦ and 43.19◦. The geospatial distance
from Tokyo is 888 kilometers in the case of Fukuoka, and 839 kilometers in the
15 Tokyo and Yokohama city are excluded in the calculation. The information on the city
population is taken from Statistics Bureau of the Cabinet (1925a).

7
case of Otaru. This rich variation in geospatial location ensures heterogeneity of
city characteristics, and enables us to capture the impact of the Great Kantō
Earthquake across the Japanese archipelago. Tokyo and Yokohama, which were
located near to the centre of the earthquake (the yellow-red circle in Figure 1), bore
the brunt of the physical destruction, and served as the point of origin of any price
changes, are excluded from the sample.
3.2. Wholesale Prices
The use of low frequency data, such as annual or quarterly data, is at higher risk of
concealing any short run effects in the months immediately after the earthquake.16
In order to estimate the impact of the earthquake on prices in the provincial cities,
we have therefore compiled a unique dataset of monthly wholesale prices across
various goods and categories in thirteen cities (including Tokyo and Yokohama).
We focus on the analysis of prices rather than quantities, because the data on
product availability are severely limited for the time period in question. The data
are drawn from the statistics of wholesale prices (Oroshiuri Bukka Tōkeihyō)17
compiled by the Statistics Division of the Japanese Ministry of Commerce and
Industry in 1926. Since the Japanese government recognised these thirteen cities
as ‘main’ cities under a ruling in June 1920,18 in each case the local chamber of
commerce was required to collect and report the wholesale prices of 84 different
goods. As indicated in the introduction to this publication, its objective was to
record the monthly wholesale prices for a range of goods in the thirteen cities for
the convenience of general users.
We have selected a limited number of goods to represent different areas of
purchase, notably foodstuffs, export manufactures, construction materials, fuel
and agricultural inputs, each of which are likely to have different market
characteristics. In the case of rice, the core foodstuff, data has been aggregated to
include the prices of different grades of rice. Wheat has been selected as a grain of
growing importance, but one where Japan’s own production remained limited, and
16 Alberto Cavallo, Eduardo Cavallo & Roberto Rigobon, ‘Prices and Supply Disruptions during
Natural Disasters’, Review of Income and Wealth 2014, pp.1-2. 17 This statistical report is held in the National Diet Library of Japan. The digitized archive is
available on the National Diet Library Digital Collections; http://dl.ndl.go.jp/info:ndljp/pid/1710197. 18 No.1319 of 10 June, 1920, entitled ‘Shōgyō Kaigisho yori Chōsa Hōkoku subeki Bukka oyobi
Chingin Tōkei Yōshiki’. The goods comprised 35 food items, 20 construction materials, 8 kinds of fertiliser and animal feed and 11 miscellaneous goods. See Ministry of Agriculture and Commerce 1904, p.218.
8
consumption was focussed on urban areas. In the case of reconstruction goods we
selected data on wood products, since the majority of Japanese buildings were at
the time constructed of wood, but due to incompleteness in the data for many wood
products we have used pine boards (planks) as a proxy for wood products more
broadly. In the case of fuel we have selected two products: coal, which was used
largely in manufacturing, and charcoal, which was mostly for domestic use. The
export good identified is cotton yarn, while fertilizer in the form of calcium
superphosphate was chosen as an agricultural input. Japan remained a
predominantly agricultural economy at this time, with agriculture accounting for
the largest share of the occupied population, but the diffusion of best practice rice
production techniques since the mid-nineteenth century had entailed massive
growth in inputs of working capital, such as fertilizer. As indicated above, price
data on these goods has been collected for Tokyo and Yokohama, and for eleven
provincial cities: Otaru, Sendai and Niigata in the northeast regions, and
Kanazawa, Nagoya, Kyōto, Osaka, Kōbe, Kōchi, Hiroshima and Fukuoka in the
west and southwest. The data has been collected for a period of 56 months from
May 1921 to December 1925, giving us 26 months following the disaster, and
slightly more before it.
In selecting the goods we faced a number of data constraints, as indicated above.
Having to use pine boards rather than putting these data together with that on
other wood products means that we are reflecting only a small part of the
reconstruction goods market. Separating different fuel products raises the issue of
the extent to which one source of energy was substitutable for another. We are
satisfied, however, that the markets for, and usage of, coal and charcoal were
sufficiently separate to mean that aggregation would be likely to make little sense.
By contrast, aggregation makes good sense in the case of something like rice,
where consumers made choices depending on income and taste, but where it
remained relatively easy to substitute one grade of rice for another. Our choice of
goods is, of course, open to question, but we believe that, given the data constraints,
it offers a range of marketed goods that can best reflect the kinds of price changes
that might be expected for goods with different attributes. Potentially more
problematic is our aggregation of the data for the different cities, as it has the
potential to conceal outliers in the case of individual cities, outliers that may be
generated by very particular local circumstances. This problem will be considered
further below.
A further potential weakness in our data is the fact that it provides information

9
only on wholesale prices. Wholesale prices were much more easy to control and
regulate than were retail prices; wholesale prices tended to be set by the
authorities and wholesale transactions mostly took place in official markets. Retail
prices were set by individual retailers, both large and small, based on their desired
profit margin. Retail in Japan in 1923 was overwhelmingly populated by
individual retailers, small shops with maybe at the most just one or two employees,
or making use of family members. A mass of contemporary anecdotal evidence
suggests that retail prices for many goods rose far more in the weeks following the
disaster than did wholesale prices. Obtaining systematic statistical evidence on
retail prices is, however, very difficult. Monthly retail price data is lacking for
many cities and many goods, and where it does exist it is often incomplete and
potentially unreliable. Nevertheless, the potential for divergence between trends
in wholesale and retail prices is considerable, and this risks limiting the validity of
any findings based exclusively on wholesale price data. We will return to this
problem when we consider the findings of our analysis of the wholesale price data,
and seek to locate those findings in a broader historical context.
Figures 2a–2g show the prices of the selected goods in Tokyo and Yokohama
before and after the disaster. The timing of the disaster is clearly marked on these
figures. There are fluctuations in the wholesale prices of all the goods in the
months both before and after the disaster. Depending on the product these
fluctuations are likely to have been generated by cyclical, seasonal or other factors.
If we compare the average prices in the months following the disaster with those in
the months prior to it, we can see that with the exception of pine boards and coal
the prices for all the other goods were on average higher in the months after the
disaster than before. In the case of rice and wheat, prices were stable or rose only
slowly in the first twelve months after the earthquake, which is commensurate
with the existence of official attempts to requisition supplies, regulate wholesale
rice prices, and encourage imports of essential goods through suspension of tariffs.
The prices of cotton yarn, fertilizer and charcoal rose more rapidly. Particularly in
the case of charcoal, the loss of housing and the onset of colder weather stimulated
a jump in prices that only ended some twelve months after the disaster. While the
price of pine boards rocketed after the earthquake, in the context of huge demand
for reconstruction materials, the large scale provision of supplies from both
domestic and foreign sources (mostly North America) had brought prices back to
the pre-disaster level by the spring of 1924. Coal, too, experienced a sharp
immediate price increase, lasting until the autumn of 1924.

10
The price data for the provincial cities for the period from May 1921 to
December 1925 is provided in Figures 3a–3f. A similar comparison of the average
prices in the eleven cities for each good in the months prior to and following the
disaster suggests that any impact of the earthquake on the prices in provincial
cities appears to have varied in timing and also depending on the product in
question. As we can see from Figures 3a, 3b, 3c, and 3e, the average prices of rice,
wheat, cotton yarn and calcium superphosphate tended to be higher in the period
after September 1923 than in the period prior to it. The prices of these products
began to increase a few months after the event, but the price of calcium
superphosphate had declined again within the year. By contrast, the prices of rice,
wheat and cotton yarn were still high a year after the disaster, and the price of rice
was around 40 yen per 180 litres from October 1924 to October 1925,
approximately 18% higher than the price in August 1923. The price of cotton yarn
rose sharply towards the end of 1924 to a level approximately 60% higher than the
level of August 1923. These findings are consistent with an expectation of rising
prices for goods in short supply in the months after the disaster, including
foodstuffs, clothing inputs and fertilizer, although the more prolonged increase in
prices for foodstuffs and cotton yarn would appear to have been associated with
other factors, including the level of the harvest in 1924 and some relaxation of the
conservative exchange rate policy after the disaster.
By contrast we find that the average prices of pine boards, charcoal and coal
after the earthquake were lower than before it, as shown in Figure 3d–3f. Pine
boards and charcoal experienced short run positive price shocks, but prices had
stopped increasing by the turn of the year, and had fallen to the pre-earthquake
level by May 1924. The short duration of the price shock in the case of pine boards
is again commensurate with the rapid increase in supply that occurred from early
1924, and that for charcoal with the peak demand winter period. The profile for
coal prices in the sample cities, however, is very different from that of Tokyo and
Yokohama; the average drop in coal prices following the disaster was significant,
and did not mirror the initial price surge found in the case of the disaster region.
While for almost all these products, therefore, there seems to have been some kind
of positive price shock after September 1923, the duration of that shock varied
considerably, and in some cases was outweighed by the significant declines in price
that occurred thereafter. In order to capture the magnitude of the impact of the
earthquake more precisely, therefore, we will also estimate the baseline
specification using an alternative cut-off period, as described in Section 4.1 below.

11
3.3. Geospatial Distance between Tokyo and Provincial Cities
Our quantitative analysis relies on measures of geospatial distances between
provincial cities and the affected city of Tokyo. To construct this variable, we
calculated the minimum distances between each provincial city and Tokyo using
the spheroid (GRS80) of the Geospatial Information Authority of Japan (GIAJ),
based on the information on the longitude and latitude of each city. The data on
longitude and latitude were obtained from the database of the GIAJ. Details of the
data sources are described in Appendix B. For convenience of interpretation we use
the reciprocal distance, i.e. the closeness to the devastated area, in our empirical
analysis.
A summary of the geospatial information is provided in columns 3-6 of Table 1.
The geospatial distances between the provincial cities and Tokyo vary from 255
kilometres in the case of Niigata up to 888 kilometres in the case of Fukuoka,
meaning that the closeness to Tokyo varies from 0.39 (1/2.55) down to 0.11 (1/8.88).
The mean value of the distance is 486 kilometres, and hence the mean value of the
reciprocal number 0.25. Since our sample cities are scattered across the whole of
Japan, there are significant differences in the intervals, and the distances do not
concentrate on a specific value. Four of the cities, namely Niigata, Kanazawa,
Sendai and Otaru, are located in the north-eastern region of Japan.19 However,
these four cities are also widely scattered, helping to confirm the geospatial
distances listed in Table 1.
3.4 Covariates
We use covariates representing the demographic, industrial, trade-related and
meteorological characteristics of the cities as baseline controls for our empirical
analysis. Firstly, the size of population is included in the covariates to indicate the
scale of demand for each commodity. Second, the number of factories per 100
population in the prefecture is used as prefectures with a larger number of
factories were more likely to be affected by any shortages of raw materials and
19 Both the Hokuriku district, which includes the cities of Niigata and Kanazawa, and the Tōhoku
district, which includes Sendai city, were more integrated with the Kantō region. Therefore, we have included both these districts as part of the north-eastern area of Japan. In fact, Hokuriku district is officially classified as part of Eastern Japan in terms of its meteorological conditions (see the classification of the Japan Meteorological Agency: http://www.jma.go.jp/jma/kishou/know/kisetsu_riyou/division/kubun.html).

12
fuels. Thirdly, the total tonnage of steam and sailing ships in the ports in each
prefecture are used to control for the availability of marine transportation. This
variable is included because sea routes are likely to have been used to transport
one or more of the commodities between the centre of Japan and the provincial
cities, notwithstanding a significant increase in marine freight costs following the
earthquake. This variable also acts as a control for the quantity of imports, which
is likely to have affected wholesale prices in the cities. Finally, for meteorological
variables we use monthly average temperature and monthly average precipitation,
which are drawn from the database of the Japan Meteorological Agency (JMA).
These variables are included because it seems likely that meteorological conditions
would have affected the availability of marine transport, especially in the case of
sailing ships. Moreover, the prices of goods such as foodstuffs and charcoal are also
likely to have been directly affected by weather conditions, through changes to
both supply and demand. Details of the sources of the control variables are
provided in Appendix B. Panel (C) of Table 2 gives summary statistics of the
control variables.
4. Impact of the Earthquake on Wholesale Prices
4.1. Econometric Strategy and Results
As previously mentioned, the Great Kantō Earthquake struck in the centre of
Japan on 1st September 1923. It was suggested in the historical overview in
Section 2 that the disaster may well have increased the prices of some commodities
and brought confusion to market transactions in provincial cities across the
Japanese archipelago, even though these cities were not directly affected by the
physical impact of the earthquake. Given the context it seems likely that wholesale
prices in these cities would have been affected by the enormous physical losses in
the central part of Japan and the subsequent disruption caused by the earthquake.
In this section, we conduct quantitative analysis of our 11 provincial city–level
monthly panel dataset to test whether or not the occurrence of the earthquake
increased the wholesale prices of commodities in the provincial cities. As before,
the data covers 28 months before and after the earthquake, i.e., from May 1921 to
December 1925.20
20 We confirmed the stationarity in our wholesale price panel dataset. For all wholesale prices of
the products used in our analysis, several tests reject the null of unit-root nonstationary. Table A.1 in

13
Three questions regarding price changes in the commodities in the provincial
cities are posed in order to test the hypothesis. First, to what extent were cities in
regions closer to the devastated area more affected than those that were further
away? In other words, was the extent of the shock aligned with geographical
distance from the capital area? Second, was the impact on prices in north-eastern
Japanese cities, which were more integrated with the devastated Kantō region,
greater than the impact in the south-west? Third, how quickly was the impact of
the earthquake on wholesale prices stabilised?
To answer these questions, we use the cross-sectional heterogeneity in the
geospatial distance values to distinguish the impact of the earthquake. Our
expectation is that cities located closer to Tokyo will be significantly affected by the
physical devastation that has occurred in the centre of the country, whereas the
cities located further away from the capital will be less affected by the physical
devastation caused by the earthquake. For each city, therefore, we use the
reciprocal number of geospatial distance from Tokyo as an indicator of the
closeness to the center of the earthquake and thus, as an indicator of the
magnitude of its influence. In order to test the extent to which the earthquake
increased the market prices in provincial cities and identify how far the impact of
the earthquake varied across these cities, we estimate the following model:
x′ ∑ ∑
(1)
where is the index of the cities from 1 to 11 and the index of the months from
May 1921 to December 1925, 56 months in total. The variable is the price
of a certain product, is the reciprocal of geospatial distance from Tokyo,
is the indicator variable that equals one after September 1923, x is a
vector of city characteristics, and is a random error term. and are the
indicator variables that equal one for the city and month , respectively. Thus,
the variables ∑ and ∑ represent city and month fixed effects,
respectively.
The coefficient is the focal point of our interest. We expect the estimate of
to be positive, which would indicate that the earthquake had a larger positive
effect on prices in cities closer to Tokyo. For instance, in the case of rice being the
dependent variable, a positive coefficient would indicate that cities located closer to
Appendix A shows the results of the unit-root tests.

14
Tokyo experienced a greater increase in the wholesale price of rice after September
1923 compared to before that date.
Regarding our identification, we assume that, after taking into account city
observables, the variable of interest is exogenous. This assumption would appear
to be basically plausible, as it is clear that both the timing of the earthquake and
the geospatial distances of each city from Tokyo are exogenously determined.
Although both demand- and supply- side institutions may also affect the level of
prices, we are able to control for those factors using the covariates described in
Section 3 and fixed effects. City fixed effects control for all time constant factors in
each city. These factors include, for example, geographical features affecting
transportation costs or productivity in relation to foodstuffs, market institutions
such as the regulation of trade practices between producers and merchants, and
citizens’ preferences for different commodities. Other macroeconomic shocks
affecting prices, including government intervention to stabilize markets, as well as
any secular trends and seasonal effects on prices during the sample period are
controlled for by monthly fixed effects. Finally, we also include a lagged dependent
variable into the regressors in order to capture persistence in price. This lagged
value of price can also be considered as potentially reflecting cross-city dynamics in
price because it may reflect information on predetermined prices in other cities.21
We employ cluster-robust standard errors in order to deal with heteroskedasticity
and serial correlation in the idiosyncratic error term (see Stock and Watson
2008).22
Our estimates of the baseline model by product categories are reported in Table
3. As reported in column (1), the estimated coefficient on Closeness × Post is 1.829
for rice and statistically significant at the 5% level. This result implies that a 1
unit increase in the reciprocal of distance results in an increase of roughly 1.829
yen in the post-earthquake average wholesale price of rice relative to that before
the earthquake. The maximum value of Closeness is 0.39 for Niigata and its
minimum value is 0.11 for Fukuoka (see Table 1). Therefore, the impact of the
21 Note that the within estimator in a dynamic panel data model becomes consistent as T gets larger (see Hsiao 2014, pp.82–84). The number of sample periods in our baseline specification is 56-months in total and thus, can be considered large enough to bring our parameter of interest close to a true value (see Baltagi 2013, pp.155– 156).
22 Throughout our empirical analysis, standard errors are clustered at the city level. Although Osaka and Kobe city are located close to each other (see Figure 1) and may be expected to have spatial correlations, our baseline estimates reported in Table 3 are robust to including these two cities in the same cluster. See Table A.2 in Appendix A for the results. In addition to this, we also employed the wild cluster bootstrap method proposed by Cameron et al. (2008) to deal with the issue of the small number of clusters. The main results could be confirmed as stable through using this procedure. Table A.3 in Appendix A shows the result.

15
earthquake on the average wholesale price of rice in Niigata is approximately 0.71
yen (0.39 × 1.829), whereas that in Fukuoka is approximately 0.2 yen (0.11 × 1.829).
The impact in Kobe, which is located at a roughly intermediate point in terms of
distance from Tokyo, is estimated to be 0.42 yen (0.23 × 1.829). The large disparity
in the impact between Niigata and Fukuoka supports our hypothesis: that is, the
cities closer to Tokyo were significantly affected by the consequence of the
earthquake, whereas the cities further away were less affected by the earthquake.
If we look at the figures for the other products reported in columns (2)–(7), we see
that the estimated coefficients on Closeness × Post for wheat, cotton yarn, pine
boards, calcium superphosphate, coal, and charcoal are 0.073, 2.735, 0.082, −0.064,
−0.880, and −1.446 but those effects are not statistically significant. The above
result suggests that if we look only at the impact of the earthquake on average
prices in the 28 month period from September 1923, the wholesale prices of wheat,
cotton yarn, fertilizer, and fuel were not affected by the earthquake.
To explore the magnitude of any effect in more detail, we then calculated the
increase in the price of rice due to the earthquake as a proportion of the total
increase in rice prices from the period from May 1921 to August 1923 to the period
from September 1923 to December 1925. For example, in Kobe city, the estimated
impact of the earthquake on the price of rice is 0.42 yen as shown above. The actual
price of rice in Kobe increased by 5.05 yen, from 35.06 yen per 180 litres in the
pre-earthquake period to 40.12 yen in the post-earthquake period. Thus, the effect
of the earthquake, i.e., the proportion of the total increase in the wholesale rice
price in Kobe due to the earthquake is estimated to be 8.3%. Figure 4 lists these
percentage figures for each provincial city in order of distance.23 It is clear that
the impact of the earthquake on the price of rice increases the closer a city is to
Tokyo. The impact of the disaster on the wholesale price of rice is highest in
Kanazawa city, which is located at a distance of 295 km from Tokyo city. By
contrast, it is lowest in Fukuoka city, which is 888 km from Tokyo. The average
value of these magnitudes is calculated to be 8.4%.
The above analysis supports the available evidence that changes in prices in
the Kantō region consequent upon the disaster are likely to be reflected in price
changes elsewhere in Japanese islands. It also suggests that cities further away
23 Table A.4 in Appendix A shows the details of the calculation of those magnitudes in each
provincial city. The estimates suggest that the increase in the price of rice due to the earthquake was decreased by 0.08 yen per 180 litres for every additional 100 km of distance from Tokyo. Figure A.1 shows this relationship between the increase in rice price due to the earthquake and the geospatial distance from Tokyo.

16
from the area of devastation are likely to witness smaller price changes than those
occurring in cities nearer the Kantō region. However, as discussed in Section 3, the
scale and nature of the impact of the earthquake on prices is likely to vary not only
according to the individual product but also in terms of timing, that is, in terms of
the length of the period after the earthquake during which any changes might
persist. We have therefore estimated our baseline specification using alternative
cutoff periods. By means of this analysis, we can identify how quickly the impact of
the earthquake on prices was stabilized, and in the process also address the last of
our hypotheses, namely that changes in north-eastern Japanese cities are likely to
have been greater than changes in the south-west.
4.2. Alternative Cutoff Period
In this section, we estimate the impact of the earthquake on wholesale prices using
our baseline model in equation (1) for each 3-month segment after the earthquake.
As discussed in Section 3, we expect the prices of rice, wheat, and cotton yarn to be
impacted for a longer period, whereas the prices of pine boards, calcium
superphosphate, and fuel appear to have been affected for a rather shorter period.
Thus, as the treatment-period is increased, the effect on the latter group of
products may become close to zero, while the effect on the former group of products
may continue to be significantly different from zero.
The estimates for the alternative cutoff periods are reported in Table 4. The
first to ninth rows of the table show the estimated impacts for each product using
the panel datasets starting in May 1921, but setting the post-earthquake period as
3, 6, 9, 12, 15, 18, 21, 24, and 28 months, respectively. Thus, the total number of
months in each sample is 31, 34, 37, 40, 43, 46, 49, 52, and 56 months, respectively.
For all specifications, we include all control variables as well as city and month
fixed effects.
As expected, persistent effects are observed in relation to the wholesale price of
rice. For the shortest period of three months, the estimated coefficient on Closeness
× Post is −0.065, and not significantly different from zero. By contrast, for the
periods of 6 months or longer, the estimated coefficients are significantly positive,
at 1.349, 1.601, 1.530, 1.528, 1.484, 1.528, 1.623, and 1.829, respectively. This
result is consistent with our expectation that the impact of the earthquake on rice
is relatively persistent in spite of the delayed increase in price after the shock.
The same calculation used earlier has been employed to illustrate the

17
magnitude of the earthquake in each 3-month segment. For instance, for the case
of Niigata city over the 12-month period after the earthquake, we see that the
average wholesale price of rice increased by 2.5 yen, from 31.98 yen in the period
between May 1921 and August 1923 to 34.48 yen in the period between September
1923 to August 1924. Since the increase in price due to the earthquake is
estimated to be 0.6 yen (1.53 × 0.39), the proportion of the total price increase
caused by the earthquake is calculated to be 23.9% (0.6/2.5). Applying the same
calculation for all cities and for all cutoff periods, we aggregated the average
magnitudes for three areas based on the distance from Tokyo, that is, cities located
at from 255 to 302 km from Tokyo, those from 370 to 430 km from Tokyo, and those
at a distance from 618 to 888 km. Figure 5 illustrates the proportion of the total
price change before and after September 1923 accounted for by the earthquake.24
There are two main findings regarding the price of rice.
First, the magnitude of the effect of the earthquake declined as the length of
time following the event increased. On average, six months after the earthquake it
was accounting for approximately 55% of total increase in prices. However, this
proportion had sharply declined by nine months after the earthquake, by which
time the proportion was approximately 24%. By twelve months after the
earthquake, the proportion had declined to below 20%. In the case of rice, the effect
of the earthquake on the wholesale price of rice eventually stabilised at around 8–
9% some 21 months after the earthquake.
Second, the impact of the earthquake increased the closer a region was to Tokyo.
The four cities located in the range from 255 km to 302 km were significantly
impacted by the earthquake. The difference in the size of the effect between these
cities and the three cities in the next distance band, from 370 km to 430 km, is
roughly 5% for each cutoff period. Similarly, the size of the effect in these four cities
is roughly 10% higher than that in the four most distant cities, those in the range
from 618 km to 888 km away from Tokyo. The order of magnitude changes
somewhat in the case of periods beyond six months. One possibility is that cities in
the Kansai area, such as Kyoto, Osaka and Kobe, were less likely to be affected
because they held larger stocks of rice than the other south-western provincial
cities.
Regarding the hypothesis that changes in north-eastern Japanese cities are
likely to have been greater than changes in the south-west, Figure 6 shows the
proportion of increase in the rice price due to the incidence of the earthquake by
24 The estimated magnitudes in each provincial city are also reported in Figure A.2 in Appendix A.

18
area categories, as described in column 7 of Table 1. Clearly, the effect of the
earthquake is more significant in the four north-eastern cities than in the seven
cities south west of Tokyo. The disparity is largest for the six month period after
the earthquake, with the impact approximately 10% greater in the north-eastern
cities. After nine months or longer, this disparity gradually converged to around
5%. We can therefore conclude that changes in the rice price due to the earthquake
were more conspicuous in the north-eastern cities which were more integrated
with markets in the devastated Kantō region than in the south-western cities
which were more integrated with the physically unaffected Kansai region.
If we look at the impact of the shock son the wholesale price of pine boards, we
see that the estimated coefficient is significantly positive for the three-month
period after the earthquake, as shown in the 1st row in Table 4. This result is
consistent with the overall trend in the time series showing that the increase in
prices had been halted by the end of 1923, and that prices had begun to decrease
around the turn of the year. This implies that in the case of wood the earthquake
accounted for a significant proportion of the rise in price that occurred, and if we
apply the same calculation used to estimate the average impact on rice, we can
estimate that in the case of wood 73.6% of the total change in price in the months
before and after September 1923 is accounted for by the earthquake.25 In the case
of our other products, such as wheat, cotton yarn, calcium superphosphate, coal,
and charcoal, no statistically significant effects are observed. It seems possible,
therefore, that the earthquake did not have a significant impact on the wholesale
prices of these commodities.
4.3. Falsification Tests
In this section, we conduct a placebo test for the wholesale prices of rice and pine
boards by using the period prior to the earthquake, in order to check the
robustness of the main findings described in Sections 4.1 and 4.2. It is possible that
for the period before the earthquake, given the existence of a relatively integrated
economy, the wholesale price in cities nearer the Kantō area may not have been
25 The magnitude of the effect in each provincial city is reported in Table A.5 in Appendix A.
Kanazawa, Kyoto, Kobe, Kochi, and Otaru city are excluded from this calculation due to the negative value of the price change before and after the earthquake. Further testing would be necessary to see whether these findings are statistically significant, and there is no obvious historical explanation for the suggestion that prices in these cities may have been either stable or negative, in contrast to the other cities in the sample. These cities are, moreover, geographically widely spread, and extremely diverse in character.

19
significantly different from that in cities further away from the Kantō area. In
other words, if the coefficient on the interaction term between ×
was estimated to be statistically significant using the pre-earthquake period, this
key variable in our baseline specification may correlate with other factors that
might have affected wholesale prices, such as unobserved time-varying
transportation costs across the sample of cities.
The estimates are reported in Table 5. The placebo treatment periods in
columns (1)–(2), (3)–(4), and (5)–(6) are the months from March 1922–August 1923,
September 1922–August 1923, and March 1923–August 1923, respectively. These
treatment periods have been chosen systematically as six months, twelve months
and 18 months before the incidence of the earthquake. This means that, for
example in column (1)–(2), we use the interaction term between the geospatial
distances and an indicator variable that equals one for the months from March
1922 to August 1923. The same applies to the estimates listed in columns (3)–(4)
and (5)–(6). The estimated coefficients do not differ significantly from zero for all
specifications. In other words, when it comes to geospatial distance the differences
in the prices of rice and pine boards appear only over the sample period after the
earthquake. This result confirms that no unobserved factors have disturbed our
main results.
5. The findings in context
In analysing the price changes for a number of goods in the wake of the
Great Kantō Earthquake of 1923, this paper has sought to test two main
assumptions. One is that in a market economy a localised exogenous shock such as
that generated by a major natural disaster will alter demand and supply schedules,
and in the absence of price controls the prices of some goods will rise, while those of
other goods will fall. We also hypothesized that any price changes are likely to be
communicated out from the affected area, but that the scale of any such changes
will diminish with distance from the affected area.
The econometric exercises sought to address three questions: firstly, how
far the extent of any price impact was aligned with geographical distance from the
devastated area; secondly, was the impact more pronounced in northeastern Japan,
whose economy was more integrated with the capital area than was the case with
the southwest; and thirdly, how rapidly were prices stabilised after the shock.

20
These three questions were explored through an analysis of the price changes for
particular products across eleven Japanese cities, including two in the devastated
area, Tokyo and Yokohama. The findings were most pronounced in the price
changes of rice, the core foodgrain. In the case of rice, our analysis showed that not
only was the impact of the earthquake on prices relatively persistent (though
declining over time), but also the impact of the disaster on the price of rice
increased the nearer a provincial city was to Tokyo. It also showed that the impact
was more significant in north eastern cities than in the southwest. In the case of
the price of wood, a core reconstruction material, there was an immediate strong
impact from the disaster, but it did not persist for very long, and in the case of the
other products in our dataset the results were not statistically significant.
How, therefore, are we to interpret our findings? First of all, a caveat is in
order. As noted earlier, it has only been possible to undertake the quantitative
analysis using wholesale price data as there is no available systematic retail price
data; at best there exists some retail price data for some cities for some
commodities for some time periods. We know that wholesale prices were more
easily regulated, and that most wholesale transactions took place in officially
sanctioned markets. The retail sector was very different; retail transactions were
largely unregulated and carried out by a myriad of small scale operators. It may
well be that undertaking the same exercise using retail price data for the goods
analysed here would have told a very different story. So, disparities between
wholesale and retail price trends may help to explain the more limited changes
that we identified in the case of a number of our selected goods. Such a possibility
may be indicated either by the limited retail price data that are available or by
anecdotal qualitative evidence.
If we turn briefly to the scant retail price data that are available these do
not provide a clear message. As might be expected, the reported retail price for rice
in Tokyo was marginally higher that the wholesale price, but the ratio of wholesale
to retail prices remained relatively constant throughout the period from January
1923 to December 1925. A stable relationship between wholesale and retail prices
was also true of charcoal, although during the three months from December 1923
to February 1924 the retail price for charcoal increased significantly more than the
wholesale price, before settling down again. However, a similar phenomenon can
be seen in the winter months of 1923 and 1925, suggesting that this may at least in
part have been due to cyclical demand factors. In the case of cotton yarn Tokyo
retail prices were consistently at least double the wholesale price from January

21
1923 through to June 1925, although the gap was considerably greater than 100%
from October 1923 through to early in 1925, as retail prices shot up to new highs
before declining again during 1925. The Tokyo retail price of cotton thread fell by a
third between December 1924 and June 1925, a decline that is more likely to be
associated with the increasing productivity in the industry and external market
trends.26 Statistics on retail prices compiled by the Tokyo Chamber of Commerce
show that the average retail prices in 1924 of 47 ‘daily necessaries’ in Tokyo were
in most cases above the 1923 average retail price. In the case of rice, however,
much of this higher average was accounted for by monthly rises in the second half
of 1924, suggesting the importance of seasonal factors. A higher 1924 average
retail price for charcoal is largely the consequence of unusually high prices in the
early months of 1924, something that matches the findings indicated earlier. Data
from the same series for cotton yarn also show a significantly higher retail price in
1924 than in 1923, reflecting the trends indicated above.27 Further identification
and analysis of suitable retail price data is needed if the relationship between
retail and wholesale prices at this time is to be better understood.
If we consider contemporary accounts, such as official publications and
newspaper and journal reports, however, we find a much starker story of price
changes, at least in the early months after the disaster. Complaints regarding
attempts by retailers to charge as much as they could for goods in short supply
were on every page. Sympathy for the victims was often outweighed by the
realisation that there were profits to be obtained, and it was in response to this
situation that the authorities rapidly moved to issuing an anti-profiteering
ordinance. Profiteering, according to this ordinance, was identified as the charging
of a price increase of 30% or more over the pre-disaster price, and individuals
found guilty of profiteering were liable to imprisonment or heavy fines. It is hard to
judge how far such draconian regulations limited retail price increases, but they
certainly did not stop them completely. Over the two months following the
earthquake over 400 individuals were arrested for breaching the regulations,28
although we have no way of knowing whether or not this was just the tip of the
iceberg, and many hundreds more managed to evade the eyes of the police. Without
doubt, though, the anti-profiteering measures demonstrate clearly that the
26 Tōkyō Shōgyō Kaigisho, Tōkyō Shōgyō Kaigisho Tōkei Nenpō – Taishō Jūsannen [Annual Statistical Report of Tokyo Chamber of Commerce, 1925 edition] (Tokyo, March 1927). 27 Tōkyō Shōgyō Kaigisho, Tōkyō Shōgyō Kaigisho Tōkei Nenpō – Taishō Jūsannen, pp.47-52. 28 Keishichō, Taishō Daishinkasai Shi (Tokyo: Keishichō, July 1925), pp.605, 622. See also Hunter, ‘”Extreme Confusion and Disorder”?’.

22
authorities thought that there was a problem. The 30% price increase criterion also
suggests that they expected some retail prices to rise by a considerable margin in
the wake of the disaster, and felt that they had no choice but to tolerate increases
up to a certain level. The basic belief that anti-profiteering measures were
necessary for price stability went well beyond government. One analysis of the
economic impact of the disaster that appeared early in 1924, for example, noted the
importance of the regulations to prevent excess profits, highlighting the existence
of outrageous behaviour in Tokyo, such as an individual selling a sheet of zinc plate
for 2 yen 70 sen, which was more than double the normal price. Nor were
profiteering cases limited to Tokyo. Similar instances were cited from the
provincial cities of Osaka, Kōbe and Nagoya.29 Chambers of commerce across the
country reported increases in the prices of lumber and other construction goods of
up to 50%, while some regions reported significant price falls for key products for
which demand had fallen, including raw silk and hemp.30
This kind of more anecdotal evidence does not necessarily call into question
our findings, but it does confirm that at least for a limited period price instability,
particularly in relation to retail prices, was a real issue of concern for many
contemporaries. Our positive findings in relation to the impact of the disaster on
the prices of rice and timber offer further support for what we know from
descriptive statistics and qualitative evidence. The finding that, at least in the
case of rice, prices in northeastern Japan were more strongly affected than those in
the west of Japan, is in line with the concerns voiced by local business interests in
the months following the disaster.31 The significant, albeit short term, increase in
the price of some wood products also resonates strongly with contemporary
accounts of acute price instability in the market for timber.32 Nevertheless, the
findings for a number of the selected goods did not yield statistically significant
results, and the scale and impact of the price changes in Tokyo and Yokohama, and
their diffusion to other parts of the country, were somewhat less than suggested by
the alarmist tone of contemporary reports. Both macroeconomic and price data
29 Jiji Shinpōsha Keizaibu, Daishinsai Keizai Shi (Tokyo: Jiji Shinpōsha & Nihon Hyōronsha, January 1924), pp.19-24. 30 Nōshōmushō Shōmukyoku, Kantō Chihō Shinsai no Keizaikai ni oyoboseru Eikyō (Tokyo: Nōshōmushō, August 1924), pp.100, 109-10, 186, 200. The Commerce Bureau of the Ministry of Agriculture and Commerce asked local chambers of commerce to report on the effects of the earthquake on business within their jurisdictions, and this volume is the collected reports from across the country. 31 See Nōshōmushō Shōmukyoku, Kantō Chihō Shinsai no Keizaikai ni oyoboseru Eikyō. 32 See eg. Nōshōmushō Sanrinkyoku, Kantō Daishinsai to Mokuzai oyobi Shintan (Tokyo: Sanrinkyoku, October 1924).

23
suggest that the changes in most indicators were relatively short lived, and that
the disaster had ceased to have any significant impact on Japan’s economy by the
late 1920s.
By contributing a new perspective from below the macro-level, and by
offering a preliminary evidential study of prices for a range of different goods, this
paper has contributed to our understanding of what was happening in markets in
the aftermath of the Great Kantō Earthquake. The findings suggest that even at a
relatively early stage prices were already stabilising, and that the diffusion of price
instability outwards from the affected Kantō region was on a lesser scale than
might have been expected. Much further research is needed, however, if we are to
understand better the implications of these trends in prices. We need to analyse
the factors that limited the spread and duration of price changes consequent on the
earthquake in the face of a high degree of market integration. Following on from
that a further question needs to be addressed, namely how far these factors may
have been significant in determining the relatively confined impact of the disaster
on Japan’s economy over the longer term.

24
References [1] Baltagi, B.H., Econometric Analysis of Panel Data, fifth edition (Chichester:
John Wiley & Sons Ltd, 2013).
[2] Bates, A., The Culture of the Quake: the Great Kantō Earthquake and Taishō
Japan (University of Michigan Center for Japanese Studies: Ann Arbor, 2015)
[3] Borland, J., ‘Capitalising on Catastrophe: Reinvigorating the Japanese State
with Moral Values through Education following the 1923 Great Kantō
Earthquake’, Modern Asian Studies, 40(4) (2006), pp.875-907.
[4] Cameron, A., Colin, Gelbach, B., Jonah, and Miller, L., Douglas,
‘Bootstrap-based Improvements for Inference with Clustered Errors’, Review
of Economics and Statistics, 90(3) (2008), pp.414–427.
[5] Carvalho, V.M., Nirei, M., and Sato, Y.U., ‘Supply Chain Disruptions: Evidence
from the Great East Japan Earthquake’, RIETI Discussion Paper Series
14-E-035, (June 2014)
(http://www.parisschoolofeconomics.eu/IMG/pdf/14e035.pdf, accessed on
16/09/2016).
[6] Cavallo, A., Cavallo, E., and Rigobon, R., ‘Prices and Supply Disruptions
during Natural Disasters’, Review of Income and Wealth, 60(S2) (2014),
pp.S449–71.
[7] Cavallo. E., and Noy, I., ‘The Economics of Natural Disasters – a Survey’,
International Review of Environmental and Resource Economics, 5(1), (2011),
pp.1–40.
[8] Central Meteorological Observatory., Kantō Daishinsai Chōsa Hōkoku,
Jishinhen (Tokyo, 1924).
[9] Choi, I., ‘Unit Root Tests for Panel Data’, Journal of International Money and
Finance, 20(2) (2001), pp.249–72.
[10] Clancey, G., Earthquake Nation: the Cultural Politics of Japanese Seismicity,
1868-1930 (University of California Press: Berkeley CA, 2006).
[11] Department of Publications, Japan Union News Agency., Kantō Daishinsai
Shashinchō (Tokyo, 1923).
[12] Hunter, J., ‘ “Extreme confusion and disorder”? the Japanese Economy in the
Great Kantō Earthquake of 1923’, Journal of Asian Studies, 73(3) (2014),
pp.753-73.
[13] Hsiao, C., Analysis of Panel Data, third edition, (New York: Cambridge
University Press, 2014).

25
[14] Imaizumi, A., ‘Tōkyō-fu Kikai Kanren Kōgyō Shūseki ni okeru Kantō
Daishinsai no Eikyō: Sangyō Shūseki to Ichijiteki Shokku’, Shakai Keizai
Shigaku, 74(4) (2008), pp.23–4.
[15] Ministry of Agriculture and Commerce., Nōshōmushō Tōkeihyō, Daijūkyūji
(Tokyo, 1904).
[16] Mosk, C., Japanese Industrial History (M.E.Sharpe: Armonk NY & London,
2000).
[17] Naimushō Shakaikyoku., The Great Earthquake of 1923 in Japan
(Sanshusha Press: Tokyo, 1926).
[18] Nihon Ginkō Hyakunen Shi Hensan Iinkai., Nihon Ginkō Hyakunen Shi vol.3
(Nihon Ginkō: Tokyo, 1983).
[19] O’Grada, C., Famine: a Short History (Princeton NJ: Princeton University
Press, 2009).
[20] Okazaki, T., Itō, K., and Imaizumi, A., ‘Impact of Natural Disasters on
Industrial Agglomeration: the Case of the 1923 Great Kanto Earthquake’,
CIRJE Discussion Paper, University of Tokyo, (2009), CIRJE-F-602.
[21] Pereira, A.S., ‘The Opportunity of a Disaster: the Economic Impact of the
1755 Lisbon Earthquake’, Journal of Economic History, 69(2) (2009), pp.466–
99.
[22] Schenking, C.J., The Great Kantō Earthquake and the Chimera of National
Reconstruction in Japan (Columbia University Press: New York, 2013).
[23] Sen, A., Poverty and Famines: an Essay on Entitlement and Deprivation
(Oxford: Oxford University Press, 1983).
[24] Smits, G., When the Earth Roars: Lessons from the History of Earthquakes in
Japan (Rowman & Littlefield: Lanham MD, 2014).
[25] Tōya, H., and Skidmore, M., ‘Economic Development and the Impacts of
Natural Disasters’, Economics Letters, 94 (2007), pp.20–5.
Statistical reports [1] Geospatial Information Authority of Japan., Todōfukenchōkan no Kyori
[Distances between Prefectural Offices] (http://www.gsi.go.jp/KOKUJYO
HO/kenchokan.html, accessed on 12/03/2016).
[2] Hakata Shōgyō Kaigisho, Hakata Shōgyō Kaigisho Tōkei Nenpō 1924 [Annual
Statistical Report of Hakata Chamber of Commerce for 1924] (Fukuoka, 1924).
[3] Naikaku Tōkeikyoku, Nihon Teikoku Jinkō Dōtai Tōkei [Vital Statistics of the

26
Empire of Japan], editions from 1921 to 1925 (Tokyo, 1924a–1926a).
[4] Naikaku Tōkeikyoku, Nihon Teikoku Tōkei Nenkan [Statistical Yearbook of
the Empire of Japan], vols.42-46 (Tokyo, 1924b–1927b).
[5] Nihon Kishōchō, Kako no Kishō Deeta [Historical Meteorological Data]
(http://www.data.jma.go.jp/gmd/risk/obsdl/index, accessed on 12/03/2016).
[6] Nōshōmushō Tōkeika, Kōjō Tōkeihyō 1921-1923 [Statistical Tables of
Factories] (Tokyo, 1923–1925).
[7] Ōsaka Shōgyō Kaigisho, Tōkei Nenpō 1923 [Annual Statistical Report of
Osaka Chamber of Commerce for 1923] (Osaka, 1923).
[8] Shōkōmushō Tōkeika, Oroshiuri Bukka Tōkeihyō [Statistical Tables of
Wholesale Prices] (Tokyo, 1926) (http://dl.ndl.go.jp/info:ndljp/pid/1710197,
accessed on 12/03/ 2016).
[9] Shōkōmushō Tōkeika, Kōjō Tōkeihyō 1924-1925 [Statistical Tables of
Factories] (Tokyo, 1926–1927).
[10] Tōkyō Shōgyō Kaigisho, Tōkyō Shōgyō Kaigisho Tōkei Nenpō, 1925 [Annual
Statistical Report of Tokyo Chamber of Commerce for 1925] (Tokyo, 1927).

27

28

29

30

31

Notes
inform
affect
Data
Japan
and th
7) and
s: Each green
mation. The y
ted zone. Sev
on latitude a
n, as describe
he affected zo
d Central Me
Figure
n circle repre
yellow-red cir
veral islands
and longitude
ed in Appendi
one are from D
teorological O
1: Spatial
esents the loc
rcle shows th
including Ok
e are from th
ix B. The info
Department o
Observatory (
32
distributio
cation of a sa
he centre of t
kinawa prefec
he database
ormation on t
of Publication
1924, illustra
n of sample
ample city ba
the earthquak
cture are not
of the Geosp
the location o
ns, Japan Uni
ation no.1 and
e cities
ased on latitu
ke. The black
shown in th
atial Informa
of the center
ion News Age
d no.2).
ude and long
k circle show
he figure. Sou
ation Authori
of the earthq
ency (1923, se
itude
s the
urces:
ity of
quake
ection

33
Figure 2: Time series plots of average prices of products in Tokyo and Yokohama
Notes: The average prices of products in Tokyo and Yokohama are described in the figures. For Tokyo city, the price of rice in September 1923 is not available.
For Yokohama city, the price of rice from July 1923 to September 1923, the price of wheat, cotton yarn, pine board, and calcium superphosphate from July 1923
to February 1923, the price of coal from July 1923 to September 1923, and the price of charcoal from 1923 to October 1923 are not available. The red line shows
September 1923. Dotted lines show the average prices of each product before and after the earthquake. Rice includes brown rice (1st, 2nd and 3rd grades) and
white rice. Fuel includes coal and charcoal. Source: Statistical Division of the Minister's Secretariat of Commerce and Industry (1926).

34
Figure 3: Time series plots of average prices of products in provincial cities
Notes: The red line shows September 1923. Dotted lines show the average prices of each product before and after the earthquake. Rice includes brown rice (1st,
2nd and 3rd grades) and white rice. Fuel includes coal and charcoal. Source: Statistical Division of the Minister's Secretariat of Commerce and Industry
(1926).

35
Figure 4: Impact of the earthquake on wholesale price of rice in provincial cities by
distance from Tokyo
Notes: The length of the bar shows the estimated increase in price due to the earthquake as a
proportion of the total increase in price from the period from May 1921 to August 1923 to the period
from September 1923 to December 1925, calculated using our baseline estimates reported in Table
3. Both the increase in price caused by the earthquake and the total increase in price between the
period up to August 1923 and the period after September 1923 in each provincial city are reported in
Table A.4.
3.8
4.7
5.1
6.9
8.3
8.5
8.1
9.4
12.9
10.3
12.4
0 1 2 3 4 5 6 7 8 9 10 11 12 13Proportion of total price increase due to the earthquake (%)
Fukuoka, 888 km
Otaru, 839 km
Hiroshima, 681 km
Kochi, 618 km
Kobe, 430 km
Osaka, 403 km
Kyoto, 370 km
Sendai, 302 km
Kanazawa, 295 km
Nagoya, 265 km
Niigata, 255 km

36
Figure 5: Proportion of increase in rice price due to the earthquake, by distance
Notes: The solid lines show the estimated increase in price due to the earthquake as a proportion of
the total increase in price from the period from May 1921 to August 1923 to the period after
September 1923 in each area (see Figure A.2 in Appendix A for the magnitude in each provincial
city). The post-earthquake periods are set at 6, 9, 12, 15, 18, 21, 24, and 28 months, respectively. For
each period, the estimated coefficients used to calculate the increase in price due to the earthquake,
are 1.349, 1.601, 1.530, 1.528, 1.484, 1.528, and 1.623, respectively (see column 3 of Table 4).

37
Figure 6: Proportion of increase in rice price due to the earthquake, by region
Note: The solid lines show the increase in price due to the earthquake as a proportion of the total
increase in price from the period from May 1921 to August 1923 to the period after September 1923
in north—eastern and in south—western cities (see Figure A.2 in Appendix A for the magnitude in
each provincial city). The north—eastern cities include Niigata, Kanazawa, Sendai, and Otaru. The
south—western cities include Nagoya, Kyoto, Osaka, Kobe, Kochi, Hiroshima, and Fukuoka. The
geospatial characteristics of those cities are shown in Table 1. The post—earthquake periods are set
at 6, 9, 12, 15, 18, 21, 24, and 28 months, respectively. For each period, the estimated coefficients
used to calculate the increase in price due to the earthquake, are 1.349, 1.601, 1.530, 1.528, 1.484,
1.528, and 1.623, respectively (see column 3 of Table 4).

38
Figure 7: Observed disparities between wholesale and retail prices
in Tokyo, Osaka, and Fukuoka city
Notes: The end point of the period in each graph is due to the availability of data. Tokyo city is included
in the devastated area. The geospatial distances from Tokyo to Osaka and Fukuoka city are 403 km
and 888 km, respectively. The red line shows September 1923. The solid line shows the retail price.
The dashed line shows the wholesale price. Sources: Tokyo Chamber of Commerce (1927); Osaka
Chamber of Commerce (1923); Hakata Chamber of Commerce (1923).

39
Appendix A Additional Figures and Tables

40

41

42
Figure A.1: Correlation between the increase in rice price due to the earthquake
and geospatial distance from Tokyo
Notes: The estimates of the increase in the price of rice due to the earthquake are calculated by using
the baseline estimate for May 1921 to December 1925 reported in Table 3. The increases in the price of
rice due to the earthquake in each provincial city are from the second column in Table A.4. The
geospatial distances from Tokyo are from the third column in Table 1. The regression line illustrated
as a solid line in the graph is . The
number of cities is 11.
.1
.15
.2
.25
.3
.35
.4
.45
.5
.55
.6
.65
.7
.75
Incr
ease
in p
rice
due
to th
e ea
rthq
uake
, yen
per
180
lite
rs
250 300 350 400 450 500 550 600 650 700 750 800 850 900Geospatial distance from Tokyo, kilometers

43
Figure A.2: Increase in rice price due to the earthquake as a proportion of the total
increase in price
Notes: The solid lines show the increase in price due to the earthquake as a proportion of the total
increase in price from the period from May 1921 to August 1923 to the period after September 1923 in
each provincial city. The post-earthquake periods are set at 6, 9, 12, 15, 18, 21, 24, and 28 months,
respectively. For each period, the estimated coefficients used to calculate the increase in price due to
the earthquake, are 1.349, 1.601, 1.530, 1.528, 1.484, 1.528, and 1.623, respectively (see column 3 of
Table 4).
Appendix B Data appendix
A. Wholesale and retail prices
The data on wholesale prices are from the Oroshiuri Bukka Tōkeihyō (Tables of
Statistics of Wholesale Prices) published by the Statistical Section of the Ministry
of Commerce and Industry in 1926. The digital archive is available in the National
Diet Library Digital Collections (http://dl.ndl.go.jp/info:ndljp/pid/1710197). The
cities reported in this document are Tokyo, Yokohama, Niigata, Nagoya, Kanazawa,
Sendai, Kyoto, Osaka, Kobe, Kochi, Hiroshima, Otaru, and Hakata. This document
3
13
23
33
43
53
63
73
83
93
103
113
123
133P
ropo
rtio
n of
tota
l pric
e in
crea
se d
ue to
the
eart
hqua
ke (
%)
6 9 12 15 18 21 24 27Months after the earthquake
Osaka KobeKyoto NagoyaHiroshima KanazawaSendai OtaruFukuoka NiigataKochi

44
recorded the monthly wholesale prices for several goods in these cities in order to
compile price data for the convenience of general users (see Introduction to this
statistical report). The data on retail prices are from several documents that were
issued by the local Chambers of Commerce in each city. The information on retail
prices in Tokyo city are from the Tōkyō Shōgyō Kaigisho Tōkei Nenpō (Annual
Statistical Report of Tokyo Chamber of Commerce) for 1925 published by the Tokyo
Chamber of Commerce in 1927. The information on retail prices in Osaka city is
from the Tōkei Nenpō (Annual Statistical Report) for 1923 published by Osaka
Chamber of Commerce in 1923. The information on retail prices in Hakata (part of
Fukuoka city) are from the Hakata Shōgyō Kaigisho Tōkei Nenpō (Annual
Statistical Report of Hakata Chamber of Commerce) for 1924 published by Hakata
Chamber of Commerce in 1924.
B. Geospatial distances between Tokyo and provincial cities
We calculated the minimum distances between each city and Tokyo city using the
spheroid (GRS80) of the Geospatial Information Authority of Japan (GIAJ) based
on the information on the longitude and latitude of each city. The Application
Programming Interface is publicly available on
http://vldb.gsi.go.jp/sokuchi/surveycalc/agreement.html (in Japanese). The data on
latitude and longitude are obtained from the database of the GIAJ; these data are
publicly available at http://www.gsi.go.jp/KOKUJYOHO/kencho/kenchobl.html.
C. Covariates
The annual data on population numbers are from Nihon Teikoku Jinkō Dōtai Tōkei
(Vital Statistics of the Empire of Japan; VSEJ) (1921—1925 editions) published by
the Statistics Bureau of the Cabinet between 1924 and 1926. The data on the
number of factories are taken from Kōjō Tōkeihyō (Table of Statistics of Factories;
TSF) (1921—1925 editions) published by the Statistical Section of the Ministry of
Agriculture and Commerce (1923, 1924 and 1925) and the Statistical Section of the
Ministry of Commerce and Industry (1926 and 1927). The annual data on total
tonnage are from Nihon Teikoku Tōkei Nenkan (Statistical Yearbook of the Empire
of Japan; SYEJ) (volumes 42 to 46) published by the Statistics Bureau of the
Cabinet between 1924 and 1927. For meteorological variables, both monthly
average temperature and monthly average precipitation are from the database of

45
the Japan Meteorological Agency (JMA), at
http://www.data.jma.go.jp/gmd/risk/obsdl/index.php. Since meteorological
observation stations are located in each large city, we replicate missing data on the
observations in 2 of the 12 cities by using the nearest meteorological observation
station. To be specific, Sendai city in Miyagi prefecture is represented by the data
for Shiogama city in the same prefecture, while Otaru city in Hokkaido prefecture
is represented by the data for Sapporo city in the same prefecture.


![Dizziness - · PDF filealso beappropriate for patientswithsevere vertigo andnausea, butcurrently this is only approved for chemotherapy-induced nausea [8]. In patients with](https://img.pdfslide.us/doc/110x75/5a8559817f8b9a882e8c2c96/dizziness-beappropriate-for-patientswithsevere-vertigo-andnausea-butcurrently.jpg)


![A descriptive study of ciguatera fish poisoning in Cook ... · Dogs Kawakubo and Kikuchi [4] Experimental study 1-6 h Anonymous [7] Case report/series 1 day Cats Bagnis and Fevai](https://img.pdfslide.us/doc/110x75/607f12a5cfd86c7e505c5ba5/a-descriptive-study-of-ciguatera-fish-poisoning-in-cook-dogs-kawakubo-and-kikuchi.jpg)