Embed Size (px)
Citation preview

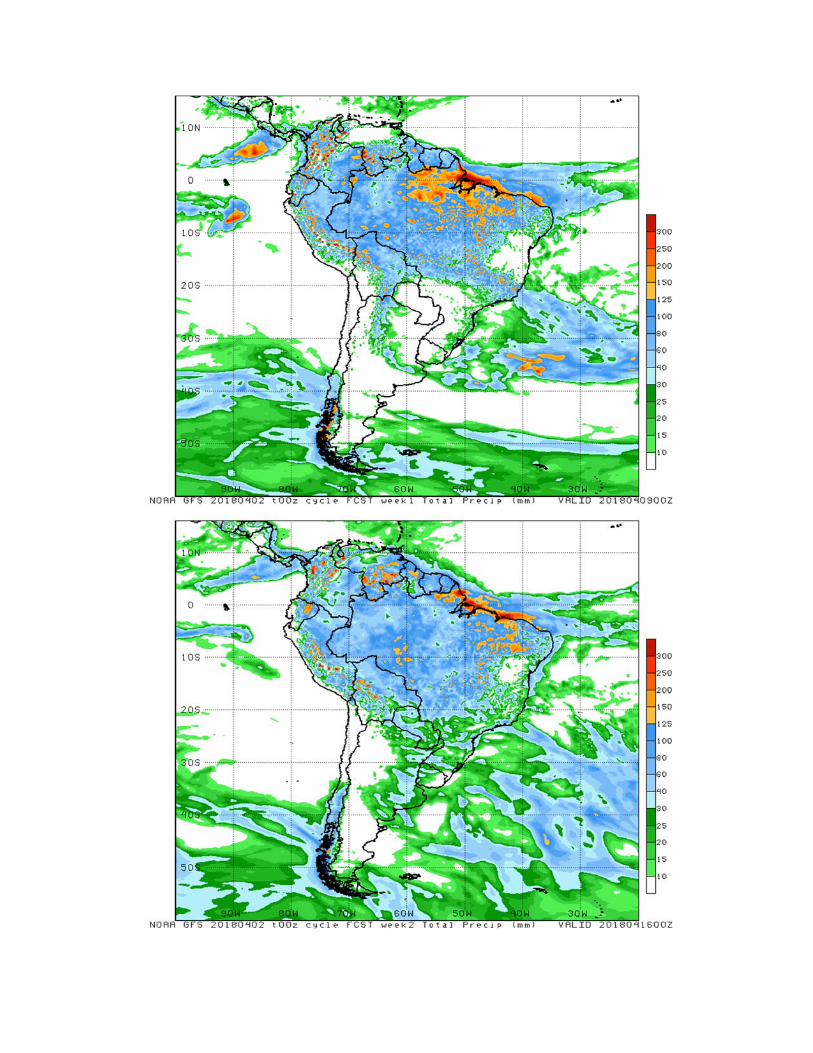
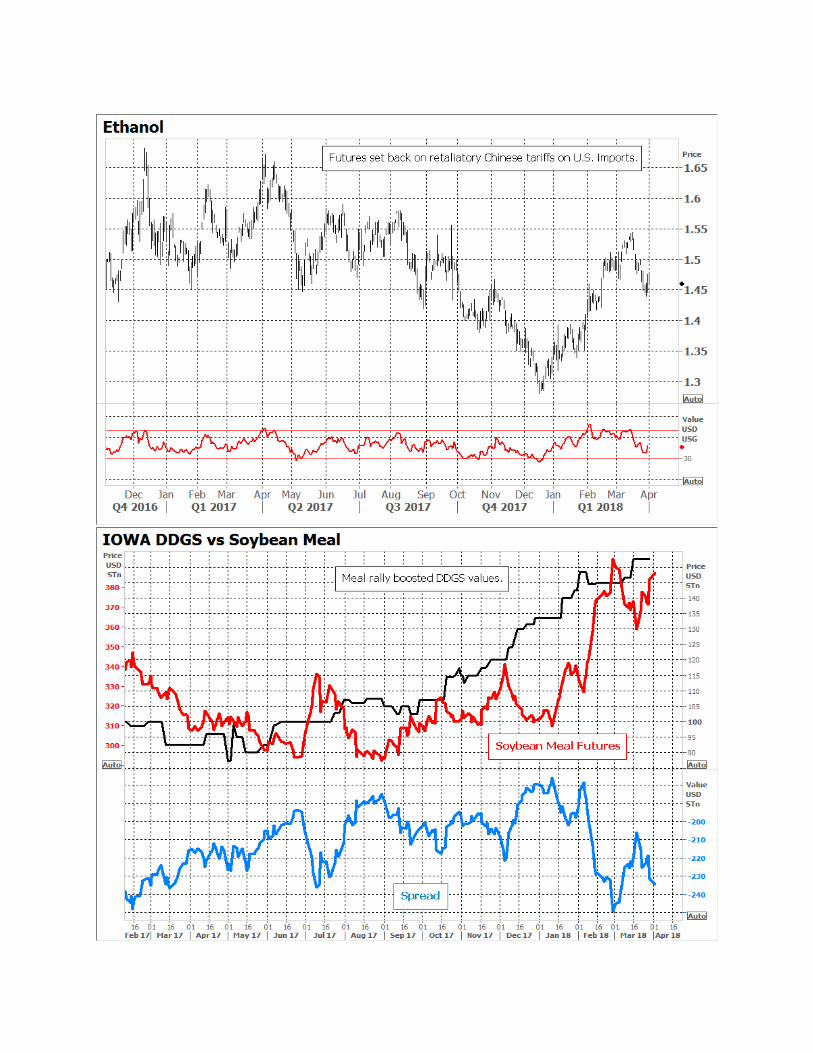
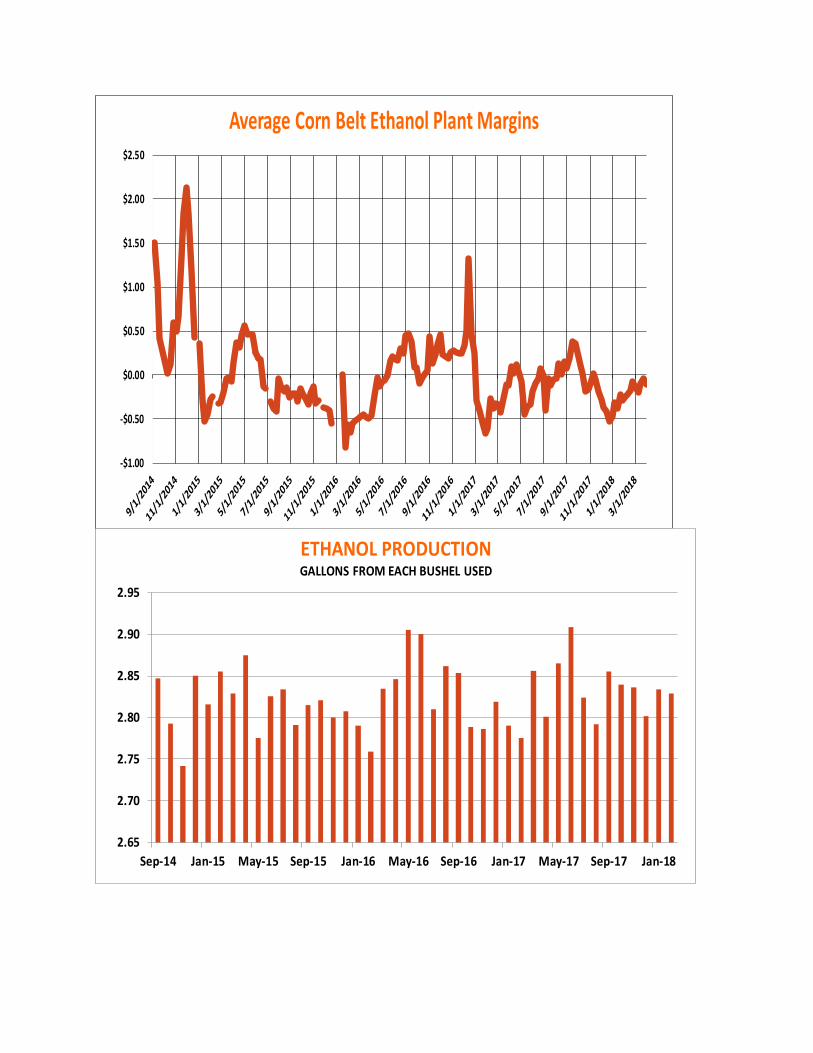
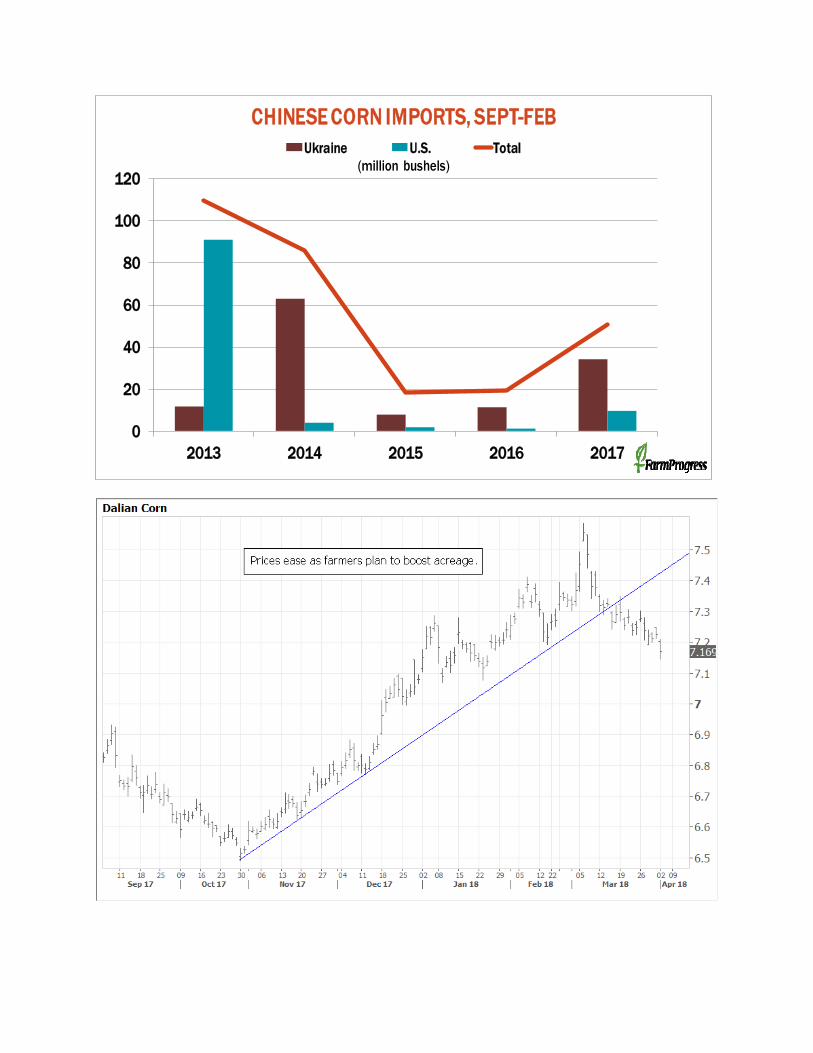
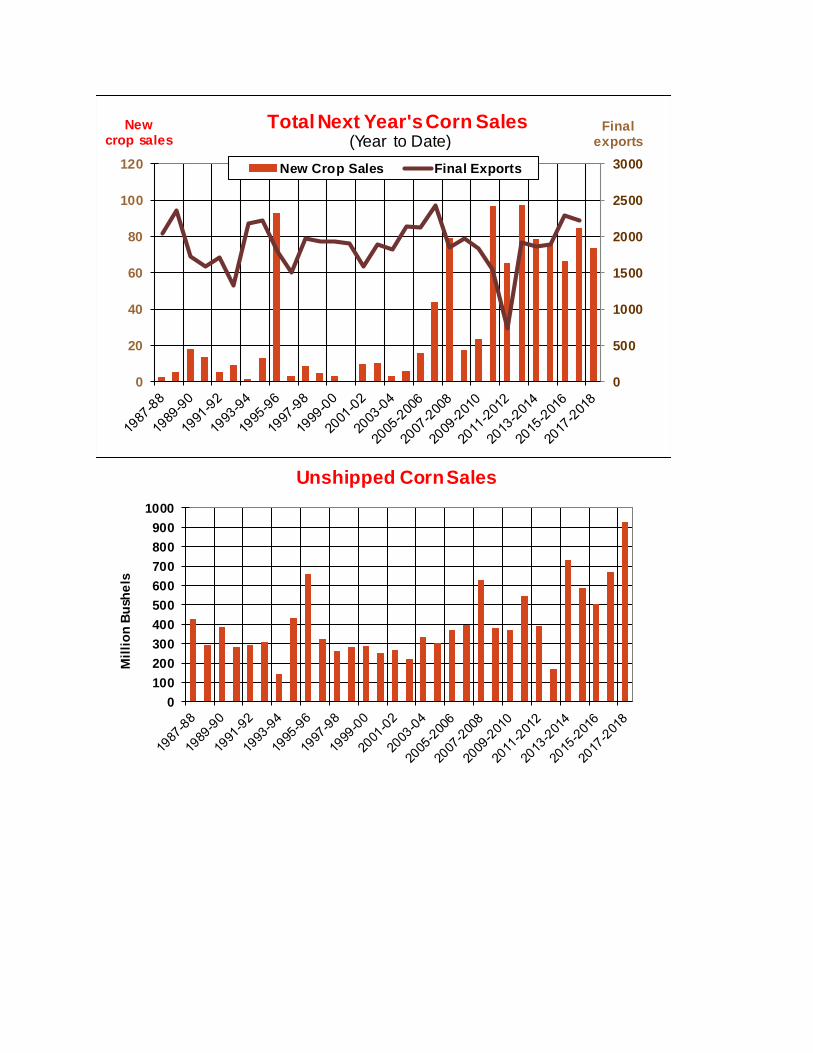
Price old crop corn on acreage rally Keep powder dry on new crop to wait for profitable levels By Bryce Knorr, senior grain market analyst Soybeans grabbed most of the headlines this winter, but corn prices also continued to chug higher. While that trend could take a bit of a pause as the market consolidates gains, USDA’s March 29 reports should support rising new crop pricing prospects into spring. Use this rally to keep pricing old crop inventory, but hold off on new crop sales for now. USDA said farmers would plant just over 88 million acres of corn this spring, 2 million less than a year ago, and 1.5 million below trade expectations. The market may not really need to buy any corn acres right now – at least not yet. But lower acreage could support better rallies later this spring and into the summer as weather becomes an issue. The next mile marker for traders likely will be USDA’s monthly supply and demand report April 10, which will incorporate findings from the agency’s survey of March 1 stocks. That tally was higher than expected, suggesting feed usage may not be quite as strong as previously forecast. Any decline in that category of usage should be offset by stronger exports, and perhaps better demand for ethanol production. Ethanol did hit a speed bump thanks to new 15% retaliatory tariffs by China, which should squelch the increase in sales seen over the winter. China’s first 30% tariff on ethanol cut off a burst in sales at the knees in 2017. Blenders starting importing again this year when prices surged as they try to meet the government’s mandate for nationwide E10 by 2020. Still, ethanol is more than competitive with gasoline, which should encourage blenders as the summer driving season approaches. Exports got off to a slow start for the 2017 crop, but have picked up in part due to the drought in Argentina. Brazil also won’t be able to ship out much corn as soybeans clog ports there. The biggest unknown over the next few months internationally could be the size of the 2018 Brazilian crop. Seeding of the “safrinha” corn behind soybeans got off to a slow start, which could reduce acreage. Southern Brazil is still feeling the impact of this year’s La Nina, which could also reduce yields. Even with better exports, some 2.1 billion bushels of corn may be left over at the end of the summer. But if U.S. farmers plant only 88 million acres, average yields could take the 2018 crop below 14 million bushels, eventually reducing carryout below 1.8 billion bushels, assuming demand holds up. That prospect should make the market even more sensitive to weather, and 2018 is already shaping up to be a challenging year at the starting gate. Forecasts for a cold, wet April over most of the growing region were highlighted by April snows storms this week in the northern Plains and Upper Midwest. While far from unusual, the outlook should keep buyers willing to get long on dips. Under the current supply and demand scenario, December futures have a shot at rallies to $4.50, maybe higher. The next upside target on the new crop chart is around $4.18 with last summer’s $4.295 high above that. Charts are already showing divergence with RSI not making new highs, so I don’t look for a this big of a push just yet. Seasonal trends also support a slowdown in early April. I recommended boosting sales of 2017 production to 90% with another 10% increment Monday basis July futures, to capture carry and wait for further basis strengthening into late spring and early summer. The only new crop marketing in sight currently might be to start bear spreading December 2018-July 2019 carry. It strengthened into my selling zone for the spread of 11 to 13 cents. It’s still early – this tends to be more of a weather play – but is one way to start protecting basis for grain that must be sold off the coming. A short crop could invert December above red July. But if good yields prevail, carry could still widen out a dime or more, offsetting some of the sting of weaker harvest basis.

Corn Supply & Demand
USDA
Area 2016 2017 2018 2017 2018Planted 94,004 90,167 90,000 90,703 88,026 Harvested 86,748 82,703 82,700 82,703 80,885
Yield 174.6 176.6 174.0 176.6 172.6
Beginning stocks 1,737 2,294 2,352 2,294 2,129 Production 15,148 14,605 14,390 14,605 13,957 Imports 57 50 50 37 37 Supply, total 16,942 16,947 16,792 16,936 16,123 Feed and residual 5,473 5,550 5,475 5,480 5,336 Food, seed and ind. 6,883 7,045 7,145 7,045 7,115 Domestic, total 12,356 12,595 12,620 12,525 12,451 Exports 2,293 2,225 1,900 2,282 1,941 Use, total 14,649 14,821 14,520 14,807 14,392 Ending stocks 2,294 2,127 2,272 2,129 1,731 Ave. cash price $3.36 $3.35 $3.40 $3.46 $3.93
Stocks to use 15.7% 14.4% 15.6% 14.4% 12.0%Ave. nearby futures $3.69 $3.60 $3.81 $4.28
Top Third $3.81 $4.48 of Price Range to $4.16 to $4.87
Bryce's Forecast


0
10
20
30
40
50
60
707
0
73
76
79
82
85
88
91
94
97
00
03
06
09
12
15
18
sto
ck
s/u
se
U.S. Corn Stocks/Use
0
2000
4000
6000
8000
10000
12000
14000
16000
70 72 74 76 78 80 82 84 86 88 90 92 94 96 98 00 02 04 06 08 10 12 14 16 18
millio
n b
us
he
ls
Corn Demand
IndustrialFeedExports
‐$1.00
‐$0.50
$0.00
$0.50
$1.00
$1.50
$2.00
$2.50
Average Corn Belt Ethanol Plant Margins
2.65
2.70
2.75
2.80
2.85
2.90
2.95
Sep‐14 Jan‐15 May‐15 Sep‐15 Jan‐16 May‐16 Sep‐16 Jan‐17 May‐17 Sep‐17 Jan‐18
ETHANOL PRODUCTIONGALLONS FROM EACH BUSHEL USED

-
5,000
10,000
15,000
20,000
25,000
30,000
35,000
2012 2013 2014 2015 2016 2017 2018
tho
usa
nd
ba
rre
ls
Source: USEIA, Farm Futures
Monthly U.S. ethanol production and stocks
Production Stocks
800
850
900
950
1000
1050
1100
1150
17000
18000
19000
20000
21000
22000
23000
24000
25000
9/1/16 11/1/16 1/1/17 3/1/17 5/1/17 7/1/17 9/1/17 11/1/17 1/1/18 3/1/18
thousand barrels/day
Production
thousand barrels
Stocks WEEKLY ETHANOL PRODUCTION AND STOCKS
Ending stocks Daily Production
0
20
40
60
80
100
120
2013 2014 2015 2016 2017
CHINESE CORN IMPORTS, SEPT-FEB
(million bushels)Ukraine U.S. Total

Weekly Export Inspections
in million bushels For week of 03/22/18
This Week
Last Week
Average Trade Guess
This Week
Last Year
Rate Needed to Meet USDA
Forecast
Year-to-Date
Total This Year
Year-to-Date
Total Last Year
WHEAT 10.2 17.5 9-18 20.1 21.1 715 781
CORN 45.4 56.7 49-59 61.8 55.1 902 1,254
SOYBEANS 21.5 18.4 16-23 20.4 23.5 1,500 1,704
Source: USDA, Reuters
Weekly Export Sales (million bushels)AS OF WEEK ENDING 3/22/18
Wheat Corn SoybeansOld Crop Sales 13.0 53.3 11.7 New Crop Sales 4.5 11.3 2.6Total Sales 17.5 64.6 14.2 Prior Week 15.8 57.3 33.0 Trade Estimates 16.5 65.0 31.2 Rate to reach USDA Forecast 8.8 17.2 9.3 Export Shipments 12.1 54.2 28.8Rate to reach USDA Forecast 27.0 57.4 24.3Commitments % of USDA est. 91% 81% 92%5-year average for this week 93% 79% 94%Shipments % of USDA est. 71% 52% 79%5-year average for this week 75% 49% 85%Source: USDA, Reuters

0%10%20%
30%40%50%60%70%80%90%100%
0
500
1000
1500
2000
2500
Total Corn Sales & Shipments(Year to Date)
Total Commitments % of USDA Forecast
0.0%
10.0%
20.0%
30.0%
40.0%
50.0%
60.0%
70.0%
0
200
400
600
800
1000
1200
1400
1600
Corn Shipments(Year to Date)
Total Shipments % of USDA Forecast
0
500
1000
1500
2000
2500
3000
0
20
40
60
80
100
120
Final exports
New crop sales
Total Next Year's Corn Sales (Year to Date)
New Crop Sales Final Exports
0
100
200
300
400
500
600
700
800
900
1000
Mil
lio
n B
ush
els
Unshipped Corn Sales
0
10,000
20,000
30,000
40,000
50,000
60,000
70,000
S O N D J F M A M J J A
Th
ou
sa
nd
Bu
sh
els
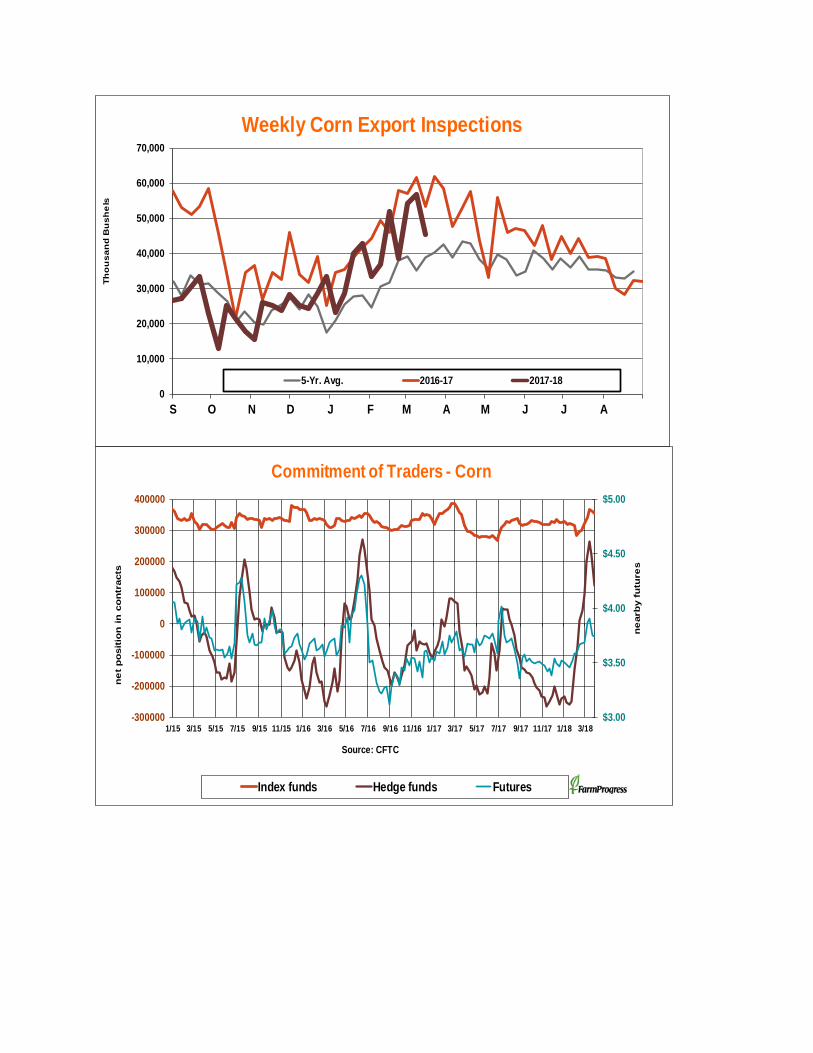
Weekly Corn Export Inspections
5-Yr. Avg. 2016-17 2017-18
$3.00
$3.50
$4.00
$4.50
$5.00
-300000
-200000
-100000
0
100000
200000
300000
400000
1/15 3/15 5/15 7/15 9/15 11/15 1/16 3/16 5/16 7/16 9/16 11/16 1/17 3/17 5/17 7/17 9/17 11/17 1/18 3/18
ne
arb
y f
utu
res
ne
t p
osit
ion
in
co
ntr
acts
Source: CFTC
Commitment of Traders - Corn
Index funds Hedge funds Futures

250
260
270
280
290
300
310
320
300
320
340
360
380
400
420
440
11/1 1/1 3/1 5/1 7/1 9/1 11/1
DECEMBER CORN BULL VS BEAR YEARS
Bull Market 17-Dec Dec-18 Normal Year
255
260
265
270
275
280
285
290
295
300
300
350
400
450
500
550
Aug Sep Oct Nov Dec Jan Feb Mar Apr May Jun Jul
July Corn Bull vs Bear Years
Bull Market Years July 2018 Normal Year
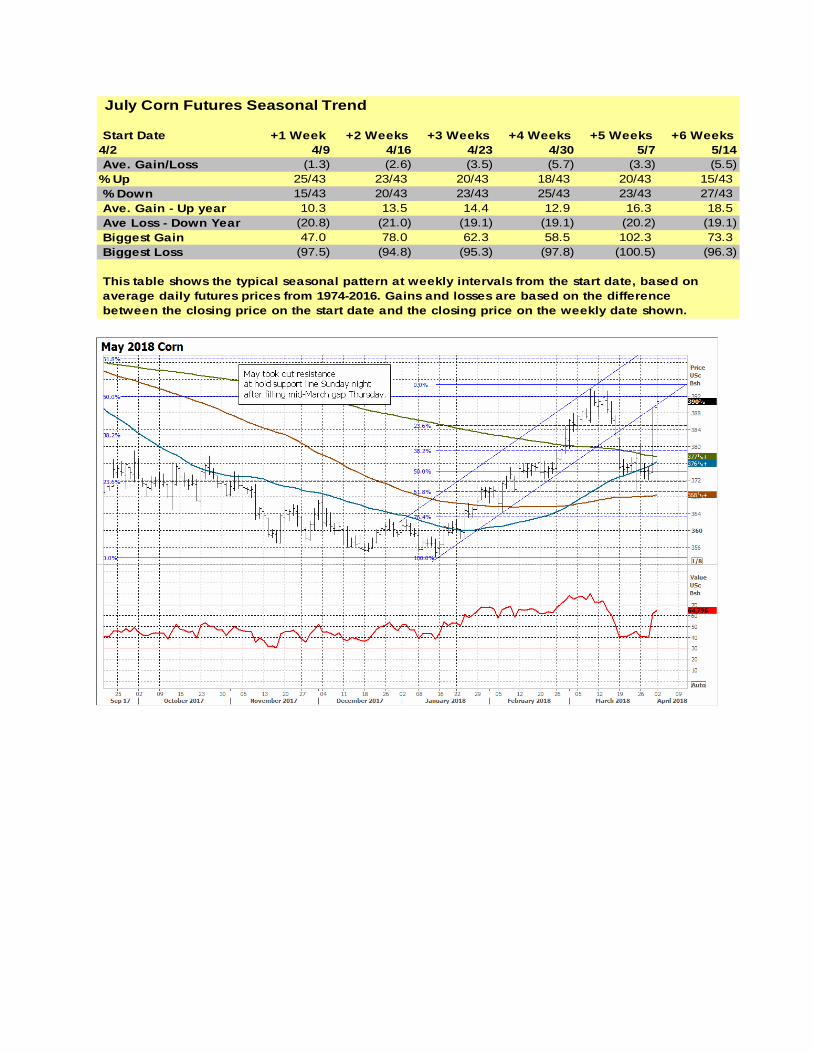
July Corn Futures Seasonal Trend
Start Date +1 Week +2 Weeks +3 Weeks +4 Weeks +5 Weeks +6 Weeks4/2 4/9 4/16 4/23 4/30 5/7 5/14Ave. Gain/Loss (1.3) (2.6) (3.5) (5.7) (3.3) (5.5)
% Up 25/43 23/43 20/43 18/43 20/43 15/43% Down 15/43 20/43 23/43 25/43 23/43 27/43Ave. Gain - Up year 10.3 13.5 14.4 12.9 16.3 18.5 Ave Loss - Down Year (20.8) (21.0) (19.1) (19.1) (20.2) (19.1) Biggest Gain 47.0 78.0 62.3 58.5 102.3 73.3 Biggest Loss (97.5) (94.8) (95.3) (97.8) (100.5) (96.3)
This table shows the typical seasonal pattern at weekly intervals from the start date, based onaverage daily futures prices from 1974-2016. Gains and losses are based on the difference between the closing price on the start date and the closing price on the weekly date shown.