Embed Size (px)
Citation preview
Price Indices for Ocean Charter ContractsA study of freight rate developments in marine transportation,
1997-2007
Albert Veenstra Jan van Dalen
Rotterdam School of Management, Erasmus University, P.O. Box 1738, 3000 DRRotterdam, the Netherlands e-mail: [email protected]
Rotterdam, May 9, 2008
Albert Veenstra & Jan van Dalen (RSM) Price Indices for Ocean Charter Contracts Rotterdam, May 9, 2008 1 / 31
Outline
1 Problem statementThe larger contextInitial resultsQuestions for research
2 Fixtures and current market indicesFixturesCurrent freight rate indices
3 AnalysisData issuesUnit value indicesMatched model indicesHedonic indicesDuration indices
4 Concluding remarks
5 Bibliography
Albert Veenstra & Jan van Dalen (RSM) Price Indices for Ocean Charter Contracts Rotterdam, May 9, 2008 2 / 31
Problem statement The larger context
Introduction
Part of a larger project of dynamic cross section analyses of marinecharter contracts (excess statements of speed and fuel consumption,inter contracting times)
Highly relevant industry: shipping carries 90% of international tradevolume, all kinds of cargoes are shipped in various loading units,activities guided by an international legal framework (internationallaw, regulation, registration)
Cargoes are typically low valued, transportation costs have a largeshare in commodity prices. Marine transportation is moreovercharacterized by large economies of scale, and is highly capitalintensive. Information about freight rate (developments) areimportant for decision making in the industry
Beginning this year we rather naively used matched model indices tomeasure freight rate developments for bulk carriers in spot marketswith somewhat surprising results
Albert Veenstra & Jan van Dalen (RSM) Price Indices for Ocean Charter Contracts Rotterdam, May 9, 2008 3 / 31
Problem statement Initial results
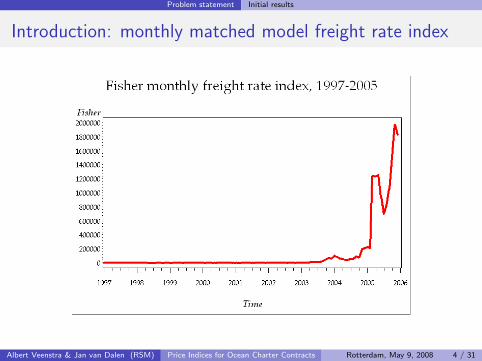
Introduction: monthly matched model freight rate index
Albert Veenstra & Jan van Dalen (RSM) Price Indices for Ocean Charter Contracts Rotterdam, May 9, 2008 4 / 31
Problem statement Initial results
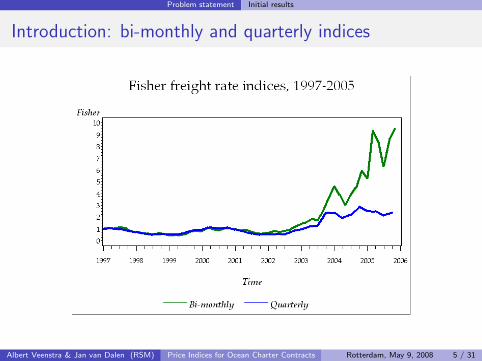
Introduction: bi-monthly and quarterly indices
Albert Veenstra & Jan van Dalen (RSM) Price Indices for Ocean Charter Contracts Rotterdam, May 9, 2008 5 / 31
Problem statement Initial results
Introduction: some observations
The unusual pattern of the index series has been noted before inFeenstra and Shapiro (2003) in the context of scanner data, and hasled to Diewert et al. (2007, p.9)’s comment that ’normal indexnumber theory will break down using weekly data with severe pricebouncing data embedded in it’.
In our example other things go wrong as well: (i) ’ship’ may not be aproper definition of ’matching model’; (ii) many fixtures have no(imo) match in the next month
What is going on in the maritime transportation industry?
Albert Veenstra & Jan van Dalen (RSM) Price Indices for Ocean Charter Contracts Rotterdam, May 9, 2008 6 / 31
Problem statement Questions for research
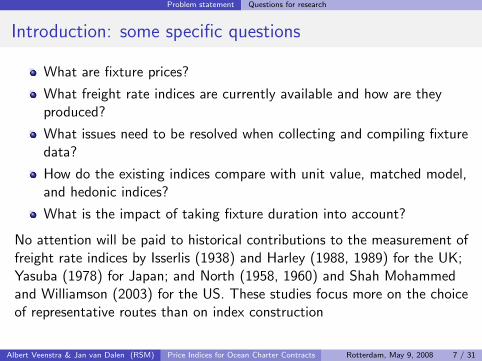
Introduction: some specific questions
What are fixture prices?
What freight rate indices are currently available and how are theyproduced?
What issues need to be resolved when collecting and compiling fixturedata?
How do the existing indices compare with unit value, matched model,and hedonic indices?
What is the impact of taking fixture duration into account?
No attention will be paid to historical contributions to the measurement offreight rate indices by Isserlis (1938) and Harley (1988, 1989) for the UK;Yasuba (1978) for Japan; and North (1958, 1960) and Shah Mohammedand Williamson (2003) for the US. These studies focus more on the choiceof representative routes than on index construction
Albert Veenstra & Jan van Dalen (RSM) Price Indices for Ocean Charter Contracts Rotterdam, May 9, 2008 7 / 31

Fixtures and current market indices Fixtures
Fixture parties
Owner (Bergen-son, Cosco, etc)
Broker (MRI,Clarkson,SSY, etc)
Charterer(Cargill,
Krupp, etc)
Albert Veenstra & Jan van Dalen (RSM) Price Indices for Ocean Charter Contracts Rotterdam, May 9, 2008 8 / 31
Fixtures and current market indices Fixtures
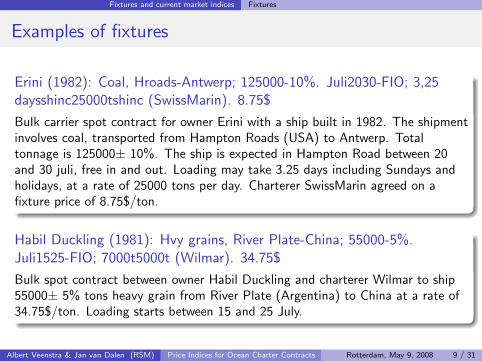
Examples of fixtures
Erini (1982): Coal, Hroads-Antwerp; 125000-10%. Juli2030-FIO; 3,25daysshinc25000tshinc (SwissMarin). 8.75$
Bulk carrier spot contract for owner Erini with a ship built in 1982. The shipmentinvolves coal, transported from Hampton Roads (USA) to Antwerp. Totaltonnage is 125000± 10%. The ship is expected in Hampton Road between 20and 30 juli, free in and out. Loading may take 3.25 days including Sundays andholidays, at a rate of 25000 tons per day. Charterer SwissMarin agreed on afixture price of 8.75$/ton.
Habil Duckling (1981): Hvy grains, River Plate-China; 55000-5%.Juli1525-FIO; 7000t5000t (Wilmar). 34.75$
Bulk spot contract between owner Habil Duckling and charterer Wilmar to ship55000± 5% tons heavy grain from River Plate (Argentina) to China at a rate of34.75$/ton. Loading starts between 15 and 25 July.
Albert Veenstra & Jan van Dalen (RSM) Price Indices for Ocean Charter Contracts Rotterdam, May 9, 2008 9 / 31
Fixtures and current market indices Current freight rate indices
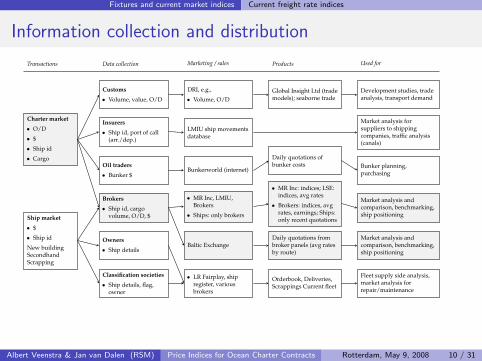
Information collection and distribution
Transactions Data collection Marketing / sales Products Used for
Charter market
• O/D
• $
• Ship id
• Cargo
Ship market
• $
• Ship id
New buildingSecondhandScrapping
Customs
• Volume, value, O/D
Insurers
• Ship id, port of call(arr./dep.)
Oil traders
• Bunker $
Brokers
• Ship id, cargovolume, O/D, $
Owners
• Ship details
Classification societies
• Ship details, flag,owner
DRI, e.g.,
• Volume, O/D
LMIU ship movementsdatabase
Bunkerworld (internet)
• MR Inc, LMIU,Brokers
• Ships: only brokers
Baltic Exchange
• LR Fairplay, shipregister, variousbrokers
Global Insight Ltd (trademodels); seaborne trade
Daily quotations ofbunker costs
• MR Inc: indices; LSE:indices, avg rates
• Brokers: indices, avgrates, earnings; Ships:only recent quotations
Daily quotations frombroker panels (avg ratesby route)
Orderbook, Deliveries,Scrappings Current fleet
Development studies, tradeanalysis, transport demand
Market analysis forsuppliers to shippingcompanies, traffic analysis(canals)
Bunker planning,purchasing
Market analysis andcomparison, benchmarking,ship positioning
Market analysis andcomparison, benchmarking,ship positioning
Fleet supply side analysis,market analysis forrepair/maintenance
Albert Veenstra & Jan van Dalen (RSM) Price Indices for Ocean Charter Contracts Rotterdam, May 9, 2008 10 / 31
Fixtures and current market indices Current freight rate indices
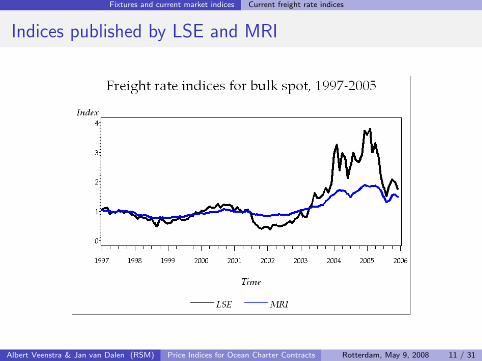
Indices published by LSE and MRI
Albert Veenstra & Jan van Dalen (RSM) Price Indices for Ocean Charter Contracts Rotterdam, May 9, 2008 11 / 31
Fixtures and current market indices Current freight rate indices
Brief evaluation
Much information collected and distributed in the marinetransportation industry
Many parties involved
Existing indices show considerable differences
Background existing indices roughly known (size weighted unit valueindices), but not in detail (e.g. information used)
Albert Veenstra & Jan van Dalen (RSM) Price Indices for Ocean Charter Contracts Rotterdam, May 9, 2008 12 / 31
Analysis Data issues
Data sources used
Fixture data from Maritime Research Inc (MRI). Contains informationabout contract prices for spot/time contracts, bulk carriers/tankers.Spot prices for bulk carriers are in $/ton, while time charter rates are$/day. Tanker rates are in worldscale.
Ship characteristics from LR Fairplay ship register. Containsinformation about various size measures, nationality of flag, countryand year of build and design speed and consumption for all ships inexistence in december 2005
MRI fixture prices are used by many economic researchers, thoughothers report the use of data supplied by Drewry ShippingConsultants, Clarkson Research Studies or LMIU
Merging the two databases leads to a huge loss of records, partlycaused by Fairplay’s policy to remove scrapped ships from theircurrent administration
Albert Veenstra & Jan van Dalen (RSM) Price Indices for Ocean Charter Contracts Rotterdam, May 9, 2008 13 / 31
Analysis Unit value indices
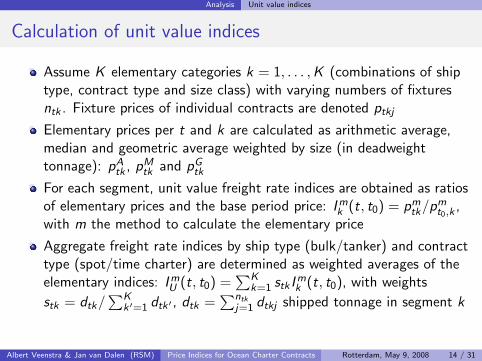
Calculation of unit value indices
Assume K elementary categories k = 1, . . . ,K (combinations of shiptype, contract type and size class) with varying numbers of fixturesntk . Fixture prices of individual contracts are denoted ptkj
Elementary prices per t and k are calculated as arithmetic average,median and geometric average weighted by size (in deadweighttonnage): pA
tk , pMtk and pG
tk
For each segment, unit value freight rate indices are obtained as ratiosof elementary prices and the base period price: Im
k (t, t0) = pmtk/p
mt0,k
,with m the method to calculate the elementary price
Aggregate freight rate indices by ship type (bulk/tanker) and contracttype (spot/time charter) are determined as weighted averages of theelementary indices: Im
U (t, t0) =∑K
k=1 stk Imk (t, t0), with weights
stk = dtk/∑K
k ′=1 dtk ′ , dtk =∑ntk
j=1 dtkj shipped tonnage in segment k
Albert Veenstra & Jan van Dalen (RSM) Price Indices for Ocean Charter Contracts Rotterdam, May 9, 2008 14 / 31
Analysis Unit value indices
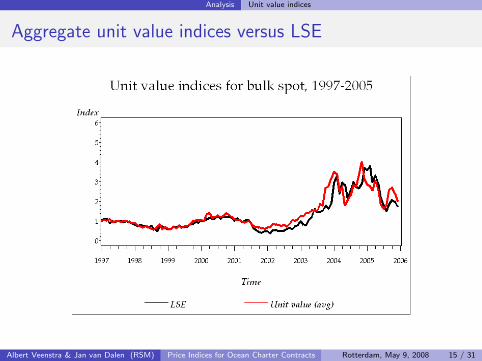
Aggregate unit value indices versus LSE
Albert Veenstra & Jan van Dalen (RSM) Price Indices for Ocean Charter Contracts Rotterdam, May 9, 2008 15 / 31
Analysis Unit value indices
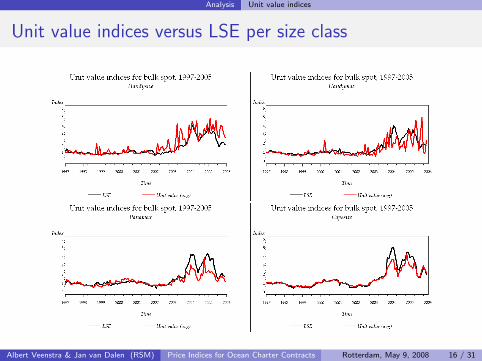
Unit value indices versus LSE per size class
Albert Veenstra & Jan van Dalen (RSM) Price Indices for Ocean Charter Contracts Rotterdam, May 9, 2008 16 / 31
Analysis Unit value indices
Results unit value indices
Overall tendency of the freight rate developments equally reflected byexisting LSE indices and calculated unit value indices
Aggregate unit value index systematically above (2002-2004) andbelow (2005) the aggregate LSE index
Unit value indices for Handysize and Handymax size classes showmuch more volatility than the corresponding LSE indices
Unit value indices for the larger Panamax and Capesize classes aresystematically below the corresponding LSE indices since about 2004
Albert Veenstra & Jan van Dalen (RSM) Price Indices for Ocean Charter Contracts Rotterdam, May 9, 2008 17 / 31
Analysis Matched model indices
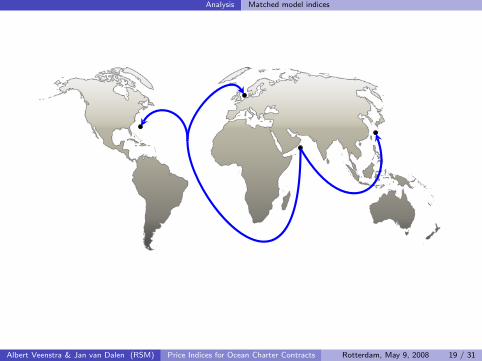
Matched model indices
Unit value indices do not cope with period-to-period variations in thequality mix
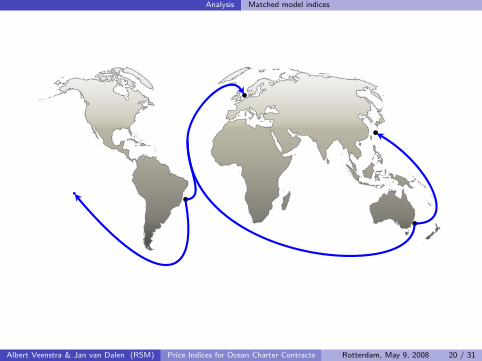
Matched model indices may be preferable, but matching on ship maynot be sensible
Instead matching by route may be an option
Albert Veenstra & Jan van Dalen (RSM) Price Indices for Ocean Charter Contracts Rotterdam, May 9, 2008 18 / 31
Analysis Matched model indices
Albert Veenstra & Jan van Dalen (RSM) Price Indices for Ocean Charter Contracts Rotterdam, May 9, 2008 19 / 31
Analysis Matched model indices
Albert Veenstra & Jan van Dalen (RSM) Price Indices for Ocean Charter Contracts Rotterdam, May 9, 2008 20 / 31
Analysis Matched model indices
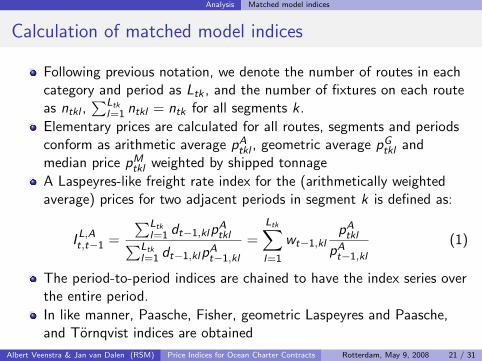
Calculation of matched model indices
Following previous notation, we denote the number of routes in eachcategory and period as Ltk , and the number of fixtures on each routeas ntkl ,
∑Ltkl=1 ntkl = ntk for all segments k .
Elementary prices are calculated for all routes, segments and periodsconform as arithmetic average pA
tkl , geometric average pGtkl and
median price pMtkl weighted by shipped tonnage
A Laspeyres-like freight rate index for the (arithmetically weightedaverage) prices for two adjacent periods in segment k is defined as:
I L,At,t−1 =
∑Ltkl=1 dt−1,klp
Atkl∑Ltk
l=1 dt−1,klpAt−1,kl
=
Ltk∑l=1
wt−1,klpAtkl
pAt−1,kl
(1)
The period-to-period indices are chained to have the index series overthe entire period.
In like manner, Paasche, Fisher, geometric Laspeyres and Paasche,and Tornqvist indices are obtained
Albert Veenstra & Jan van Dalen (RSM) Price Indices for Ocean Charter Contracts Rotterdam, May 9, 2008 21 / 31
Analysis Matched model indices
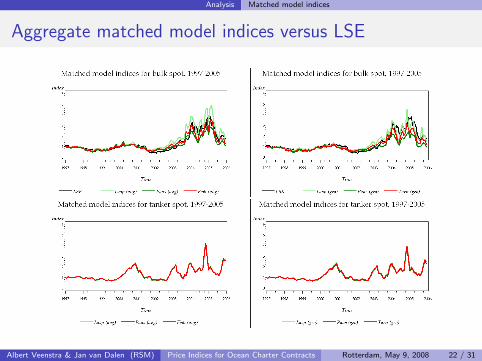
Aggregate matched model indices versus LSE
Albert Veenstra & Jan van Dalen (RSM) Price Indices for Ocean Charter Contracts Rotterdam, May 9, 2008 22 / 31
Analysis Matched model indices
Results matched model indices
Overall tendency of the freight rate developments equally reflected byexisting LSE indices, unit value and matched model indices
Similar to unit value indices, the aggregate matched model Fisherindex tends to be systematically above (2002-2004) and below(2004-) the aggregate LSE index. Huge differences can be observedbetween the Laspeyres and Paasche indices
The geometric Laspeyres, Paasche and Tornqvist indices show lessvolatility, but their negative difference with the LSE index since 2004is larger than that of the unit value indices
For tanker spot prices, the differences between the various indices aremarginal
Albert Veenstra & Jan van Dalen (RSM) Price Indices for Ocean Charter Contracts Rotterdam, May 9, 2008 23 / 31
Analysis Hedonic indices
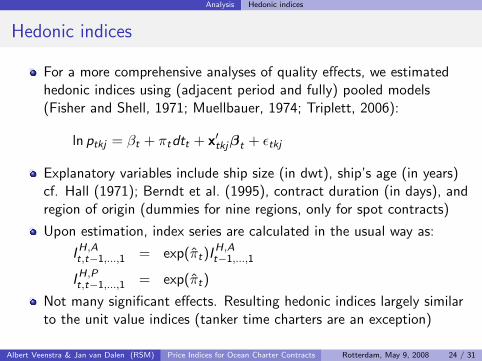
Hedonic indices
For a more comprehensive analyses of quality effects, we estimatedhedonic indices using (adjacent period and fully) pooled models(Fisher and Shell, 1971; Muellbauer, 1974; Triplett, 2006):
ln ptkj = βt + πtdtt + x′tkjβt + εtkj
Explanatory variables include ship size (in dwt), ship’s age (in years)cf. Hall (1971); Berndt et al. (1995), contract duration (in days), andregion of origin (dummies for nine regions, only for spot contracts)
Upon estimation, index series are calculated in the usual way as:
IH,At,t−1,...,1 = exp(πt)IH,A
t−1,...,1
IH,Pt,t−1,...,1 = exp(πt)
Not many significant effects. Resulting hedonic indices largely similarto the unit value indices (tanker time charters are an exception)
Albert Veenstra & Jan van Dalen (RSM) Price Indices for Ocean Charter Contracts Rotterdam, May 9, 2008 24 / 31
Analysis Duration indices
Unit value indices incorporating fixture duration
Typically, commodity prices refer to transactions at a point in time,while fixture prices quoted in $/ton or $/day, reflect the idea of rentalprices or user costs over a period of time
Duration is an important feature of the transportation services agreedupon in the contract
In the case of time charters, duration is an attribute of the fixture. Inthe case of spot contracts, duration can be estimated based on on/offdates of the contract, or route in combination with distance andspeed information
Including contract duration has two effects: (i) longer contractsreceive more weight, (ii) contracts may extend into next period
’Duration’ indices are obtained as unit value indices using the priceinformation for every day of the contract period
Albert Veenstra & Jan van Dalen (RSM) Price Indices for Ocean Charter Contracts Rotterdam, May 9, 2008 25 / 31
Analysis Duration indices
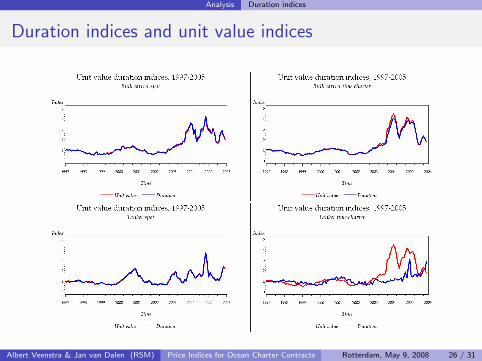
Duration indices and unit value indices
Albert Veenstra & Jan van Dalen (RSM) Price Indices for Ocean Charter Contracts Rotterdam, May 9, 2008 26 / 31
Analysis Duration indices
Results duration indices
The unit value indices and duration indices are very similar in the caseof spot contracts (both bulk carriers and time charters)
’Slight’ differences are observed for bulk carrier time charters (theaverage absolute difference between the bulk spot series is still 0.13 or9.6% of the unit value index)
Huge differences are observed for tanker time charters, particularlyafter 2003 when the duration index is much lower than the unit valueindex
The latter difference is due to the longer term contracts in tankertrade, and partly to the a substantial number of short term(’lightering’) tanker contracts that receive much less weight in theduration index
The important role of duration argues against the combination ofspot and time charters in a single index (as some of the BalticExchange and SSY capesize indices seem to do)
Albert Veenstra & Jan van Dalen (RSM) Price Indices for Ocean Charter Contracts Rotterdam, May 9, 2008 27 / 31
Concluding remarks
Concluding remarks
Method matters: different index measures (unit value, matchedmodel, hedonic, duration) yield different results
Information matters: choices as to which fixtures (routes, contracts,etc) greatly influence outcomes
Differences between index results tend to be larger at times when thenumber of fixtures is limited
Industry indices are often based on thin data sets, especially whenissued at a monthly or even weekly basis. Expert judgement may thushave a much larger effect on index measurement and subsequentdecision making than currently realized by the industry
The findings for the duration indices question the validity of existingindices using time charter information. This have consequences forrecent studies of the time charter structure
The uniqueness of fixtures opposes the idea that observed freightrates evolve steadily within periods
Albert Veenstra & Jan van Dalen (RSM) Price Indices for Ocean Charter Contracts Rotterdam, May 9, 2008 28 / 31
Concluding remarks
Suggestions and further research
More transparency needed about index construction methods andrelevant choices as to information used
More theoretically, the issue of substitution between spot and timecharter contracts deserves attention
Consequences of using different indices for the findings of relatedstudies in this field could be evaluated
Specific issues related with Isserlis’ index (based on the mid-range)need to be explored
Albert Veenstra & Jan van Dalen (RSM) Price Indices for Ocean Charter Contracts Rotterdam, May 9, 2008 29 / 31
Bibliography
References I
Berndt, E.R., Z. Griliches, N.J. Rappaport. 1995. Econometric estimates of price indexesfor personal computers in the 1990’s. Journal of Econometrics 68(1) 243–268.
Feenstra, R.C., M.D. Shapiro. 2003. Scanner Data and Price Indexes. University ofChicago Press.
Diewert, E., J. Greenlees, C. Hulten. 2007. Price Index Concepts and Measurement:Introduction: What are the Issues? Discussion paper, University of British Columbia,Vancouver, Canada.
Fisher, F.M., K. Shell. 1971. Taste and quality change in the pure theory of the cost ofliving index. Z. Griliches, ed., Price indices and quality change: Studies in newmethods of measurement. Harvard University Press, Cambridge, MA, 16–54.
Hall, R.E. 1971. The Measurement of Quality Change from Vintage Price Data.Z. Griliches, ed., Price Indexes and Quality Change: Studies in New Methods ofMeasurement. Harvard University Press, Cambridge, MA, 240–271.
Harley, C.K. 1988. Ocean freight rates and productivity, 1740-1913: The primacy ofmechanical invention reaffirmed. Journal of Economic History 48(4) 851–876.
Albert Veenstra & Jan van Dalen (RSM) Price Indices for Ocean Charter Contracts Rotterdam, May 9, 2008 30 / 31
Bibliography
References II
Harley, C.K. 1989. Coal exports and british shipping. Explorations in Economic History26 311–338.
Isserlis, L. 1938. Tramp shipping cargoes, and freights. Journal of the Royal StatisticalSociety 101 53–146.
Muellbauer, J. 1974. Household Production Theory, Quality, and the” HedonicTechnique”. The American Economic Review 64(6) 977–994.
North, D.C. 1958. Ocean freight rates and economic development 1750-1913. Journal ofEconomic History 18(4) 537–555.
North, D.C. 1960. The united states balance of payments 1790-1860. Tech. rep.,NBER. Report on the 24th conference on income and wealth.
Shah Mohammed, S.I., J.G. Williamson. 2003. Freight rates and productivity gains inbritish tramp shipping 1869-1950. Tech. Rep. Working paper 9531, National Bureauof Economic Research.
Triplett, J.E. 2006. Handbook on Hedonic Indexes and Quality Adjustments in PriceIndexes: Special Application to Information Technology Products. OECD OnlineBookshop.
Yasuba, Y. 1978. Freight rates and productivity in ocean transportation in japan.Explorations in Economic History 15 11–39.
Albert Veenstra & Jan van Dalen (RSM) Price Indices for Ocean Charter Contracts Rotterdam, May 9, 2008 31 / 31