Embed Size (px)
Citation preview
Price convergence in the EMU?Evidence from micro data
Christoph Fischer
Discussion PaperSeries 1: Economic StudiesNo 06/2009Discussion Papers represent the authors’ personal opinions and do not necessarily reflect the views of theDeutsche Bundesbank or its staff.
Editorial Board: Heinz Herrmann Thilo Liebig Karl-Heinz Tödter Deutsche Bundesbank, Wilhelm-Epstein-Strasse 14, 60431 Frankfurt am Main, Postfach 10 06 02, 60006 Frankfurt am Main Tel +49 69 9566-0 Telex within Germany 41227, telex from abroad 414431 Please address all orders in writing to: Deutsche Bundesbank, Press and Public Relations Division, at the above address or via fax +49 69 9566-3077
Internet http://www.bundesbank.de
Reproduction permitted only if source is stated.
ISBN 978-3–86558–506–6 (Printversion) ISBN 978-3–86558–507–3 (Internetversion)
Abstract:
The establishment of European monetary union (EMU) was widely expected to cause price convergence among member states. In an investigation of this claim, the present study avoids problems of comparability and representativeness by using an extremely detailed and comprehensive scanner database on washing machine prices and sales volumes for 17 European countries. A hedonic regression yields country-specific time series for quality-adjusted price differentials. Statistically and economically significant deviations from the LOP emerge. Log t tests firmly reject price convergence among EMU countries. Small convergence clusters can be identified but they are unrelated to EMU membership.
Keywords: price convergence, LOP, euro introduction, log t test, hedonic price regression, scanner data
JEL-Classification: F36, F31, E31, L68, C23
Non technical summary
The introduction of the euro was widely expected to cause product prices in the
emerging monetary union to converge to a low level by raising transparency and cutting
transaction costs. Available empirical studies on this issue have yielded contradictory
results. They have been subject to some specific problems, however. First, the earlier
papers, in particular, covered only a very short period after the establishment of
European Monetary Union (EMU), thus rendering statements on the effect of euro
introduction rather uncertain. Second, the reliability of the international price
comparisons has been constrained by the limited comparability of the chosen goods and
by the relatively small number of prices sampled. Finally, the statistical methods for the
measurement of convergence may not have been entirely appropriate.
The present study addresses each of these shortcomings. It is based on an
extremely detailed and comprehensive scanner database on actually paid washing
machine prices and sales volumes for 17 European countries covering the period from
1995 to 2005. Thus, it includes a comparatively long period in which the price
adjustment could have occurred. A hedonic regression yields time series of quality-
adjusted relative prices for EMU and non-EMU countries. By this means, problems of
limited international comparability of prices are avoided. Finally, a test of convergence
recently developed by Phillips and Sul (2007) is used which overcomes some of the
problems associated with more traditional measures of convergence.
The results of the study confirm earlier findings of statistically and economically
significant deviations from the Law of One Price. It is also shown that quality-adjusted
washing machine prices did not exhibit any tendency to converge across EMU
members; if anything, a tendency for divergence appears to be prevalent. Moreover, a
convergence cluster analysis cannot identify any convergence club which comprises a
larger subgroup of EMU countries and, at the same time, excludes the non-EMU
countries in the sample. Instead, the clusters that have been found are mostly rather
small and are usually unrelated to EMU membership suggesting that forces other than
the euro have promoted price convergence.
This implies that neither the introduction of the euro at the start of 1999 nor the
euro cash changeover three years later have had a noticeable price convergence impact.
More detailed conclusions should only be drawn with caution. It is unclear whether the
results for washing machines can be generalised. It should also be kept in mind that the
convergence process may take even more time meaning that the results may still need to
be considered as being preliminary. Finally, it cannot be ruled out that, as long as a
deeper understanding of the ultimate determinants of price convergence or divergence is
lacking, the convergence impact of monetary union is swamped by other factors.
Nicht technische Zusammenfassung
Vielfach ist erwartet worden, dass die Euro-Einführung zu einer Konvergenz der Preise
identischer Güter innerhalb des entstehenden gemeinsamen Währungsraums führen
würde. Begründet wurde diese Auffassung mit steigender Preistransparenz und der
Verringerung von Transaktionskosten. Bisherige empirische Untersuchungen dieser
Hypothese kommen zu keinem einheitlichen Ergebnis. Diese Arbeiten waren allerdings
auch mit einer Reihe von Problemen konfrontiert, die bisher nur zum Teil gelöst worden
sind. Zum einen war insbesondere in den frühen Untersuchungen der Zeitraum seit
Beginn der Europäischen Währungsunion (EWU) noch sehr kurz, so dass eine Aussage
über den Einfluss der gemeinsamen Währung nur bedingt möglich war. Zweitens
krankten die internationalen Preisvergleiche daran, dass sie sich in der Regel auf nur
eingeschränkt vergleichbare Güterbündel oder auf eher stichprobenartige Erfassungen
von Preisen stützen mussten. Schliesslich sind oftmals statistische Konzepte zur
Messung der Konvergenz verwendet worden, die nur teilweise befriedigen.
Die vorliegende Untersuchung stellt hinsichtlich jedem dieser Aspekte eine deutliche
Verbesserung dar. Sie verwendet einen ausgesprochen detaillierten und umfassenden
Scanner-basierten Datensatz über tatsächlich gezahlte Waschmaschinenpreise und
zugehörige Verkaufsmengen in 17 europäischen Ländern von 1995 bis 2005. Zum
ersten ist damit ein vergleichsweise langer Zeitraum für die Identifikation der
erwarteten Preisanpassung enthalten. Zum zweiten erlaubt eine hedonische Regression
die Berechnung von Zeitreihen qualitätsbereinigter Relativpreise für Länder innerhalb
und außerhalb der Währungsunion. Auf diese Weise vermeidet die Studie Probleme
mangelnder internationaler Vergleichbarkeit der Preise. Zum dritten schließlich
verwendet das Papier einen Test auf Konvergenz, der kürzlich von Phillips und Sul
(2007) entwickelt worden ist und der einige Unzulänglichkeiten traditioneller
Konvergenzmaße überwindet.
Die Untersuchung stellt zunächst statistisch und ökonomisch signifikante
Abweichungen vom Gesetz der Unterschiedslosigkeit der Preise fest und bestätigt auf
diese Weise frühere Resultate aus der Literatur. Sie zeigt zudem, dass sich
qualitätsbereinigte Waschmaschinenpreise in der Währungsunion keineswegs
länderübergreifend aneinander angenähert haben, eher ist das Gegenteil der Fall.
Darüber hinaus kann auch nicht festgestellt werden, dass eine größere Teilmenge von
Ländern der Währungsunion einen EWU-spezifischen „Konvergenzclub“ gebildet hätte.
Die tatsächlich gefundenen „Konvergenzclubs“ sind vielmehr klein und nicht auf EWU-
Mitglieder beschränkt, so dass man vermuten kann, dass andere Einflüsse als die
gemeinsame Währung die Annäherung gefördert haben.
Diesen Ergebnissen zufolge hatte also weder die eigentliche Euro-Einführung zu Beginn
des Jahres 1999 noch die Euro-Bargeldeinführung drei Jahre später einen
wahrnehmbaren, die Preiskonvergenz identischer Güter stimulierenden Effekt.
Weitergehende Schlussfolgerungen sollten aber nur mit Vorsicht gezogen werden.
Unklar ist zunächst, inwieweit die Ergebnisse für Waschmaschinen verallgemeinert
werden können. Zweitens ist das Ergebnis insofern vorläufig, als der
Konvergenzprozess möglicherweise noch mehr Zeit benötigt. Solange die Triebkräfte
von Konvergenz und Divergenz nicht besser erklärt werden können, ist schließlich nicht
ausgeschlossen, dass unser Befund auf eine Überlagerung der Konvergenzkräfte der
Währungsunion durch andere Faktoren zurückgeht.

Contents
1 Introduction 1
2 Previous studies on deviations from the Law of One Price and price
convergence in the EMU
3
3 Conceptual framework 4
4 Data and the hedonic price regression 6
4.1 The adequacy of focusing on the washing machine market 6
4.2 The data 7
4.3 A hedonic price regression 10
5 Deviations from the Law of One Price 12
6 Evidence of price convergence? 14
6.1 The log t test 14
6.2 Alternative approaches 17
7 Conclusions 19
Appendix 29
References 35

Lists of Tables and Figures
Table 1 Weighted hedonic regression of net log washing machine
prices
21
Table 2 Phillips/Sul (2007) test on subgroup price convergence 23
Table 3 MHDF and PCSE panel unit root tests 24
Table 4 Standard F test on the equality of variances 25
Table A1 The washing machine micro database, sample 1 29
Table A2 The washing machine micro database, sample 2 30
Table A3 Test on positive correlation between washing machine
related prices from the micro database and from Eurostat
32
Table A4 Phillips/Sul (2007) test on subgroup price convergence:
identification of clusters
33
Figure 1 Net washing machine prices in D-Mark 26
Figure 2 Quality-adjusted net price deviations of washing
machines; sample 1
27
Figure 3 Quality-adjusted net price deviations of washing
machines; sample 2
28

1
Price Convergence in the EMU?
Evidence from Micro Data1
1 Introduction
One of the benefits which had been expected from the foundation of the European
Monetary Union (EMU) was a reduction of product price differences between member
countries. Within the EMU, the abandonment of national currencies should have raised
transparency and eliminated all the costs associated with the exchange of currencies
thus cutting transaction costs and narrowing the scope for deviations from the Law of
One Price (LOP).
The difficulties of international price comparisons are well known. Most recent
studies of price convergence in Europe use relative price level data for many categories
of goods and services which are based on price collections of one or a few exemplary
variants of the product category in a few outlets in a few cities. However, one may
question the accuracy of such relative price levels in terms of representativeness for the
product category and for the country in question as well as in terms of homogeneity and
thus comparability of the items considered.2 The uncertainty around such figures is
reflected in substantial revisions of economy-wide aggregated relative price levels.3 A
1 The paper represents the author’s personal opinions and does not necessarily reflect the views of the
Deutsche Bundesbank. I would like to thank Jörg Breitung, Mario Crucini, Ulrich Grosch, Heinz Herrmann, Joachim Keller, Axel Weber and Alexander Wolman for valuable suggestions and comments. I am especially grateful to Torsten Meyer of GfK Retail and Technology who once and again gave invaluable advice concerning the data, Sebastian Kohler who helped in data processing, and Eurostat staff, especially Konstantinos Panagopoulos, for the provision of Eurostat data and the permission to use them for publication. All remaining errors are my own.
2 A comparison between official data published by Eurostat and the washing machine micro data used here is presented in appendix 2. The results may be interpreted as indicating a limited representativeness of official data.
3 As an extreme example, China’s PPP-based GDP has recently been revised downwards by about 40 percent because its aggregate relative price level had been revised upwards correspondingly; cf IMF (2008). Among European countries, Germany’s aggregate relative price level for 2005 as recorded in the European Commission’s “Annual macro-economic database” has been revised downwards by 4%, Luxembourg’s by 8% and Norway’s by 11% in 2007. Since the aggregate is computed from disaggregated relative prices for given products, some of which are revised upwards while others may have been revised downwards, the average absolute revision for a single product may be much larger than the figures given here.
2
biasedly measured price level, however, may make the difference between convergence
or divergence.
The present study avoids these problems by using an extremely rich database for
the European washing machine market. It contains prices, quantities sold as well as a
large number of characteristic features of each washing machine model purchased in
each of 17 larger EMU and non-EMU countries. The comprehensive coverage of the
markets guarantees representativeness, the wealth of model characteristics makes it
possible to establish homogeneity and comparability. Since the data is based in large
part on scanner recording of transactions, actually paid prices inclusive of all discounts
instead of list prices are recorded. All this contributes to an especially high reliability of
the international price comparisons in this study.4
Admittedly, the selection of a specific product market precludes outright
conclusions concerning entire economies. Washing machines, however, are especially
suitable for an analysis of international price convergence since they are highly tradable
and highly traded, they are non-perishable and each model belongs to a brand which
facilitates international comparisons. If anywhere, a reduction in transaction costs
caused by the introduction of the euro should be detectable in such a market (see also
Allington et al, 2005).
In contrast to many earlier studies, the washing machine database covers a
significant post-EMU period. This may be beneficial if the expected effects of the
introduction of the euro take some time to materialise, as it is discussed in Engel/Rogers
(2004). The finding of Parsley/Wei (2001) that price differentials are particularly small
in those currency unions which have existed for a long time, as for instance in the
Belgium-Luxembourg one, supports such a hypothesis.
Apart from the exceptionally high reliability of price comparisons and the long
post-EMU data span, the present study’s contribution to the literature includes the
application of a newly developed convergence test, Phillips/Sul’s (2007) “log t” test,
4 Goldberg/Verboven (2004, 2005) investigate price convergence issues on the European car market using
a database of similarly extensive coverage and richness. The high degree of segmentation along borders through selective and exclusive distribution channels as well as national systems of type approval and registration, however, make the European car market rather peculiar and possibly much less susceptible to the effects of the introduction of the euro. Moreover, they use list prices and the post-EMU period covered in their studies is short.

3
which overcomes some problems of more traditional measures of convergence and
enables the identification of convergence clusters.
Turning to the results, we first confirm earlier findings of still statistically and
economically significant deviations from the LOP in EMU by estimating a hedonic
regression. Second, we are unable to provide any evidence in favour of price
convergence across euro area countries. If anything, price dispersion has risen since the
turn of the millennium. The log t convergence test suggests the existence of some
smaller convergence clubs in Europe but their membership pattern is unrelated to
participation in EMU.
Section 2 gives a short literature overview. In section 3, a conceptual framework
is presented which guides the empirical analysis afterwards. Section 4 gives an
overview of the data and includes the results of the hedonic regression. Section 5
presents some insights into the validity of the LOP in Europe and section 6 introduces
the convergence test methods and results. Section 7 concludes.
2 Previous studies on deviations from the Law of One Price and price convergence in the EMU
First empirical investigations on price convergence effects of EMU were
performed soon after its inception.5 The evidence so far is mixed, however. Early
studies such as those of Lutz (2004) and Engel/Rogers (2004) were unable to find any
evidence of price convergence that could be ascribed to the foundation of EMU. Some
of the more recent studies, for instance Cuaresma et al (2007), who focus explicitly on
the euro cash changeover, and Rogers (2007), yield similar results. Goldberg/Verboven
(2004) who concentrate on the European car market come to slightly different
5 For such an analysis, a point in time needs to be determined where the introduction of the euro
could possibly have started to trigger price convergence. Generally, the process of the establishment of EMU brought about two alternative times which may have been relevant in this respect. The first is the actual introduction of the euro on 1 January 1999. As of this date, the exchange rate between national currencies within the EMU were irrevocably fixed and the newly established Eurosystem was responsible for performing a common monetary policy. Coins and notes, however, continued to exist exclusively as national currencies, although they were manifestations of the common currency, the euro, just expressed in different units of account. At the start of 2002, euro coins and notes finally replaced national currencies. It has been claimed that both these events have reduced transaction costs and thus have contributed to price level convergence, the establishment of EMU by eliminating costs of exchange, the cash changeover by increasing price transparency.
4
conclusions: car price differentials fell significantly after 1999. Since 2002, however,
price differentials in a non-EMU control group decreased even faster. Fischer (2007)
reports slight indications of price level convergence which arise, however, only after
2002. The study of Allington et al (2005) is clearly the most positive one: They report
significant evidence in favour of a reduction of price dispersion caused by the
establishment of EMU.
The difficulties in proving unambiguously that EMU caused a reduction in price
dispersion or that there is evidence of price convergence in the EMU at all stand in stark
contrast to the highly uncontroversial finding that, before EMU, European prices
converged considerably: Engel/Rogers (2004), Faber/Stokman (2005), Fischer (2007),
Goldberg/Verboven (2005), Hill (2004), Rogers (2007) and Wolszczak-Derlacz (2006)
are relevant examples, most of which suggest an especially pronounced advance in price
convergence in the early nineties.
These results naturally give rise to the question whether there has been scope
enough for EMU to reduce price dispersion further. Engel/Rogers (2004), for instance,
put forward that their negative result concerning an EMU-related price convergence
effect may be due to the highly effective market integration efforts in the European
Union in pre-EMU times which resulted in low price dispersion in the late nineties. By
contrast, studies such as Asplund/Friberg (2001), Haskel/Wolf (2001) or Mathä (2006)
use micro data to show that even in the late nineties, considerable deviations from the
LOP continued to exist in Europe. Rogers (2007), however, points out that, since the
late nineties, price dispersion in the common currency countries has been close to that
of the USA. He also notes, however, that distances between agglomerations are much
larger in the USA, which would usually indicate a higher degree of price dispersion.
Interestingly, Crucini et al (2001) and Mathä (2006) find that deviations from the LOP
are much smaller between Belgium and Luxembourg, two small countries who formed a
de facto monetary union in 1922, than between Belgium and other EMU members.
3 Conceptual framework
The expectation of price convergence caused by the establishment of monetary
union is expressed vividly in a comment from the European Central Bank (ECB) on the
5
euro cash changeover of January 2002: “... the introduction of the euro banknotes and
coins further reduces transaction costs and increases price transparency across borders.
In turn, this should increase the strength of competition and, over time, reduce price
level dispersion in the euro area” (ECB, 2002, p 39). Similar statements have been made
by the European Commission (1990, p 19, 1996, p 74, or 2008, pp 34-35) concerning
the introduction of the euro in January 1999.
A conceptual framework related to that of Engel/Rogers (1996, 2004) or Crucini
et al (2005) illustrates what the EMU founders may have had in mind. Consider a final
good that is produced as a combination of traded and non-traded inputs and is sold in
countries i and j. For internationally traded goods, for example for washing machines,
the non-traded component in the destination country will consist mainly in distribution
inputs. Using a Cobb-Douglas technology, the price of the good in country i is
determined by
γγ −= 1iiii QWAP (1)
where Qi is the price of the traded and Wi that of the non-traded input (in the case
considered here the washing machine as it arrives at the distributor and the distribution
costs, respectively), and γ is the share of the non-traded input which is assumed to be
the same across countries but not across goods. With perfect competition in the
distribution sector, Ai is inversely related to total factor productivity of this sector; if
distributors are monopolists instead, Ai additionally includes a mark-up. For the traded
input, arbitrage ensures that the deviations from the law of one price (LOP) between
countries i and j are bounded by trade costs,6
ijj
i
ij QQ τ
τ≤≤1 (2)
where Qj denotes the traded input price in country j expressed in the currency of
country i, and τij – 1 the ad valorem tax equivalent of broadly defined trade costs on
6 See eg Engel/Rogers (1996). Anderson/van Wincoop (2004) show that arbitrage limits Qi/Qj to an even
narrower interval than that given in equation (2). This, however, requires further knowledge about the production locations and the direction of trade of the good considered.
6
shipments between countries i and j. If trade costs are equivalent to a 30 % tax on
prices, for instance, Qi will fall in the interval [0.77Qj; 1.3Qj].
It was expected that both the introduction of the euro and the euro cash
changeover would lower trade costs τij by reducing information costs through enhanced
price transparency and by lowering costs associated with the exchange of currencies
including the abolition of exchange rate risk, such that 1 ≤ τij,post < τij,pre where pre (post)
refers to the time before (after) the monetary integration step considered has been
realised. To the extent that the relative input price Qi/Qj fell in one of the intervals
]τij,post; τij,pre] or [1/τij,pre; 1/τij,post[, it would adjust to the new narrower price interval.
This would ceteris paribus entail a corresponding adjustment of the relative final good’s
price Pi/Pj and finally, in the aggregate, result in a decreased price level dispersion in
the EMU.
4 Data and the hedonic price regression
4.1 The adequacy of focusing on the washing machine market
For the purpose of identifying a reduction in price dispersion due to the
introduction of the euro, the focus on the washing machine market may be especially
suitable. First, washing-machines are highly tradable and highly traded, which implies
that 1-γ should be relatively large. Therefore, the expected changes in Qi/Qj due to EMU
should be rather less vulnerable to being masked by developments in the distribution
sector in their effects on Pi/Pj. It cannot be ruled out, of course, that some developments
specific to the washing machine market concerning for instance the distributors prevent
the effect from being detectable; however, we do not see any reason why the washing
machine market should differ in such a way from other highly traded goods.
Second, washing machines belong to brands which, in most cases, are well-known
internationally, and each model is identified by a specific model name and a
corresponding set of physical characteristics. This ensures a very high degree of
homogeneity across countries7 and facilitates international comparability and – if
7 In fact, if a specific model is listed for several countries with an identical combination of physical
characteristics, it is the identical model. There will be cases, however, in which an identical model is given a different model name in different countries.
7
necessary – quality adjustment of the prices. Both reasons imply that restricting the
analysis to the washing machine market should raise the probability of detecting price
convergence as a consequence of the introduction of the euro. If the analysis does not
yield any evidence for the expected effect in the washing machine market, one could be
sceptical as to whether an aggregate effect can have occurred at all. The possibility of
potential market-specific developments should, however, be kept in mind.
4.2 The data The data used for the analysis covers nearly the entire washing machine market in
each of 17 European countries. The raw data was obtained from GfK Retail and
Technology, a market research bureau, which collects data from retailers, aggregates it
and sells it inter alia to producers, distributors, component suppliers and public
institutions. Technically, universe studies are performed on a regular basis while, in a
much higher frequency, data is collected for a sample which is stratified by distribution
channel. For each model, sales prices and volumes are surveyed in a given period.
Based on the results of the universe studies, these figures are projected separately for
each distribution channel onto the universe. The extrapolated data covers on average
90 % of all washing machine sales in the countries considered. Aggregation across
distribution channels yields the economy-wide number of sales and an average price for
each model on the market. Since around 90 % of the data is collected in the first place
as electronic (“scanner”) data, ie by enterprise resource planning systems, and the rest
by regular, manual store audits, it is ensured that prices are not list prices but instead
actually paid prices that take any discounts into account.
The data used for the analysis spans the three dimensions of washing machine
model, country and time. The observation period runs from 1995 to 2005. At its start,
data for 11 of the larger European countries are available: Austria, the Czech Republic,
France, Germany, Hungary, Italy, the Netherlands, Poland, the Slovak Republic, Spain,
and the United Kingdom. Later on, Belgium, Sweden, Portugal, Greece, Denmark, and
Finland were added. In the earlier part of the observation period, data is provided in a
frequency of three times per annum for some countries and every other month for
others. Later on, all the data is provided in a two-monthly frequency. Apart from prices
and quantities, each model is characterised by a number of physical features such as
8
spinning speed, load capacity etc. The structure of the data suggests combining it into
two alternative samples: Sample 1 covers the complete observation period as far as it is
available for each of the 17 countries. Each model is characterised by five physical
features. Price and quantity data is considered in a frequency of three times a year.
Sample 2 starts in 2000, contains 21 characteristics per model, and prices and quantities
in a two-monthly frequency.8 It is useful to consider both samples because the first spans
a longer observation period while the second, being more detailed in terms of frequency
and model characteristics, may provide an even more accurate picture.
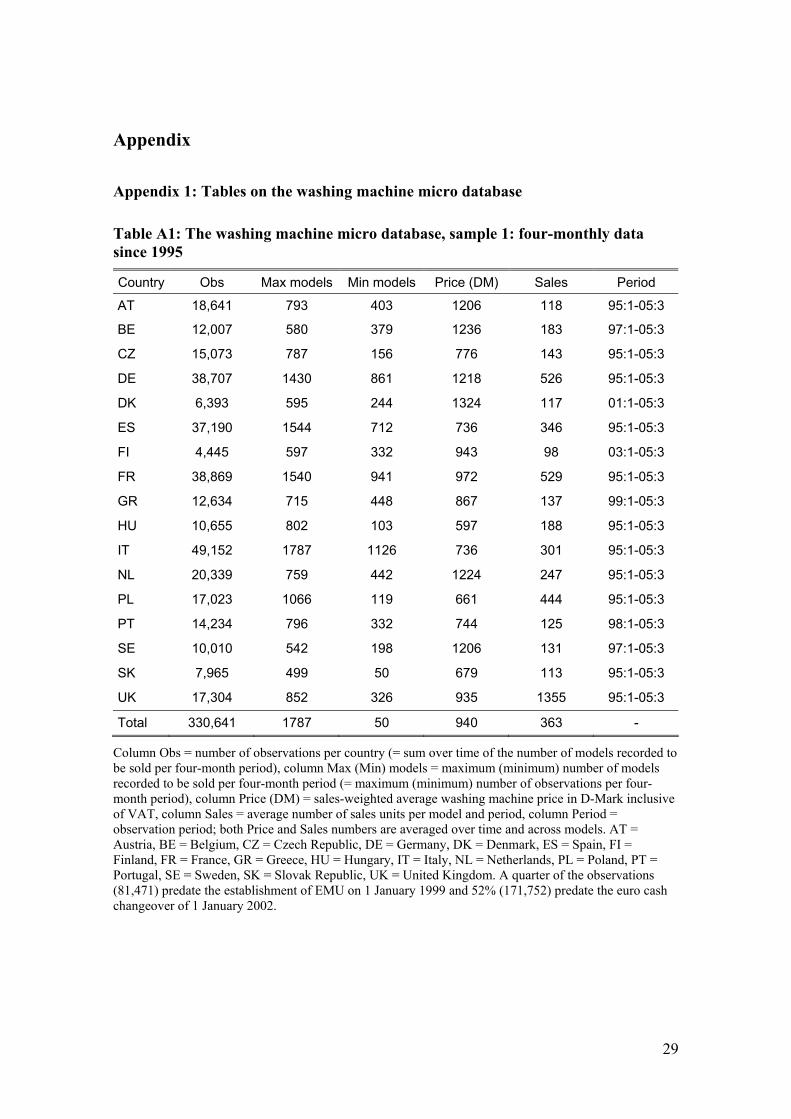
Tables A1 and A2 in appendix 1 illustrate the richness of the data: the number of
models sold in a four-month period9 ranges from 50 in the Slovak Republic to 1787 in
Italy. Model variety has increased especially steeply in the non-EMU central European
countries. In a cross-country comparison it is not surprising that model variety tends to
rise with the size of the market. As a deviation from this rule, however, the model
variety is continually highest in Italy although this country is not the largest washing
machine market in Europe. The high model variety may be related to the abundance of
independent small-scale distributors in Italy. This is also reflected in the average
quantity of units sold per model in a four-month period. This figure generally increases
with country size as well but, for Italy (301), it ranges even lower than for Poland (444)
or Spain (346). Interestingly, the UK (1355) is the country for which by far the highest
average quantity of a given model is sold. This may be an implication of the abundance
of mail order business in the UK and the high concentration in the distribution sector.
Not surprisingly, large standard deviations (not shown in the table) illustrate the
considerable differences in market success of different models.
The reported washing machine prices, PV,it, are inclusive of VAT where i denotes
country and t is time. However, international trade of firms is generally subject to the
destination principle. Therefore, prices net of VAT, Pit, should be more relevant for
international price comparisons within the EU. Washing machine prices have thus been
8 Apart from the increase in coverage over time in terms of countries, frequency, and the number of
physical features for the characterisation of a model, the separate analysis of a shorter sample is suggested by the fact that data pertaining to the period before the turn of the millennium has been provided in a separate database that had first to be matched with the database containing the more recent data.
9 The figures in this paragraph refer to table A1 which describes sample 1. As can be seen from table A2, however, sample 2 gives rise to the same observations.

9
corrected for VAT. Percentage VAT rates, Vit, for each of the countries in the sample
over the whole observation period have been obtained from the European Commission
(2006) and have been deducted as Pit = PV,it/(1+Vit/100). All results presented refer to
net prices; some calculations, however, have additionally been performed using prices
inclusive of VAT, in particular the hedonic price regression and the log t price
convergence tests. Differences in the results have been small.
Figure 1 shows average net washing machine prices from sample 1 over time.
Figure 1a covers EMU countries, figure 1b non-EMU countries. Prices are expressed in
D-Mark because the euro did not yet exist in the first years of the observation period. In
the calculation of the average, the price of a model is weighted by the quantity sold.
Inside the EMU, net prices are highest in Germany, Austria, the Netherlands and
Belgium and lowest in Portugal, Italy and Spain. At the turn of the millennium, an
apparent conspicuous fall in German and Austrian prices stands out. This is due to the
fact that washing machines sold in mail order business in these countries are fully
covered only from the start of 2000 onwards. Among non-EMU countries, Denmark
reports the highest prices and Hungary the lowest.
Since a slight trend towards a decrease in prices appears to be more pronounced in
high-price countries than in low-price countries, visual inspection may suggest a small
decrease in price dispersion. However, price differences across countries as well as
price movements may simply be governed by quality. The low prices in recent EU
accession countries, for instance, could be due to their relatively low income in the
sense that it may result in a preference for washing machines of a comparatively low
quality. By the same token, the visual impression of price convergence may result from
the more than proportional increase in income in these countries leading to an especially
fast upgrade in the quality of washing machines sold there.
10
4.3 A hedonic price regression In order to adjust prices for quality, a hedonic price regression has been
estimated.10 Similar to Goldberg/Verboven (2005), a semi-logarithmic functional form
has been chosen:11
iktitfkiktP εππωππ ω +++′+= 0ln (3)
where Pikt denotes the price of washing machine model k in country i at time t net
of VAT, ω’k = (ωk1 ωk2 ... ωkm(ω)) is a vector of m(ω) physical characteristics of model k
and π’ω = (πω1 πω2 ... πωm(ω)) a vector of corresponding coefficients, πf is the coefficient
on a firm dummy which takes on a value of 1 for all models that are produced by the
producer of model k and is 0 elsewhere, πit is the coefficient on a country-time dummy
and εikt is an iid error term.
The vector of characteristics is designed to capture observable differences
between different models. Note that the combination of characteristics for a given
model does not depend on country or time. Characteristics comprise 13 numeric and
non-numeric features in sample 2 and 5 features in sample 1. They include, for instance,
the spinning speed or the presence of a drying function.
Firm or brand dummies are included in equation (3) in order to account for
unobservable differences in quality between alternative models. Some brands are well
known for the reliable workmanship, the long life-time or the high robustness of their
products and are thus able to charge a higher price for an otherwise identical product.
Other brands may be successful in creating a distinct brand image through
advertisement, which may allow them to charge higher prices. There are 471 brands in
10 Since many models are sold in only a few or even in only one of the countries covered, a comparison of
individual models would cover only a fraction of the market. In many cases, it may just have been the name of the model which differs between countries. With the available data, however, it is hard to filter these effects out. As an alternative, one could have restricted the analysis to the most widespread and top-selling models. But this may exclude exactly those models whose relative prices may tend to be too large to be maintained within the monetary union. Moreover, the machines usually have a relatively short life-cycle, such that practically no model is sold over the entire observation period. This may, however, be a minor problem.
11 In his study on hedonic regression of electrical appliances including washing machines, Hoffmann (1998) found that the functional form of the hedonic regressions had only a minor effect on the results. Equation (3) implicitly assumes that coefficients πω and πf do not vary over time or across countries. It turns out that these coefficients do indeed change somewhat if the sample is restricted to the new millennium. The results concerning price convergence and deviations from the LOP, however, remain unaffected.
11
sample 1 and 407 in sample 2. Brand identity information is redundant for 21 brands in
sample 1, which leaves m(f) = 450 brand dummies for the hedonic regression. In
sample 2, m(f) = 292.
The residual of a regression on the observable and unobservable product
characteristics is the quality-adjusted price premium of model k. Coefficients πit
measure how large this premium is on average in country i at time t relative to a base
case. As the base case, the country-period combination with the most models has been
chosen which is the second four-month period of 2001 in Italy for sample 1 and the fifth
two-month period of 2005 in Italy for sample 2. Coefficients πit of sample 1 are,
therefore, the average quality-adjusted price deviation of the washing machines in
country i at time t compared in percentage terms to the typical washing machine in Italy
in 2001:2. Significant differences between the coefficients of two countries at a given
time period, πit and πjt, can arise through trade costs (a deviation of Qit/Qjt from 1 in (2))
which should have been reduced by the introduction of the euro, or through differences
in distribution-sector-related elements in (1), notably in distribution costs, Wit/Wjt, or in
mark-ups, Ait/Ajt. For N = 17 countries and up to T = 33 observation periods in sample 1
(T = 36 in sample 2), 485 country-time dummies have been included in the hedonic
regression for sample 1 and 587 for sample 2.
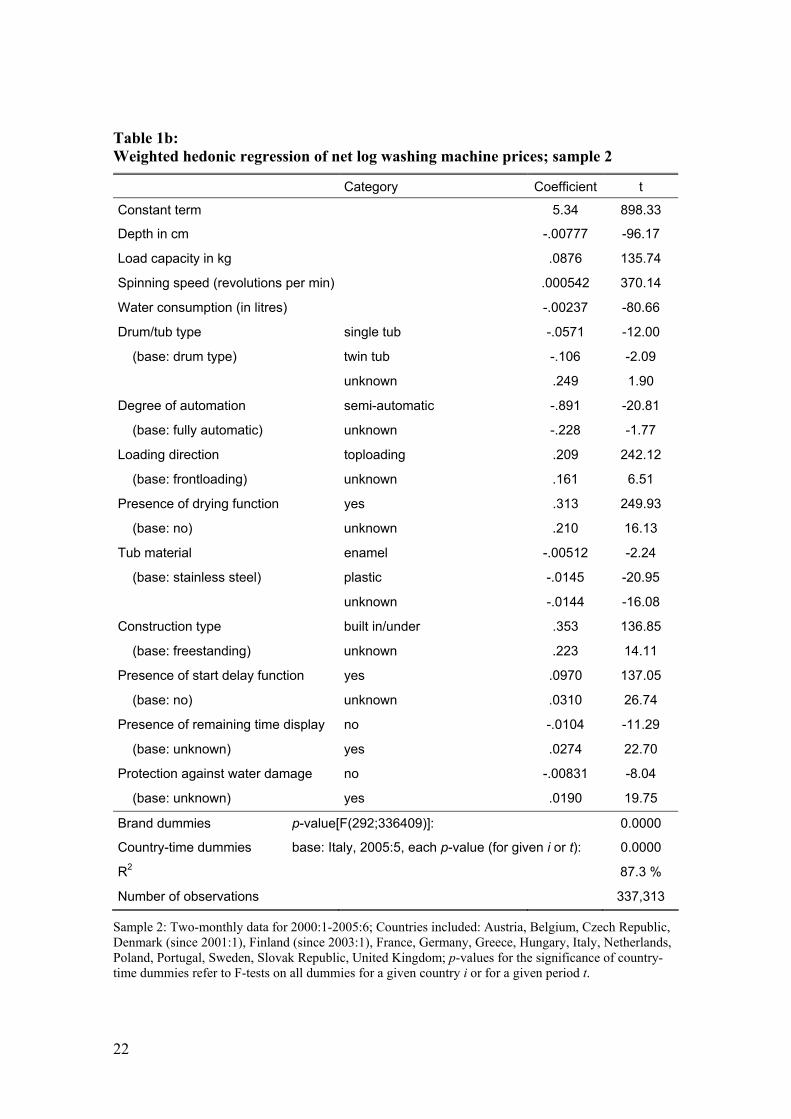
The hedonic price regression (3) has been estimated using a weighted least
squares technique where the quantity of model k sold in country i at time t has been
used as the weighting. Results are shown in table 1a for sample 1 and in table 1b for
sample 2. Both regressions explains more than 87 % of the variation in net log washing
machine prices. Apart from dummies for the residual category “unknown”, all the
hedonic coefficients are significant. Significance levels reach three-digit values in
several cases. All the coefficients are signed as expected. Economic significance is
substantial. To give some examples from sample 2, an additional kilogramme loading
capacity raises the net price by 9 %, a rise in the spinning speed by 200 revolutions per
minute adds 11 % to the price, a toploader or a built-in machine command a premium of
21 % and 35 %, respectively, the presence of a drying function adds 31 % to the bill,
and costs are less than half, if the customer refrains from choosing a fully automatic
machine (although it may be difficult to find a semi- or non-automatic one in the
countries considered).

12
Most of the brand dummies are highly significant as well. This is reflected in the
p-value of an F-test on their combined significance being indistinguishable from zero.
The same applies to the country-time dummies. F-tests have been performed on the
combined significance of all the dummies for a given country as well as for a given time
period. The p-values of all these tests are again virtually zero, regardless of which
country or which time period is chosen.
5 Deviations from the Law of One Price
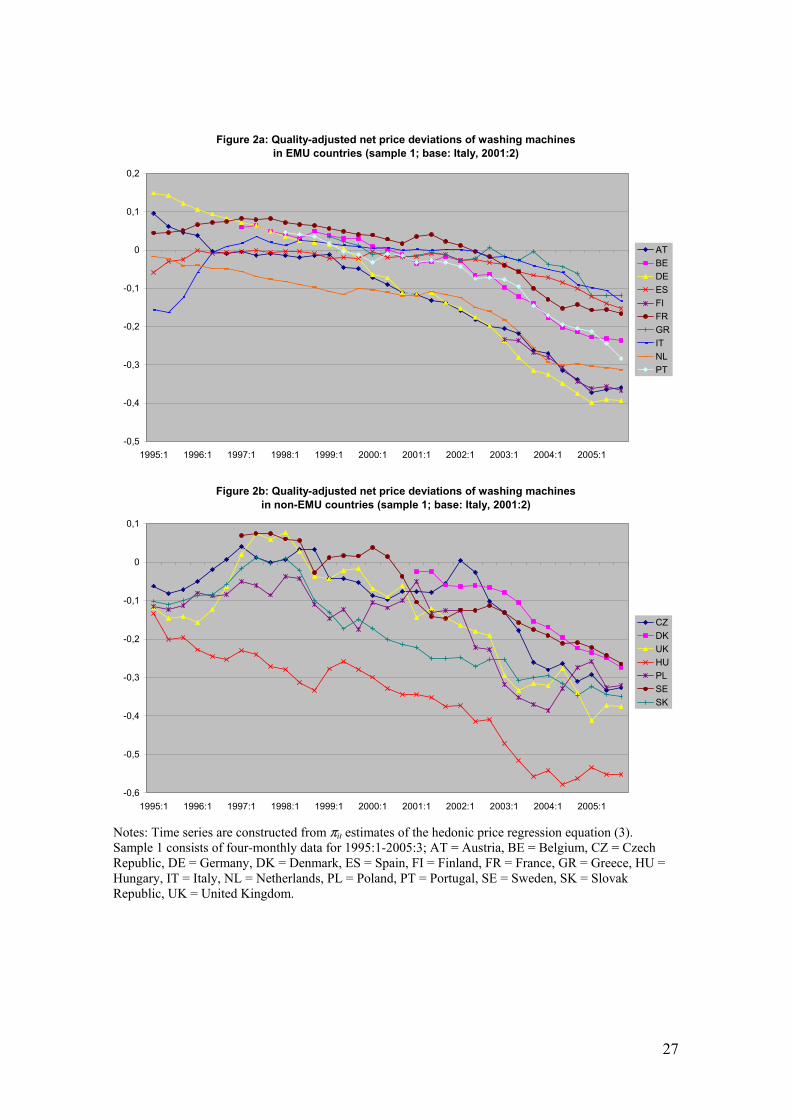
The estimated coefficients of the country-time dummies, itπ̂ , for sample 1 are
depicted in Figure 2 as time series. These are the deviations of average quality-adjusted
net washing machine prices in country i at time t from average prices in Italy in 2001:2.
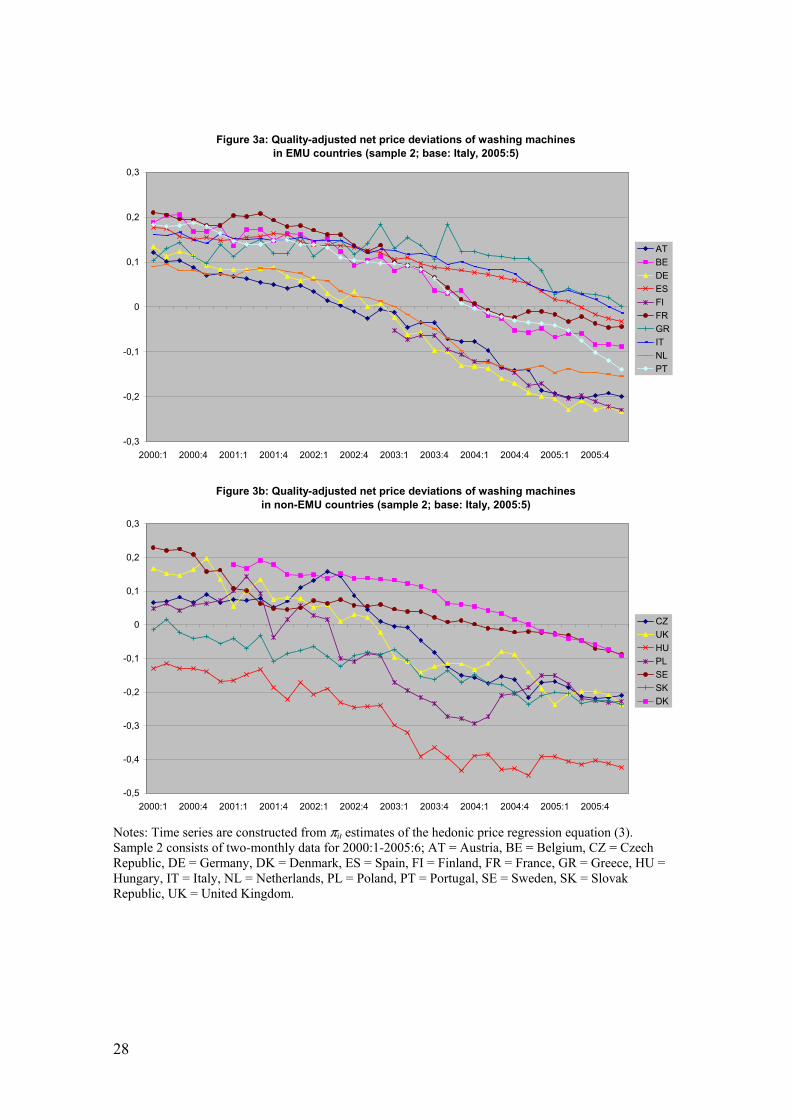
Figure 3 shows the corresponding time series based on sample 2. The observation
period in figure 3 is shorter than that of figure 2 but the results should be more precise
because of the distinctly extended set of quality characteristics available in sample 2.
A comparison between these figures and figure 1 reveals that the adjustment for
quality substantially changes the ranking of countries according to their average
washing machine prices. As opposed to figure 1, these figures show that, amongst all
EMU countries, prices are highest in France in 1997-2002, and subsequently in Greece
or Italy, with Spain close behind. Prices are lowest in the Netherlands until 2001 and in
Germany, Austria and Finland later on. Outside the EMU, it is mostly still Denmark and
Sweden, in which washing machines cost most, and Hungary where they are cheapest.
Figure 2a reveals that the hedonic regression eliminates the abrupt fall in German
and Austrian net prices in 2000:1 which was apparent in figure 1a. The most
pronounced price changes over time after quality adjustment are the price increases in
the UK and Italy around 1996. They are related to the nominal appreciation of both the
pound sterling and the Italian lira against the D-Mark at that time which was quite
similar in magnitude to the calculated quality adjusted price increase. This is a first sign
of considerable violations of the LOP.
One of the measures used for gauging deviations from the LOP (see for instance
Asplund/Friberg, 2001) are average absolute price deviations across countries. For a
given point in time, this amounts simply to jtit ππ ˆˆ − for the bilateral country pair i and
13
j. Averaging over time yields a more general measure for deviations from the LOP.
They range from around 1½% between Belgium and Portugal to 40% between Greece
and Hungary. All these bilateral absolute price deviations, even the lowest ones, are
statistically significant at any sensible significance level. Economically, average price
deviations of 1½% are rather unimportant. It should be borne in mind, however, that
these values are averages for the entire washing machine market and may thus mask
larger differences for individual models (downward aggregation bias of dispersion).
Turning to the upper edge, average price deviations of 40% within the Single European
Market for a good as tradable as a washing machine can hardly be brought in line with
common perceptions of the LOP.
While the maximum deviation from the LOP within the EMU, though still
substantial, is much smaller than these extremes (17% for the ratio between Germany
and Greece), figures 2 and 3 give first hints as to whether this may be related to the
introduction of the euro. In the full sample, in general, the maximum difference between
quality adjusted prices hardly increases over time. According to sample 1, it is 40% in
late 1998 when the euro introduction was imminent, still 40% at the end of 2001, just
before the euro cash changeover took place, and 43% at the end of 2005 (for the
country-pairs France/Hungary, France/Hungary and Greece/Hungary, respectively). The
picture changes dramatically if one considers EMU members only. While the maximum
quality-adjusted price difference stays nearly constant between the introduction of the
euro and the euro cash changeover (16% between France and the Netherlands in 1998:3
and 16% between France and Austria in 2001:3), it rises steeply afterwards to reach
27% in 2005:3 (Germany/Greece). This suggests that price dispersion may have
increased after the cash changeover instead of having fallen.
At the end of the observation period, the group of countries charging the highest
prices consists of Greece, Italy, Spain and France, all of which are EMU members
(Greece for five years and the other countries for seven) and all had been using euro
coins and notes for four years already. Given the lower price levels in some EMU and
all the non-EMU countries observed, the hypothesis that euro introduction would
enhance competition and ultimately drive down prices to a common level sounds not
(yet) convincing.
14
6 Evidence of price convergence?
In this chapter, formal tests of price convergence in the EMU are applied.
Commonly used methods to test for price convergence are standard F tests on the
equality of variances and panel unit root tests. These tests, however, are not specifically
designed as convergence tests. On the one hand, panel unit root tests may classify the
difference between gradually converging series as non-stationary. As a further problem,
a mixture of stationary and non-stationary series in the panel may bias the results.
Moreover, test results are sometimes not particularly robust. Standard F test results, on
the other hand, may be arbitrary because they consider just two points in time instead of
the whole series. As a further drawback, they assume independence of the two
variances, which is often not the case in time series. The problem is especially
pronounced if the price series are non-stationary.
Therefore, the log t test proposed by Phillips/Sul (2007) is used to test for price
convergence. The test does not depend on particular assumptions concerning trend
stationarity or stochastic nonstationarity of the variables to be tested. It focuses on the
ultimate convergence of a country-specific component of the variables allowing for
transitional divergence and heterogeneity in convergence speeds across panel members.
It can further be used to identify convergence clusters. Since experience with
applications of this method is scarce, the test results are contrasted with those of the
more traditional methods mentioned above.
6.1 The log t test Phillips/Sul’s (2007) testing procedure is, in essence, a test of σ-convergence for a
panel of time series. Their log t test consists in estimating
( )[ ] tt
utbatHH
++=+−⎟⎟⎠
⎞⎜⎜⎝
⎛ln1lnln2ln 1 (4)
for t = int(0.3T), int(0.3T) + 1, ... , T, where
( )∑=
−=N
iitt h
NH
1
211 , (5)

15
∑ =
−= N
i it
itit
XN
Xh
11
(6)
and Xit is a smoothed version of the variable to be tested for convergence. A one-
sided t-test using a heteroskedasticity and autocorrelation consistent (HAC) standard
error of b̂ tests for the null hypothesis of convergence, b ≥ 0. As is shown in (5) and
(6), the variable Ht is the cross-section variance of hit, a normalised version of Xit. Since
(the log of) the variance ratio H1/Ht is regressed in (4) on a positive function of time, the
log t test can be understood as a test on sigma convergence. Only data starting at
t = int(0.3T) is used for the regression in order to focus on long-term convergence.
Phillips/Sul (2007) assume Xit to be the product of some common factor and a time-
varying idiosyncratic coefficient which also includes a random component. Ultimately,
the log t test tests for the convergence of this idiosyncratic component to some constant.
As in Goldberg/Verboven (2005) (who apply unit root tests, however), the
country-time dummy series itπ̂ are used for the formal analysis of convergence.
Following the suggestion of Phillips/Sul (2007), an HP filter has been used to smooth
these series. Since most of the series are already rather smooth (see figures 2 and 3), the
smoothing factor λ has been adjusted from quarterly to the four- and two-monthly
frequency of the series consistent with Hodrick/Prescott (1997) in a rather conservative
way according to 21600s=λ where 43=s in sample 1 and 2
3=s in sample 2 resulting
in λ = 900 and λ = 3600, respectively. Adding the estimated constant 0π̂ to the series
yields (log) smoothed price series for a washing machine of the default firm with the
basic category characteristics. These are used as Xit in equation (6).
In the baseline case, the period considered starts in 1999:1, just when the euro had
been introduced. This excludes Denmark and Finland which enter the samples later.
Using the Newey-West procedure with a lag of 2 periods, the estimated t-value of b̂ in
(4) is -99.57 for all the countries in sample 1 and -168.65 if the sample is restricted to
EMU countries (including Greece). Given a critical value of -1.65 at the 5%
significance level, this suggests that washing machine prices in neither group have
shown any tendency to converge. One may, of course, choose an earlier starting point to
account for the possibility raised by Engel/Rogers (2004) that firms harmonised prices
16
in anticipation. Starting two years earlier in 1997:1, however, yields values of -45.61
(entire sample 1) and -41.86 (EMU countries). If the starting point is 2000:1 and
sample 2 is used, which may account for the effects of the euro cash changeover more
accurately, values of -71.21 (entire sample) and -72.25 (EMU countries) are obtained. In
sum, the null of price convergence is always firmly rejected.
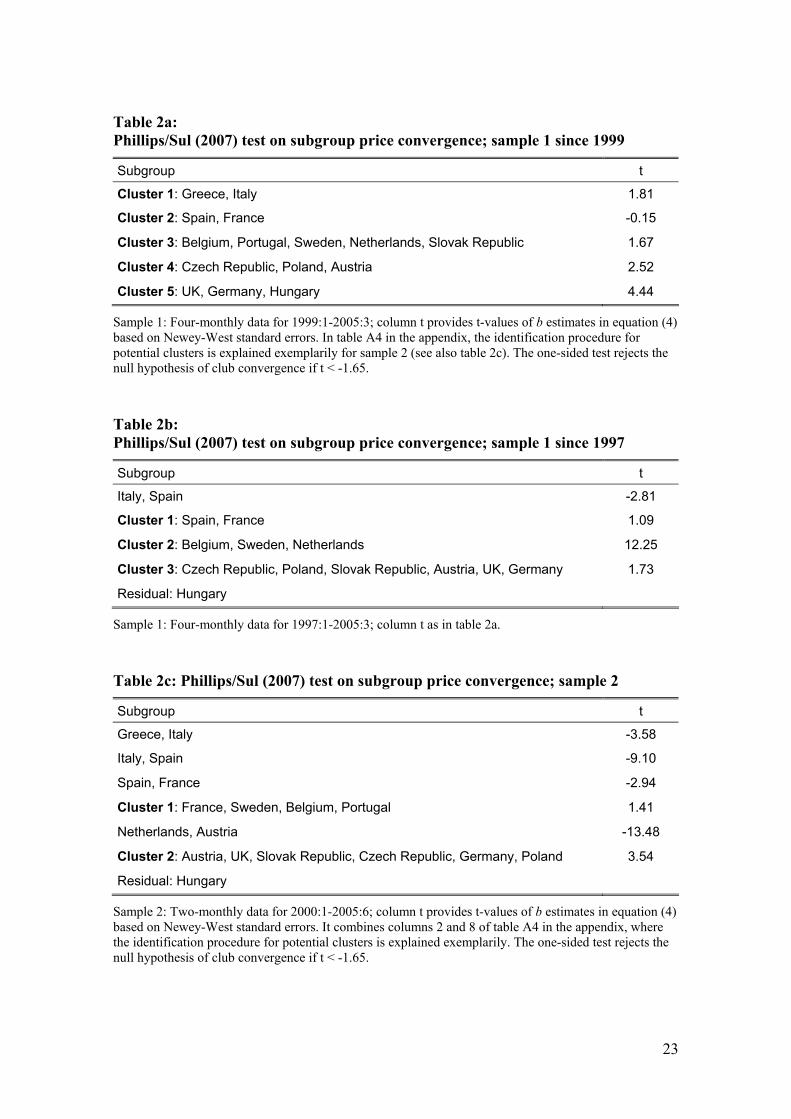
The negative results may, however, be due to an outlier. A clustering algorithm
recommended in Phillips/Sul (2007) is used to investigate whether some EMU countries
may form price convergence clusters. If euro introduction caused price convergence, the
algorithm should identify a convergence club which comprises most of the EMU
countries and hardly any non-EMU countries. Results are provided in tables 2a-c. The
first step of the algorithm consists of ordering the price series of individual countries
according to the last observation, XiT. This order is reflected in the baseline case shown
in table 2a in the sense that the most expensive washing machines are sold in Greece,
the second most expensive ones in Italy, the third in Spain and the cheapest ones in
Hungary in the four last months of 2005. The first entry in column t refers to the result
of a log t test which cannot reject the hypothesis that the subgroup Greece and Italy
forms a convergence cluster. In the same manner, the existence of four further clusters
is confirmed. Each of the clusters 3 to 5 comprises EMU and non-EMU countries.
If one lets the observation period start in 1997, Greece and Portugal are removed
from the sample because of a lack of data. Table 2b shows that Italy and Hungary now
no longer belong to any convergence club. The Slovak Republic, the UK and Germany
are rearranged into the former cluster 4.12 Starting in 2000 and using sample 2 yields the
results shown in table 2c. Here, only two multi-country convergence clusters are left,
both of which contain EMU as well as non-EMU countries. The t tests show that
Greece, Italy, Spain, the Netherlands and Hungary do not belong to any convergence
club. A description of the rather complex identification procedure for these clusters is
exemplarily given in appendix 1.
12 The resulting convergence clusters may not appear to exhibit any consistent geographic pattern. Such a
pattern can, however, be blurred by the selection of countries for the convergence analysis. If the algorithm is applied, for instance, to the sample of EMU countries (start in 1997), a clear geographic pattern emerges: Italy being the most expensive country is followed by three clusters, the first of which comprises Spain and France, the second Belgium and the Netherlands and the third Austria and Germany.
17
The cluster convergence results do not provide evidence that the creation of EMU
or the euro cash changeover might have resulted in any sort of convergence in washing
machines prices. First, EMU countries are divided into many clusters and some of them
may not even be related to any cluster at all. Second, the clusters that can be found are
obviously unrelated to EMU membership.
6.2 Alternative approaches Although the log t test may be the most appropriate for an investigation of price
convergence, the results of two alternative, more widely used approaches will also be
shown in order to check for robustness and in order to enable a closer comparison with
previous studies. Several studies such as Parsley/Wei (1996), Ceglowski (2003) and
Goldberg/Verboven (2005) use panel unit root tests for an examination of price level
convergence for individual goods. A rejection of the null hypothesis of non-stationarity
is commonly interpreted as evidence in favour of convergence to the LOP.
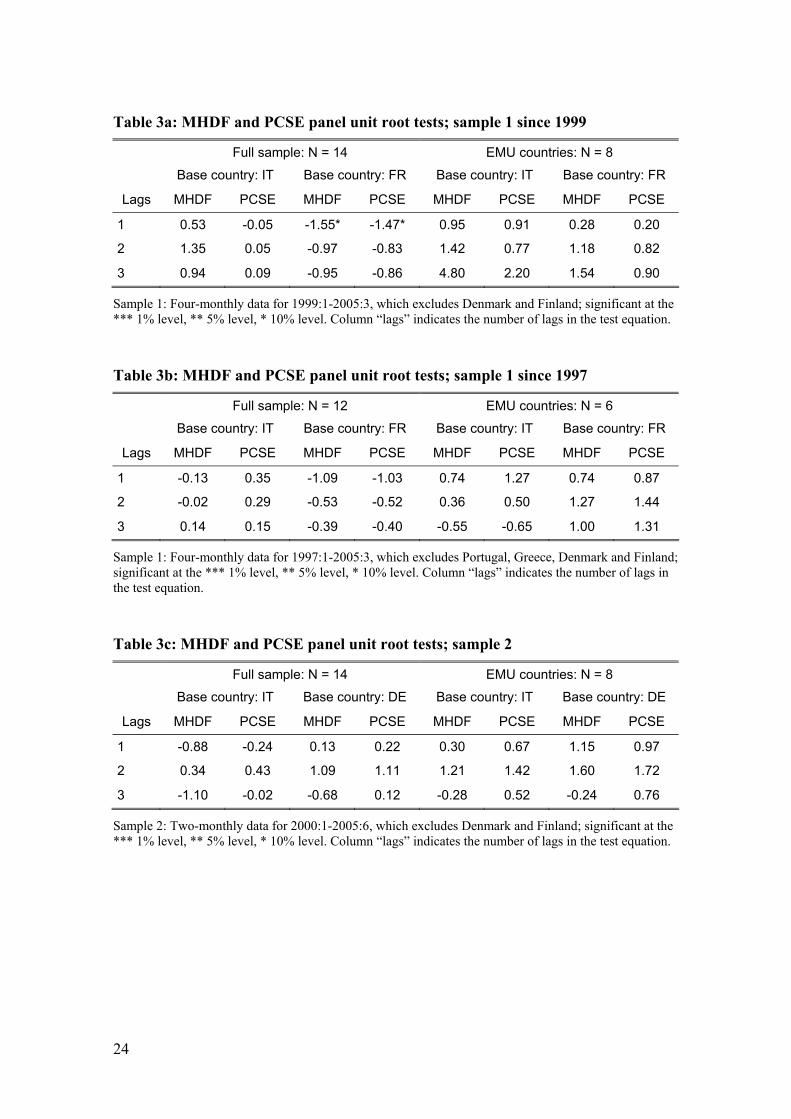
For an application of panel unit root tests, prices need to be normalised to a base
country. Since it is well known that the choice of the base country often affects the test
results (cf eg Coakley/Fuertes, 2000, or Papell/Theodorides, 2001), two alternatives
have been used: Italy (IT) with the biggest variety of washing machine models and the
country where most washing machines are sold within the EMU which is France (FR)
in the case of sample 1 and Germany (DE) in the case of sample 2. The percentage
deviation of the quality-adjusted washing machine price in country i from that in the
base country IT, for example, is simply
tITititITr ,, ππ −= . (7)
Since all the series in a given panel share a common base country, non-negligible
cross-sectional correlations are to be expected. Therefore, it is advisable to apply second
generation panel unit root tests, which take heterogeneous cross-correlations into
account. In the present case, the multivariate homogeneous Dickey-Fuller (MHDF) test
of Harvey/Bates (2002) and the panel corrected standard errors (PCSE) test of
Breitung/Das (2005) and Jönsson (2005) have been used.
Tables 3a-c show that these tests cannot provide evidence in favour of stationarity
for any panel of EMU countries, not even at a 10% significance level. This applies
18
regardless of the lag length in the test equation and regardless of which observation
period or sample is used. For a panel of all (EMU and non-EMU) countries, the results
are also sobering. The results are fully consistent with those obtained using the log t
tests. They contrast, however, with results from previous studies, notably those
mentioned at the start of the chapter, which mostly find evidence for convergence to the
LOP. One possible reason why the present study yields the opposite result may be its
relatively short observation period. In any case, the finding of non-stationarity of price
deviations across EMU countries does not lend support to the hypothesis that the
introduction of the euro or the euro cash changeover has led to convergence of washing
machine prices among member states.
A second alternative approach which is used in studies on price convergence such
as Lutz (2004), Wolszczak-Derlacz (2006) and Rogers (2007) is a standard F test given
by 22 ˆ/ˆ ts σσ ∼ F(Ns-1, Nt-1), where 2ˆ sσ denotes the variance of price levels across Ns
countries at time s. A rejection of the null hypothesis of the equality of variances
implies 22 ˆˆ ts σσ > , which is evidence for price convergence (divergence) if t > s (s > t).
For the present analysis, cross-country variances have been computed for five points in
time, two alternative periods that precede the formation of EMU (1997:1 and 1998:3 in
sample 1, which are respectively two years and immediately prior to the event), two
corresponding ones that precede the euro cash changeover (2000:1 and 2001:6 using
sample 2) and one at the end of the sample period seven and four years after the
respective event. If some of the effects of the euro introduction occurred in anticipation
before the event took place, the earlier pre-event point in time should be preferable,
otherwise the latter should be more adequate.
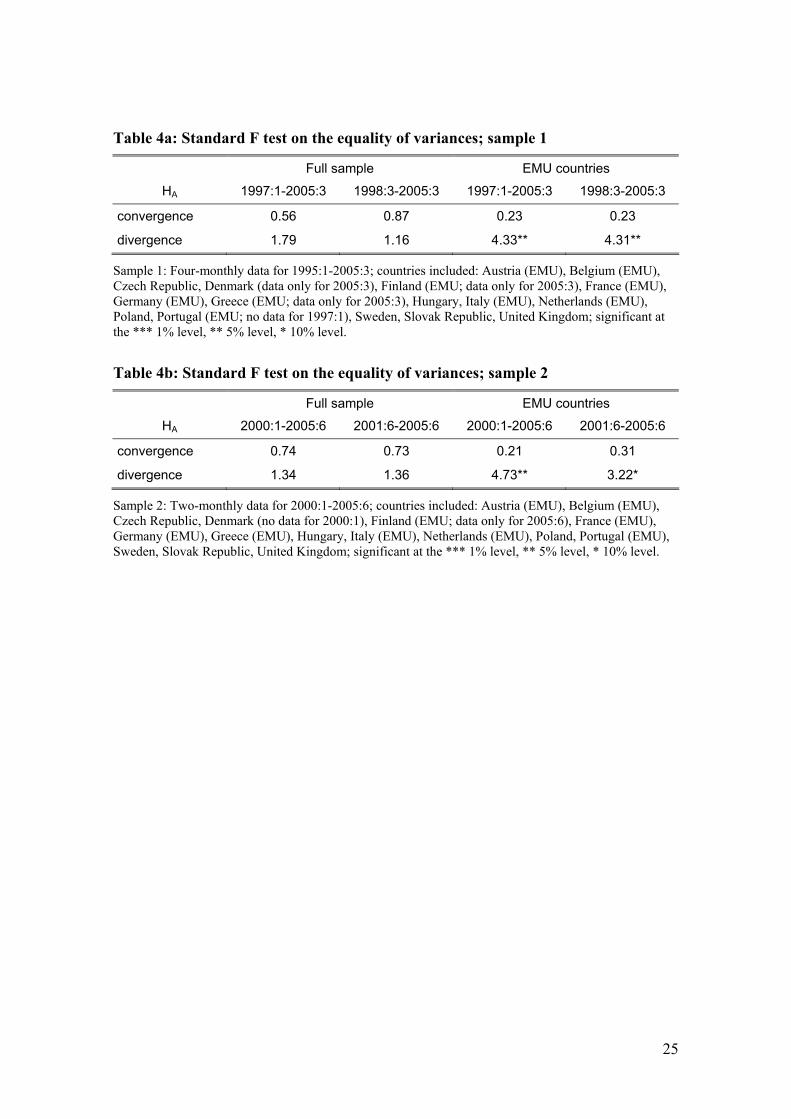
As is shown in tables 4a and 4b, the equality of variances can generally not be
rejected if convergence is the alternative hypothesis or if the full sample of countries is
considered. If the alternative is divergence and the sample is restricted to the EMU
countries, however, the equality of variances is rejected at the 5% significance level in
three out of four cases and at the 10% level in the last. These results are again in line
with the finding that neither the introduction of the euro nor the euro cash changeover is
associated with a convergence of washing machine prices. If anything, a divergence can
be observed.
19
7 Conclusions
The introduction of the euro was expected to cause product prices in the emerging
monetary union to converge. Based on an extremely comprehensive and precise scanner
database which represents 90% of all sales in 17 European countries over the period
from 1995 to 2005, it can be shown that quality-adjusted washing machine prices did
not exhibit any tendency to converge across EMU members. Moreover, a convergence
cluster analysis cannot identify a convergence club which would comprise a larger
subgroup of EMU countries and, at the same time, exclude the non-EMU countries in
the sample. Instead, the clusters that can be found are mostly rather small and are
usually unrelated to EMU membership. This implies that, in the washing machine
market, neither the introduction of the euro at the start of 1999 nor the euro cash
changeover three years later have had a noticeable price convergence impact. If
anything, prices have diverged since then. Given that washing machines – being highly
tradable, highly traded and easily comparable internationally – are rather optimal
candidates to find the expected effects, these results raise doubts whether any aggregate
effect can have occurred at all.
In the course of the analysis, a hedonic price regression was performed which
yields the development of average quality-adjusted relative prices for as many as 17
European countries. To my knowledge, the present study is thus the first that is able to
provide such a precise and comprehensive international price comparison for a nearly
complete product market in so many countries over a period of 11 years. Earlier
findings of statistically and economically significant deviations from the Law of One
Price are confirmed.
As a direction of further research, the causes of the observed relative price
developments, notably the apparent divergence of prices, remain to be investigated.
Equation (1) suggests some potential culprits. Over most of the time after EMU was
established, energy prices increased. This may have raised trade costs. As a second
possibility, distribution costs especially wages in the distribution sector could have
diverged in the euro area. Finally, competition may have increased much more in some
EMU member states than in others resulting in diverging mark-ups. Apart from the
20
causes of relative price movements, a more detailed analysis of the effects of potential
country-specific feature preferences and their development over time may be of interest.
In spite of the negative findings in the present study, one may still take heart from
the results of the literature according to which deviations from the LOP are much
smaller in long-established monetary unions than in more recently founded ones.
Although the observation period of seven years since the euro introduction (and four
since the euro cash changeover) in the present study is quite substantial, it may still not
be long enough to bring the expected price convergence effect forward. At least in such
a case, however, a more thorough theoretical understanding of the mechanisms that
relate the establishment of a monetary union to a firm’s pricing behaviour would be
desirable.

21
Table 1a: Weighted hedonic regression of net log washing machine prices; sample 1
Category Coefficient t
Constant term 5.72 1096.28
Load capacity in kg .0523 80.84
Spinning speed (revolutions per min) .000654 484.29
Degree of automation and semi-automatic, no dryer -1.122 -152.01
presence of drying function washdryer .261 218.82
(base: fully automatic, no dryer) unknown .186 7.22
Loading direction toploading .147 189.24
(base: frontloading) unknown .125 2.97
Construction type built in/under .317 120.61
(base: freestanding) unknown .0058 .58
Brand dummies p-value[F(450;326638)]: 0.0000
Country-time dummies base: Italy, 2001:2, each p-value (for given i or t): 0.0000
R2 87.5 %
Number of observations 327,583
Sample 1: Four-monthly data for 1995:1-2005:3; Countries included: Austria, Belgium (since 1997:1), Czech Republic, Denmark (since 2001:1), Finland (since 2003:1), France, Germany, Greece (since 1999:1), Hungary, Italy, Netherlands, Poland, Portugal (since 1998:1), Sweden (since 1997:1), Slovak Republic, United Kingdom; p-values for the significance of country-time dummies refer to F-tests on all dummies for a given country i or for a given period t.
22
Table 1b: Weighted hedonic regression of net log washing machine prices; sample 2
Category Coefficient t
Constant term 5.34 898.33
Depth in cm -.00777 -96.17
Load capacity in kg .0876 135.74
Spinning speed (revolutions per min) .000542 370.14
Water consumption (in litres) -.00237 -80.66
Drum/tub type single tub -.0571 -12.00
(base: drum type) twin tub -.106 -2.09
unknown .249 1.90
Degree of automation semi-automatic -.891 -20.81
(base: fully automatic) unknown -.228 -1.77
Loading direction toploading .209 242.12
(base: frontloading) unknown .161 6.51
Presence of drying function yes .313 249.93
(base: no) unknown .210 16.13
Tub material enamel -.00512 -2.24
(base: stainless steel) plastic -.0145 -20.95
unknown -.0144 -16.08
Construction type built in/under .353 136.85
(base: freestanding) unknown .223 14.11
Presence of start delay function yes .0970 137.05
(base: no) unknown .0310 26.74
Presence of remaining time display no -.0104 -11.29
(base: unknown) yes .0274 22.70
Protection against water damage no -.00831 -8.04
(base: unknown) yes .0190 19.75
Brand dummies p-value[F(292;336409)]: 0.0000
Country-time dummies base: Italy, 2005:5, each p-value (for given i or t): 0.0000
R2 87.3 %
Number of observations 337,313
Sample 2: Two-monthly data for 2000:1-2005:6; Countries included: Austria, Belgium, Czech Republic, Denmark (since 2001:1), Finland (since 2003:1), France, Germany, Greece, Hungary, Italy, Netherlands, Poland, Portugal, Sweden, Slovak Republic, United Kingdom; p-values for the significance of country-time dummies refer to F-tests on all dummies for a given country i or for a given period t.
23
Table 2a: Phillips/Sul (2007) test on subgroup price convergence; sample 1 since 1999
Subgroup t
Cluster 1: Greece, Italy 1.81
Cluster 2: Spain, France -0.15
Cluster 3: Belgium, Portugal, Sweden, Netherlands, Slovak Republic 1.67
Cluster 4: Czech Republic, Poland, Austria 2.52
Cluster 5: UK, Germany, Hungary 4.44
Sample 1: Four-monthly data for 1999:1-2005:3; column t provides t-values of b estimates in equation (4) based on Newey-West standard errors. In table A4 in the appendix, the identification procedure for potential clusters is explained exemplarily for sample 2 (see also table 2c). The one-sided test rejects the null hypothesis of club convergence if t < -1.65.
Table 2b: Phillips/Sul (2007) test on subgroup price convergence; sample 1 since 1997
Subgroup t
Italy, Spain -2.81
Cluster 1: Spain, France 1.09
Cluster 2: Belgium, Sweden, Netherlands 12.25
Cluster 3: Czech Republic, Poland, Slovak Republic, Austria, UK, Germany 1.73
Residual: Hungary
Sample 1: Four-monthly data for 1997:1-2005:3; column t as in table 2a.
Table 2c: Phillips/Sul (2007) test on subgroup price convergence; sample 2
Subgroup t
Greece, Italy -3.58
Italy, Spain -9.10
Spain, France -2.94
Cluster 1: France, Sweden, Belgium, Portugal 1.41
Netherlands, Austria -13.48
Cluster 2: Austria, UK, Slovak Republic, Czech Republic, Germany, Poland 3.54
Residual: Hungary
Sample 2: Two-monthly data for 2000:1-2005:6; column t provides t-values of b estimates in equation (4) based on Newey-West standard errors. It combines columns 2 and 8 of table A4 in the appendix, where the identification procedure for potential clusters is explained exemplarily. The one-sided test rejects the null hypothesis of club convergence if t < -1.65.
24
Table 3a: MHDF and PCSE panel unit root tests; sample 1 since 1999
Full sample: N = 14 EMU countries: N = 8
Base country: IT Base country: FR Base country: IT Base country: FR
Lags MHDF PCSE MHDF PCSE MHDF PCSE MHDF PCSE
1 0.53 -0.05 -1.55* -1.47* 0.95 0.91 0.28 0.20
2 1.35 0.05 -0.97 -0.83 1.42 0.77 1.18 0.82
3 0.94 0.09 -0.95 -0.86 4.80 2.20 1.54 0.90
Sample 1: Four-monthly data for 1999:1-2005:3, which excludes Denmark and Finland; significant at the *** 1% level, ** 5% level, * 10% level. Column “lags” indicates the number of lags in the test equation.
Table 3b: MHDF and PCSE panel unit root tests; sample 1 since 1997
Full sample: N = 12 EMU countries: N = 6
Base country: IT Base country: FR Base country: IT Base country: FR
Lags MHDF PCSE MHDF PCSE MHDF PCSE MHDF PCSE
1 -0.13 0.35 -1.09 -1.03 0.74 1.27 0.74 0.87
2 -0.02 0.29 -0.53 -0.52 0.36 0.50 1.27 1.44
3 0.14 0.15 -0.39 -0.40 -0.55 -0.65 1.00 1.31
Sample 1: Four-monthly data for 1997:1-2005:3, which excludes Portugal, Greece, Denmark and Finland; significant at the *** 1% level, ** 5% level, * 10% level. Column “lags” indicates the number of lags in the test equation.
Table 3c: MHDF and PCSE panel unit root tests; sample 2
Full sample: N = 14 EMU countries: N = 8
Base country: IT Base country: DE Base country: IT Base country: DE
Lags MHDF PCSE MHDF PCSE MHDF PCSE MHDF PCSE
1 -0.88 -0.24 0.13 0.22 0.30 0.67 1.15 0.97
2 0.34 0.43 1.09 1.11 1.21 1.42 1.60 1.72
3 -1.10 -0.02 -0.68 0.12 -0.28 0.52 -0.24 0.76
Sample 2: Two-monthly data for 2000:1-2005:6, which excludes Denmark and Finland; significant at the *** 1% level, ** 5% level, * 10% level. Column “lags” indicates the number of lags in the test equation.
25
Table 4a: Standard F test on the equality of variances; sample 1
Full sample EMU countries
HA 1997:1-2005:3 1998:3-2005:3 1997:1-2005:3 1998:3-2005:3
convergence 0.56 0.87 0.23 0.23
divergence 1.79 1.16 4.33** 4.31**
Sample 1: Four-monthly data for 1995:1-2005:3; countries included: Austria (EMU), Belgium (EMU), Czech Republic, Denmark (data only for 2005:3), Finland (EMU; data only for 2005:3), France (EMU), Germany (EMU), Greece (EMU; data only for 2005:3), Hungary, Italy (EMU), Netherlands (EMU), Poland, Portugal (EMU; no data for 1997:1), Sweden, Slovak Republic, United Kingdom; significant at the *** 1% level, ** 5% level, * 10% level.
Table 4b: Standard F test on the equality of variances; sample 2
Full sample EMU countries
HA 2000:1-2005:6 2001:6-2005:6 2000:1-2005:6 2001:6-2005:6
convergence 0.74 0.73 0.21 0.31
divergence 1.34 1.36 4.73** 3.22*
Sample 2: Two-monthly data for 2000:1-2005:6; countries included: Austria (EMU), Belgium (EMU), Czech Republic, Denmark (no data for 2000:1), Finland (EMU; data only for 2005:6), France (EMU), Germany (EMU), Greece (EMU), Hungary, Italy (EMU), Netherlands (EMU), Poland, Portugal (EMU), Sweden, Slovak Republic, United Kingdom; significant at the *** 1% level, ** 5% level, * 10% level.

26
Figure 1a: Net washing machine prices in EMU countries in D-Mark; sample 1
400
500
600
700
800
900
1000
1100
1200
1300
1995:1 1996:1 1997:1 1998:1 1999:1 2000:1 2001:1 2002:1 2003:1 2004:1 2005:1
ATBEDEESFIFRGRITNLPT
Figure 1b: Net washing machine prices in non-EMU countries in D-Mark; sample 1
400
500
600
700
800
900
1000
1100
1200
1995:1 1996:1 1997:1 1998:1 1999:1 2000:1 2001:1 2002:1 2003:1 2004:1 2005:1
CZDKUKHUPLSESK
Notes: Sample 1 consists of four-monthly data for 1995:1-2005:3; AT = Austria, BE = Belgium, CZ = Czech Republic, DE = Germany, DK = Denmark, ES = Spain, FI = Finland, FR = France, GR = Greece, HU = Hungary, IT = Italy, NL = Netherlands, PL = Poland, PT = Portugal, SE = Sweden, SK = Slovak Republic, UK = United Kingdom. Washing machines, whose loading capacity or spinning speed are unknown, are excluded from the sample.
27
Figure 2a: Quality-adjusted net price deviations of washing machinesin EMU countries (sample 1; base: Italy, 2001:2)
-0,5
-0,4
-0,3
-0,2
-0,1
0
0,1
0,2
1995:1 1996:1 1997:1 1998:1 1999:1 2000:1 2001:1 2002:1 2003:1 2004:1 2005:1
ATBEDEESFIFRGRITNLPT
Figure 2b: Quality-adjusted net price deviations of washing machinesin non-EMU countries (sample 1; base: Italy, 2001:2)
-0,6
-0,5
-0,4
-0,3
-0,2
-0,1
0
0,1
1995:1 1996:1 1997:1 1998:1 1999:1 2000:1 2001:1 2002:1 2003:1 2004:1 2005:1
CZDKUKHUPLSESK
Notes: Time series are constructed from πit estimates of the hedonic price regression equation (3). Sample 1 consists of four-monthly data for 1995:1-2005:3; AT = Austria, BE = Belgium, CZ = Czech Republic, DE = Germany, DK = Denmark, ES = Spain, FI = Finland, FR = France, GR = Greece, HU = Hungary, IT = Italy, NL = Netherlands, PL = Poland, PT = Portugal, SE = Sweden, SK = Slovak Republic, UK = United Kingdom.
28
Figure 3a: Quality-adjusted net price deviations of washing machinesin EMU countries (sample 2; base: Italy, 2005:5)
-0,3
-0,2
-0,1
0
0,1
0,2
0,3
2000:1 2000:4 2001:1 2001:4 2002:1 2002:4 2003:1 2003:4 2004:1 2004:4 2005:1 2005:4
ATBEDEESFIFRGRITNLPT
Figure 3b: Quality-adjusted net price deviations of washing machinesin non-EMU countries (sample 2; base: Italy, 2005:5)
-0,5
-0,4
-0,3
-0,2
-0,1
0
0,1
0,2
0,3
2000:1 2000:4 2001:1 2001:4 2002:1 2002:4 2003:1 2003:4 2004:1 2004:4 2005:1 2005:4
CZUKHUPLSESKDK
Notes: Time series are constructed from πit estimates of the hedonic price regression equation (3). Sample 2 consists of two-monthly data for 2000:1-2005:6; AT = Austria, BE = Belgium, CZ = Czech Republic, DE = Germany, DK = Denmark, ES = Spain, FI = Finland, FR = France, GR = Greece, HU = Hungary, IT = Italy, NL = Netherlands, PL = Poland, PT = Portugal, SE = Sweden, SK = Slovak Republic, UK = United Kingdom.
29
Appendix
Appendix 1: Tables on the washing machine micro database
Table A1: The washing machine micro database, sample 1: four-monthly data since 1995
Country Obs Max models Min models Price (DM) Sales Period
AT 18,641 793 403 1206 118 95:1-05:3
BE 12,007 580 379 1236 183 97:1-05:3
CZ 15,073 787 156 776 143 95:1-05:3
DE 38,707 1430 861 1218 526 95:1-05:3
DK 6,393 595 244 1324 117 01:1-05:3
ES 37,190 1544 712 736 346 95:1-05:3
FI 4,445 597 332 943 98 03:1-05:3
FR 38,869 1540 941 972 529 95:1-05:3
GR 12,634 715 448 867 137 99:1-05:3
HU 10,655 802 103 597 188 95:1-05:3
IT 49,152 1787 1126 736 301 95:1-05:3
NL 20,339 759 442 1224 247 95:1-05:3
PL 17,023 1066 119 661 444 95:1-05:3
PT 14,234 796 332 744 125 98:1-05:3
SE 10,010 542 198 1206 131 97:1-05:3
SK 7,965 499 50 679 113 95:1-05:3
UK 17,304 852 326 935 1355 95:1-05:3
Total 330,641 1787 50 940 363 -
Column Obs = number of observations per country (= sum over time of the number of models recorded to be sold per four-month period), column Max (Min) models = maximum (minimum) number of models recorded to be sold per four-month period (= maximum (minimum) number of observations per four-month period), column Price (DM) = sales-weighted average washing machine price in D-Mark inclusive of VAT, column Sales = average number of sales units per model and period, column Period = observation period; both Price and Sales numbers are averaged over time and across models. AT = Austria, BE = Belgium, CZ = Czech Republic, DE = Germany, DK = Denmark, ES = Spain, FI = Finland, FR = France, GR = Greece, HU = Hungary, IT = Italy, NL = Netherlands, PL = Poland, PT = Portugal, SE = Sweden, SK = Slovak Republic, UK = United Kingdom. A quarter of the observations (81,471) predate the establishment of EMU on 1 January 1999 and 52% (171,752) predate the euro cash changeover of 1 January 2002.
30
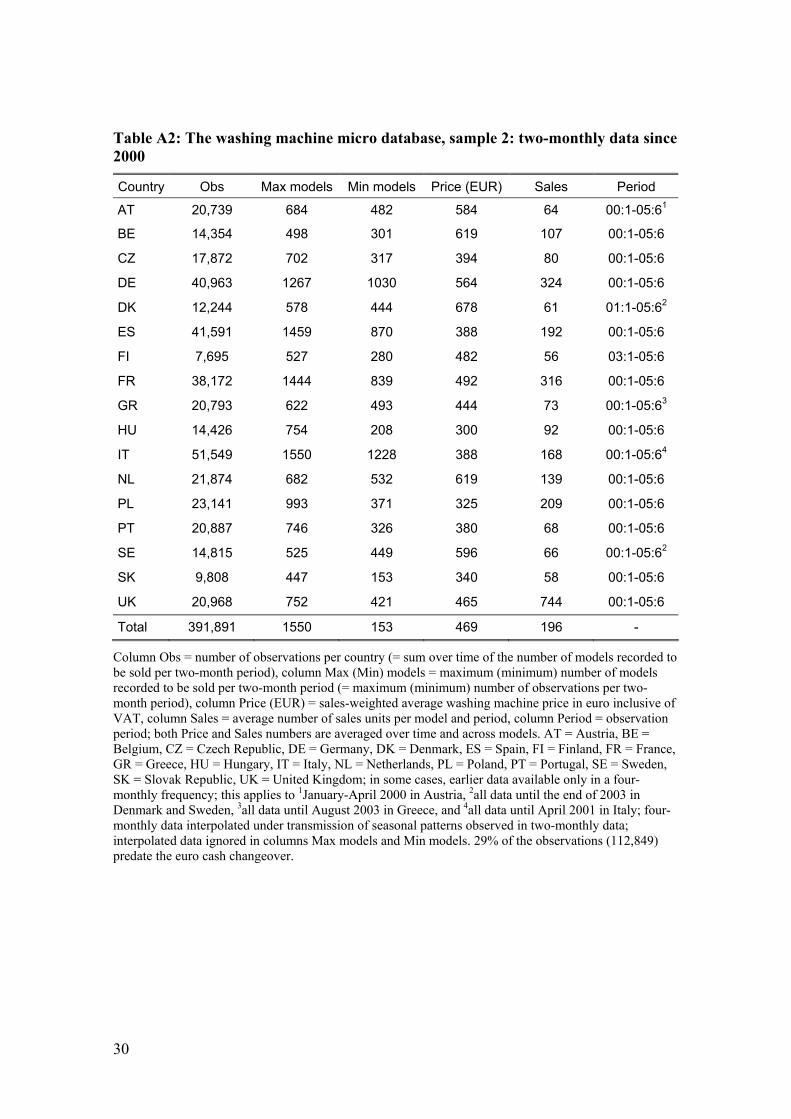
Table A2: The washing machine micro database, sample 2: two-monthly data since 2000
Country Obs Max models Min models Price (EUR) Sales Period
AT 20,739 684 482 584 64 00:1-05:61
BE 14,354 498 301 619 107 00:1-05:6
CZ 17,872 702 317 394 80 00:1-05:6
DE 40,963 1267 1030 564 324 00:1-05:6
DK 12,244 578 444 678 61 01:1-05:62
ES 41,591 1459 870 388 192 00:1-05:6
FI 7,695 527 280 482 56 03:1-05:6
FR 38,172 1444 839 492 316 00:1-05:6
GR 20,793 622 493 444 73 00:1-05:63
HU 14,426 754 208 300 92 00:1-05:6
IT 51,549 1550 1228 388 168 00:1-05:64
NL 21,874 682 532 619 139 00:1-05:6
PL 23,141 993 371 325 209 00:1-05:6
PT 20,887 746 326 380 68 00:1-05:6
SE 14,815 525 449 596 66 00:1-05:62
SK 9,808 447 153 340 58 00:1-05:6
UK 20,968 752 421 465 744 00:1-05:6
Total 391,891 1550 153 469 196 -
Column Obs = number of observations per country (= sum over time of the number of models recorded to be sold per two-month period), column Max (Min) models = maximum (minimum) number of models recorded to be sold per two-month period (= maximum (minimum) number of observations per two-month period), column Price (EUR) = sales-weighted average washing machine price in euro inclusive of VAT, column Sales = average number of sales units per model and period, column Period = observation period; both Price and Sales numbers are averaged over time and across models. AT = Austria, BE = Belgium, CZ = Czech Republic, DE = Germany, DK = Denmark, ES = Spain, FI = Finland, FR = France, GR = Greece, HU = Hungary, IT = Italy, NL = Netherlands, PL = Poland, PT = Portugal, SE = Sweden, SK = Slovak Republic, UK = United Kingdom; in some cases, earlier data available only in a four-monthly frequency; this applies to 1January-April 2000 in Austria, 2all data until the end of 2003 in Denmark and Sweden, 3all data until August 2003 in Greece, and 4all data until April 2001 in Italy; four-monthly data interpolated under transmission of seasonal patterns observed in two-monthly data; interpolated data ignored in columns Max models and Min models. 29% of the observations (112,849) predate the euro cash changeover.
31
Appendix 2: Does the use of a micro database make a difference? An important reason for using a washing machine micro database on prices (and
quantities sold) is the expectation that the extensive coverage of this particular market
provides additional information which would be unavailable from other sources.
National statistical agencies are also collecting washing machine prices, although much
more selectively, covering only some types sold in some shops in some cities. If the
collected prices meet the intention of being representative, they should provide a similar
picture as aggregates obtained from micro sources. A comparison between the micro
data used here and Eurostat data, which is widely used in studies on price convergence
(see eg Allington et al, 2005, or Wolszczak-Derlacz, 2006), gives an indication of the
similarity of the information content.
Eurostat data comprises comparative price levels for narrow product groups (basic
headings) in an annual frequency, one of which is “washing machines, dryers and
dishwashers”. Given that the weight of washing machines in this product group should
be large and that there is no obvious reason why the cross-country price deviation of
dryers or dishwashers should differ considerably from that of washing machines, one
might expect a high positive correlation between comparative price levels for this basic
heading and methodologically corresponding series from our micro database.
Originally, the Eurostat comparative price levels are scaled to the geometric mean
of the EU15. To allow for comparability, they have been rescaled to the geometric mean
of those EMU countries that are included in the micro database. A methodologically
comparative measure can be obtained from the micro database if the hedonic regression
(3) is re-estimated using washing machine prices inclusive of VAT, PV,it, and the
resulting average quality-adjusted price premia, itV ,π̂ are transformed as
⎟⎟⎠
⎞⎜⎜⎝
⎛−⋅= ∑
=
N
iitVitVitV N 1
,,, ˆ1ˆexp100~ πππ . (A1)
Pairwise correlation coefficients have been computed between these values and
the rescaled Eurostat comparative price levels for the period 1995-2004, each in levels
and differences. A one-sided test on the significance of the correlation coefficient
against the alternative of positive correlation has been performed. The results are shown
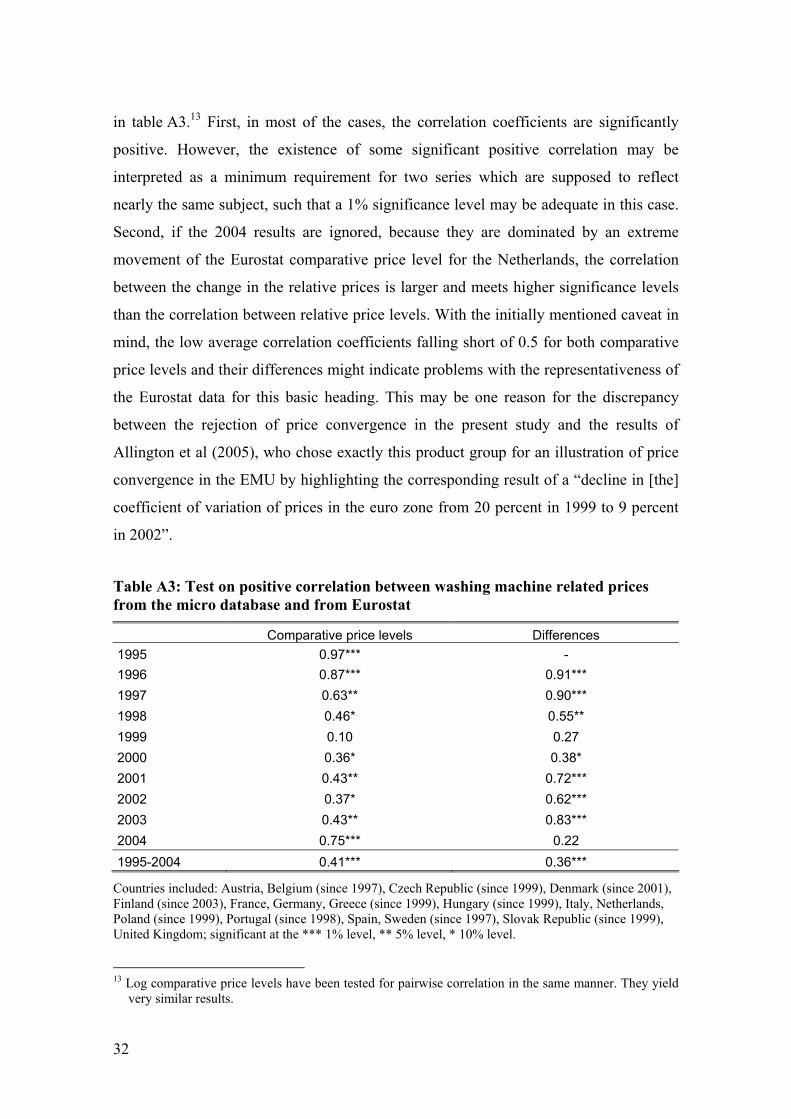
32
in table A3.13 First, in most of the cases, the correlation coefficients are significantly
positive. However, the existence of some significant positive correlation may be
interpreted as a minimum requirement for two series which are supposed to reflect
nearly the same subject, such that a 1% significance level may be adequate in this case.
Second, if the 2004 results are ignored, because they are dominated by an extreme
movement of the Eurostat comparative price level for the Netherlands, the correlation
between the change in the relative prices is larger and meets higher significance levels
than the correlation between relative price levels. With the initially mentioned caveat in
mind, the low average correlation coefficients falling short of 0.5 for both comparative
price levels and their differences might indicate problems with the representativeness of
the Eurostat data for this basic heading. This may be one reason for the discrepancy
between the rejection of price convergence in the present study and the results of
Allington et al (2005), who chose exactly this product group for an illustration of price
convergence in the EMU by highlighting the corresponding result of a “decline in [the]
coefficient of variation of prices in the euro zone from 20 percent in 1999 to 9 percent
in 2002”.
Table A3: Test on positive correlation between washing machine related prices from the micro database and from Eurostat
Comparative price levels Differences 1995 0.97*** - 1996 0.87*** 0.91*** 1997 0.63** 0.90*** 1998 0.46* 0.55** 1999 0.10 0.27 2000 0.36* 0.38* 2001 0.43** 0.72*** 2002 0.37* 0.62*** 2003 0.43** 0.83*** 2004 0.75*** 0.22 1995-2004 0.41*** 0.36***
Countries included: Austria, Belgium (since 1997), Czech Republic (since 1999), Denmark (since 2001), Finland (since 2003), France, Germany, Greece (since 1999), Hungary (since 1999), Italy, Netherlands, Poland (since 1999), Portugal (since 1998), Spain, Sweden (since 1997), Slovak Republic (since 1999), United Kingdom; significant at the *** 1% level, ** 5% level, * 10% level.
13 Log comparative price levels have been tested for pairwise correlation in the same manner. They yield
very similar results.
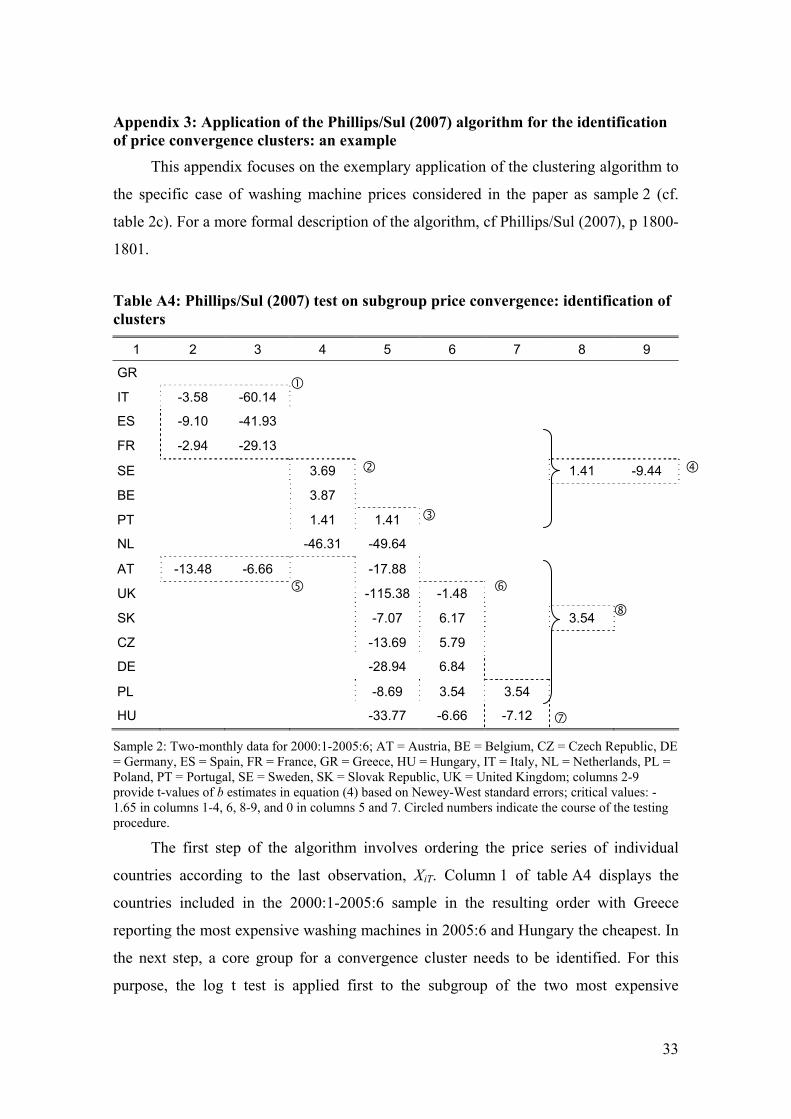
33
Appendix 3: Application of the Phillips/Sul (2007) algorithm for the identification of price convergence clusters: an example
This appendix focuses on the exemplary application of the clustering algorithm to
the specific case of washing machine prices considered in the paper as sample 2 (cf.
table 2c). For a more formal description of the algorithm, cf Phillips/Sul (2007), p 1800-
1801.
Table A4: Phillips/Sul (2007) test on subgroup price convergence: identification of clusters
1 2 3 4 5 6 7 8 9
GR
IT -3.58 -60.14
ES -9.10 -41.93
FR -2.94 -29.13
SE 3.69 1.41 -9.44
BE 3.87
PT 1.41 1.41
NL -46.31 -49.64
AT -13.48 -6.66 -17.88
UK -115.38 -1.48
SK -7.07 6.17 3.54
CZ -13.69 5.79
DE -28.94 6.84
PL -8.69 3.54 3.54
HU -33.77 -6.66 -7.12
Sample 2: Two-monthly data for 2000:1-2005:6; AT = Austria, BE = Belgium, CZ = Czech Republic, DE = Germany, ES = Spain, FR = France, GR = Greece, HU = Hungary, IT = Italy, NL = Netherlands, PL = Poland, PT = Portugal, SE = Sweden, SK = Slovak Republic, UK = United Kingdom; columns 2-9 provide t-values of b estimates in equation (4) based on Newey-West standard errors; critical values: -1.65 in columns 1-4, 6, 8-9, and 0 in columns 5 and 7. Circled numbers indicate the course of the testing procedure.
The first step of the algorithm involves ordering the price series of individual
countries according to the last observation, XiT. Column 1 of table A4 displays the
countries included in the 2000:1-2005:6 sample in the resulting order with Greece
reporting the most expensive washing machines in 2005:6 and Hungary the cheapest. In
the next step, a core group for a convergence cluster needs to be identified. For this
purpose, the log t test is applied first to the subgroup of the two most expensive
34
countries, Greece and Italy. Column 2 shows the results of such tests in the row of the
second of such two-country subgroups. Given a critical value of -1.65, the null
hypothesis that Greece and Italy belong to the core of a common cluster is rejected with
a computed t-value of -3.58. Greece is thus separated as not belonging to any price
convergence cluster. Column 3 shows the result of log t tests on the hypothesis that the
complementary set of countries, in the present case Italy to Hungary, constitutes a
cluster. This is firmly rejected.
Step 2 of the algorithm is then repeated for the second most expensive country,
Italy, and the third one, Spain. Both of them are found to be isolated in the same way as
Greece. The hypothesis that France and Sweden belong to the core group of a common
cluster, however, cannot be rejected, which is the reason for showing the corresponding
log t test result as the first entry in a separate column, column 4. In such a case, the
algorithm cumulatively adds further countries until the log t test for the whole subgroup
is rejected. In the present case, the first rejection occurs with the addition of the
Netherlands. Then, the maximum of the computed t-values in column 4 identifies the
core group, which is France, Sweden and Belgium.
In step 3 of the algorithm, log t tests are applied to the core group plus each of the
remaining countries added one at a time. Using Monte Carlo studies, Phillips/Sul (2007)
have demonstrated that it is preferable to add a country to the core cluster if the
corresponding result exceeds a critical value of 0. Column 5 shows that only Portugal
fulfills this criterion. A log t test on all of the countries of the proposed cluster confirms,
as is shown in column 8, that price convergence cannot be rejected for this subgroup.14
Column 9 demonstrates that the set of remaining countries does not constitute a
convergence cluster. The last entry in column 2 suggests that the Netherlands do not
belong to any convergence subgroup. The series of countries from Austria to Poland,
however, forms a second multi-country cluster as is shown in columns 6 (step 2 as in
column 4), 7 (step 3 as in column 5) and 8.
14 In the present case, this test is actually redundant since it has been performed already in the course of
step 2 as is shown in column 4 for the cheapest country of the cluster, Portugal. The redundancy stems from the fact that, in step 3, only consecutive countries have been assigned to the cluster. However, this is not a necessary outcome of the algorithm. Nevertheless, a similar redundancy is found for the second multi-country cluster in column 7 and, for both clusters, in column 8.
35
References Allington, N F B, P A Kattuman and F A Waldmann, 2005, One market, one money,
one price?, International Journal of Central Banking, 1 (3), 73-115.
Anderson, J E and E van Wincoop, 2004, Trade costs, Journal of Economic Literature, 42, 691-751.
Asplund, M and R Friberg, 2001, The Law of One Price in Scandinavian duty-free stores, The American Economic Review, 91, 1072-1083.
Breitung, J and S Das, 2005, Panel unit root tests under cross sectional dependence, Statistica Neerlandica, 59, 414-433.
Ceglowski, J, 2003, The law of one price: intranational evidence for Canada, Canadian Journal of Economics, 36, 373-400.
Coakley, J and A-M Fuertes, 2000, Is there a base currency effect in long-run PPP?, International Journal of Finance and Economics, 5, 253-263.
Crucini, M J, C I Telmer and M Zachariadis, 2001, Understanding European real exchange rates, Mimeo.
Crucini, M J, C I Telmer and M Zachariadis, 2005, Understanding European real exchange rates, The American Economic Review, 95, 724-738.
Cuaresma, J C, B Egert and M A Silgoner, 2007, Price level convergence in Europe: did the introduction of the euro matter?, in Oesterreichische Nationalbank, Monetary Policy & the Economy, Q1/07, 100-113.
Engel, C and J H Rogers, 1996, How wide is the border?, The American Economic Review, 86, 1112-1125.
Engel, C and J H Rogers, 2004, European product market integration after the euro, Economic Policy, 19, 347-384.
ECB, 2002, Price level convergence and competition in the euro area, Monthly Bulletin, August 2002, 39-49.
European Commission, 1990, One market, one money: an evaluation of the potential benefits and costs of forming an economic and monetary union, European Economy, 44.
European Commission, 1996, The 1996 single market review: background information for the report to the Council and European Parliament, Commission Staff Working Paper, SEC (96) 2378.
European Commission, 2006, VAT rates applied in the member states of the European Community, DOC/1829/2006.
European Commission, 2008, EMU@10: Successes and challenges after 10 years of Economic and Monetary Union, European Economy, 2/2008.
Faber, R P and A C Stokman, 2005, Price convergence in Europe from a macro perspective: product categories and reliability, DNB Working Paper No 34.
36
Fischer, C, 2007, An assessment of the trends in international price competitiveness among EMU countries, Deutsche Bundesbank Discussion Paper Series 1: Economic Studies, No 08/2007.
Goldberg, P K and F Verboven, 2004, Cross-country price dispersion in the euro era: a case study of the European car market, Economic Policy, 19, 483-521.
Goldberg, P K and F Verboven, 2005, Market integration and convergence to the Law of One Price: evidence from the European car market, Journal of International Economics, 65, 49-73.
Harvey, A and D Bates, 2002, Multivariate unit root tests and testing for convergence, DAE Working Paper No 0301.
Haskel, J and H Wolf, 2001, The Law of One Price – a case study, Scandinavian Journal of Economics, 103, 545-558.
Hill, R J, 2004, Constructing price indexes across space and time: the case of the European Union, The American Economic Review, 94, 1379-1410.
Hodrick, R J and E C Prescott, 1997, Postwar U.S. business cycles: an empirical investigation, Journal of Money, Credit, and Banking, 29, 1-16.
Hoffmann, J, 1998, Problems of inflation measurement in Germany, Deutsche Bundesbank Discussion Paper No 1/98.
IMF, 2008, Implications of new PPP estimates for measuring global growth, World Economic Outlook, April 2008, 43-46.
Jönsson, K, 2005, Cross-sectional dependency and size distortion in a small-sample homogeneous panel data unit root test, Oxford Bulletin of Economics and Statistics, 67, 369-392.
Lutz, M, 2004, Price convergence under EMU? First estimates, in A V Deardorff (ed), The Past, Present and Future of the European Union, Palgrave MacMillan, 48-73.
Mathä, T Y, 2006, The euro and regional price differences of individual products in an integrated cross-border area, Journal of Common Market Studies, 44, 563-580.
Papell, D H and H Theodorides, 2001, The choice of numeraire currency in panel tests of purchasing power parity, Journal of Money, Credit, and Banking, 33, 976-993.
Parsley, D C and S-J Wei, 1996, Convergence to the Law of One Price without trade barriers or currency fluctuations, The Quarterly Journal of Economics, 111, 1211-1236.
Parsley, D C and S-J Wei, 2001, Limiting currency volatility to stimulate goods market integration: a price based approach, NBER Working Paper 8468.
Phillips, P C B and D Sul, 2007, Transition modeling and econometric convergence tests, Econometrica, 75, 1771-1855.
Rogers, J H, 2001, Price level convergence, relative prices, and inflation in Europe, International Finance Discussion Papers No 699.
Rogers, J H, 2007, Monetary union, price level convergence, and inflation: How close is Europe to the USA?, Journal of Monetary Economics, 54, 785-796.

37
Wolszczak-Derlacz, J, 2006, One Europe, one product, two prices – the price disparity in the EU, Katholieke Universiteit Leuven Center for Economic Studies Discussion Paper 06.14.
38
The following Discussion Papers have been published since 2008:
Series 1: Economic Studies
01 2008 Can capacity constraints explain asymmetries of the business cycle? Malte Knüppel 02 2008 Communication, decision-making and the optimal degree of transparency of monetary policy committees Anke Weber 03 2008 The impact of thin-capitalization rules on Buettner, Overesch multinationals’ financing and investment decisions Schreiber, Wamser 04 2008 Comparing the DSGE model with the factor model: an out-of-sample forecasting experiment Mu-Chun Wang 05 2008 Financial markets and the current account – Sabine Herrmann emerging Europe versus emerging Asia Adalbert Winkler 06 2008 The German sub-national government bond Alexander Schulz market: evolution, yields and liquidity Guntram B. Wolff 07 2008 Integration of financial markets and national Mathias Hoffmann price levels: the role of exchange rate volatility Peter Tillmann 08 2008 Business cycle evidence on firm entry Vivien Lewis 09 2008 Panel estimation of state dependent adjustment when the target is unobserved Ulf von Kalckreuth 10 2008 Nonlinear oil price dynamics – Stefan Reitz a tale of heterogeneous speculators? Ulf Slopek 11 2008 Financing constraints, firm level adjustment of capital and aggregate implications Ulf von Kalckreuth

39
12 2008 Sovereign bond market integration: Alexander Schulz the euro, trading platforms and globalization Guntram B. Wolff 13 2008 Great moderation at the firm level? Claudia M. Buch Unconditional versus conditional output Jörg Döpke volatility Kerstin Stahn 14 2008 How informative are macroeconomic risk forecasts? An examination of the Malte Knüppel Bank of England’s inflation forecasts Guido Schultefrankenfeld 15 2008 Foreign (in)direct investment and corporate taxation Georg Wamser 16 2008 The global dimension of inflation – evidence Sandra Eickmeier from factor-augmented Phillips curves Katharina Moll 17 2008 Global business cycles: M. Ayhan Kose convergence or decoupling? Christopher Otrok, Ewar Prasad 18 2008 Restrictive immigration policy Gabriel Felbermayr in Germany: pains and gains Wido Geis foregone? Wilhelm Kohler 19 2008 International portfolios, capital Nicolas Coeurdacier accumulation and foreign assets Robert Kollmann dynamics Philippe Martin 20 2008 Financial globalization and Michael B. Devereux monetary policy Alan Sutherland 21 2008 Banking globalization, monetary Nicola Cetorelli transmission and the lending channel Linda S. Goldberg 22 2008 Financial exchange rates and international Philip R. Lane currency exposures Jay C. Shambaugh
40
23 2008 Financial integration, specialization F. Fecht, H. P. Grüner and systemic risk P. Hartmann 24 2008 Sectoral differences in wage freezes and Daniel Radowski wage cuts: evidence from a new firm survey Holger Bonin 25 2008 Liquidity and the dynamic pattern of Ansgar Belke price adjustment: a global view Walter Orth, Ralph Setzer 26 2008 Employment protection and Florian Baumann temporary work agencies Mario Mechtel, Nikolai Stähler 27 2008 International financial markets’ influence on the welfare performance of alternative exchange rate regimes Mathias Hoffmann 28 2008 Does regional redistribution spur growth? M. Koetter, M. Wedow 29 2008 International financial competitiveness and incentives to foreign direct investment Axel Jochem 30 2008 The price of liquidity: bank characteristics Falko Fecht and market conditions Kjell G. Nyborg, Jörg Rocholl 01 2009 Spillover effects of minimum wages Christoph Moser in a two-sector search model Nikolai Stähler 02 2009 Who is afraid of political risk? Multinational Iris Kesternich firms and their choice of capital structure Monika Schnitzer 03 2009 Pooling versus model selection for Vladimir Kuzin nowcasting with many predictors: Massimiliano Marcellino an application to German GDP Christian Schumacher
41
04 2009 Fiscal sustainability and Balassone, Cunha, Langenus policy implications for the euro area Manzke, Pavot, Prammer Tommasino 05 2009 Testing for structural breaks Jörg Breitung in dynamic factor models Sandra Eickmeier 06 2009 Price convergence in the EMU? Evidence from micro data Christoph Fischer

42
Series 2: Banking and Financial Studies 01 2008 Analyzing the interest rate risk of banks using time series of accounting-based data: O. Entrop, C. Memmel evidence from Germany M. Wilkens, A. Zeisler 02 2008 Bank mergers and the dynamics of Ben R. Craig deposit interest rates Valeriya Dinger 03 2008 Monetary policy and bank distress: F. de Graeve an integrated micro-macro approach T. Kick, M. Koetter 04 2008 Estimating asset correlations from stock prices K. Düllmann or default rates – which method is superior? J. Küll, M. Kunisch 05 2008 Rollover risk in commercial paper markets and firms’ debt maturity choice Felix Thierfelder 06 2008 The success of bank mergers revisited – Andreas Behr an assessment based on a matching strategy Frank Heid 07 2008 Which interest rate scenario is the worst one for a bank? Evidence from a tracking bank approach for German savings and cooperative banks Christoph Memmel 08 2008 Market conditions, default risk and Dragon Yongjun Tang credit spreads Hong Yan 09 2008 The pricing of correlated default risk: Nikola Tarashev evidence from the credit derivatives market Haibin Zhu 10 2008 Determinants of European banks’ Christina E. Bannier engagement in loan securitization Dennis N. Hänsel 11 2008 Interaction of market and credit risk: an analysis Klaus Böcker of inter-risk correlation and risk aggregation Martin Hillebrand
43
12 2008 A value at risk analysis of credit default swaps B. Raunig, M. Scheicher 13 2008 Systemic bank risk in Brazil: an assessment of correlated market, credit, sovereign and inter- bank risk in an environment with stochastic Theodore M. Barnhill, Jr. volatilities and correlations Marcos Rietti Souto 14 2008 Regulatory capital for market and credit risk inter- T. Breuer, M. Jandačka action: is current regulation always conservative? K. Rheinberger, M. Summer 15 2008 The implications of latent technology regimes Michael Koetter for competition and efficiency in banking Tigran Poghosyan 16 2008 The impact of downward rating momentum André Güttler on credit portfolio risk Peter Raupach 17 2008 Stress testing of real credit portfolios F. Mager, C. Schmieder 18 2008 Real estate markets and bank distress M. Koetter, T. Poghosyan 19 2008 Stochastic frontier analysis by means of maxi- Andreas Behr mum likelihood and the method of moments Sebastian Tente 20 2008 Sturm und Drang in money market funds: Stehpan Jank when money market funds cease to be narrow Michael Wedow 01 2009 Dominating estimators for the global Gabriel Frahm minimum variance portfolio Christoph Memmel 02 2009 Stress testing German banks in a Klaus Düllmann downturn in the automobile industry Martin Erdelmeier 03 2009 The effects of privatization and consolidation E. Fiorentino on bank productivity: comparative evidence A. De Vincenzo, F. Heid from Italy and Germany A. Karmann, M. Koetter
44
04 2009 Shocks at large banks and banking sector Sven Blank, Claudia M. Buch distress: the Banking Granular Residual Katja Neugebauer 05 2009 Why do savings banks transform sight deposits into illiquid assets less intensively Dorothee Holl than the regulation allows? Andrea Schertler

45
Visiting researcher at the Deutsche Bundesbank
The Deutsche Bundesbank in Frankfurt is looking for a visiting researcher. Among others under certain conditions visiting researchers have access to a wide range of data in the Bundesbank. They include micro data on firms and banks not available in the public. Visitors should prepare a research project during their stay at the Bundesbank. Candidates must hold a PhD and be engaged in the field of either macroeconomics and monetary economics, financial markets or international economics. Proposed research projects should be from these fields. The visiting term will be from 3 to 6 months. Salary is commensurate with experience. Applicants are requested to send a CV, copies of recent papers, letters of reference and a proposal for a research project to: Deutsche Bundesbank Personalabteilung Wilhelm-Epstein-Str. 14 60431 Frankfurt GERMANY