Embed Size (px)
Citation preview

Price and Promotion in Western Europe Encouraging signs of recovery
Tim EalesDirector of Strategic Insights, IRI
October 2015
www.IRIworldwide.com
SPECIAL REPORT
2
SPECIAL REPORTPRICE AND PROMOTION IN WESTERN EUROPE
Agenda
Executive summary: the only thing consistent is inconsistency
Key findings
Is promotion starting to reach unsustainable levels?
Price increases: do manufacturers dare raise prices?
Falling promotions, rising sales
Non-food outperforms food
Category focus: alcohol and household
About the report
Resources
Country by Country Review
The United Kingdom
France
Spain
Italy
Germany
Greece
i
3
SPECIAL REPORTPRICE AND PROMOTION IN WESTERN EUROPE
Executive summary: the only thing consistent is inconsistency
It is getting increasingly difficult to predict how
consumers are going to react to changes in price and
promotions. Whilst during recessionary times it is
generally easy to forecast how shoppers may respond to
price changes or promotional behavior, as most European
markets recover, behaviour – from retailers, manufacturers
and consumers alike – is getting more unpredictable than
ever.
In France, we have seen that shoppers have taken the
opportunity of lower prices on national brands to select
more premium products, whilst in the United Kingdom
(UK) shoppers have taken the opportunity to lower the
overall price of their weekly shopping basket.
This phenomenon is detailed in IRI's report ‘Price and
Promotion in Western Europe: Encouraging Signs of
Recovery’.
We are seeing some trends change since last year for fast
moving consumer goods (FMCG) products, which remain
very moderate despite an economic recovery in many
countries. In this report, half of the countries measured –
the UK, Spain and Greece – are reporting value sales
declines across food and drinks categories. We are seeing
a similar pattern in non-food, which is the main change
versus a year ago – although here growth is seen in
France, Spain and Germany, while Italy, Greece and the
UK are seeing declines. Trends are pointing towards a
return to less-essential purchases that consumers had
previously moved away from, as economies continue to
improve across Europe.
When the food and non-food sectors are broken down
further, there is also great flux in the market, with
individual product groups showing varying degrees of
growth and decline across Europe. Still, overall value grew
for all product groups (+0.6% total Europe), despite being
low for many, particularly for the three big food sectors:
ambient, chilled and frozen.
While economies and value sales may be recovering,
prices are not. This year’s figures show that prices across
Europe for non-food products hardly saw any change, up
just 0.1% on volume price, while food saw only a 0.3% rise.
For the average shopper therefore, there has been very
little impact on the overall price of the shopping basket.
The price wars that are taking place around the region
(particularly in the UK, France, Greece and Spain) are
causing food prices to fall, but this is not necessarily
leading to sales improvement. Instead, sales still seem to
correlate to those areas in which promotions are
happening, showing once again that European shoppers
continue to be influenced by promotions.
Across Europe, promotional activity has remained fairly
static, and the UK continues to demonstrate the highest
level of promotional activity. The UK is providing a
valuable case study as to the impact of promotions on
sales.
4
SPECIAL REPORTPRICE AND PROMOTION IN WESTERN EUROPE
• Taken as a whole across countries measured, total food
and non-food value sales increased up 0.6%, while
sales by volume rose 0.3%. The strongest growth
happening in Germany where the value of sales for
food and non-food have each grown by 3.4%, or 2.3
billion euros.
• Food sales are up, both in terms of value and volume.
However, increases are minimal. Value sales rose 0.5 to
€276.3 billion, while volume rose 0.2%. The UK, Spain
and Greece witnessed heaviest losses.
• Non-food is back to growth, with value up 0.7%
(€64.2 billion) and volume up 0.6%. Growth spanned
France, Spain and Germany. Non-food sales fell across
Greece and Italy (grocery value fell 2.5% in both
countries), as well as the UK.
• Prices across Europe for non-food products hardly saw
any change, up just 0.1% on volume price, while food
saw only a 0.3% rise.
• Individual product groups are displaying various
degrees of growth and decline across Europe. Overall,
value grew for all product groups, despite it being low
for many.
• Volume sales declined or were relatively static in Italy,
Greece and the UK (where every category has been
impacted).
• Overall across Europe, drinks (both alcoholic and non-
alcoholic), frozen food and pet food & pet care,
showed volume declines, whereas all others increased.
• Some categories have seen significant price rises.
Alcoholic drinks, for example, showed a 2.6% rise
in prices. This led to a 1.2% volume sales decline
for the year. In Germany, for example, there is more
premiumisation, leading to increasing sales for brands
and higher priced products but lower sales across
private label.
• Promotional activity was fairly static, with the
proportion of product sales on promotion only
increasing by 0.5 share point during last year, to
28.7%, for food. Non-food promotional activity was
static (+0.1 share point) at 28.1% across Europe. This
equates to only a 0.4 share point rise year-on-year.
Key findings
5
SPECIAL REPORT
In 2014, the proportion of volume sales accounted for by
trade promotions across Europe rose by 0.2 share point, but
volume sales fell 0.7%. For 2015, promotional activity
followed a similar pattern, rising slightly faster 0.4 share
point. More than one-quarter of sales volume (28.6%) is now
sold on promotion. Whereas in 2014, sales volumes
fell by 0.7%, this year they increased 0.3%. The fact that
promotional volume, for a second year, has outstripped sales
volume growth is worrisome and shows that promotional
activity may not actually be working. Whether such levels are
sustainable or not remains to be seen.
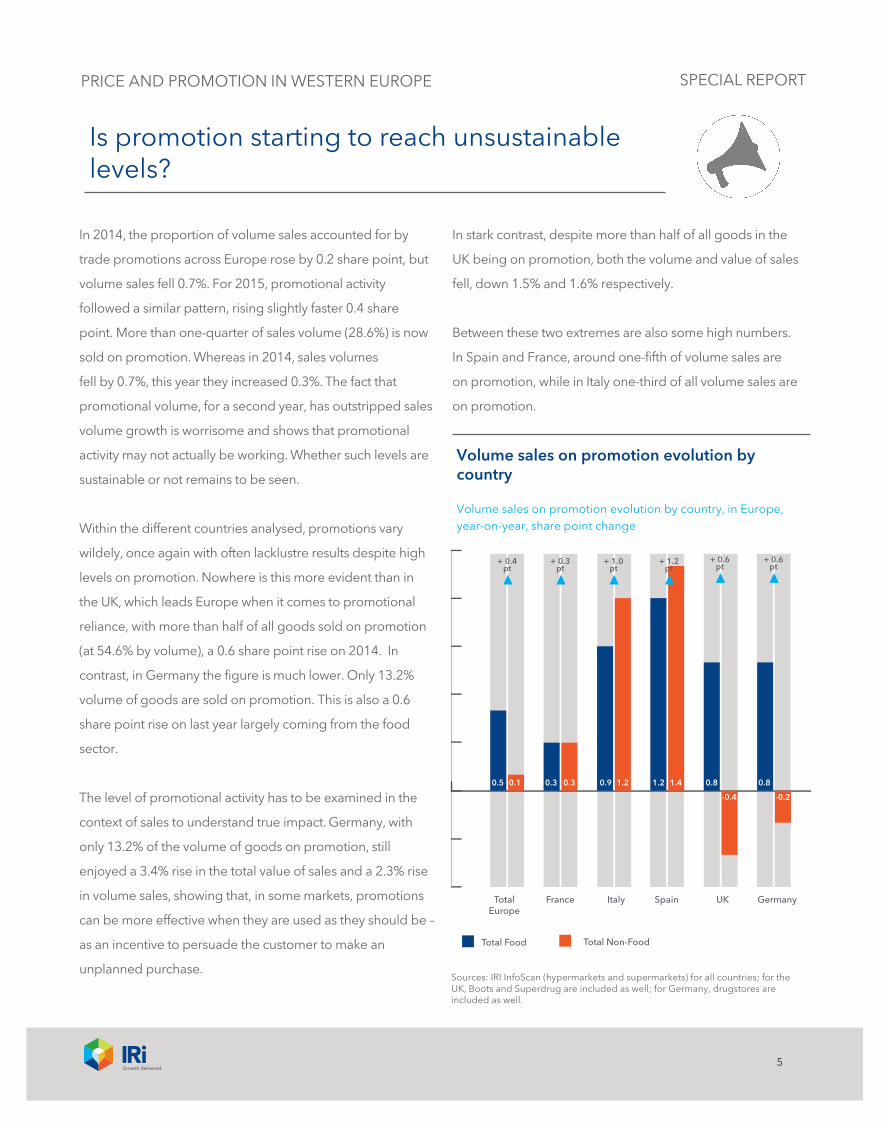
Within the different countries analysed, promotions vary
wildely, once again with often lacklustre results despite high
levels on promotion. Nowhere is this more evident than in
the UK, which leads Europe when it comes to promotional
reliance, with more than half of all goods sold on promotion
(at 54.6% by volume), a 0.6 share point rise on 2014. In
contrast, in Germany the figure is much lower. Only 13.2%
volume of goods are sold on promotion. This is also a 0.6
share point rise on last year largely coming from the food
sector.
The level of promotional activity has to be examined in the
context of sales to understand true impact. Germany, with
only 13.2% of the volume of goods on promotion, still
enjoyed a 3.4% rise in the total value of sales and a 2.3% rise
in volume sales, showing that, in some markets, promotions
can be more effective when they are used as they should be –
as an incentive to persuade the customer to make an
unplanned purchase.
In stark contrast, despite more than half of all goods in the
UK being on promotion, both the volume and value of sales
fell, down 1.5% and 1.6% respectively.
Between these two extremes are also some high numbers.
In Spain and France, around one-fifth of volume sales are
on promotion, while in Italy one-third of all volume sales are
on promotion.
Is promotion starting to reach unsustainable levels?
Volume sales on promotion evolution by country
Volume sales on promotion evolution by country, in Europe, year-on-year, share point change
Total Europe
France Italy Spain UK Germany
0.5 0.1 0.3 0.3 0.9 1.2 1.2 1.4 0.8 0.8
-0.4 -0.2
+ 0.4pt
+ 0.3pt
+ 1.0pt
+ 1.2pt
+ 0.6pt
+ 0.6pt
Total Food Total Non-Food
Sources: IRI InfoScan (hypermarkets and supermarkets) for all countries; for the UK, Boots and Superdrug are included as well; for Germany, drugstores are included as well.
PRICE AND PROMOTION IN WESTERN EUROPE

6
SPECIAL REPORT
Is promotion starting to reach unsustainable levels?
For some markets, such as Italy, promotions have been
necessary in order to boost short-term sales. Still, last year’s
report showed that promotions don’t always translate
directly into sales and this is a pattern that has continued this
year as well. However, during 2015 things in Italy are
changing for the better. Across all retail channels monitored
by IRI, promotional pressure in Italy is less intensive and it
has been decreasing steadily since the beginning of the
year.
Where promotional levels are high but not working as they
should, manufacturers risk losing margin, especially when
the cost of running such promotions is taken into account. If
the UK’s particular reliance on promotional activity continues
in 2015, as it did in 2014, it will signify worrisome pattern
of behaviour has emerged. Manufacturers could find
hard to recover, since such high levels of promotional
activity will become further ingrained into the psyche of
shoppers. Manufacturers will need to work exceedingly hard
to re-educate consumers about having a more sustainable
balance between promotion and standard prices. Other
markets must take note.
Volume sales on promotion by country, food versus non-food
Volume sales on promotion by country for food and non-food in Europe, year-on-year, in %
28.7
Total Europe
France Italy Spain UK Germany
28.1 19.3 20.6 33.9 32.2 21.4 19.6 53.7 58.4 14.3 8.6
Sources: IRI InfoScan (hypermarkets and supermarkets) for all countries; for the UK, Boots and Superdrug are included as well; for Germany, drugstores are included as well.
Total Food Total Non-Food
28.7
PRICE AND PROMOTION IN WESTERN EUROPE
7
SPECIAL REPORT
The impact of promotional activity failing to make
any real mark upon sales volumes begs the question
of what manufacturers can do to change consumer
behaviour, since they cannot afford to repeat the high
ratio of promotions seen in the UK. Manufacturers are
playing a losing game, particularly since retailer
competition is driving down prices. This poses a very
serious threat to manufacturers’ longevity, especially when
the cost of such promotional activity is taken into account
too.
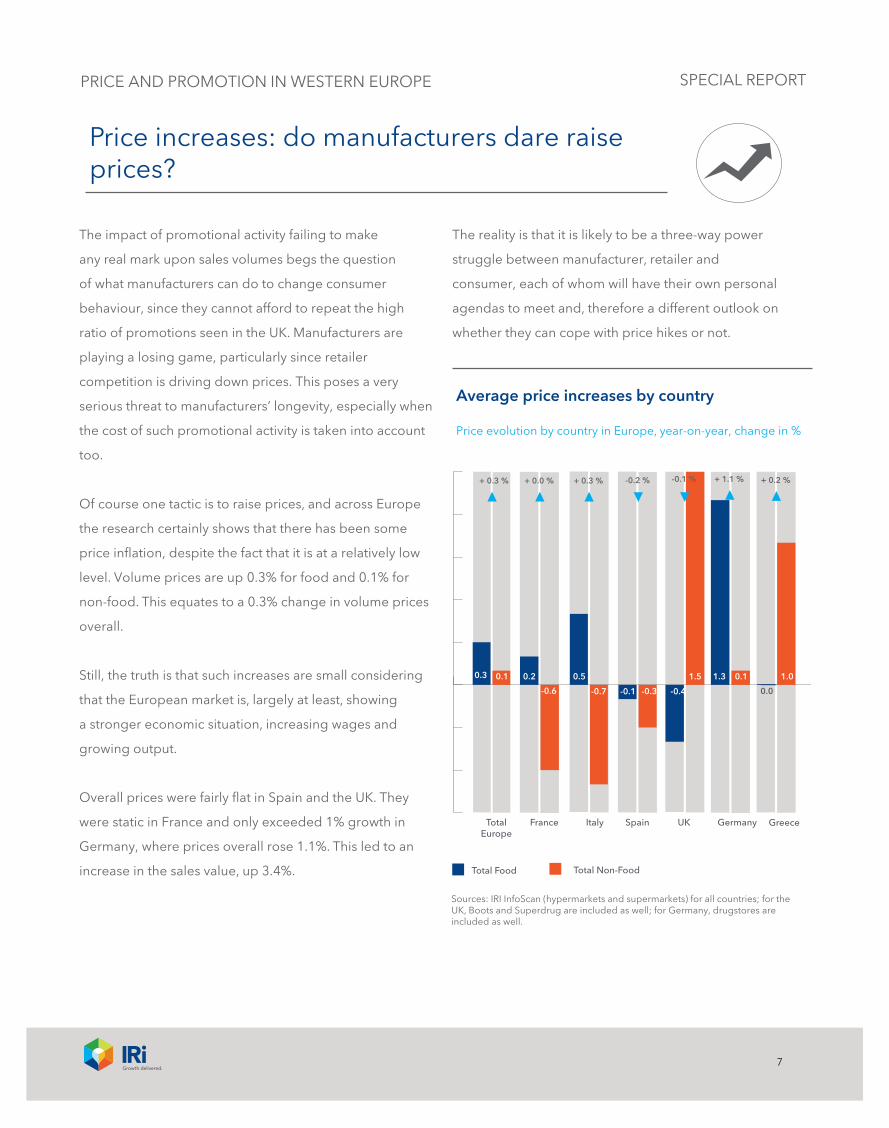
Of course one tactic is to raise prices, and across Europe
the research certainly shows that there has been some
price inflation, despite the fact that it is at a relatively low
level. Volume prices are up 0.3% for food and 0.1% for
non-food. This equates to a 0.3% change in volume prices
overall.
Still, the truth is that such increases are small considering
that the European market is, largely at least, showing
a stronger economic situation, increasing wages and
growing output.
Overall prices were fairly flat in Spain and the UK. They
were static in France and only exceeded 1% growth in
Germany, where prices overall rose 1.1%. This led to an
increase in the sales value, up 3.4%.
The reality is that it is likely to be a three-way power
struggle between manufacturer, retailer and
consumer, each of whom will have their own personal
agendas to meet and, therefore a different outlook on
whether they can cope with price hikes or not.
Price increases: do manufacturers dare raise prices?
Average price increases by country
Price evolution by country in Europe, year-on-year, change in %
Total Food Total Non-Food
Total Europe
France Italy Spain UK Germany Greece
0.3 0.1 0.2
-0.6
0.5
-0.7 -0.1 -0.3 -0.4
1.5 1.3 0.1 1.0
0.0
+ 0.3 % + 0.0 % + 0.3 % -0.2 % -0.1 % + 1.1 % + 0.2 %
Sources: IRI InfoScan (hypermarkets and supermarkets) for all countries; for the UK, Boots and Superdrug are included as well; for Germany, drugstores are included as well.
PRICE AND PROMOTION IN WESTERN EUROPE
8
SPECIAL REPORT
Across categories there have been varying reactions to
rising prices. In Europe, a 2.6% increase in the volume
price of alcoholic drinks, for example – the biggest increase
across all categories measured in the report – led to a 1.5%
rise in the value of sales but a 1.1% fall in volume.
In confectionery meanwhile, a 1.6% rise in the volume price
(the second biggest category rise) led to a 1.7% rise in the
value of sales, but also a nominal increase in the volume of
sales, albeit by only 0.1%.
This trend is evidenced across some of the individual
markets. In the UK for example, a 3.2% rise in the volume
price for alcohol brought a 0.4% rise in the value of sales,
despite a 2.8% fall in volume.
In Germany there have been significant price rises across
all but two categories (chilled and fresh food and personal
care) being the exceptions, and yet in all but one instance
both value and volume of sales have risen.
Whether manufacturers can effectively manage price rises
in such a volatile market is somewhat risky. To have a hope
of being successful in doing so requires both brand
strength and market support. More success is likely in the
increasing popularity of round pound/Euro offers, which
once again this year are increasingly evident.
Price increases: do manufacturers dare raise prices?
The fastest increase in price was alcoholic drinks at 2.6%. It drove 1.5% improvement in value sales but volume sales declined, falling by 1.1%.
PRICE AND PROMOTION IN WESTERN EUROPE
9
SPECIAL REPORT
As IRI’s research has identified, in most instances, trade
promotion is driving sales, but not always growth. Still, this
year’s report shows that some categories buck the trend
when it comes to promotions turning into sales.
This is the case in a number of categories across Europe
– including personal care, household and pet food & pet
care. This trio of categories all registered either very small
rises or declines in promotional activity, with personal care
and household both up 0.1 share point and pet food & pet
care registering a 0.1 share point decline in promotional
activity. Yet, all managed growth in sales value, which for
household at least, outpaced inflation.
This is a phenomenon that is further exaggerated across
different countries and within the different categories. In
Germany, for example, promotional activity by volume grew
only 0.2 share point for household and non-alcoholic drinks,
and yet the value of sales grew substantially and above that
of price too. In household for example, the value of sales
rose by 5.4% despite a 0.7% price rise. For non-alcoholic
drinks, the value of sales increase was also high (+4.5%)
although prices rose only 3.7%.
In Italy the decline of promotional pressure was stronger for
the branded products than private labels. At the same time
branded products are growing more than private labels in
the larger part of the categories.
Average price rises are being held low and promotion levels
have increased, as retailers continue to battle for share with
price wars, mainly affecting the big food categories in
Falling promotions, rising sales
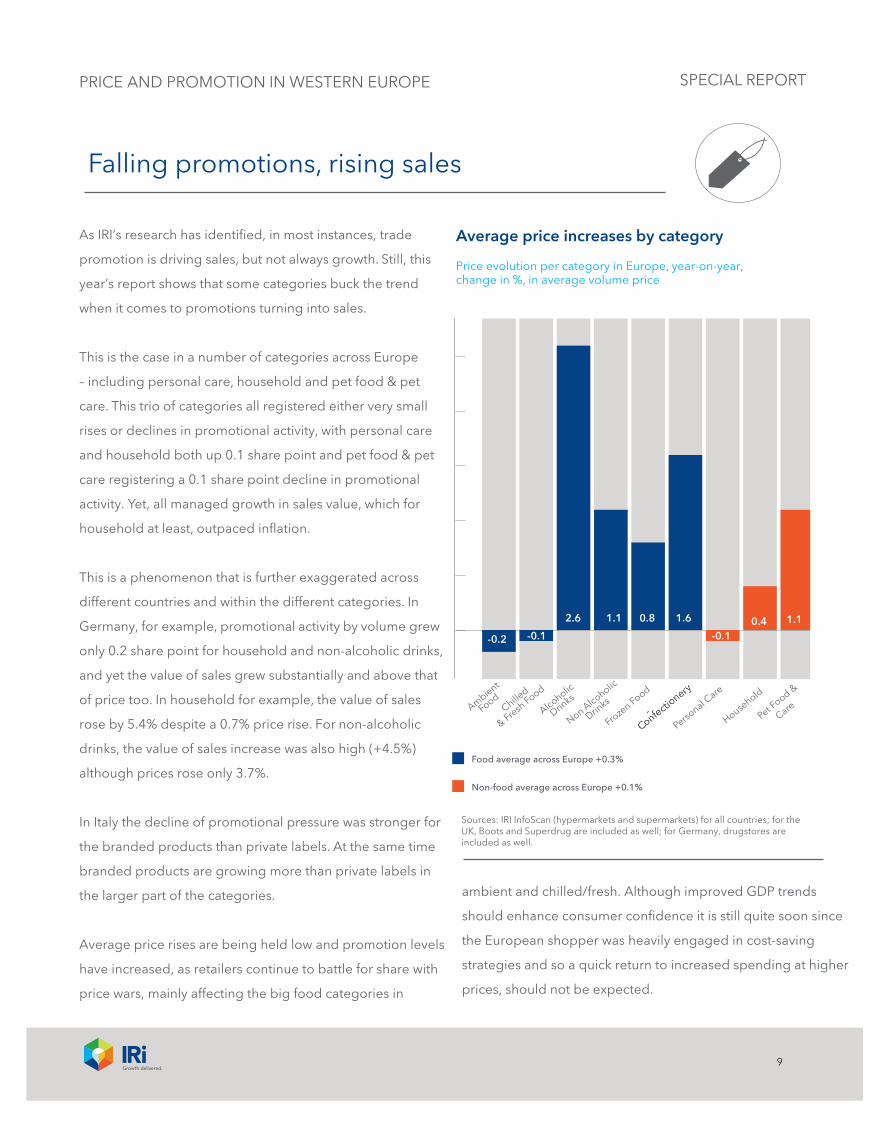
Average price increases by category
Price evolution per category in Europe, year-on-year, change in %, in average volume price
-0.2 -0.1
2.6 1.1 0.8 1.6
-0.10.4 1.1
Alcoholic
Drinks
Ambient
FoodChille
d
& Fresh Food
Confectionary
Froze
n Food
Non Alcoholic
Drinks
Household
Personal C
are
Pet Food &
Care
Food average across Europe +0.3%
Non-food average across Europe +0.1%
PRICE AND PROMOTION IN WESTERN EUROPE
Sources: IRI InfoScan (hypermarkets and supermarkets) for all countries; for the UK, Boots and Superdrug are included as well; for Germany, drugstores are included as well.
ambient and chilled/fresh. Although improved GDP trends
should enhance consumer confidence it is still quite soon since
the European shopper was heavily engaged in cost-saving
strategies and so a quick return to increased spending at higher
prices, should not be expected.
10
SPECIAL REPORT
In times of recession and economic crisis, it is only natural
that sales growth comes in necessities, such as food,
rather than less essential products. However, this year’s
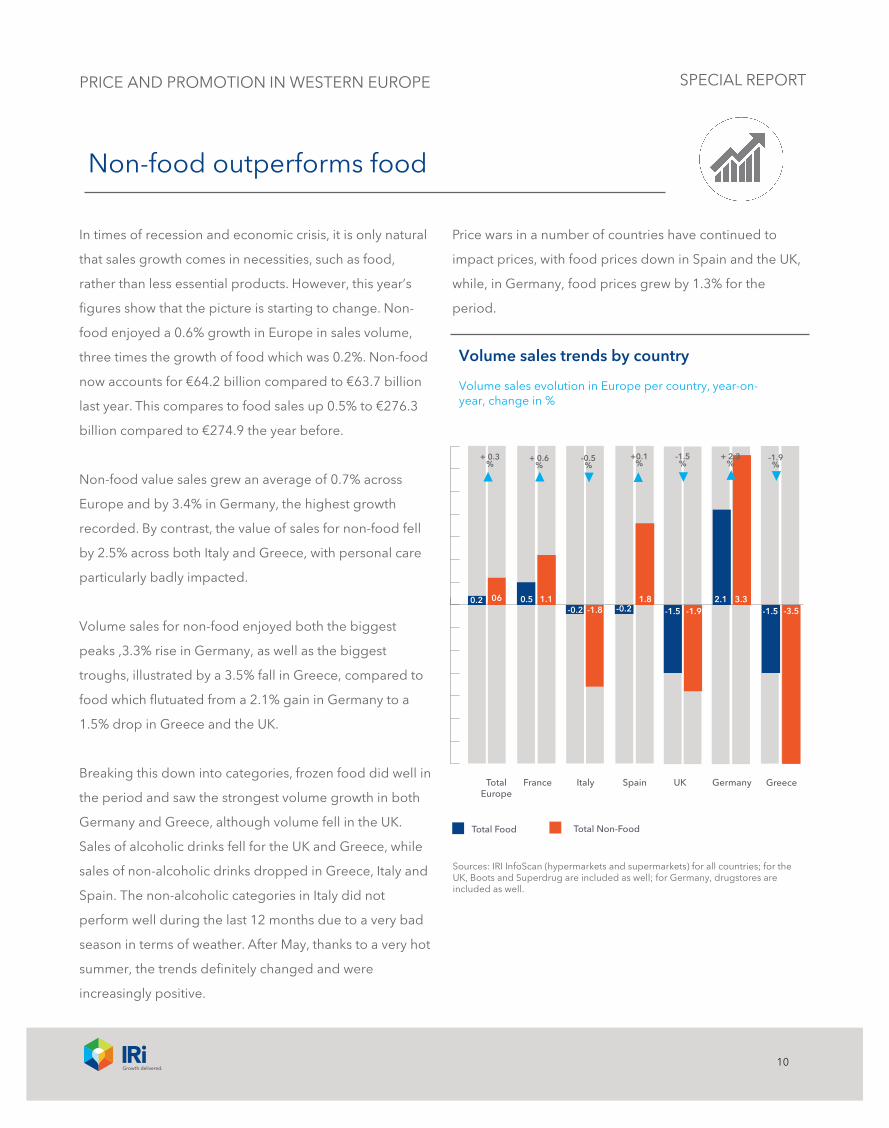
figures show that the picture is starting to change. Non-
food enjoyed a 0.6% growth in Europe in sales volume,
three times the growth of food which was 0.2%. Non-food
now accounts for €64.2 billion compared to €63.7 billion
last year. This compares to food sales up 0.5% to €276.3
billion compared to €274.9 the year before.
Non-food value sales grew an average of 0.7% across
Europe and by 3.4% in Germany, the highest growth
recorded. By contrast, the value of sales for non-food fell
by 2.5% across both Italy and Greece, with personal care
particularly badly impacted.
Volume sales for non-food enjoyed both the biggest
peaks ,3.3% rise in Germany, as well as the biggest
troughs, illustrated by a 3.5% fall in Greece, compared to
food which flutuated from a 2.1% gain in Germany to a
1.5% drop in Greece and the UK.
Breaking this down into categories, frozen food did well in
the period and saw the strongest volume growth in both
Germany and Greece, although volume fell in the UK.
Sales of alcoholic drinks fell for the UK and Greece, while
sales of non-alcoholic drinks dropped in Greece, Italy and
Spain. The non-alcoholic categories in Italy did not
perform well during the last 12 months due to a very bad
season in terms of weather. After May, thanks to a very hot
summer, the trends definitely changed and were
increasingly positive.
Price wars in a number of countries have continued to
impact prices, with food prices down in Spain and the UK,
while, in Germany, food prices grew by 1.3% for the
period.
Volume sales trends by country
Volume sales evolution in Europe per country, year-on-year, change in %
Non-food outperforms food
Total Food Total Non-Food
Total Europe
France Italy Spain UK Germany Greece
0.2 06 0.5 1.1-0.2 -1.8 -0.2
1.8-1.5 -1.9
2.1 3.3-3.5-1.5
+ 0.3%
+ 0.6%
-0.5%
+0.1%
-1.5%
+ 2.3%
-1.9%
Sources: IRI InfoScan (hypermarkets and supermarkets) for all countries; for the UK, Boots and Superdrug are included as well; for Germany, drugstores are included as well.
PRICE AND PROMOTION IN WESTERN EUROPE
11
SPECIAL REPORT
Although steep price increases in some categories pushed
value growth, volumes declined for categories, including
alcoholic drinks and frozen foods, which fell 1.1% and
0.6%, respectively. Marginal growth was seen in ambient
food and chilled & fresh food, 0.4% and 0.3%,
respectively. Confectionery volume was near static, up
only 0.1% on last year.
Across non-food, household sales grew significantly
across Europe, up by 0.9% in volume - three times the
growth of personal care (0.3%). Pet food & pet care
volume sales meanwhile fell, down 0.2%.
Although the personal care category grew strongly in
Germany, where it saw 3.3% sales volume growth, it
declined in Italy, the UK and Greece – the latter saw an
8.0% slide in the volume of sales after volume prices rose
4.0% for the period. Italy recovered somewhat from
January 2015, especially when also taking into account
specialised channels, such as drugstores.
Both food and non-food were heavily promoted in the UK
and Italy, with the UK having 53.7% volume sales
on promotion for food in 2015 compared to 58.4% for
non-food. At the other end of the scale Germany saw
14.3% of volume on promotion for food and only 8.6% for
non-food.
Non-food outperforms food
Volume trends are starting to change: non-food enjoyed a volume growth rate three times faster than food.
PRICE AND PROMOTION IN WESTERN EUROPE
12
SPECIAL REPORT
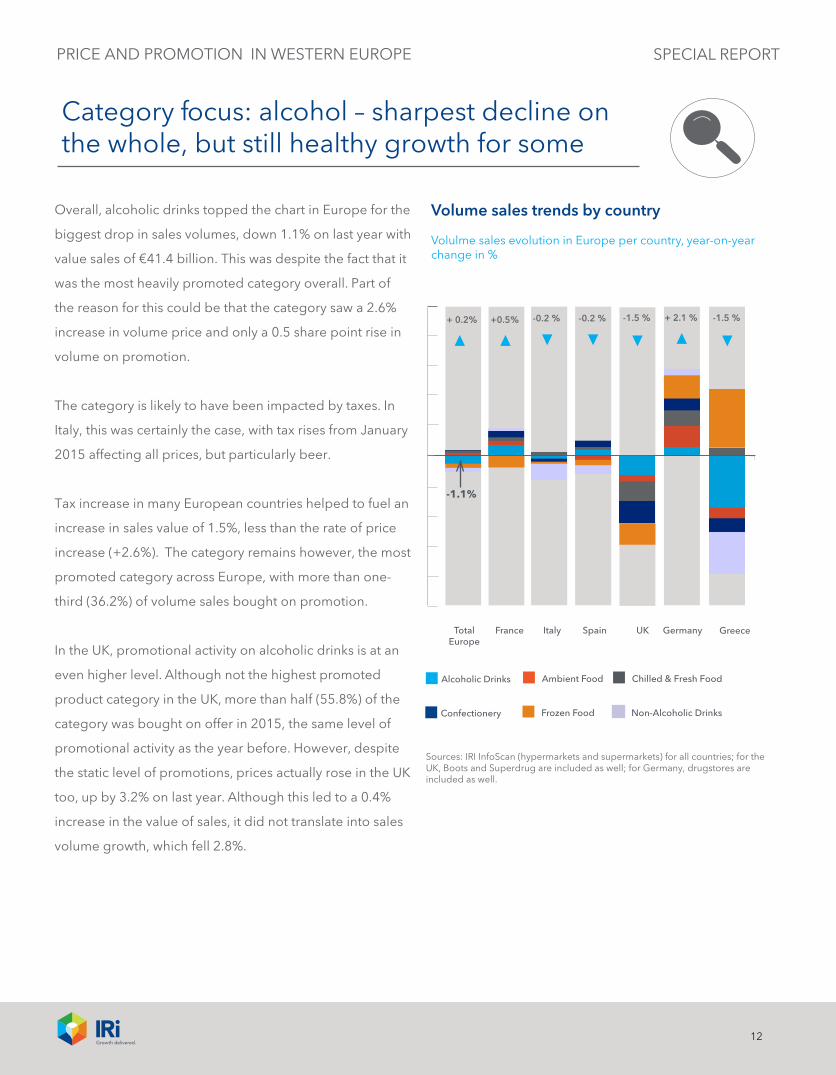
Overall, alcoholic drinks topped the chart in Europe for the
biggest drop in sales volumes, down 1.1% on last year with
value sales of €41.4 billion. This was despite the fact that it
was the most heavily promoted category overall. Part of
the reason for this could be that the category saw a 2.6%
increase in volume price and only a 0.5 share point rise in
volume on promotion.
The category is likely to have been impacted by taxes. In
Italy, this was certainly the case, with tax rises from January
2015 affecting all prices, but particularly beer.
Tax increase in many European countries helped to fuel an
increase in sales value of 1.5%, less than the rate of price
increase (+2.6%). The category remains however, the most
promoted category across Europe, with more than one-
third (36.2%) of volume sales bought on promotion.
In the UK, promotional activity on alcoholic drinks is at an
even higher level. Although not the highest promoted
product category in the UK, more than half (55.8%) of the
category was bought on offer in 2015, the same level of
promotional activity as the year before. However, despite
the static level of promotions, prices actually rose in the UK
too, up by 3.2% on last year. Although this led to a 0.4%
increase in the value of sales, it did not translate into sales
volume growth, which fell 2.8%.
PRICE AND PROMOTION IN WESTERN EUROPE
Category focus: alcohol – sharpest decline on the whole, but still healthy growth for some
Sources: IRI InfoScan (hypermarkets and supermarkets) for all countries; for the UK, Boots and Superdrug are included as well; for Germany, drugstores are included as well.
Volume sales trends by country
Volulme sales evolution in Europe per country, year-on-yearchange in %
+ 0.2% +0.5% -0.2 % -0.2 % -1.5 % + 2.1 % -1.5 %
Total Europe
France Italy Spain UK Germany Greece
Alcoholic Drinks
Confectionery
Ambient Food
Frozen Food
Chilled & Fresh Food
Non-Alcoholic Drinks
-1.1%
13
SPECIAL REPORT
The sharpest fall for the category occurred in Greece,
which saw a massive 7.3% fall in alcoholic drinks sales with
sales by total value down 6.4%. This is attribuable to a
combination of taxes and customer austerity measures.
The fall in sales volume was second only to personal care,
which saw an 8.0% drop in Greece. The decline was also
despite manufacturers and retailers working hard on
prompting customers to buy after promotional activity
rose by 5.3 share points change to 25.8% in 2015.
By contrast, both France and Germany saw healthy growth
in sales of alcoholic drinks. In France, volume grew 1.5 and
value grew 2.0% on a promotional ratio that, at 22.2%,
was more than half that of the UK and had only risen 0.3
share point sales on last year.
In Germany, the volume of sales rose by 1.3% with a
3.0% rise in the value after a 1.8% rise in prices.
Promotional activity for Germany was up 1.5 share point
to 22.8% for 2015.
It certainly seems that there is a mixed thirst for alcoholic
drinks across Europe, as some save their money and buy
through grocery chains to save going out, while other
consumers forgo the category altogether.
Category focus: alcohol – sharpest declines on the whole, but still healthy growth for some
Alcoholic drinks is the most promoted category in Europe, with 36.2% of volume sales on promotion.
PRICE AND PROMOTION IN WESTERN EUROPE
14
SPECIAL REPORTPRICE AND PROMOTION IN WESTERN EUROPE
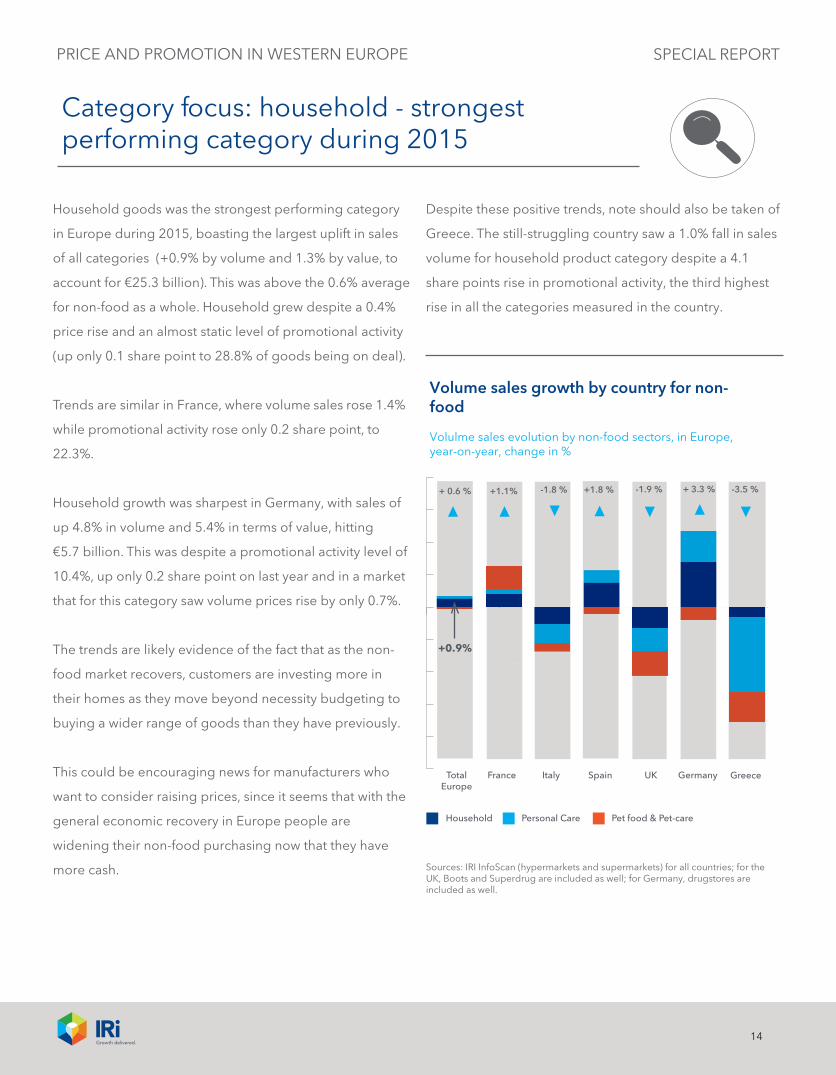
Household goods was the strongest performing category
in Europe during 2015, boasting the largest uplift in sales
of all categories (+0.9% by volume and 1.3% by value, to
account for €25.3 billion). This was above the 0.6% average
for non-food as a whole. Household grew despite a 0.4%
price rise and an almost static level of promotional activity
(up only 0.1 share point to 28.8% of goods being on deal).
Trends are similar in France, where volume sales rose 1.4%
while promotional activity rose only 0.2 share point, to
22.3%.
Household growth was sharpest in Germany, with sales of
up 4.8% in volume and 5.4% in terms of value, hitting
€5.7 billion. This was despite a promotional activity level of
10.4%, up only 0.2 share point on last year and in a market
that for this category saw volume prices rise by only 0.7%.
The trends are likely evidence of the fact that as the non-
food market recovers, customers are investing more in
their homes as they move beyond necessity budgeting to
buying a wider range of goods than they have previously.
This couId be encouraging news for manufacturers who
want to consider raising prices, since it seems that with the
general economic recovery in Europe people are
widening their non-food purchasing now that they have
more cash.
Despite these positive trends, note should also be taken of
Greece. The still-struggling country saw a 1.0% fall in sales
volume for household product category despite a 4.1
share points rise in promotional activity, the third highest
rise in all the categories measured in the country.
Category focus: household - strongest performing category during 2015
Sources: IRI InfoScan (hypermarkets and supermarkets) for all countries; for the UK, Boots and Superdrug are included as well; for Germany, drugstores are included as well.
Household Personal Care Pet food & Pet-care
Volume sales growth by country for non-food
Volulme sales evolution by non-food sectors, in Europe, year-on-year, change in %
+ 0.6 % +1.1% -1.8 % +1.8 % -1.9 % + 3.3 % -3.5 %
Total Europe
France Italy Spain UK Germany Greece
+0.9%
15
SPECIAL REPORT
About the report
This report contains data gathered from six countries in Europe: France, Italy, Spain, the UK, Germany and
Greece. The data has been sourced from IRI Infoscan® retail databases; 52 weeks ending May 2015 versus the
same period prior year.
Macro-categories analysed: chilled & fresh food, ambient food, frozen food, non-alcoholic drinks (including
tea and coffee), household, personal care, confectionery, pet food & pet care and alcoholic drinks (note: does
not include wine and spirits for the UK; Greece includes beer and ouzo only).
The market channels used for each country in this report are as follows:
Country Channels used
UK Hypermarkets, supermarkets (including Boots and Superdrug)
Spain Hypermarkets and supermarkets
Greece Hypermarkets and supermarkets
Germany Hypermarkets, supermarkets and drugstores
Italy Hypermarkets and supermarkets
France Hypermarkets and supermarkets
PRICE AND PROMOTION IN WESTERN EUROPE
16
SPECIAL REPORT
Resources
Copyright © 2015 Information Resources, Inc. (IRI). All rights reserved. IRI, the IRI logo and the names of IRI products and services referenced herein are either trademarks or registered trademarks of IRI. All other trademarks are the property of their respective owners.
If you have enjoyed this report, you may be interested in the following IRI solutions, which
provide customisable insights:
IRI Global Executive Market Reviews (IRI GEMs) give fast moving consumer goods
manufacturers and retailers access to POS-based information outside of their home country. This
solution is ideal for exploring new market opportunities, to understand the players and products
in countries where you don’t yet have a presence. This is also valuable for understanding new or
adjacent categories in foreign markets. IRI GEMs are based on the retail census data IRI collects
from grocery, drug and other available FMCG retailers across countries. Information is available
from the United States, the UK, France, Germany, Spain, Italy, the Netherlands, Greece, Puerto
Rico, Australia, New Zealand and Japan.
IRI Price & Promo models provide a global analytical solution for all revenue management
needs. They enable both retailers and manufacturers to get fast and in-depth category insights
on key price and promotional levers, to understand their respective impacts on the portfolio,
allowing full return on investment analyses, identifying growth opportunities, and enhancing
overall bottom line.
Why only with IRI?
Faster: You get answers in seconds not days or weeks. Leveraging IRI’s Liquid Modelling and IRI's Liquid Data capabilities, only IRI can deliver highly responsive, interactice capabilities in near real-time.
More Accurate: Because errors can have significant consequences. Proprietary IRI algorithms and advanced prescriptive analytic methodologies identify and quantify opportunities and recommend specific actions.
Proven: Built on the basis of three decades of unique IRI expertise on the largest set of integrated data for FMCG and retail.
Trusted: Working with 95% of CPG, retail and health and beauty companies in the Fortune 500.
Certified: The biggest and fastest growing marketing analytics centre in the world, located in Europe and ISO certified.
FOR MORE INFORMATIONplease contact your IRI Consultant
or send an email to [email protected]
PRICE AND PROMOTION IN WESTERN EUROPE
17
SPECIAL REPORT
Country by Country Review
PRICE AND PROMOTION IN WESTERN EUROPE
18
SPECIAL REPORT
The United Kingdom
products within promoted categories may see barely
any sales when off promotion compared to huge uplifts
when on. Manufacturers must do more to try to get to a
more consistent price structure.
Alcoholic
Drinks
Ambient
FoodChille
d
& Fresh Food
Confectionary
Froze
n Food
Non Alcoholic
Drinks
Household
Personal C
are
Pet Food &
Care
1.6
-0.9
0.01.1 1.9 2.3 0.4
-0.9 -1.5
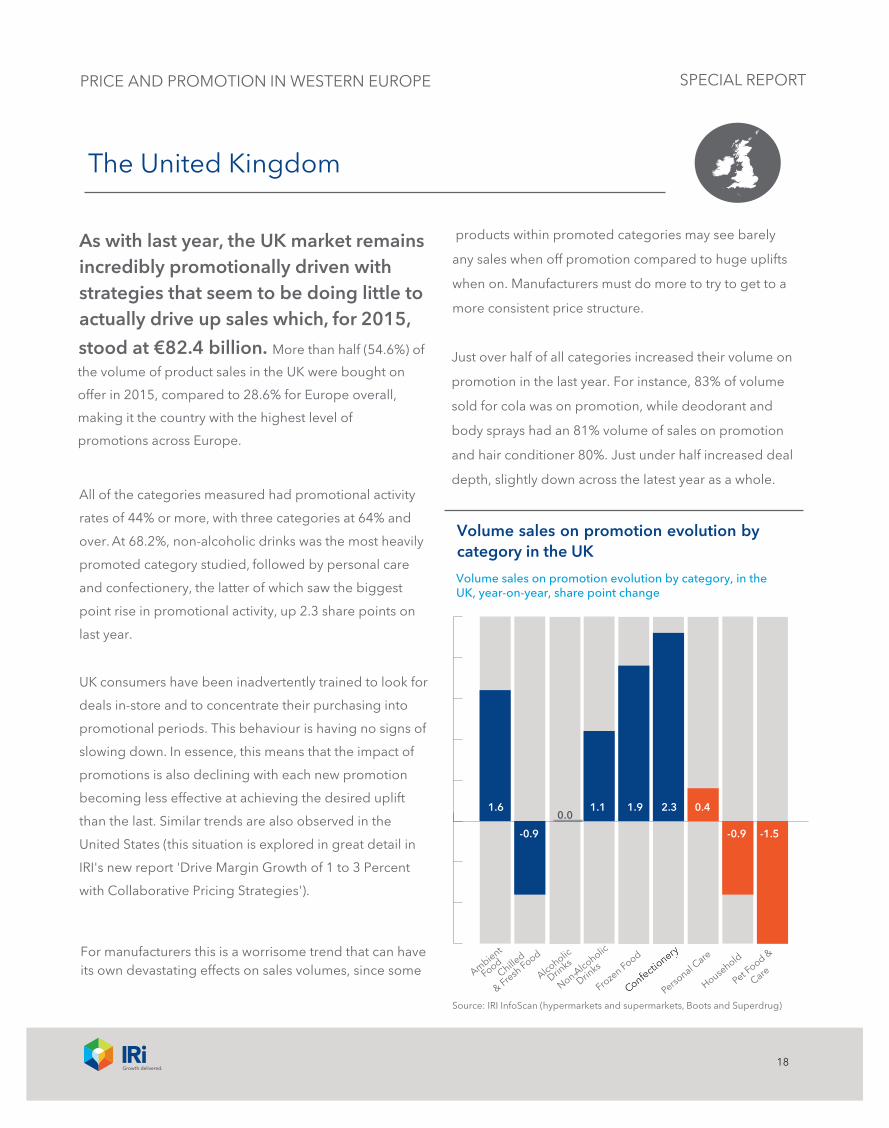
Source: IRI InfoScan (hypermarkets and supermarkets, Boots and Superdrug)
Volume sales on promotion evolution by category in the UK
Volume sales on promotion evolution by category, in the UK, year-on-year, share point change
-
PRICE AND PROMOTION IN WESTERN EUROPE
As with last year, the UK market remains incredibly promotionally driven with strategies that seem to be doing little to actually drive up sales which, for 2015,
stood at €82.4 billion. More than half (54.6%) of Just over half of all categories increased their volume on
promotion in the last year. For instance, 83% of volume
sold for cola was on promotion, while deodorant and
body sprays had an 81% volume of sales on promotion
and hair conditioner 80%. Just under half increased deal
depth, slightly down across the latest year as a whole.
the volume of product sales in the UK were bought on
offer in 2015, compared to 28.6% for Europe overall,
making it the country with the highest level of
promotions across Europe.
All of the categories measured had promotional activity
rates of 44% or more, with three categories at 64% and
over. At 68.2%, non-alcoholic drinks was the most heavily
promoted category studied, followed by personal care
and confectionery, the latter of which saw the biggest
point rise in promotional activity, up 2.3 share points on
last year.
UK consumers have been inadvertently trained to look for
deals in-store and to concentrate their purchasing into
promotional periods. This behaviour is having no signs of
slowing down. In essence, this means that the impact of
promotions is also declining with each new promotion
becoming less effective at achieving the desired uplift
than the last. Similar trends are also observed in the
United States (this situation is explored in great detail in
IRI's new report 'Drive Margin Growth of 1 to 3 Percent
with Collaborative Pricing Strategies').
For manufacturers this is a worrisome trend that can have its own devastating effects on sales volumes, since some
19
SPECIAL REPORT
The United Kingdom
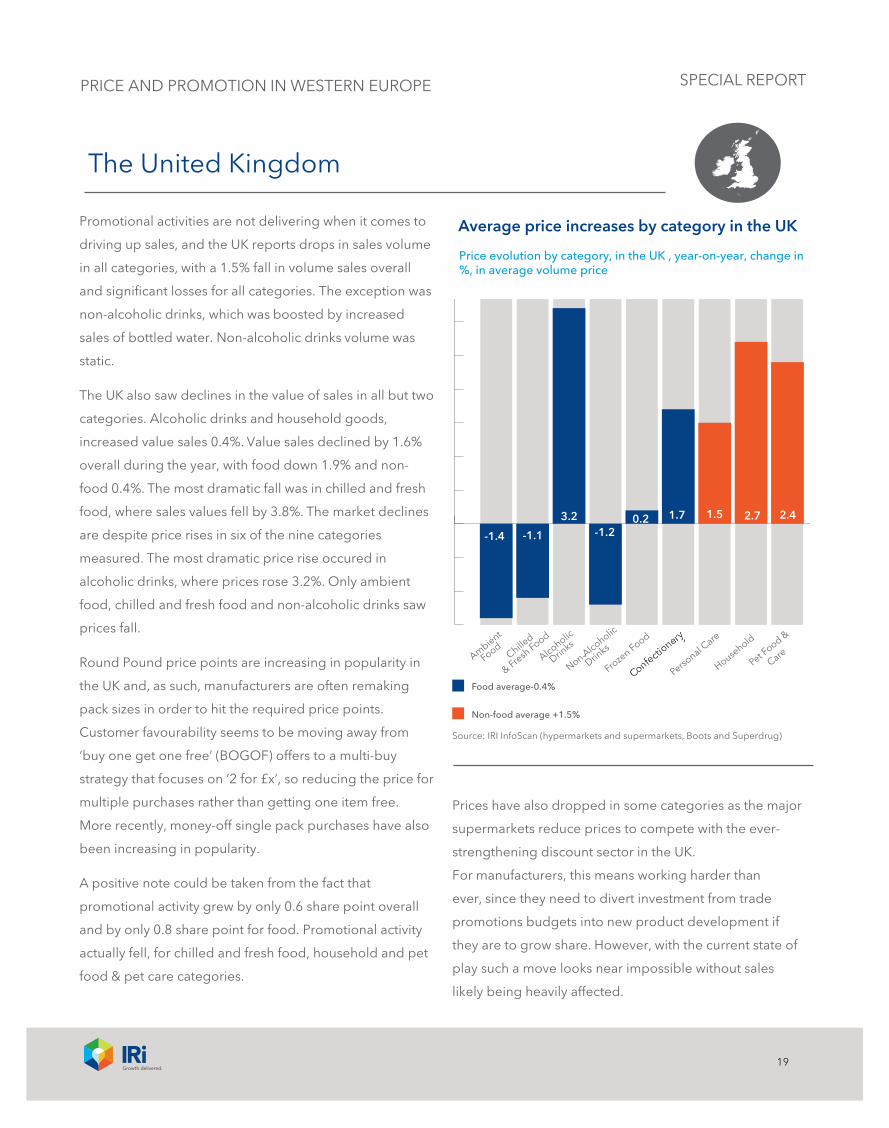
Promotional activities are not delivering when it comes to
driving up sales, and the UK reports drops in sales volume
in all categories, with a 1.5% fall in volume sales overall
and significant losses for all categories. The exception was
non-alcoholic drinks, which was boosted by increased
sales of bottled water. Non-alcoholic drinks volume was
static.
The UK also saw declines in the value of sales in all but two
categories. Alcoholic drinks and household goods,
increased value sales 0.4%. Value sales declined by 1.6%
overall during the year, with food down 1.9% and non-
food 0.4%. The most dramatic fall was in chilled and fresh
food, where sales values fell by 3.8%. The market declines
are despite price rises in six of the nine categories
measured. The most dramatic price rise occured in
alcoholic drinks, where prices rose 3.2%. Only ambient
food, chilled and fresh food and non-alcoholic drinks saw
prices fall.
Round Pound price points are increasing in popularity in
the UK and, as such, manufacturers are often remaking
pack sizes in order to hit the required price points.
Customer favourability seems to be moving away from
‘buy one get one free’ (BOGOF) offers to a multi-buy
strategy that focuses on ‘2 for £x’, so reducing the price for
multiple purchases rather than getting one item free.
More recently, money-off single pack purchases have also
been increasing in popularity.
A positive note could be taken from the fact that
promotional activity grew by only 0.6 share point overall
and by only 0.8 share point for food. Promotional activity
actually fell, for chilled and fresh food, household and pet
food & pet care categories.
Prices have also dropped in some categories as the major
supermarkets reduce prices to compete with the ever-
strengthening discount sector in the UK.
For manufacturers, this means working harder than
ever, since they need to divert investment from trade
promotions budgets into new product development if
they are to grow share. However, with the current state of
play such a move looks near impossible without sales
likely being heavily affected.
Alcoholic
Drinks
Ambient
FoodChille
d
& Fresh Food
Confectionary
Froze
n Food
Non Alcoholic
Drinks
Household
Personal C
are
Pet Food &
Care
Average price increases by category in the UK
Food average-0.4%
Non-food average +1.5%
-1.4 -1.1
3.2-1.2
0.2 1.7 1.5 2.7 2.4
Source: IRI InfoScan (hypermarkets and supermarkets, Boots and Superdrug)
-
Price evolution by category, in the UK , year-on-year, change in %, in average volume price
PRICE AND PROMOTION IN WESTERN EUROPE
20
SPECIAL REPORT
France
Alcoholic
Drinks
Ambient
FoodChille
d
& Fresh Food
Confectionary
Froze
n Food
Non Alcoholic
Drinks
Household
Personal C
are
Pet Food &
Care
-0.2
0.5 0.3 0.5 1.2
-0.9
0.4 0.2-0.1
Volume sales on promotion evolution by category in France
Volume sales on promotion evolution by category, in France, year-on-year, share point change
Source: IRI InfoScan (hypermarkets and supermarkets)
-
PRICE AND PROMOTION IN WESTERN EUROPE
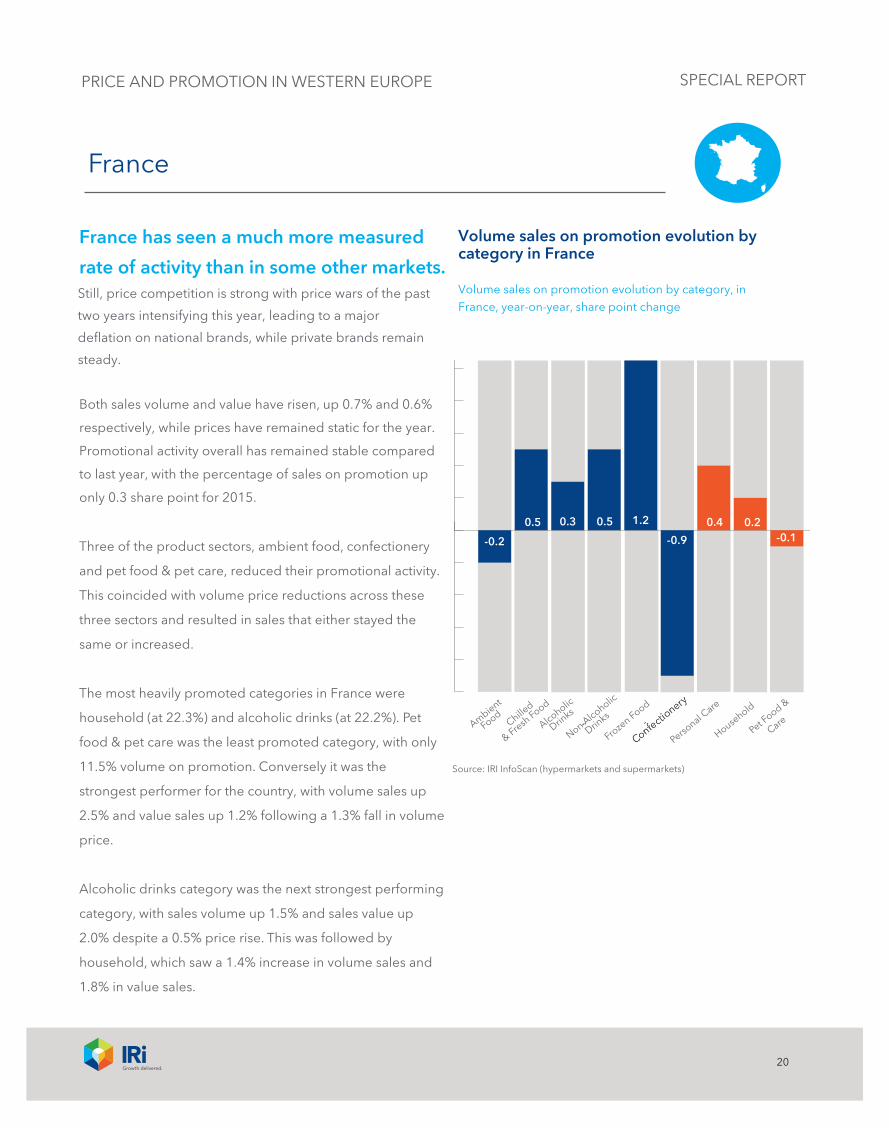
France has seen a much more measured
rate of activity than in some other markets. Still, price competition is strong with price wars of the past
two years intensifying this year, leading to a major
deflation on national brands, while private brands remain
steady.
Both sales volume and value have risen, up 0.7% and 0.6%
respectively, while prices have remained static for the year.
Promotional activity overall has remained stable compared
to last year, with the percentage of sales on promotion up
only 0.3 share point for 2015.
Three of the product sectors, ambient food, confectionery
and pet food & pet care, reduced their promotional activity.
This coincided with volume price reductions across these
three sectors and resulted in sales that either stayed the
same or increased.
The most heavily promoted categories in France were
household (at 22.3%) and alcoholic drinks (at 22.2%). Pet
food & pet care was the least promoted category, with only
11.5% volume on promotion. Conversely it was the
strongest performer for the country, with volume sales up
2.5% and value sales up 1.2% following a 1.3% fall in volume
price.
Alcoholic drinks category was the next strongest performing
category, with sales volume up 1.5% and sales value up
2.0% despite a 0.5% price rise. This was followed by
household, which saw a 1.4% increase in volume sales and
1.8% in value sales.

21
SPECIAL REPORT
France
Overall volume sales rose 0.6% in France during the last
year, with all sectors enjoying growth (except for frozen
food), despite an increase in promotion levels.
Promotional tactics are becoming ingrained with BOGOF
packs becoming the most significant promotional event
for France. During the first quarter of 2015, a major
growth in immediate discounts, rather than potential
discounts, was also evident, suggesting that shoppers are
increasingly expecting high and instant discounts.
The last round of price negotiations between retailers and
manufacturers ended in March this year, but uncertainty
remains around the pricing strategy of various distributors
in the country and it is anticipated that the price war will
continue despite many industry organisations and even
the brands themselves berating the impact on their
businesses. Organisations, such as the Association
Nationale des Industries Alimentaires (ANIA) and the
Institut de Liaison et d’Etudes des Industries de
Consummation (ILEC), have already voiced their concern
about how the price war is impacting investment and
employment capabilities in the longer term.
Alcoholic
Drinks
Ambient
FoodChille
d
& Fresh Food
Confectionary
Froze
n Food
Non Alcoholic
Drinks
Household
Personal C
are
Pet Food &
Care
-0.5
0.7 0.5 0.1 1.0
-0.5 -1.2
0.4
-1.3
Average price increases by category in France
Price evolution by category in France, year-on-year, change in %, in average volume price
Food average +0.2%
Non-food average -0.6%
Source: IRI InfoScan (hypermarkets and supermarkets)
-
PRICE AND PROMOTION IN WESTERN EUROPE

22
SPECIAL REPORT
Spain
Spain is yet another market involved in a price war situation that has pushed prices down overall (by 0.2%). Volume of sales are static (up only 0.1%) and value sales are flat at €40 billion for the country during this period.
While total FMCG trends are stable overall, at the time the
data was collated, non-food sales are up. Value rose 1.5%
driven by growth in all three product groups in this sector.
The biggest rise came from personal care, which rose
2.4% by value. More recently, the trend has changed.
Prices are flat and value and volume are up more than 2%.
Non-food also grew in terms of volume (+1.8%) driven by
strong household performance (+2.6%).
Promotional activity is particularly strong in confectonery
and pet food & pet care categories (+3.1 share point
each). One-third of confectionery volume is sold on
promotion, versus 15.2% of pet food & pet care. Again,
increased promotional activity does not necessary drive
growth. Pet food & pet care inflation of 2.7% led to a 0.7%
drop in volume sales.
Although prices fell by 0.2% over the period, they have
previously risen more than salaries, while unemployment
has also limited the purchasing power of families in Spain.
Wider visibility of pricing and pricing fluctuations in the
market is leading to retailers being more reactive than
ever when it comes to price changes which, although
good for the consumer, is exacerbating the pressure on
prices for manufacturers and has brought even more
categories into the price war.
Alcoholic
Drinks
Ambient
FoodChille
d
& Fresh Food
Confecti
onary
Froze
n Food
Non Alcoholic
Drinks
Household
Personal C
are
Pet Food &
Care
1.20.91.6 0.2 1.4 3.1 1.0 1.5 3.1
Volume sales on promotion evolution by category in Spain
Volume sales on promotion evolution by country, in Spain, year-on-year, share point change
Source: IRI InfoScan (hypermarkets and supermarkets)
-
PRICE AND PROMOTION IN WESTERN EUROPE
23
SPECIAL REPORT
Spain
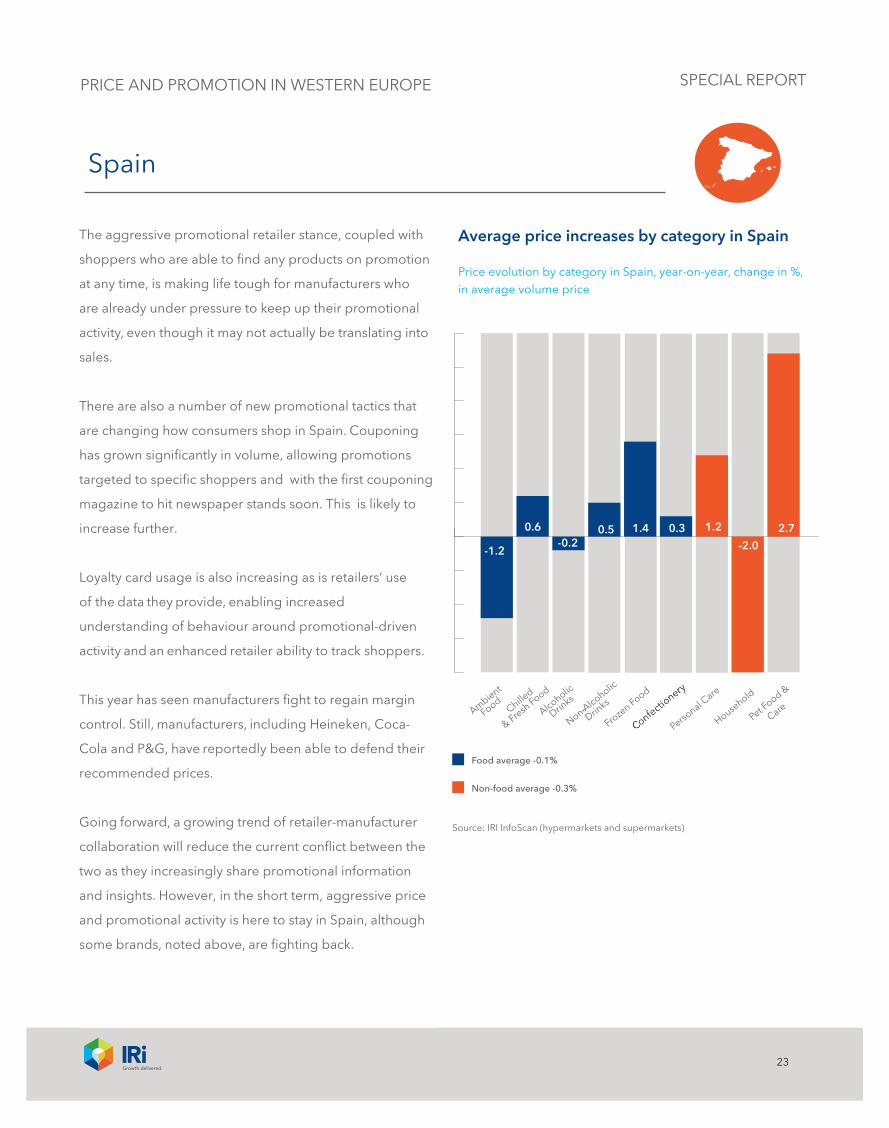
The aggressive promotional retailer stance, coupled with
shoppers who are able to find any products on promotion
at any time, is making life tough for manufacturers who
are already under pressure to keep up their promotional
activity, even though it may not actually be translating into
sales.
There are also a number of new promotional tactics that
are changing how consumers shop in Spain. Couponing
has grown significantly in volume, allowing promotions
targeted to specific shoppers and with the first couponing
magazine to hit newspaper stands soon. This is likely to
increase further.
Loyalty card usage is also increasing as is retailers’ use
of the data they provide, enabling increased
understanding of behaviour around promotional-driven
activity and an enhanced retailer ability to track shoppers.
This year has seen manufacturers fight to regain margin
control. Still, manufacturers, including Heineken, Coca-
Cola and P&G, have reportedly been able to defend their
recommended prices.
Going forward, a growing trend of retailer-manufacturer
collaboration will reduce the current conflict between the
two as they increasingly share promotional information
and insights. However, in the short term, aggressive price
and promotional activity is here to stay in Spain, although
some brands, noted above, are fighting back.
Alcoholic
Drinks
Ambient
FoodChille
d
& Fresh Food
Confectionary
Froze
n Food
Non Alcoholic
Drinks
Household
Personal C
are
Pet Food &
Care
-1.2
0.6-0.2
0.5 1.4 0.3 1.2
-2.0
2.7
Average price increases by category in Spain
Price evolution by category in Spain, year-on-year, change in %, in average volume price
Food average -0.1%
Non-food average -0.3%
Source: IRI InfoScan (hypermarkets and supermarkets)
-
PRICE AND PROMOTION IN WESTERN EUROPE
24
SPECIAL REPORT
Italy
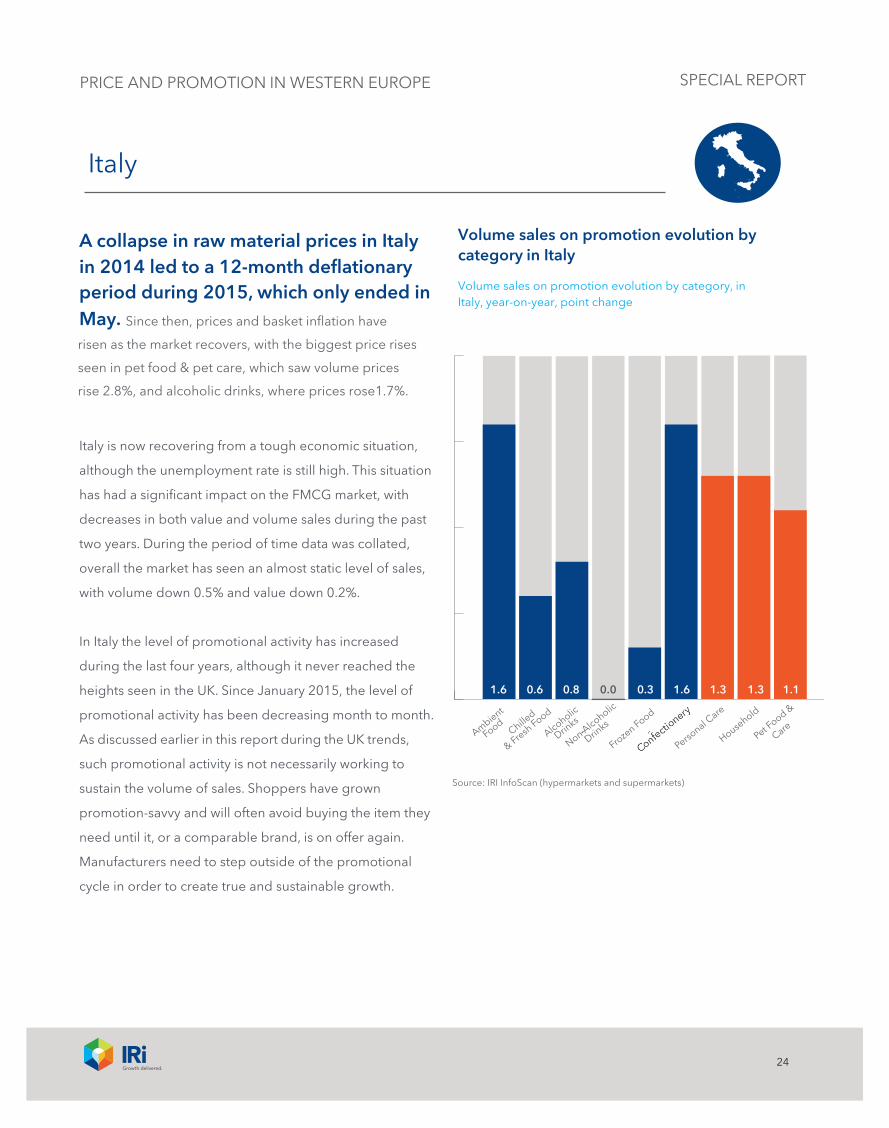
A collapse in raw material prices in Italy in 2014 led to a 12-month deflationary period during 2015, which only ended in May.
Italy is now recovering from a tough economic situation,
although the unemployment rate is still high. This situation
has had a significant impact on the FMCG market, with
decreases in both value and volume sales during the past
two years. During the period of time data was collated,
overall the market has seen an almost static level of sales,
with volume down 0.5% and value down 0.2%.
In Italy the level of promotional activity has increased
during the last four years, although it never reached the
heights seen in the UK. Since January 2015, the level of
promotional activity has been decreasing month to month.
As discussed earlier in this report during the UK trends,
such promotional activity is not necessarily working to
sustain the volume of sales. Shoppers have grown
promotion-savvy and will often avoid buying the item they
need until it, or a comparable brand, is on offer again.
Manufacturers need to step outside of the promotional
cycle in order to create true and sustainable growth.
Volume sales on promotion evolution by category in Italy
Volume sales on promotion evolution by category, in Italy, year-on-year, point change
Alcoholic
Drinks
Ambient
FoodChille
d
& Fresh Food
Confectionary
Froze
n Food
Non Alcoholic
Drinks
Household
Personal C
are
Pet Food &
Care
0.80.61.6 0.0 0.3 1.6 1.3 1.3 1.1
Source: IRI InfoScan (hypermarkets and supermarkets)
-
PRICE AND PROMOTION IN WESTERN EUROPE
Since then, prices and basket inflation have
risen as the market recovers, with the biggest price rises
seen in pet food & pet care, which saw volume prices
rise 2.8%, and alcoholic drinks, where prices rose1.7%.
25
SPECIAL REPORT
Italy
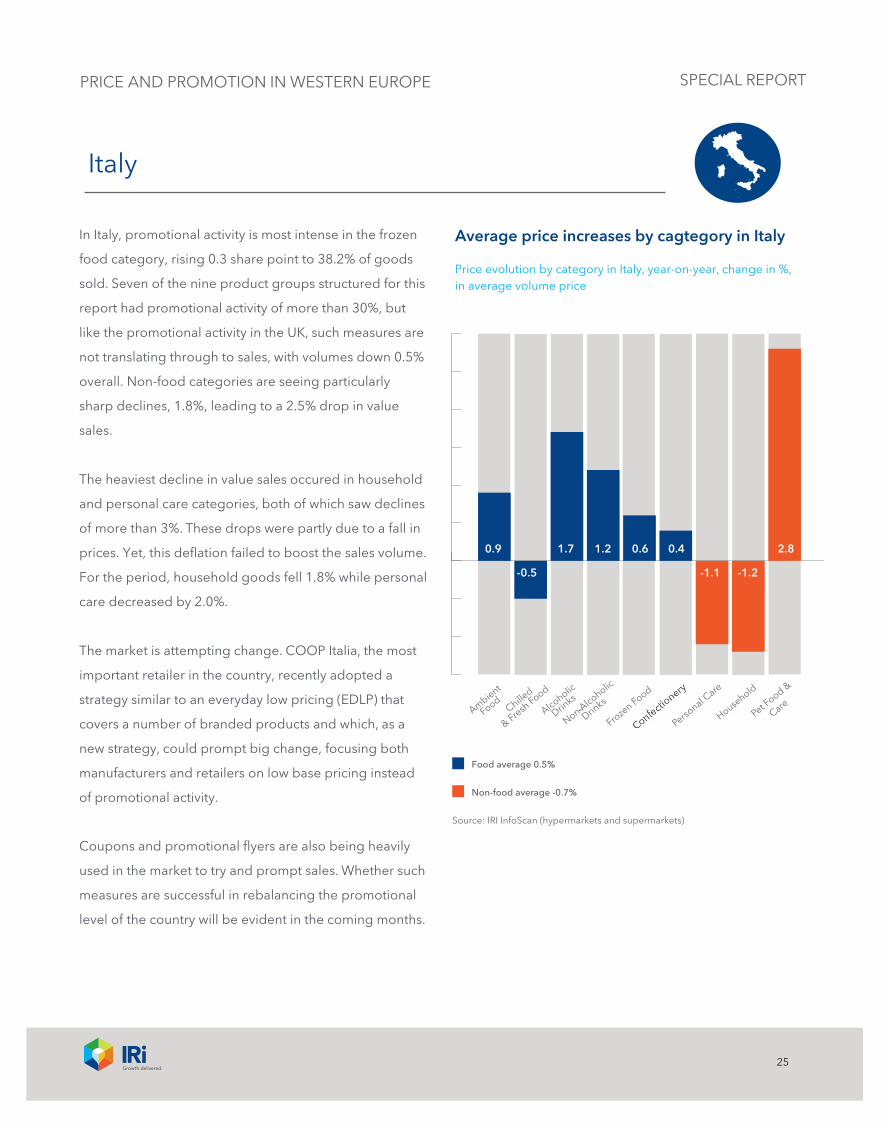
In Italy, promotional activity is most intense in the frozen
food category, rising 0.3 share point to 38.2% of goods
sold. Seven of the nine product groups structured for this
report had promotional activity of more than 30%, but
like the promotional activity in the UK, such measures are
not translating through to sales, with volumes down 0.5%
overall. Non-food categories are seeing particularly
sharp declines, 1.8%, leading to a 2.5% drop in value
sales.
The heaviest decline in value sales occured in household
and personal care categories, both of which saw declines
of more than 3%. These drops were partly due to a fall in
prices. Yet, this deflation failed to boost the sales volume.
For the period, household goods fell 1.8% while personal
care decreased by 2.0%.
The market is attempting change. COOP Italia, the most
important retailer in the country, recently adopted a
strategy similar to an everyday low pricing (EDLP) that
covers a number of branded products and which, as a
new strategy, could prompt big change, focusing both
manufacturers and retailers on low base pricing instead
of promotional activity.
Coupons and promotional flyers are also being heavily
used in the market to try and prompt sales. Whether such
measures are successful in rebalancing the promotional
level of the country will be evident in the coming months.
Average price increases by cagtegory in Italy
Price evolution by category in Italy, year-on-year, change in %, in average volume price
Alcoholic
Drinks
Ambient
FoodChille
d
& Fresh Food
Confectionary
Froze
n Food
Non Alcoholic
Drinks
Household
Personal C
are
Pet Food &
Care
1.7
-0.5
0.9 1.2 0.6 0.4
-1.1 -1.2
2.8
Food average 0.5%
Non-food average -0.7%
Source: IRI InfoScan (hypermarkets and supermarkets)
-
PRICE AND PROMOTION IN WESTERN EUROPE

26
SPECIAL REPORT
Germany
Germany remains, yet again, an enigma amongst its European peers. Sales values have grown by 3.4% during the year with both food and non-food growing at the same pace.
A 5.4% growth in household sales value has helped to fuel
non-food’s growth. The category also saw the highest rise
in sales volume, up 4.8% for the year, with volume sales up
2.3% for the country as a whole.
Pet food & pet care was the only category in Germany to
post a decline (down 1.4%) in grocery and drugstores
channel. The drop is due to a movement towards pet
shops. At the same time there is a trend towards small
dogs, meaning that sales shift towards smaller volume
products which generally have a higher price per volume.
In the non-alcoholic drinks category, hot beverages
saw significant price increases, strongly driven by price
increases of roast and ground coffee, which were up by
15.2%. This was mainly due to private labels increasing
their shelf prices.
Confectionery is also growing by volume and value.
Chocolate is particularly successful in increasing its value
sales by establishing higher prices backed by smaller
packages and premium products. The price increases have
been forced by the higher cost of raw material and
ingredients.
Volume sales on promotion evolution by category in Germany
Volume sales on promotion evolution by category, in Germany, year-on-year, share point change
Alcoholic
Drinks
Ambient
FoodChille
d
& Fresh Food
Confectionary
Froze
n Food
Non Alcoholic
Drinks
Household
Personal C
are
Pet Food &
Care
1.50.70.7 0.2 0.6 0.9
-0.5
0.2 0.2
Source: IRI InfoScan (hypermarkets and supermarkets and drugstores)
The country has the lowest rate of promotions in Europe,
with only 13.2% of the volume of goods sold on
promotion. The market in Germany, however, is very
-
PRICE AND PROMOTION IN WESTERN EUROPE
27
SPECIAL REPORT
Germany
different from the other countries in this study, since the
strength of the discount market encourages a very
different consumer behaviour pattern. The market is
developing a two-pronged approach. While the discount
sector dominates, shoppers are also increasingly
upgrading their purchases, either to higher priced private
labels or manufacturers' brands. While Aldi and Lidl had
been suffering from losing market shares in the past years
they now have adjusted their strategy to address the
change of consumer behaviour and attract new
consumers. Aldi, for example, is increasing its level of
branded goods, to 50 branded products by the end of
2015. Lidl, meanwhile, has been running extensive quality
image campaign across all media channels that has helped
to reestablish its position in the market place.
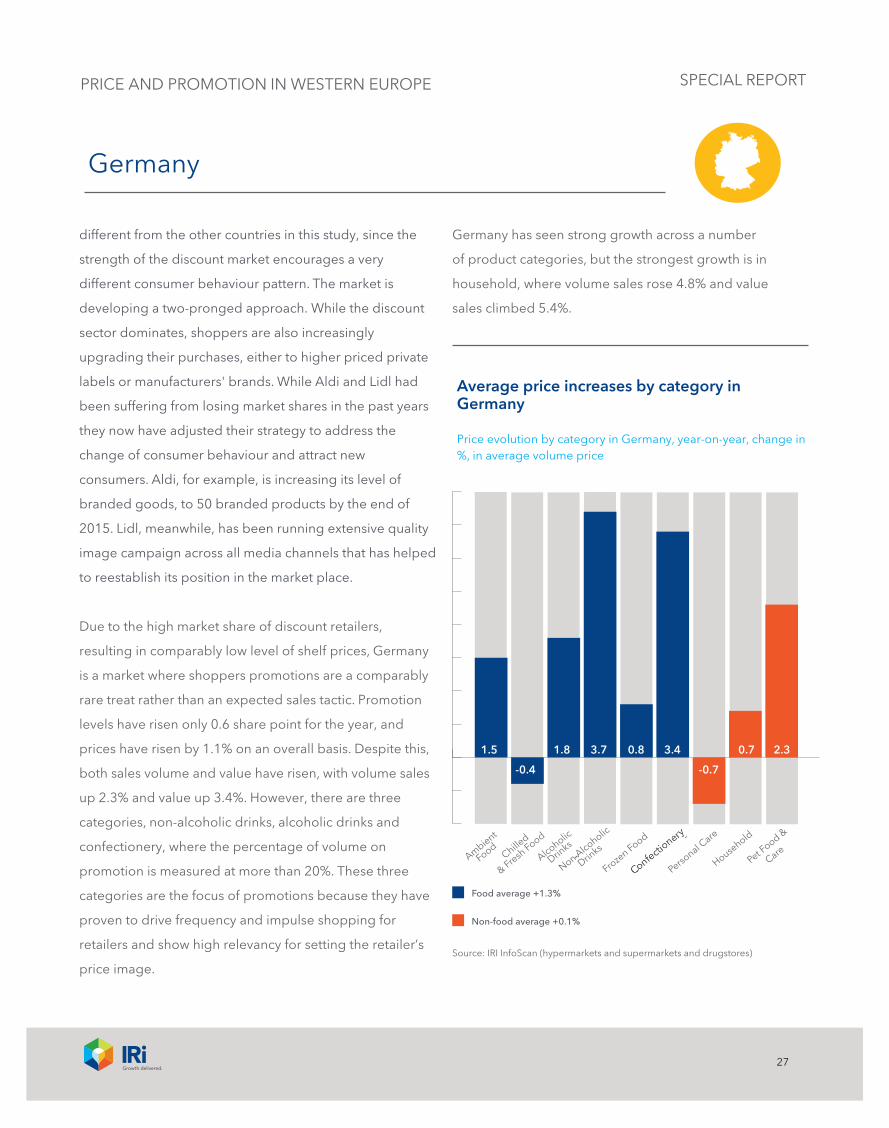
Due to the high market share of discount retailers,
resulting in comparably low level of shelf prices, Germany
is a market where shoppers promotions are a comparably
rare treat rather than an expected sales tactic. Promotion
levels have risen only 0.6 share point for the year, and
prices have risen by 1.1% on an overall basis. Despite this,
both sales volume and value have risen, with volume sales
up 2.3% and value up 3.4%. However, there are three
categories, non-alcoholic drinks, alcoholic drinks and
confectionery, where the percentage of volume on
promotion is measured at more than 20%. These three
categories are the focus of promotions because they have
proven to drive frequency and impulse shopping for
retailers and show high relevancy for setting the retailer’s
price image.
Germany has seen strong growth across a number
of product categories, but the strongest growth is in
household, where volume sales rose 4.8% and value
sales climbed 5.4%.
Average price increases by category in Germany
Price evolution by category in Germany, year-on-year, change in %, in average volume price
Alcoholic
Drinks
Ambient
FoodChille
d
& Fresh Food
Confectionary
Froze
n Food
Non Alcoholic
Drinks
Household
Personal C
are
Pet Food &
Care
1.8
-0.4
1.5 3.7 0.8 3.4
-0.7
0.7 2.3
Food average +1.3%
Non-food average +0.1%
Source: IRI InfoScan (hypermarkets and supermarkets and drugstores)
-
PRICE AND PROMOTION IN WESTERN EUROPE
28
SPECIAL REPORT
Germany
This growth has largely been driven by a big change in
sizing for detergents, which has seen bigger pack sizes,
especially at discounters and large hypermarkets, as well
as smaller pack sizes that address smaller household sizes.
Manufacturers are also trying to ensure consistent pricing
strategies across the different retailers in the country but
they are having little luck, with only a few of the major
brands successfully doing so.
As the economy is further growing, a few manufacturers
have taken the brave decision to try to raise prices, having
previously been restricted by years of price wars. However,
the response to this has been mixed, with one sparkling
wine manufacturer, for example, losing substantial volume
share after its peers failed to follow suit with price rises.
One method manufacturers are using to absorb their
rising costs of raw materials is through premiumisation,
offering premium lines or products at higher price levels to
compensate. This has been the case particularly in product
groups like laundry and household.
The price rises in the German market could come to an
end as Aldi shifts strategy. While it is yet to prove
successful, the strategy has provoked new price
competition over the recent months. In household and
personal care, where drugstores are dominating the
German market, leading retailer dm, is counteracting with
its permanently low shelf price policy. In food categories,
Lidl and Kaufland as well as Edeka and Rewe, are reacting
with lower shelf prices, more aggressive promotion
prices and – at least temporarily – delisting and broader
placement of private labels.
Given these circumstances and taking the bargaining
mentality of German shoppers into account, promotions
remain important even though still on lower density than in
other European markets.
PRICE AND PROMOTION IN WESTERN EUROPE
29
SPECIAL REPORT
Greece
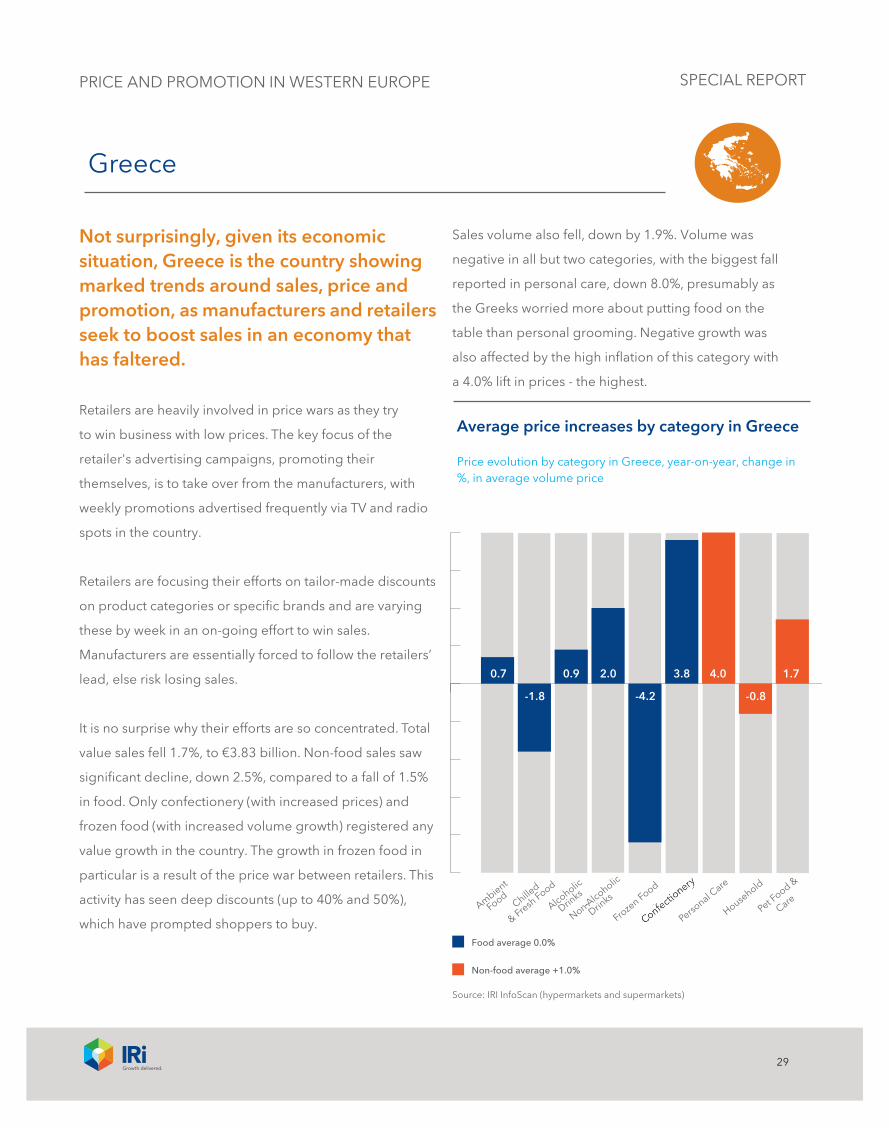
Not surprisingly, given its economic situation, Greece is the country showing marked trends around sales, price and promotion, as manufacturers and retailers seek to boost sales in an economy that has faltered.
Retailers are heavily involved in price wars as they try
to win business with low prices. The key focus of the
retailer's advertising campaigns, promoting their
themselves, is to take over from the manufacturers, with
weekly promotions advertised frequently via TV and radio
spots in the country.
Retailers are focusing their efforts on tailor-made discounts
on product categories or specific brands and are varying
these by week in an on-going effort to win sales.
Manufacturers are essentially forced to follow the retailers’
lead, else risk losing sales.
It is no surprise why their efforts are so concentrated. Total
value sales fell 1.7%, to €3.83 billion. Non-food sales saw
significant decline, down 2.5%, compared to a fall of 1.5%
in food. Only confectionery (with increased prices) and
frozen food (with increased volume growth) registered any
value growth in the country. The growth in frozen food in
particular is a result of the price war between retailers. This
activity has seen deep discounts (up to 40% and 50%),
which have prompted shoppers to buy.
Sales volume also fell, down by 1.9%. Volume was
negative in all but two categories, with the biggest fall
reported in personal care, down 8.0%, presumably as
the Greeks worried more about putting food on the
table than personal grooming. Negative growth was
also affected by the high inflation of this category with
a 4.0% lift in prices - the highest.
Alcoholic
Drinks
Ambient
FoodChille
d
& Fresh Food
Confectionary
Froze
n Food
Non Alcoholic
Drinks
Household
Personal C
are
Pet Food &
Care
0.9
-1.8
0.7 2.0
-4.2
3.8 4.0
-0.8
1.7
Food average 0.0%
Average price increases by category in Greece
Price evolution by category in Greece, year-on-year, change in %, in average volume price
Non-food average +1.0%
Source: IRI InfoScan (hypermarkets and supermarkets)
-
PRICE AND PROMOTION IN WESTERN EUROPE
30
SPECIAL REPORT
Deep discounts of up to 40% to 50% (sometimes added on
top of the already existing promo packs of the
manufacturers) are doing much to drive sales.
The leading manufacturer of the category is heavily
advertising in order to increase penetration and
awareness.
Milk has, in the last two years, joined the promotion game
in the country, with one of the biggest retailers in the
country selling branded milk at private labels equivalent
prices for a couple of days every week in order to drive
footfall in stores.
Greece
This is a market where with certain products, such as bath
and shower, consumers are extremely promotionally
driven to the degree that they will switch between a
handful of brands to purchase the one that is on
promotion at any given time.
Sales of alcoholic drinks also fell dramatically, down 7.3%
in volume and 6.4% in value. This was in spite of heavy
promotional activity, up 5.3 share points and the second
biggest increase in promotional activity in the country.
The third strongest decline in sales volume was in non-
alcoholic drinks, which saw a fall of 5.9% by volume and
3.9% by value. The category absorbed a 2.0% rise
in prices, but only a 0.2 share point increase in
promotional activity.
FMCG sales in Greece are definitely reflective of the
country’s economy. The only two categories to report
positive sales uplifts were frozen food, which saw an 8.2%
increase in sales volume, and chilled and fresh food with a
1.1% uplift.
The 8.2% rise is compared to an overall 1.5% fall for
the food category overall and is a result of the price
and promotion war between the different retailers and
discounters referred to earlier. The country has seen a 7.2
percentage point rise in the amount of frozen food on
offer, the highest of all the categories in the country. This
prompted a 4.2% fall in prices.
PRICE AND PROMOTION IN WESTERN EUROPE