Embed Size (px)
Citation preview

Proof #3
PRGTX
PGTIX
Global Technology Fund
Global Technology Fund– I Class
aNNualREPORT
December 31, 2017
T. Rowe PRICe
The fund invests in foreign and U.S. companies that are primarily engaged in the technology sector.

Proof #3
REPORTS ON THE WEB
Sign up for our Email Program, and you can begin to receive updated fund reports and prospectuses online rather than through the mail. Log in to your account at troweprice.com for more information.
HIGHLIGHTS
• Globaltechnologystocksperformedexceptionallywellin2017,returningover42%andoutpacingallothersegments.
• TheGlobalTechnologyFundrecordedevenstrongergains,outpacingitsindexandpeergroupandhelpingitremainthetop-performingfundofitskindoverlongertimeperiods.
• OursoftwareandInternetholdingscontributedthemosttoresults.
• Thestrongerglobaleconomyhasmadesomecyclicallysensitivetechnologystocksmoreappealing,butourfocusremainsoncompaniesthatareabletoperformwelleveninaslow-growthenvironment.
T. Rowe Price Global Technology Fund
TheviewsandopinionsinthisreportwerecurrentasofDecember31,2017.They are not guarantees of performance or investment results andshouldnotbe takenas investmentadvice. Investmentdecisionsreflectavarietyof factors,and themanagers reserve the right tochange theirviews about individual stocks, sectors, and the markets at any time.As a result, the views expressed should not be relied upon as a fore-castof the fund’s future investment intent.Thereport iscertifiedunderthe Sarbanes-Oxley Act, which requiresmutual funds and other publiccompanies to affirm that, to the best of their knowledge, the informa-tionintheirfinancialreportsisfairlyandaccuratelystatedinallmaterialrespects.

Proof #3
T. Rowe Price Global Technology Fund
Manager’s Letter
1
Fellow Shareholders
Global technology stocks led the market higher in a year of very strong global
stock performance. Many leading global Internet platforms and other major tech
firms continued to record robust earnings and revenue gains as they benefited from
the heathy global economy while also seizing market share from slower-footed
competitors. I am pleased to report that our concentrated investments in these firms,
paired with our nimble and valuation-sensitive approach, helped us build on our
strong record of relative and absolute performance. I should caution that investors
should not expect such returns to be the norm, however, particularly given elevated
valuations throughout much of the sector.
PERFORMANCE COMPARISON
The Global Technology Fund returned 47.04% in the 12 months ended December 31, 2017. The fund outpaced the MSCI All Country World Index Information Technology and the Lipper Global Science/Technology Funds Index. (Performance for the I Class will vary due to its differing fee structure.) The fund continued to rank first among its peers
over the longer-term time periods ended December 31, 2017. (Based on cumulative total return, Lipper ranked the Global Technology Fund
TotalReturnPeriodsEnded12/31/17 6Months 12Months
GlobalTechnologyFund 14.75% 47.04%
GlobalTechnologyFund–IClass 14.86 47.15
MSCIAllCountryWorldIndexInformationTechnology 17.88 42.27
LipperGlobalScience/TechnologyFundsIndex 15.96 41.76
Performance Comparison

Proof #3
2
12 of 40, 1 of 37, 1 of 35, and 1 of 15 global science/technology funds for the 1-, 3-, 5-, and 10-year periods ended December 31, 2017, respectively. Past performance cannot guarantee future results.)
MARKET ENVIRONMENT
Markets in general benefited from a pickup in global growth, with all of the major developed economies expanding together for the first time since the initial recovery from the financial crisis nearly a decade ago. Investors were also encouraged by a more stable political situation in Europe, where pro-European Union parties prevailed in several closely watched elections. U.S. markets received a boost at the end of the year from the passage of tax reform, which included a steep reduction in corporate tax rates. Finally, monetary policy around the globe remained broadly supportive. The Federal Reserve raised rates three times but signaled it would continue to move slowly, while the
European Central Bank and the Bank of Japan continued with massive asset purchases designed to keep longer-term interest rates very low or even near 0%, in Japan’s case.
Global technology stocks performed exceptionally well in 2017, outpacing all other sectors in the broad MSCI index. Within the fund’s Lipper
benchmark, Internet- and media-related shares performed especially well in 2017, rising roughly 74% and 55%, respectively. The heavily weighted software, semiconductor, and hardware segments performed generally in line with the benchmark, while the smaller services and telecom-related segments lagged. A notable phenomenon over the past year was the continued strong performance of the most highly valued technology firms, with a small group of companies adding over $1 trillion in market value during the year, according to some
Based on net assets as of 12/31/17.
Geographic Diversification
Europe4%
Pacificex Japan
26% North America67%
Other and Reserves3%

Proof #3
3
estimates. Moreover, at some point during 2017, as many as seven of the top 10 companies in terms of global market capitalization were technology firms. Finally, the year was notable for semiconductor maker Broadcom’s hostile bid for rival Qualcomm in November for $103 billion—if consummated, the acquisition would be the largest ever in the technology sector. (Please refer to the fund’s portfolio of investments for a complete list of holdings and the amount each represents in the portfolio.)
PORTFOLIO REVIEW
The fund saw strong gains from a wide range of its holdings over its fiscal year, with only a very small position in the hardware segment detracting from returns on an overall basis. Our significant holdings in the software industry contributed the most to returns, thanks in large part to our emphasis on so-called cloud-based providers, or those that provide services through the Internet rather than on systems installed on customers’ servers. Salesforce.com continued to benefit from its high-quality product portfolio, highly recurring subscription business model, and strong ecosystem. The stock performed well as the company released earnings showing growth that exceeded expectations. Human resources software maker Workday also performed well, making strides especially in its financials business.
We also benefited from holdings in traditional software firms that are making the transition to the cloud. Intuit is pursuing a software-as-a-service model, which we believe will lead to higher margins and revenues. Third-quarter earnings suggested encouraging progress, and we believe the company will benefit especially from tax reform. Microsoft also continues to transition to the cloud with Office 365 and its cloud services business, Azure. The stock performed well for us after Microsoft reported double-digit growth in the Office suite, as well as in server products and services. Gaming is also moving to the cloud, in a sense, in the form of digital downloads and in-game purchases. Electronic Arts performed well on the back of its sport franchises, although the company had a setback in November with the release of its new Star Wars game, which sparked a social media backlash because of the cost of its add-on content.

Proof #3
4
Our sole real disappointment in the software segment was a new investment in Twilio, which facilitates real-time communications between businesses and their customers. The stock plunged nearly 30% in early May after one of its leading customers, Uber, announced that it was going to both develop technology in-house and look at other vendors. Our willingness to move out of a stock quickly when our thesis is broken served us well, however, and we limited our losses by exiting our position by August.
The Internet remained a dominant and lucrative theme in the portfolio. We recorded strong gains from the two leading Internet retailers in the world, Amazon.com and China’s Alibaba Group Holding. Amazon continued to beat revenue expectations in its retail business while
also seeing stellar growth in its cloud computing operation, Amazon Web Services. Alibaba surprised investors by continuing to grow revenues by roughly 60% while main-taining profit margins of nearly 40%—a remark-able achievement for a company of its size. Tencent Holdings, the dominant social platform in China, with over 900 million users, reported its strongest revenue
growth in seven years, thanks primarily to impressive results in mobile gaming. We see significant opportunity for Tencent in other areas, including online payments, Internet finance, and subscription-based content. Alphabet, Google’s parent company, beat analyst expectations for advertising growth while also doing a better job of controlling expenses.
Our underweight in semiconductors detracted a bit from our relative performance, but we more than made up for this from stock selection in the segment. Our leading contributor was a new position in Taiwan
Other andReserves15%
TelecomEquipment
1%
Media5%
TelecomServices
2%
IT Services5%
Software33%
Internet22%
Semiconductors17%
Based on net assets as of 12/31/17.
Industry Diversification

Proof #3
5
Semiconductor Manufacturing. We believe the company will be the biggest beneficiary of booming demand for non-memory chips deployed for use in artificial intelligence and machine learning. ASML Holding, which provides equipment for the industry, performed well as it beat revenue estimates. We are optimistic that the company will achieve commercialization of extreme ultraviolet lithography (EUV) and become the foremost provider of leading-edge lithography tools. Broadcom rose after reporting strong quarterly results and guidance, and we are encouraged by its bid for Qualcomm, which could drive meaningful growth of the company. Conversely, Microsemi wavered as speculation that the company might be taken over faded and as quarterly results failed to surprise on the upside. We sold the last of our position in September. Analog semiconductor firm Analog Devices also detracted a bit, as did rival NXP Semiconductors, which we eliminated from the portfolio.
Within the media segment, Netflix rose sharply in July after reporting exceptionally strong subscriber gains in the previous quarter, overcoming historical seasonality with a content slate heavy on returning original hit shows. In the following quarter, the company reported particularly strong growth in international subscriptions, which have been rising at roughly a 40% annual pace. As viewership increases, we expect that Netflix’s content algorithms will further improve the customer experience, increasing Netflix’s negotiation leverage with content suppliers globally and helping it stave off the threat from regional competitors. We had less luck with our sole position in the mature cable and satellite industry, and we exited a poorly performing position in European cable operator Liberty Global.
The credit card industry has also been around for many years, but we are interested how established players are embracing technology and the transition to electronic payments. Visa performed well for us after reporting strong results in Europe, where it is enjoying higher revenues due to improved cross-border volume growth, increasing share of processed transactions, and improved pricing. MasterCard also sustained its recent strong performance in cross-border growth and reported steady market share gains.

Proof #3
6
OUTLOOK
I entered 2017 somewhat skeptical that the global economy would accelerate meaningfully in the coming year, which has left me pleasantly surprised by the pickup in global demand in recent months. Stronger growth in Europe and Japan has helped many of our holdings, and the massive Chinese market has remained stable even as policymakers have taken steps to rein in financial excesses. While growth in the U.S. has only picked up moderately to date, business confidence has improved sharply, likely thanks to deregulation and tax changes. A related acceleration in capital spending in late 2017 may pay off in faster growth in 2018.
The prospect of a better growth in the months ahead, fed in part by recent tax reform, has led our team to take a deeper look at some cyclical stocks. The opportunity for companies to repatriate cash could benefit large-cap legacy technology names that may deploy it in strategic mergers and acquisitions. The lower corporate tax rate is
unlikely to have a substantial direct impact on tech-nology companies, however, because most are global businesses that pay a mixture of foreign and U.S. taxes, resulting in relatively low effective rates. A secondary impact is possible, however, as companies that do see substantially lower rates increase investment in tech-nology and other forms of capital spending. Indeed, many of tax reform’s biggest beneficiaries are the com-panies that are arguably most in need of investment in next-generation technologies.
Overall, valuations for technology companies are higher than their historical levels were in the last three to five years, and our sense is that the recent “melt-up” in the stock market has seen investors be less discriminating in bidding up stock prices. However, we do not believe that technology stocks are overvalued compared with the broader market, especially given their growth prospects relative to other industries that are facing disruptive headwinds. Within the sector, companies with durable growth records still properly trade at higher valuations versus slower-growing, legacy technology companies.
…WEDOnOT
bELIEvEThAT
TEChnOLOGySTOCkS
AREOvERvALuED
COMPAREDWIThThE
bROADERMARkET,
ESPECIALLyGIvEn
ThEIRGROWTh
PROSPECTS
RELATIvETOOThER
InDuSTRIESThATARE
FACInGDISRuPTIvE
hEADWInDS

Proof #3
7
The heightened valuations have made it harder to find compelling new investment opportunities in recent months, especially as we have not experienced a significant pullback that presents a broad buying opportunity—as last happened in early 2016. Nonetheless, I am optimistic that we will see chances in the coming year to add to holdings or renew positions where temporary missteps or factors cause valuations to overshoot on the downside. I am pleased to work with a talented team of industry-specific analysts in Baltimore, San Francisco, London, Hong Kong, and elsewhere in pursuit of such opportunities, and I look forward to reporting to you again on our efforts in six months.
Respectfully submitted,
Joshua K. SpencerPresident of the fund and chairman of its Investment Advisory Committee
January 22, 2018
The committee chairman has day-to-day responsibility for managing the portfolio and works with committee members in developing and executing the fund’s investment program.

Proof #3
8
T. Rowe Price Global Technology Fund
Risks of Investing in the Fund
Fundsthatinvestonlyinspecificindustrieswillexperiencegreatervolatilitythanfundsinvestinginabroadrangeofindustries.Technologystockshavehistoricallyexperiencedunusuallywidepriceswings,bothupanddown.Thepotentialforwidevariationinperformancereflectsthespecialriskscommontocompaniesintherapidlychangingfieldoftechnology.Forexample,productsorservicesthatatfirstappearpromisingmaynotprovecommerciallysuccessfulandmaybecomeobsoletequickly.Earningsdisappointmentsandintensecompetitionformarketsharecanresultinsharppricedeclines.
Glossary
Lipper Global Science/Technology Funds Index:AnindexofreturnsforspecifiedperiodsoffundsthatinvestintechnologycompaniesaroundtheworldastrackedbyLipperInc.
MSCI All Country World Index Information Technology:Anindexthattracksinformationtechnologystocksindevelopedandemergingmarkets.
note:MSCImakesnoexpressorimpliedwarrantiesorrepresentationsandshallhavenoliabilitywhatsoeverwithrespecttoanyMSCIdatacontainedherein.TheMSCIdatamaynotbefurtherredistributedorusedasabasisforotherindicesoranysecuritiesorfinancialproducts.Thisreportisnotapproved,reviewed,orproducedbyMSCI.

Proof #3
9
T. Rowe Price Global Technology Fund
TWENTY-FIVE LARGEST HOLDINGS
Percentof netAssets 12/31/17
Tesla 11.3%Salesforce.com 7.0broadcom 6.4netflix 5.1Ctrip.comInternational 4.9
Tencentholdings 4.8TaiwanSemiconductorManufacturing 4.6AlibabaGroupholding 4.6Intuit 4.3Workday 4.2
Amazon.com 4.2Alphabet 3.6ElectronicArts 3.5ultimateSoftwareGroup 3.5MasterCard 2.9
Splunk 2.9ASMLholding 2.6Microsoft 2.5MicrochipTechnology 2.5visa 2.4
Symantec 1.9T-MobileuS 1.8hexagon 1.1EllieMae 0.9AnalogDevices 0.8
Total 94.3%
note:Theinformationshowndoesnotreflectanyexchange-tradedfunds(ETFs),cashreserves,orcollateralforsecuritieslendingthatmaybeheldintheportfolio.
Portfolio Highlights

Proof #3
10
T. Rowe Price Global Technology Fund
MAJOR PORTFOLIO CHANGESListedindescendingorderofsize.
SixMonthsEnded12/31/17
Largest Purchases Largest Sales
Tesla*Amazon.combroadcomAlibabaGroupholdingnetflixCtrip.comInternationalTencentholdingsMasterCard*T-MobileuS*ASMLholding*
Amazon.comSalesforce.comAlibabaGroupholdingnetEase**LibertyGlobal**netflixAlphabetTencentholdingsActivisionblizzard***MicrochipTechnology
12MonthsEnded12/31/17
Largest Purchases Largest Sales
TeslaAmazon.comTencentholdingsnetflixbroadcomCtrip.comInternationalAlibabaGroupholdingSalesforce.comnetEase***Activisionblizzard***
Amazon.comAlibabaGroupholdingSalesforce.comTeslanetflixnetEase***TencentholdingsActivisionblizzard***broadcomMicrochipTechnology
*Positionadded. **Positioneliminated.***Positionaddedandeliminated.
Portfolio Highlights

Proof #3
11
T. Rowe Price Global Technology Fund
Performance and Expenses
MSCI All Country World Index Information Technology $26,715
Global Technology Fund $47,808
As of 12/31/17
12/07 12/1312/1212/1112/1012/0912/08 12/1712/14
G L O B A L T E C H N O L O G Y F U N D
Lipper Global Science/Technology Funds Index $28,891
10,000
20,000
30,000
40,000
50,000
$60,000
12/15 12/16
Note: Performance for the I Class will vary due to its differing fee structure.
Growth of $10,000
Thischartshowsthevalueofahypothetical$10,000investmentinthefundoverthepast10fiscalyearperiodsorsinceinception(forfundslacking10-yearrecords).Theresultiscomparedwithbenchmarks,whichmayincludeabroad-basedmarketindexandapeergroupaverageorindex.Marketindexesdonotincludeexpenses,whicharedeductedfromfundreturnsaswellasmutualfundaveragesandindexes.
Since InceptionPeriodsEnded12/31/17 1year 5years 10years Inception Date
GlobalTechnologyFund 47.04% 26.92% 16.94% – –
GlobalTechnologyFund–IClass 47.15 – – 39.57% 11/29/16
Current performance may be higher or lower than the quoted past performance, which cannot guarantee future results. Share price, principal value, and return will vary, and you may have a gain or loss when you sell your shares. For the most recent month-end performance, please visit our website (troweprice.com) or contact a T. Rowe Price representative at 1-800-225-5132 or, for I Class shares, 1-800-638-8790.
Thistableshowshowthefundwouldhaveperformedeachyearifitsactual(orcumulative)returnsfortheperiodsshownhadbeenearnedataconstantrate.Averageannualtotalreturnfiguresincludechangesinprincipalvalue,reinvesteddividends,andcapitalgaindistributions.Returnsdonotreflecttaxesthattheshareholdermaypayonfunddistributionsortheredemptionoffundshares.Whenassessingperformance,investorsshouldconsiderbothshort-andlong-termreturns.
Average Annual Compound Total Return

Proof #3
12
T. Rowe Price Global Technology Fund
Fund Expense Example
Asamutualfundshareholder,youmayincurtwotypesofcosts:(1)transactioncosts,suchasredemptionfeesorsalesloads,and(2)ongoingcosts,includingmanagementfees,distributionandservice(12b-1)fees,andotherfundexpenses.Thefollowingexampleisintendedtohelpyouunderstandyourongoingcosts(indollars)ofinvestinginthefundandtocomparethesecostswiththeongoingcostsofinvestinginothermutualfunds.Theexampleisbasedonaninvestmentof$1,000investedatthebeginningofthemostrecentsix-monthperiodandheldfortheentireperiod.
Pleasenotethatthefundhastwoshareclasses:Theoriginalshareclass(InvestorClass)chargesnodistributionandservice(12b-1)fee,andtheIClasssharesarealsoavailabletoinstitutionallyorientedclientsandimposeno12b-1oradministrativefeepayment.Eachshareclassispresentedseparatelyinthetable.
Actual ExpensesThefirstlineofthefollowingtable(Actual)providesinformationaboutactualaccountvaluesandexpensesbasedonthefund’sactualreturns.youmayusetheinformationonthisline,togetherwithyouraccountbalance,toestimatetheexpensesthatyoupaidovertheperiod.Simplydivideyouraccountvalueby$1,000(forexample,an$8,600accountvaluedividedby$1,000=8.6),thenmultiplytheresultbythenumberonthefirstlineundertheheading“ExpensesPaidDuringPeriod”toestimatetheexpensesyoupaidonyouraccountduringthisperiod.
Hypothetical Example for Comparison PurposesTheinformationonthesecondlineofthetable(hypothetical)isbasedonhypotheticalaccountvaluesandexpensesderivedfromthefund’sactualexpenseratioandanassumed5%peryearrateofreturnbeforeexpenses(notthefund’sactualreturn).youmaycomparetheongoingcostsofinvestinginthefundwithotherfundsbycontrastingthis5%hypotheticalexampleandthe5%hypotheticalexamplesthatappearintheshareholderreportsoftheotherfunds.Thehypotheticalaccountvaluesandexpensesmaynotbeusedtoestimatetheactualendingaccountbalanceorexpensesyoupaidfortheperiod.
GlobalTechnologyFund 0.90%
GlobalTechnologyFund–IClass 0.77
Theexpenseratioshownisasofthefund’sfiscalyearended12/31/16.Thisnumbermayvaryfromtheexpenseratioshownelsewhereinthisreportbecauseitisbasedonadifferenttimeperiodand,ifapplicable,includesacquiredfundfeesandexpensesbutdoesnotincludefeeorexpensewaivers.
Expense Ratio

Proof #3
13
T. Rowe Price Global Technology Fund
Fund Expense Example (continued)
Note:T.RowePricechargesanannualaccountservicefeeof$20,generallyforaccountswithlessthan$10,000.ThefeeiswaivedforanyinvestorwhoseT.RowePricemutualfundaccountstotal$50,000ormore;accountselectingtoreceiveelectronicdeliveryofaccountstatements,transactionconfirmations,prospectuses,andshareholderreports;oraccountsofaninvestorwhoisaT.RowePricePersonalServicesorEnhancedPersonalServicesclient(enrollmentintheseprogramsgenerallyrequiresT.RowePriceassetsofatleast$250,000).Thisfeeisnotincludedintheaccompanyingtable.Ifyouaresubjecttothefee,keepitinmindwhenyouareestimatingtheongoingexpensesofinvestinginthefundandwhencomparingtheexpensesofthisfundwithotherfunds.
youshouldalsobeawarethattheexpensesshowninthetablehighlightonlyyourongoingcostsanddonotreflectanytransactioncosts,suchasredemptionfeesorsalesloads.Therefore,thesecondlineofthetableisusefulincomparingongoingcostsonlyandwillnothelpyoudeterminetherelativetotalcostsofowningdifferentfunds.Totheextentafundchargestransactioncosts,however,thetotalcostofowningthatfundishigher.
ExpensesPaid beginning Ending DuringPeriod* Accountvalue Accountvalue 7/1/17to 7/1/17 12/31/17 12/31/17
Investor ClassActual $1,000.00 $1,147.50 $4.76
hypothetical(assumes5%returnbeforeexpenses) 1,000.00 1,020.77 4.48
I ClassActual 1,000.00 1,148.60 4.12
hypothetical(assumes5%returnbeforeexpenses) 1,000.00 1,021.37 3.87
*Expensesareequaltothefund’sannualizedexpenseratioforthe6-monthperiod,multipliedbytheaverageaccountvalueovertheperiod,multipliedbythenumberofdaysinthemostrecentfiscalhalfyear(184),anddividedbythedaysintheyear(365)toreflectthehalf-yearperiod.TheannualizedexpenseratiooftheInvestorClasswas0.88%,theIClasswas0.76%.
Global Technology Fund

Proof #3
14
T. Rowe Price Global Technology Fund
Financial Highlights For a share outstanding throughout each period
The accompanying notes are an integral part of these financial statements.
Investor Class
Year Ended
12/31/17
12/31/16
12/31/15
12/31/14
12/31/13
NET ASSET VALUE
Beginning of period
$ 13.22
$ 13.56
$ 12.32
$ 12.73
$ 10.12
Investment activities
Net investment income (loss) (1)
(0.06)
(0.07)
(0.06)
(0.07)
–(2)
Net realized and unrealized gain / loss
6.33
0.98
2.66
2.95
3.98
Total from investment activities
6.27
0.91
2.60
2.88
3.98
Distributions
Net investment income
–
–
–
–
(0.01)
Net realized gain
(2.66)
(1.25)
(1.36)
(3.29)
(1.36)
Total distributions
(2.66)
(1.25)
(1.36)
(3.29)
(1.37)
NET ASSET VALUE
End of period $ 16.83 $ 13.22 $ 13.56 $ 12.32 $ 12.73
Ratios/Supplemental Data Total return(3) 47.04% 6.64% 21.06% 23.99% 39.92%
Ratio of total expenses to average net assets
0.89%
0.90%
0.91%
0.91%
0.95%
Ratio of net investment income (loss) to average net assets
(0.37)%
(0.49)%
(0.47)%
(0.49)%
0.04%
Portfolio turnover rate
204.3%
170.8%
219.4%
228.6%
93.2%
Net assets, end of period (in millions)
$ 5,910
$ 3,153
$ 2,718
$ 1,626
$ 984
(1) Per share amounts calculated using average shares outstanding method. (2) Amounts round to less than $0.01 per share. (3) Total return reflects the rate that an investor would have earned on an investment in the fund
during each period, assuming reinvestment of all distributions.

Proof #3
15
T. Rowe Price Global Technology Fund
Financial Highlights For a share outstanding throughout each period
The accompanying notes are an integral part of these financial statements.
I Class
Year Ended
12/31/17
11/29/16(1)
Through
12/31/16
NET ASSET VALUE
Beginning of period
$ 13.23
$ 14.82
Investment activities
Net investment income (loss) (2)
(0.04)
–(3)
Net realized and unrealized gain / loss
6.33
(0.34) (4)
Total from investment activities
6.29
(0.34)
Distributions
Net realized gain
(2.68)
(1.25)
NET ASSET VALUE
End of period $ 16.84 $ 13.23
Ratios/Supplemental Data Total return(5) 47.15% (2.35)%
Ratio of total expenses to average net assets
0.76%
0.77%(6)
Ratio of net investment income (loss) to average net assets
(0.25)%
0.09%(6)
Portfolio turnover rate
204.3%
170.8%
Net assets, end of period (in thousands)
$ 269,727
$ 16,871
(1) Inception Date (2) Per share amounts calculated using average shares outstanding method. (3) Amounts round to less than $0.01 per share. (4) The amount presented is inconsistent with the fund's aggregate gains and losses because of the
timing of sales and redemptions of fund shares in relation to fluctuating market values for the investment portfolio.
(5) Total return reflects the rate that an investor would have earned on an investment in the fund during each period, assuming reinvestment of all distributions; it is not annualized for periods less than one year.
(6) Annualized
Proof #3
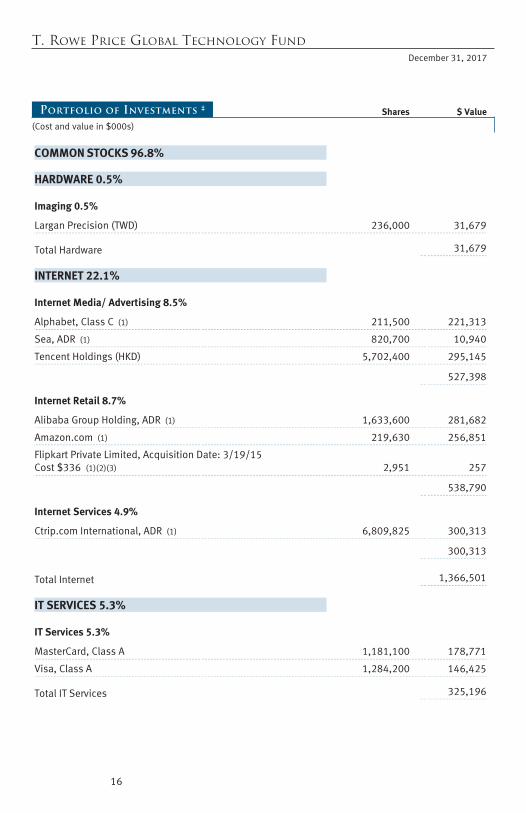
T. Rowe Price Global Technology Fund December 31, 2017
Portfolio of Investments ‡ Shares $ Value
(Cost and value in $000s)
16
COMMON STOCKS 96.8%
HARDWARE 0.5%
Imaging 0.5%
Largan Precision (TWD) 236,000 31,679
Total Hardware 31,679
INTERNET 22.1%
Internet Media/ Advertising 8.5%
Alphabet, Class C (1) 211,500 221,313
Sea, ADR (1) 820,700 10,940
Tencent Holdings (HKD) 5,702,400 295,145
527,398
Internet Retail 8.7%
Alibaba Group Holding, ADR (1) 1,633,600 281,682
Amazon.com (1) 219,630 256,851
Flipkart Private Limited, Acquisition Date: 3/19/15 Cost $336 (1)(2)(3) 2,951 257
538,790
Internet Services 4.9%
Ctrip.com International, ADR (1) 6,809,825 300,313
300,313
Total Internet 1,366,501
IT SERVICES 5.3%
IT Services 5.3%
MasterCard, Class A 1,181,100 178,771
Visa, Class A 1,284,200 146,425
Total IT Services 325,196

Proof #3
T. Rowe Price Global Technology Fund
Shares $ Value
(Cost and value in $000s)
17
MEDIA 5.1%
Media & Entertainment 5.1%
Netflix (1) 1,642,607 315,315
Total Media 315,315
MISCELLANEOUS 11.3%
Miscellaneous 11.3%
Tesla (1) 2,250,300 700,631
Total Miscellaneous 700,631
SEMICONDUCTORS 16.8%
Analog Semiconductors 0.8%
Analog Devices 549,800 48,948
48,948
Digital Semiconductors 13.4%
Broadcom 1,543,200 396,448
Microchip Technology 1,723,720 151,481
Taiwan Semiconductor Manufacturing (TWD) 36,870,000 282,316
830,245
Semiconductor Capital Equipment 2.6%
ASML Holding (EUR) 922,325 160,354
160,354
Total Semiconductors 1,039,547
SOFTWARE 32.8%
Applications Software 15.2%
Atlassian, Class A (1) 719,586 32,755
Salesforce.com (1) 4,233,191 432,759
Ultimate Software Group (1) 987,211 215,439

Proof #3
T. Rowe Price Global Technology Fund
Shares $ Value
(Cost and value in $000s)
18
Workday (1) 2,547,128 259,145
940,098
Consumer Software 7.8%
Electronic Arts (1) 2,071,877 217,672
Intuit 1,677,565 264,686
482,358
Enterprise Software 4.9%
Coupa Software (1) 506,344 15,808
Ellie Mae (1) 616,515 55,116
Guidewire Software (1) 194,100 14,414
Splunk (1) 2,151,826 178,257
Tableau Software, Class A (1) 567,753 39,289
302,884
Infrastructure Software 2.6%
Microsoft 1,796,100 153,638
MongoDB (1) 96,688 2,870
MongoDB, Class B, Lock-Up Shares, Acquisition Date: 10/2/13 Cost $923 (1)(2) 27,597 778
157,286
Internet & Security Software 0.4%
Proofpoint (1) 300,232 26,664
26,664
Software & Services 0.0%
Dropbox, Class B, Acquisition Date: 5/1/12, Cost $233 (1)(2)(3) 25,710 301
301
Systems Software 1.9%
Symantec 4,083,523 114,584
114,584
Total Software 2,024,175

Proof #3
T. Rowe Price Global Technology Fund
Shares $ Value
(Cost and value in $000s)
19
TELECOM EQUIPMENT 1.1%
Wireline Equipment 1.1%
Hexagon, B Shares (SEK) 1,370,929 68,771
Total Telecom Equipment 68,771
TELECOM SERVICES 1.8%
U.S. Wireless 1.8%
T-Mobile US (1) 1,723,800 109,478
Total Telecom Services 109,478
Total Common Stocks (Cost $5,252,416) 5,981,293
PREFERRED STOCKS 0.0%
INTERNET 0.0%
Internet Retail 0.0%
Flipkart, Series A, Acquisition Date: 3/19/15, Cost $115 (1)(2)(3) 1,008 88
Flipkart, Series C, Acquisition Date: 3/19/15, Cost $203 (1)(2)(3) 1,780 155
Flipkart, Series E, Acquisition Date: 3/19/15, Cost $377 (1)(2)(3) 3,309 288
Flipkart, Series G, Acquisition Date: 12/17/14 Cost $2,071 (1)(2)(3) 17,292 2,047
Total Internet 2,578
Total Preferred Stocks (Cost $2,766) 2,578
CONVERTIBLE PREFERRED STOCKS 0.2%
INTERNET 0.1%
Internet Services 0.1%
Xiaoju Kuaizhi, Class A-17, Acquisition Date: 10/19/15 Cost $2,272 (1)(2)(3) 82,853 4,220
Total Internet 4,220

Proof #3
T. Rowe Price Global Technology Fund
Shares $ Value
(Cost and value in $000s)
20
SOFTWARE 0.1%
Applications Software 0.0%
Plex Systems, Series B, Acquisition Date: 6/9/14 Cost $1,264 (1)(2)(3) 551,025 882
882
Enterprise Software 0.0%
Domo, Series D, Acquisition Date: 1/31/14, Cost $929 (1)(2)(3) 224,843 1,398
1,398
Software & Services 0.1%
Dropbox, Series A, Acquisition Date: 5/1/12 Cost $289 (1)(2)(3) 31,927 374
Dropbox, Series A-1, Acquisition Date: 5/1/12 Cost $1,419 (1)(2)(3) 156,830 1,836
Evernote, Series 4, Acquisition Date: 5/2/12 Cost $1,338 (1)(2)(3) 111,219 784
Evernote, Series 5Acquisition Date: 11/8/13 Cost $866 (1)(2)(3) 66,613 496
3,490
Total Software 5,770
Total Convertible Preferred Stocks (Cost $8,377) 9,990
SHORT-TERM INVESTMENTS 3.1%
Money Market Funds 3.1%
T. Rowe Price Treasury Reserve Fund, 1.25% (4)(5) 194,805,853 194,806
Total Short-Term Investments (Cost $194,806) 194,806

Proof #3
T. Rowe Price Global Technology Fund
(Cost and value in $000s)
21
$ Value
Total Investments in Securities
100.1% of Net Assets (Cost $5,458,365) $ 6,188,667
‡ Shares are denominated in U.S. dollars unless otherwise noted. (1) Non-income producing (2)
Security cannot be offered for public resale without first being registered under the Securities Act of 1933 and related rules ("restricted security"). Acquisition date represents the day on which an enforceable right to acquire such security is obtained and is presented along with related cost in the security description. The fund has registration rights for certain restricted securities. Any costs related to such registration are borne by the issuer. The aggregate value of restricted securities (excluding 144A holdings) at period-end amounts to $13,904 and represents 0.2% of net assets.
(3) Level 3 in fair value hierarchy. See Note 2. (4) Seven-day yield (5) Affiliated Company
ADR American Depositary Receipts EUR Euro HKD Hong Kong Dollar SEK Swedish Krona
TWD Taiwan Dollar

Proof #3
T. Rowe Price Global Technology Fund
22
The accompanying notes are an integral part of these financial statements.
Affiliated Companies
($000s)
The fund may invest in certain securities that are considered affiliated companies. As defined by the 1940 Act, an affiliated company is one in which the fund owns 5% or more of the outstanding voting securities, or a company that is under common ownership or control. The following securities were considered affiliated companies for all or some portion of the year ended December 31, 2017. Net realized gain (loss), investment income, change in net unrealized gain/loss, and purchase and sales cost reflect all activity for the period then ended.
Affiliate
Net Realized Gain(Loss)
Change in NetUnrealizedGain/Loss
InvestmentIncome
T. Rowe Price Treasury Reserve Fund $ — $ — $ 2,371 Totals $ —# $ — $ 2,371+ Supplementary Investment Schedule Affiliate
Value12/31/16
PurchaseCost
SalesCost
Value12/31/17
T. Rowe Price Treasury Reserve Fund $ 20,197 ¤ ¤ $ 194,806 $ 194,806^
# Capital gain/loss distributions from mutual funds represented $0 of the net realized gain
(loss). + Investment income comprised $2,371 of dividend income and $0 of interest income. ¤ Purchase and sale information not shown for cash management funds. ^ The cost basis of investments in affiliated companies was $194,806.

Proof #3
23
T. Rowe Price Global Technology Fund December 31, 2017
The accompanying notes are an integral part of these financial statements.
($000s, except shares and per share amounts)
Statement of Assets and Liabilities
Assets
Investments in securities, at value (cost $5,458,365) $ 6,188,667
Receivable for investment securities sold 58,623
Receivable for shares sold 36,444
Cash 17
Other assets 15,565
Total assets 6,299,316
Liabilities
Payable for investment securities purchased 86,529
Payable for shares redeemed 12,898
Investment management fees payable 3,888
Due to affiliates 130
Payable to directors 4
Other liabilities 16,052
Total liabilities 119,501
NET ASSETS $ 6,179,815 Net Assets Consist of:
Accumulated undistributed net realized gain $ 170,243
Net unrealized gain 730,303
Paid-in capital applicable to 367,255,925 shares of $0.0001 par value capital stock outstanding; 1,000,000,000 shares authorized 5,279,269
NET ASSETS $ 6,179,815 NET ASSET VALUE PER SHARE
Investor Class ($5,910,087,871/ 351,234,541 shares outstanding) $ 16.83
I Class ($269,727,102 / 16,021,384 shares outstanding) $ 16.84

Proof #3
T. Rowe Price Global Technology Fund
($000s)
Statement of Operations
24
The accompanying notes are an integral part of these financial statements.
Year Ended
12/31/17 Investment Income (Loss) Dividend income (net of foreign taxes of $2,282) $ 25,671
Expenses Investment management 36,549 Shareholder servicing
Investor Class $ 6,172 I Class 3 6,175
Prospectus and shareholder reports Investor Class 221 I Class 1 222
Custody and accounting 269 Registration 412 Legal and audit 51 Directors 15 Miscellaneous 142
Total expenses 43,835
Net investment loss (18,164)
Realized and Unrealized Gain / Loss
Net realized gain (loss) Securities 1,118,781 Foreign currency transactions (976)
Net realized gain 1,117,805
Change in net unrealized gain / loss
Securities 602,106 Other assets and liabilities denominated in foreign currencies 4
Change in net unrealized gain / loss 602,110
Net realized and unrealized gain / loss 1,719,915
INCREASE IN NET ASSETS FROM OPERATIONS $ 1,701,751

Proof #3
T. Rowe Price Global Technology Fund
($000s)
25
Statement of Changes in Net Assets
Year Ended
12/31/17 12/31/16Increase (Decrease) in Net Assets
Operations Net investment loss $ (18,164) $ (14,037) Net realized gain 1,117,805 177,913 Change in net unrealized gain / loss 602,110 14,011 Increase in net assets from operations 1,701,751 177,887
Distributions to shareholders Net realized gain Investor Class (817,747) (274,996)
I Class (34,565) (712) Decrease in net assets from distributions (852,312) (275,708)
Capital share transactions* Shares sold Investor Class 2,417,080 1,358,857
I Class 248,744 17,899 Distributions reinvested Investor Class 756,669 254,247
I Class 30,723 3 Shares redeemed Investor Class (1,270,546) (1,081,684)
I Class (22,147) (77) Increase in net assets from capital share transactions 2,160,523 549,245
Net Assets
Increase during period 3,009,962 451,424 Beginning of period 3,169,853 2,718,429
End of period $ 6,179,815 $ 3,169,853

Proof #3
T. Rowe Price Global Technology Fund
26
The accompanying notes are an integral part of these financial statements.
Statement of Changes in Net Assets
(000s)
Year Ended
12/31/17 12/31/16
*Share information Shares sold Investor Class 142,774 100,899
I Class 14,180 1,281 Distributions reinvested Investor Class 44,095 19,087
I Class 1,789 – Shares redeemed Investor Class (74,089) (82,079)
I Class (1,224) (5) Increase in shares outstanding 127,525 39,183

Proof #3
27
T. Rowe Price Global Technology Fund December 31, 2017
Notes to Financial Statements
T. Rowe Price Global Technology Fund, Inc. (the fund) is registered under the Investment Company Act of 1940 (the 1940 Act) as a diversified, open-end management investment company. The fund seeks to provide long-term capital growth. The fund has two classes of shares: the Global Technology Fund (Investor Class) and the Global Technology Fund–I Class (I Class). I Class shares generally are available only to investors meeting a $1,000,000 minimum investment or certain other criteria. Each class has exclusive voting rights on matters related solely to that class; separate voting rights on matters that relate to both classes; and, in all other respects, the same rights and obligations as the other class.
NOTE 1 - SIGNIFICANT ACCOUNTING POLICIES
Basis of Preparation The fund is an investment company and follows accounting and reporting guidance in the Financial Accounting Standards Board (FASB) Accounting Standards Codification Topic 946 (ASC 946). The accompanying financial statements were prepared in accordance with accounting principles generally accepted in the United States of America (GAAP), including, but not limited to, ASC 946. GAAP requires the use of estimates made by management. Management believes that estimates and valuations are appropriate; however, actual results may differ from those estimates, and the valuations reflected in the accompanying financial statements may differ from the value ultimately realized upon sale or maturity.
Investment Transactions, Investment Income, and Distributions Investment transactions are accounted for on the trade date basis. Income and expenses are recorded on the accrual basis. Realized gains and losses are reported on the identified cost basis. Dividends received from mutual fund investments are reflected as dividend income; capital gain distributions are reflected as realized gain/loss. Dividend income and capital gain distributions are recorded on the ex-dividend date. Income tax-related interest and penalties, if incurred, are recorded as income tax expense. Income distributions are declared and paid by each class annually. Distributions to shareholders are recorded on the ex-dividend date. A capital gain distribution may also be declared and paid by the fund annually.

Proof #3
28
T. Rowe Price Global Technology Fund
Currency Translation Assets, including investments, and liabilities denominated in foreign currencies are translated into U.S. dollar values each day at the prevailing exchange rate, using the mean of the bid and asked prices of such currencies against U.S. dollars as quoted by a major bank. Purchases and sales of securities, income, and expenses are translated into U.S. dollars at the prevailing exchange rate on the respective date of such transaction. The portion of the results of operations attributable to changes in foreign exchange rates on investments is not bifurcated from the portion attributable to changes in market prices. The effect of changes in foreign currency exchange rates on realized and unrealized security gains and losses is reflected as a component of security gains and losses.
Class Accounting Shareholder servicing, prospectus, and shareholder report expenses incurred by each class are charged directly to the class to which they relate. Expenses common to both classes, investment income, and realized and unrealized gains and losses are allocated to the classes based upon the relative daily net assets of each class. To the extent any expenses are waived or reimbursed in accordance with an expense limitation (see Note 6), the waiver or reimbursement is charged to the applicable class or allocated across the classes in the same manner as the related expense.
Rebates Subject to best execution, the fund may direct certain security trades to brokers who have agreed to rebate a portion of the related brokerage commission to the fund in cash. Commission rebates are reflected as realized gain on securities in the accompanying financial statements and totaled $186,000 for the year ended December 31, 2017.
New Accounting Guidance In March 2017, the FASB issued amended guidance to shorten the amortization period for certain callable debt securities, held at a premium. The guidance is effective for fiscal years and interim periods beginning after December 15, 2018. Adoption will have no effect on the fund’s net assets or results of operations.
On August 1, 2017, the fund implemented amendments to Regulation S-X, issued by the Securities and Exchange Commission, which require standardized, enhanced disclosures, particularly related to derivatives, in investment company financial statements. Adoption had no effect on the fund’s net assets or results of operations.

Proof #3
29
T. Rowe Price Global Technology Fund
Indemnification In the normal course of business, the fund may provide indemnification in connection with its officers and directors, service providers, and/or private company investments. The fund’s maximum exposure under these arrangements is unknown; however, the risk of material loss is currently considered to be remote.
NOTE 2 - VALUATION
The fund’s financial instruments are valued and each class’s net asset value (NAV) per share is computed at the close of the New York Stock Exchange (NYSE), normally 4 p.m. ET, each day the NYSE is open for business. However, the NAV per share may be calculated at a time other than the normal close of the NYSE if trading on the NYSE is restricted, if the NYSE closes earlier, or as may be permitted by the SEC.
Fair Value The fund’s financial instruments are reported at fair value, which GAAP defines as the price that would be received to sell an asset or paid to transfer a liability in an orderly transaction between market participants at the measurement date. The T. Rowe Price Valuation Committee (the Valuation Committee) is an internal committee that has been delegated certain responsibilities by the fund’s Board of Directors (the Board) to ensure that financial instruments are appropriately priced at fair value in accordance with GAAP and the 1940 Act. Subject to oversight by the Board, the Valuation Committee develops and oversees pricing-related policies and procedures and approves all fair value determinations. Specifically, the Valuation Committee establishes procedures to value securities; determines pricing techniques, sources, and persons eligible to effect fair value pricing actions; oversees the selection, services, and performance of pricing vendors; oversees valuation-related business continuity practices; and provides guidance on internal controls and valuation-related matters. The Valuation Committee reports to the Board and has representation from legal, portfolio management and trading, operations, risk management, and the fund’s treasurer.
Various valuation techniques and inputs are used to determine the fair value of financial instruments. GAAP establishes the following fair value hierarchy that categorizes the inputs used to measure fair value:
Level 1 – quoted prices (unadjusted) in active markets for identical financial instruments that the fund can access at the reporting date

Proof #3
30
T. Rowe Price Global Technology Fund
Level 2 – inputs other than Level 1 quoted prices that are observable, either directly or indirectly (including, but not limited to, quoted prices for similar financial instruments in active markets, quoted prices for identical or similar financial instruments in inactive markets, interest rates and yield curves, implied volatilities, and credit spreads)
Level 3 – unobservable inputs
Observable inputs are developed using market data, such as publicly available information about actual events or transactions, and reflect the assumptions that market participants would use to price the financial instrument. Unobservable inputs are those for which market data are not available and are developed using the best information available about the assumptions that market participants would use to price the financial instrument. GAAP requires valuation techniques to maximize the use of relevant observable inputs and minimize the use of unobservable inputs. When multiple inputs are used to derive fair value, the financial instrument is assigned to the level within the fair value hierarchy based on the lowest-level input that is significant to the fair value of the financial instrument. Input levels are not necessarily an indication of the risk or liquidity associated with financial instruments at that level but rather the degree of judgment used in determining those values.
Valuation Techniques Equity securities listed or regularly traded on a securities exchange or in the over-the-counter (OTC) market are valued at the last quoted sale price or, for certain markets, the official closing price at the time the valuations are made. OTC Bulletin Board securities are valued at the mean of the closing bid and asked prices. A security that is listed or traded on more than one exchange is valued at the quotation on the exchange determined to be the primary market for such security. Listed securities not traded on a particular day are valued at the mean of the closing bid and asked prices for domestic securities and the last quoted sale or closing price for international securities.
For valuation purposes, the last quoted prices of non-U.S. equity securities may be adjusted to reflect the fair value of such securities at the close of the NYSE. If the fund determines that developments between the close of a foreign market and the close of the NYSE will affect the value of some or all of its portfolio securities, the fund will adjust the previous quoted prices to reflect what it believes to be the fair value of the securities as of the close of the NYSE. In deciding whether it is necessary to adjust quoted prices to reflect fair value, the fund reviews a variety of factors, including developments in foreign markets, the performance of U.S. securities markets, and the performance of instruments

Proof #3
31
T. Rowe Price Global Technology Fund
trading in U.S. markets that represent foreign securities and baskets of foreign securities. The fund may also fair value securities in other situations, such as when a particular foreign market is closed but the fund is open. The fund uses outside pricing services to provide it with quoted prices and information to evaluate or adjust those prices. The fund cannot predict how often it will use quoted prices and how often it will determine it necessary to adjust those prices to reflect fair value. As a means of evaluating its security valuation process, the fund routinely compares quoted prices, the next day’s opening prices in the same markets, and adjusted prices.
Actively traded equity securities listed on a domestic exchange generally are categorized in Level 1 of the fair value hierarchy. Non-U.S. equity securities generally are categorized in Level 2 of the fair value hierarchy despite the availability of quoted prices because, as described above, the fund evaluates and determines whether those quoted prices reflect fair value at the close of the NYSE or require adjustment. OTC Bulletin Board securities, certain preferred securities, and equity securities traded in inactive markets generally are categorized in Level 2 of the fair value hierarchy.
Investments in mutual funds are valued at the mutual fund’s closing NAV per share on the day of valuation and are categorized in Level 1 of the fair value hierarchy. Assets and liabilities other than financial instruments, including short-term receivables and payables, are carried at cost, or estimated realizable value, if less, which approximates fair value.
Thinly traded financial instruments and those for which the above valuation procedures are inappropriate or are deemed not to reflect fair value are stated at fair value as determined in good faith by the Valuation Committee. The objective of any fair value pricing determination is to arrive at a price that could reasonably be expected from a current sale. Financial instruments fair valued by the Valuation Committee are primarily private placements, restricted securities, warrants, rights, and other securities that are not publicly traded.
Subject to oversight by the Board, the Valuation Committee regularly makes good faith judgments to establish and adjust the fair valuations of certain securities as events occur and circumstances warrant. For instance, in determining the fair value of an equity investment with limited market activity, such as a private placement or a thinly traded public company stock, the Valuation Committee considers a variety of factors, which may include, but are not limited to, the issuer’s business prospects, its financial standing and performance, recent investment transactions in the issuer, new rounds of

Proof #3
32
T. Rowe Price Global Technology Fund
financing, negotiated transactions of significant size between other investors in the company, relevant market valuations of peer companies, strategic events affecting the company, market liquidity for the issuer, and general economic conditions and events. In consultation with the investment and pricing teams, the Valuation Committee will determine an appropriate valuation technique based on available information, which may include both observable and unobservable inputs. The Valuation Committee typically will afford greatest weight to actual prices in arm’s length transactions, to the extent they represent orderly transactions between market participants, transaction information can be reliably obtained, and prices are deemed representative of fair value. However, the Valuation Committee may also consider other valuation methods such as market-based valuation multiples; a discount or premium from market value of a similar, freely traded security of the same issuer; or some combination. Fair value determinations are reviewed on a regular basis and updated as information becomes available, including actual purchase and sale transactions of the issue. Because any fair value determination involves a significant amount of judgment, there is a degree of subjectivity inherent in such pricing decisions, and fair value prices determined by the Valuation Committee could differ from those of other market participants. Depending on the relative significance of unobservable inputs, including the valuation technique(s) used, fair valued securities may be categorized in Level 2 or 3 of the fair value hierarchy.
Valuation Inputs The following table summarizes the fund’s financial instruments, based on the inputs used to determine their fair values on December 31, 2017:
($000s) Level 1 Level 2 Level 3 Total Value
Quoted Prices
Significant Observable
Inputs
Significant Unobservable
Inputs
InvestmentsinSecurities,except: $ 194,806 $ — $ — $ 194,806
CommonStocks 5,141,692 839,043 558 5,981,293
PreferredStocks — — 2,578 2,578
ConvertiblePreferredStocks — — 9,990 9,990
Total $ 5,336,498 $ 839,043 $ 13,126 $ 6,188,667

Proof #3
33
T. Rowe Price Global Technology Fund
There were no material transfers between Levels 1 and 2 during the year ended December 31, 2017.
Following is a reconciliation of the fund’s Level 3 holdings for the year ended December 31, 2017. Gain (loss) reflects both realized and change in unrealized gain/loss on Level 3 holdings during the period, if any, and is included on the accompanying Statement of Operations. The change in unrealized gain/loss on Level 3 instruments held at December 31, 2017, totaled $2,183,000 for the year ended December 31, 2017. Transfers into and out of Level 3 are reflected at the value of the financial instrument at the beginning of the period. During the year, transfers out of Level 3 were because observable market data became available for the security.
($000s) Beginning Balance1/1/17
Gain (Loss) DuringPeriod
Total Sales
TransfersOut of
Level 3
Ending Balance
12/31/17
InvestmentsinSecurities
CommonStocks $ 576 $ 32 $ (50) $ — $ 558
PreferredStocks 2,603 467 (492) — 2,578
ConvertiblePreferredStocks 10,063 1,620 — (1,693) 9,990
TotalLevel3 $ 13,242 $ 2,119 $ (542) $ (1,693) $ 13,126
NOTE 3 - OTHER INVESTMENT TRANSACTIONS
Consistent with its investment objective, the fund engages in the following practices to manage exposure to certain risks and/or to enhance performance. The investment objective, policies, program, and risk factors of the fund are described more fully in the fund’s prospectus and Statement of Additional Information.
Emerging Markets The fund may invest, either directly or through investments in T. Rowe Price institutional funds, in securities of companies located in, issued by governments of, or denominated in or linked to the currencies of emerging market countries; at period-end, approximately 19% of the fund’s

Proof #3
34
T. Rowe Price Global Technology Fund
net assets were invested in emerging markets. Emerging markets generally have economic structures that are less diverse and mature, and political systems that are less stable, than developed countries. These markets may be subject to greater political, economic, and social uncertainty and differing regulatory environments that may potentially impact the fund’s ability to buy or sell certain securities or repatriate proceeds to U.S. dollars. Such securities are often subject to greater price volatility, less liquidity, and higher rates of inflation than U.S. securities.
Restricted Securities The fund may invest in securities that are subject to legal or contractual restrictions on resale. Prompt sale of such securities at an acceptable price may be difficult and may involve substantial delays and additional costs.
Other Purchases and sales of portfolio securities other than short-term securities aggregated $10,563,484,000 and $9,447,575,000, respectively, for the year ended December 31, 2017.
NOTE 4 - FEDERAL INCOME TAxES
No provision for federal income taxes is required since the fund intends to continue to qualify as a regulated investment company under Subchapter M of the Internal Revenue Code and distribute to shareholders all of its taxable income and gains. Distributions determined in accordance with federal income tax regulations may differ in amount or character from net investment income and realized gains for financial reporting purposes. Financial reporting records are adjusted for permanent book/tax differences to reflect tax character but are not adjusted for temporary differences.
The fund files U.S. federal, state, and local tax returns as required. The fund’s tax returns are subject to examination by the relevant tax authorities until expiration of the applicable statute of limitations, which is generally three years after the filing of the tax return but which can be extended to six years in certain circumstances. Tax returns for open years have incorporated no uncertain tax positions that require a provision for income taxes.
Reclassifications to paid-in capital relate primarily to a tax practice that treats a portion of the proceeds from each redemption of capital shares as a distribution of taxable net investment income or realized capital gain. Reclassifications between income and gain relate primarily to the offset of the current net

Proof #3
35
T. Rowe Price Global Technology Fund
operating loss against realized gains. For the year ended December 31. 2017, the following reclassifications were recorded to reflect tax character (there was no impact on results of operations or net assets):
undistributednetinvestmentincome $ 18,164
undistributednetrealizedgain (112,759)
Paid-incapital 94,595
($000s)
Distributions during the years ended December 31, 2017 and December 31, 2016, were characterized for tax purposes as follows:
($000s)
December 312017 2016
Ordinaryincome $ 650,510 $ 200,715
Long-termcapitalgain 201,802 74,993
Totaldistributions $ 852,312 $ 275,708
At December 31, 2017, the tax-basis cost of investments, including derivatives, and components of net assets were as follows:
Costofinvestments $ 5,500,659
unrealizedappreciation $ 807,460
unrealizeddepreciation (119,452)
netunrealizedappreciation(depreciation) 688,008
undistributedordinaryincome 196,432
undistributedlong-termcapitalgain 16,412
Late-yearordinarylossdeferrals (306)
Paid-incapital 5,279,269
netassets $ 6,179,815
($000s)
Proof #3
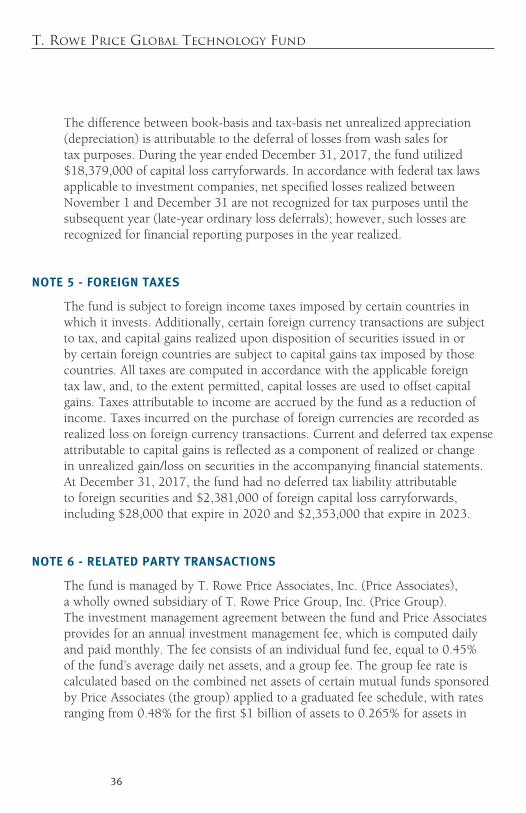
36
T. Rowe Price Global Technology Fund
The difference between book-basis and tax-basis net unrealized appreciation (depreciation) is attributable to the deferral of losses from wash sales for tax purposes. During the year ended December 31, 2017, the fund utilized $18,379,000 of capital loss carryforwards. In accordance with federal tax laws applicable to investment companies, net specified losses realized between November 1 and December 31 are not recognized for tax purposes until the subsequent year (late-year ordinary loss deferrals); however, such losses are recognized for financial reporting purposes in the year realized.
NOTE 5 - FOREIGN TAxES
The fund is subject to foreign income taxes imposed by certain countries in which it invests. Additionally, certain foreign currency transactions are subject to tax, and capital gains realized upon disposition of securities issued in or by certain foreign countries are subject to capital gains tax imposed by those countries. All taxes are computed in accordance with the applicable foreign tax law, and, to the extent permitted, capital losses are used to offset capital gains. Taxes attributable to income are accrued by the fund as a reduction of income. Taxes incurred on the purchase of foreign currencies are recorded as realized loss on foreign currency transactions. Current and deferred tax expense attributable to capital gains is reflected as a component of realized or change in unrealized gain/loss on securities in the accompanying financial statements. At December 31, 2017, the fund had no deferred tax liability attributable to foreign securities and $2,381,000 of foreign capital loss carryforwards, including $28,000 that expire in 2020 and $2,353,000 that expire in 2023.
NOTE 6 - RELATED PARTY TRANSACTIONS
The fund is managed by T. Rowe Price Associates, Inc. (Price Associates), a wholly owned subsidiary of T. Rowe Price Group, Inc. (Price Group). The investment management agreement between the fund and Price Associates provides for an annual investment management fee, which is computed daily and paid monthly. The fee consists of an individual fund fee, equal to 0.45% of the fund’s average daily net assets, and a group fee. The group fee rate is calculated based on the combined net assets of certain mutual funds sponsored by Price Associates (the group) applied to a graduated fee schedule, with rates ranging from 0.48% for the first $1 billion of assets to 0.265% for assets in
Proof #3
37
T. Rowe Price Global Technology Fund
excess of $650 billion. The fund’s group fee is determined by applying the group fee rate to the fund’s average daily net assets. At December 31, 2017, the effective annual group fee rate was 0.29%.
The I Class is subject to an operating expense limitation (I Class limit) pursuant to which Price Associates is contractually required to pay all operating expenses of the I Class, excluding management fees, interest, expenses related to borrowings, taxes, brokerage, and other non-recurring expenses permitted by the investment management agreement, to the extent such operating expenses, on an annualized basis, exceed 0.05% of average net assets. This agreement will continue until April 30, 2019, and may be renewed, revised, or revoked only with approval of the fund’s Board. The I Class is required to repay Price Associates for expenses previously paid to the extent the class’s net assets grow or expenses decline sufficiently to allow repayment without causing the class’s operating expenses (after the repayment is taken into account) to exceed both: (1) the expense limitation in place at the time such amounts were paid; and (2) the class’s current expense limitation. However, no repayment will be made more than three years after the date of a payment or waiver. For the year ended December 31, 2017, the I Class operated below its expense limitation.
In addition, the fund has entered into service agreements with Price Associates and two wholly owned subsidiaries of Price Associates (collectively, Price). Price Associates provides certain accounting and administrative services to the fund. T. Rowe Price Services, Inc. provides shareholder and administrative services in its capacity as the fund’s transfer and dividend-disbursing agent. T. Rowe Price Retirement Plan Services, Inc. provides subaccounting and recordkeeping services for certain retirement accounts invested in the Investor Class and I Class. For the year ended December 31, 2017, expenses incurred pursuant to these service agreements were $86,000 for Price Associates; $1,593,000 for T. Rowe Price Services, Inc.; and $163,000 for T. Rowe Price Retirement Plan Services, Inc. The total amount payable at period-end pursuant to these service agreements is reflected as Due to Affiliates in the accompanying financial statements.
The fund may invest its cash reserves in certain open-end management investment companies managed by Price Associates and considered affiliates of the fund: the T. Rowe Price Government Reserve Fund or the T. Rowe Price Treasury Reserve Fund, organized as money market funds, or the T. Rowe Price Short-Term Fund, a short-term bond fund (collectively, the Price Reserve

Proof #3
38
T. Rowe Price Global Technology Fund
Funds). The Price Reserve Funds are offered as short-term investment options to mutual funds, trusts, and other accounts managed by Price Associates or its affiliates and are not available for direct purchase by members of the public. Cash collateral from securities lending is invested in the T. Rowe Price Short-Term Fund. The Price Reserve Funds pay no investment management fees.
The fund may participate in securities purchase and sale transactions with other funds or accounts advised by Price Associates (cross trades), in accordance with procedures adopted by the fund’s Board and Securities and Exchange Commission rules, which require, among other things, that such purchase and sale cross trades be effected at the independent current market price of the security. Purchases and sales cross trades aggregated $44,552,000 and $20,495,000, respectively, with net realized loss of $1,483,000 for the year ended December 31, 2017.

Proof #3
39
T. Rowe Price Global Technology Fund
Report of Independent Registered Public Accounting Firm
To the Board of Directors and Shareholders of T. Rowe Price Global Technology Fund, Inc.
Opinion on the Financial Statements
We have audited the accompanying statement of assets and liabilities, including the portfolio of investments, of T. Rowe Price Global Technology Fund, Inc. (the “Fund”) as of December 31, 2017, the related statement of operations for the year ended December 31, 2017, the statement of changes in net assets for each of the two years in the period ended December 31, 2017, including the related notes, and the financial highlights for each of the periods indicated therein (collectively referred to as the “financial statements”). In our opinion, the financial statements present fairly, in all material respects, the financial position of the Fund as of December 31, 2017, the results of its operations for the year then ended, the changes in its net assets for each of the two years in the period ended December 31, 2017 and the financial highlights for each of the periods indicated therein, in conformity with accounting principles generally accepted in the United States of America.
Basis for Opinion
These financial statements are the responsibility of the Fund’s management. Our responsibility is to express an opinion on the Fund’s financial statements based on our audits. We are a public accounting firm registered with the Public Company Accounting Oversight Board (United States) (“PCAOB”) and are required to be independent with respect to the Fund in accordance with the U.S. federal securities laws and the applicable rules and regulations of the Securities and Exchange Commission and the PCAOB.
We conducted our audits of these financial statements in accordance with the standards of the PCAOB. Those standards require that we plan and perform the audit to obtain reasonable assurance about whether the financial statements are free of material misstatement, whether due to error or fraud.

Proof #3
40
T. Rowe Price Global Technology Fund
Report of Independent Registered Public Accounting Firm (continued)
Our audits included performing procedures to assess the risks of material misstatement of the financial statements, whether due to error or fraud, and performing procedures that respond to those risks. Such procedures included examining, on a test basis, evidence regarding the amounts and disclosures in the financial statements. Our audits also included evaluating the accounting principles used and significant estimates made by management, as well as evaluating the overall presentation of the financial statements. Our procedures included confirmation of securities owned as of December 31, 2017 by correspondence with the custodians, transfer agent and brokers; when replies were not received from brokers, we performed other auditing procedures. We believe that our audits provide a reasonable basis for our opinion.
PricewaterhouseCoopers LLPBaltimore, MarylandFebruary 15, 2018
We have served as the auditor of one or more investment companies in the T. Rowe Price group of investment companies since 1973.

Proof #3
41
T. Rowe Price Global Technology Fund
Tax Information for the Tax Year Ended 12/31/17
WeareprovidingthisinformationasrequiredbytheInternalRevenueCode.Theamountsshownmaydifferfromthoseelsewhereinthisreportbecauseofdifferencesbetweentaxandfinancialreportingrequirements.
Thefund’sdistributionstoshareholdersincluded:
• $719,094,000fromshort-termcapitalgains,
• $227,813,000fromlong-termcapitalgains,subjecttoalong-termcapitalgainstaxrateofnotgreaterthan20%.
Fortaxablenon-corporateshareholders,$12,912,000ofthefund’sincomerepresentsqualifieddividendincomesubjecttoalong-termcapitalgainstaxrateofnotgreaterthan20%.
Forcorporateshareholders,$6,441,000ofthefund’sincomequalifiesforthedividends-receiveddeduction.
AdescriptionofthepoliciesandproceduresusedbyT.RowePricefundsandportfoliostodeterminehowtovoteproxiesrelatingtoportfoliosecuritiesisavailableineachfund’sStatementofAdditionalInformation.youmayrequestthisdocumentbycalling1-800-225-5132orbyaccessingtheSEC’swebsite,sec.gov.
Thedescriptionofourproxyvotingpoliciesandproceduresisalsoavailableonourcorporatewebsite.Toaccessit,pleasevisitthefollowingWebpage:
https://www3.troweprice.com/usis/corporate/en/utility/policies.html
Scrolldowntothesectionnearthebottomofthepagethatsays,“ProxyvotingPolicies.”ClickontheProxyvotingPolicieslinkintheshadedbox.
Eachfund’smostrecentannualproxyvotingrecordisavailableonourwebsiteandthroughtheSEC’swebsite.ToaccessitthroughT.RowePrice,visitthewebsitelocationshownabove,andscrolldowntothesectionnearthebottomofthepagethatsays,“ProxyvotingRecords.”ClickontheProxyvotingRecordslinkintheshadedbox.
Information on Proxy Voting Policies, Procedures, and Records
ThefundfilesacompletescheduleofportfolioholdingswiththeSecuritiesandExchangeCommissionforthefirstandthirdquartersofeachfiscalyearonFormn-Q.Thefund’sFormn-QisavailableelectronicallyontheSEC’swebsite(sec.gov);hardcopiesmaybereviewedandcopiedattheSEC’sPublicReferenceRoom,100FSt.n.E.,Washington,DC20549.FormoreinformationonthePublicReferenceRoom,call1-800-SEC-0330.
How to Obtain Quarterly Portfolio Holdings

Proof #3
42
T. Rowe Price Global Technology Fund
About the Fund’s Directors and Officers
yourfundisoverseenbyaboardofDirectors(board)thatmeetsregularlytoreviewawidevarietyofmattersaffectingorpotentiallyaffectingthefund,includingperformance,investmentprograms,compliancematters,advisoryfeesandexpenses,serviceproviders,andbusinessandregulatoryaffairs.Theboardelectsthefund’sofficers,whoarelistedinthefinaltable.Atleast75%oftheboard’smembersareindependentofT.RowePriceAssociates,Inc.(T.RowePrice),anditsaffiliates;“inside”or“interested”directorsareemployeesorofficersofT.RowePrice.Thebusinessaddressofeachdirectorandofficeris100EastPrattStreet,baltimore,Maryland21202.TheStatementofAdditionalInformationincludesadditionalinformationaboutthefunddirectorsandisavailablewithoutchargebycallingaT.RowePricerepresentativeat1-800-638-5660.
Independent Directors
Name(Year of Birth)Year Elected*[Number of T. Rowe PricePortfolios Overseen]
Principal Occupation(s) and Directorships of Public Companies and Other Investment Companies During the Past Five Years
bruceW.Duncan(1951)2013[191]
ChiefExecutiveOfficerandDirector(2009toDecember2016),Chairmanoftheboard(January2016topresent),andPresident(2009toSeptember2016),FirstIndustrialRealtyTrust,anownerandoperatorofindustrialproperties;Chairmanoftheboard(2005toSeptember2016)andDirector(1999toSeptember2016),Starwoodhotels&Resorts,ahotelandleisurecompany;Director,bostonProperties(May2016topresent);Director,MarriottInternational,Inc.(September2016topresent)
RobertJ.Gerrard,Jr.(1952)2012[191]
AdvisoryboardMember,PipelineCrisis/WinningStrategies,acollaborativeworkingtoimproveopportunitiesforyoungAfricanAmericans(1997topresent)
PaulF.Mcbride(1956)2013[191]
AdvisoryboardMember,vizziaTechnologies(2015topresent)
CeciliaE.Rouse,Ph.D.(1963)2012[191]
Dean,WoodrowWilsonSchool(2012topresent);ProfessorandResearcher,Princetonuniversity(1992topresent);MemberofnationalAcademyofEducation(2010topresent);Director,MDRC,anonprofiteducationandsocialpolicyresearchorganization(2011topresent);ResearchAssociateofLaborStudiesProgram(2011to2015)andboardMember(2015topresent),nationalbureauofEconomicResearch(2011topresent);ChairofCommitteeontheStatusofMinorityGroupsintheEconomicProfession(2012topresent);vicePresident(2015topresent),AmericanEconomicAssociation
*Eachindependentdirectorservesuntilretirement,resignation,orelectionofasuccessor.

Proof #3
43
T. Rowe Price Global Technology Fund
Independent Directors (continued)
Name(Year of Birth)Year Elected*[Number of T. Rowe PricePortfolios Overseen]
Principal Occupation(s) and Directorships of Public Companies and Other Investment Companies During the Past Five Years
JohnG.Schreiber(1946)2001[191]
Owner/President,CentaurCapitalPartners,Inc.,arealestateinvestmentcompany(1991topresent);Cofounder,Partner,andCochairmanoftheInvestmentCommittee,blackstoneRealEstateAdvisors,L.P.(1992to2015);Director,GeneralGrowthProperties,Inc.(2010to2013);Director,blackstoneMortgageTrust,arealestatefinancecompany(2012to2016);DirectorandChairmanoftheboard,brixmorPropertyGroup,Inc.(2013topresent);Director,hiltonWorldwide(2013topresent);Director,hudsonPacificProperties(2014to2016)
MarkR.Tercek(1957)2009[191]
PresidentandChiefExecutiveOfficer,ThenatureConservancy(2008topresent)
*Eachindependentdirectorservesuntilretirement,resignation,orelectionofasuccessor.
Inside Directors
Name(Year of Birth)Year Elected*[Number of T. Rowe Price Portfolios Overseen]
Principal Occupation(s) and Directorships of Public Companies and Other Investment Companies During the Past Five Years
EdwardC.bernard(1956)2006[191]
DirectorandvicePresident,T.RowePrice;viceChairmanoftheboard,Director,andvicePresident,T.RowePriceGroup,Inc.;Chairmanoftheboard,Director,andvicePresident,T.RowePriceInvestmentServices,Inc.,andT.RowePriceServices,Inc.;ChairmanoftheboardandDirector,T.RowePriceRetirementPlanServices,Inc.;Chairmanoftheboard,ChiefExecutiveOfficer,Director,andPresident,T.RowePriceInternationalandT.RowePriceTrustCompany;Chairmanoftheboard,allfunds
RobertW.Sharps,CFA,CPA**(1971)2017[135]
vicePresident,T.RowePrice,T.RowePriceGroup,Inc.,andT.RowePriceTrustCompany
*Eachinsidedirectorservesuntilretirement,resignation,orelectionofasuccessor.**EffectiveApril1,2017,brianC.RogerswasreplacedbyRobertW.Sharpsasaninsidedirectorof
certainPriceFunds.

Proof #3
44
T. Rowe Price Global Technology Fund
Officers
Name (Year of Birth)Position Held With Global Technology Fund Principal Occupation(s)
kennardW.Allen(1977)vicePresident
vicePresident,T.RowePriceandT.RowePriceGroup,Inc.
Darrelln.braman(1963)vicePresidentandSecretary
vicePresident,Pricehongkong,PriceSingapore,T.RowePrice,T.RowePriceGroup,Inc.,T.RowePriceInternational,T.RowePriceInvestmentServices,Inc.,andT.RowePriceServices,Inc.
ChristopherW.Carlson(1967)vicePresident
vicePresident,T.RowePriceandT.RowePriceGroup,Inc.
GregoryDunham,CFA(1974)vicePresident
vicePresident,T.RowePriceandT.RowePriceGroup;formerly,Analyst,GoldmanSachs(to2015)
DavidJ.Eiswert,CFA(1972)vicePresident
vicePresident,T.RowePrice,T.RowePriceGroup,Inc.,andT.RowePriceInternational
henryM.Ellenbogen(1973)vicePresident
vicePresident,T.RowePrice,T.RowePriceGroup,Inc.,andT.RowePriceTrustCompany
JohnR.Gilner(1961)ChiefComplianceOfficer
ChiefComplianceOfficerandvicePresident,T.RowePrice;vicePresident,T.RowePriceGroup,Inc.,andT.RowePriceInvestmentServices,Inc.
PaulD.GreeneII(1978)vicePresident
vicePresident,T.RowePriceandT.RowePriceGroup,Inc.
PaulJ.krug,CPA(1964)vicePresident
vicePresident,T.RowePrice,T.RowePriceGroup,Inc.,andT.RowePriceTrustCompany
JacquelineL.Liu(1979)vicePresident
vicePresident,PricehongkongandT.RowePriceGroup,Inc.;formerly,InvestmentAnalyst,FidelityInternationalhongkongLimited(to2014)
JenniferMartin(1972)vicePresident
vicePresident,T.RowePriceandT.RowePriceGroup,Inc.
CatherineD.Mathews(1963)TreasurerandvicePresident
vicePresident,T.RowePrice,T.RowePriceGroup,Inc.,andT.RowePriceTrustCompany
heatherk.McPherson,CPA(1967)vicePresident
vicePresident,T.RowePriceandT.RowePriceGroup,Inc.
unlessotherwisenoted,officershavebeenemployeesofT.RowePriceorT.RowePriceInternationalforatleast5years.

Proof #3
45
T. Rowe Price Global Technology Fund
Officers (continued)
Name (Year of Birth)Position Held With Global Technology Fund Principal Occupation(s)
TobiasF.Mueller(1980)vicePresident
vicePresident,T.RowePriceGroup,Inc.,andT.RowePriceInternational
DavidOestreicher(1967)vicePresident
Director,vicePresident,andSecretary,T.RowePriceInvestmentServices,Inc.,T.RowePriceRetirementPlanServices,Inc.,T.RowePriceServices,Inc.,andT.RowePriceTrustCompany;ChiefLegalOfficer,vicePresident,andSecretary,T.RowePriceGroup,Inc.;vicePresidentandSecretary,T.RowePriceandT.RowePriceInternational;vicePresident,PricehongkongandPriceSingapore
JohnW.Ratzesberger(1975)vicePresident
vicePresident,T.RowePrice,T.RowePriceGroup,Inc.,andT.RowePriceTrustCompany;formerly,northAmericanheadofListedDerivativesOperation,MorganStanley(to2013)
Shannonh.Rauser(1987)AssistantSecretary
Employee,T.RowePrice
CoreyD.Shull,CFA(1983)vicePresident
vicePresident,T.RowePriceandT.RowePriceGroup,Inc.
Joshuak.Spencer,CFA(1973)President
vicePresident,T.RowePriceandT.RowePriceGroup,Inc.
AlanTu(1985)vicePresident
vicePresident,T.RowePriceandT.RowePriceGroup,Inc.;formerly,student,universityofChicagoboothSchoolofbusiness(to2014);intern,T.RowePrice(to2013)
MeganWarren(1968)vicePresident
vicePresident,T.RowePrice,T.RowePriceGroup,Inc.,T.RowePriceRetirementPlanServices,Inc.,T.RowePriceServices,Inc.,andT.RowePriceTrustCompany;formerly,ExecutiveDirector,JPMorganChase(to2017)
Thomash.Watson(1977)vicePresident
DirectorandvicePresident,T.RowePriceTrustCompany;vicePresident,T.RowePriceandT.RowePriceGroup,Inc.
AlisonMeiLingyip(1966)vicePresident
vicePresident,PricehongkongandT.RowePriceGroup,Inc.
unlessotherwisenoted,officershavebeenemployeesofT.RowePriceorT.RowePriceInternationalforatleast5years.
Proof #3
F132-050 2/18
STOCK FUNDSDomestic Blue Chip GrowthCapital Appreciation‡
Capital OpportunityDiversified Mid-Cap GrowthDividend GrowthEquity IncomeEquity Index 500Extended Equity Market IndexFinancial ServicesGrowth & IncomeGrowth StockHealth Sciences‡
Media & TelecommunicationsMid-Cap Growth‡
Mid-Cap Value‡
New America GrowthNew EraNew Horizons‡
QM U.S. Small & Mid-Cap Core EquityQM U.S. Small-Cap Growth EquityQM U.S. Value EquityReal EstateScience & TechnologySmall-Cap Stock‡
Small-Cap ValueTax-Efficient Equity Total Equity Market IndexU.S. Large-Cap CoreValue
ASSET ALLOCATION FUNDSBalanced Global AllocationPersonal Strategy BalancedPersonal Strategy GrowthPersonal Strategy IncomeReal AssetsSpectrum GrowthSpectrum IncomeSpectrum InternationalTarget Date Fundsˆ
BOND FUNDSDomestic TaxableCorporate IncomeCredit OpportunitiesFloating RateGNMA High Yield‡
Inflation Protected BondLimited Duration Inflation
Focused BondNew IncomeShort-Term BondTotal ReturnUltra Short-Term BondU.S. Bond Enhanced IndexU.S. High YieldU.S. Treasury IntermediateU.S. Treasury Long-Term
Domestic Tax-FreeCalifornia Tax-Free BondGeorgia Tax-Free BondIntermediate Tax-Free High YieldMaryland Short-Term Tax-Free BondMaryland Tax-Free BondNew Jersey Tax-Free BondNew York Tax-Free BondSummit Municipal IncomeSummit Municipal IntermediateTax-Free High YieldTax-Free IncomeTax-Free Short-IntermediateVirginia Tax-Free Bond
MONEY MARKET FUNDSTaxableCash Reserves1
Government Money2
U.S. Treasury Money2
MONEY MARKET FUNDS (cont.)Tax-FreeCalifornia Tax-Free Money1
Maryland Tax-Free Money1
New York Tax-Free Money1
Summit Municipal Money Market1
Tax-Exempt Money1
INTERNATIONAL/GLOBAL FUNDSStockAfrica & Middle EastAsia OpportunitiesEmerging EuropeEmerging Markets StockEmerging Markets Value StockEuropean Stock Global ConsumerGlobal Growth StockGlobal IndustrialsGlobal Real EstateGlobal StockGlobal Technology‡
International Concentrated EquityInternational DiscoveryInternational Equity IndexInternational StockInternational Value EquityJapanLatin AmericaNew AsiaOverseas StockQM Global Equity
BondDynamic Global BondEmerging Markets BondEmerging Markets Corporate BondEmerging Markets Local Currency BondGlobal High Income BondGlobal Multi-Sector BondInternational BondInternational Bond (USD Hedged)
T.RowePriceInvestmentServices,Inc.100EastPrattStreetbaltimore,MD21202
Thispagecontainssupplementaryinformationthatisnotpartoftheshareholderreport.
T. Rowe Price Mutual Funds
201802-365973
Call 1-800-225-5132 to request a prospectus or summary prospectus; each includes investment objectives, risks, fees, expenses, and other information that you should read and consider carefully before investing. ‡Subjecttocertainexceptions,thefundiscurrentlyclosedtonewinvestorsandnewaccounts.
ˆTheTargetDateFundsareinclusiveoftheRetirementFunds,theTargetFunds,andtheRetirementbalancedFund.
1 Retail Funds: You could lose money by investing in the Fund. Although the Fund seeks to preserve the value of your investment at $1.00 per share, it cannot guarantee it will do so. Beginning October 14, 2016, the Fund may impose a fee upon the sale of your shares or may temporarily suspend your ability to sell shares if the Fund’s liquidity falls below required minimums because of market conditions or other factors. An investment in the Fund is not insured or guaranteed by the Federal Deposit Insurance Corporation or any other government agency. The Fund’s sponsor has no legal obligation to provide financial support to the Fund, and you should not expect that the sponsor will provide financial support to the Fund at any time.
2 Government Funds: You could lose money by investing in the Fund. Although the Fund seeks to preserve the value of your investment at $1.00 per share, it cannot guarantee it will do so. An investment in the Fund is not insured or guaranteed by the Federal Deposit Insurance Corporation or any other government agency. The Fund’s sponsor has no legal obligation to provide financial support to the Fund, and you should not expect that the sponsor will provide financial support to the Fund at any time.