Embed Size (px)
Citation preview
Investor PresentationQ2’14 financial results
September 2014
C f P l t S A C it l GCyfrowy Polsat S.A. Capital Group
Disclaimer
Thi t ti i l d 'f d l ki t t t ' All t t t th th t t t f hi t i l f t i l d d i thiThis presentation includes 'forward‐looking statements'. All statements other than statements of historical facts included in thispresentation, including, without limitation, those regarding our financial position, business strategy, plans and objectives ofmanagement for future operations (including development plans and objectives relating to our products and services) are forward‐looking statements. Such forward‐looking statements involve known and unknown risks, uncertainties and other important factors thatcould cause the actual results, performance or achievements to be materially different from future results, performance orp y pachievements expressed or implied by such forward‐looking statements. Such forward‐looking statements are based on numerousassumptions regarding our present and future business strategies and the environment in which we will operate in the future. Theseforward‐looking statements speak only as at the date of this presentation. We expressly disclaim any obligation or undertaking todisseminate any updates or revisions to any forward‐looking statements contained herein to reflect any change in our expectationswith regard thereto or any change in events conditions or circumstances on which any such statement is based We caution you thatwith regard thereto or any change in events, conditions or circumstances on which any such statement is based. We caution you thatforward‐looking statements are not guarantees of future performance and that our actual financial position, business strategy, plansand objectives of management for future operations may differ materially from those made in or suggested by the forward‐lookingstatements contained in this presentation. In addition, even if our financial position, business strategy, plans and objectives ofmanagement for future operations are consistent with the forward‐looking statements contained in this presentation, those results ordevelopments may not be indicative of results or developments in future periods. We do not undertake any obligation to review or toconfirm or to release publicly any revisions to any forward‐looking statements to reflect events that occur or circumstances that ariseafter the date of this presentation.
As consolidation of the results of Metelem Holding Company Limited, the company indirectly controlling Polkomtel, started from 7 May2014, the Company has decided to adjust the method of presentation of its operational data so as to align it with the new structure andmode of operation of our Group. The presentation contains the new set of key performance indicators (KPI’s), covering our operationsin the fields of telecommunications and pay TV. The operational indicators from before that period are only of informational nature andthey demonstrate the impact that Metelem Group’s operational performance, Polkomtel’s results in particular, would have the Group’soperational results had Metelem Group been part of Polsat Group during these periods The KPI’s are illustrative only and due to theiroperational results, had Metelem Group been part of Polsat Group during these periods. The KPI s are illustrative only and due to theirnature they only present a hypothetical situation, hence they do not present the Group’s actual operational results for specific periods.
.
Contents
1. Who we are
k2. Our market strategy
3 Operating results in Q2’143. Operating results in Q2 14
4 Realization of synergies4. Realization of synergies
5. Financial results in Q2’14Q
6. Executive summary

1 Wh1. Who we are
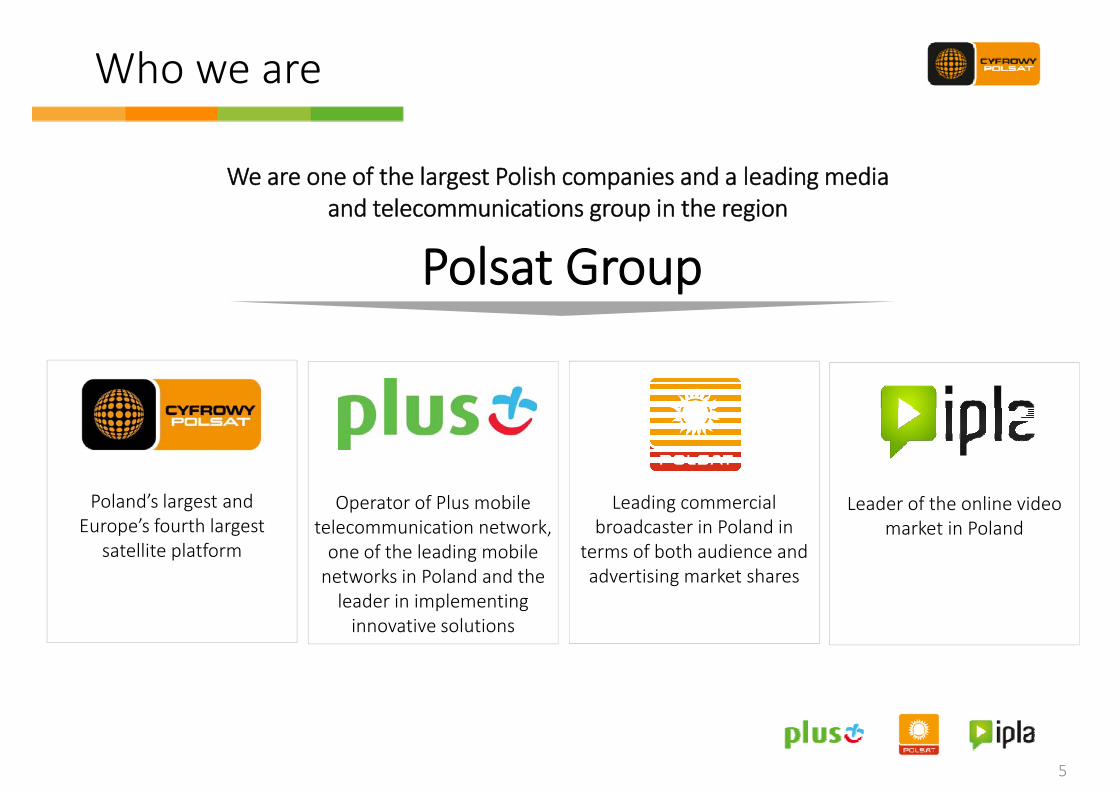
Who we are
We are one of the largest Polish companies and a leading media
Polsat Group
We are one of the largest Polish companies and a leading media and telecommunications group in the region
Polsat Group
Poland’s largest and Europe’s fourth largest
Operator of Plus mobile telecommunication network
Leading commercial broadcaster in Poland in
Leader of the online video market in PolandEurope s fourth largest
satellite platformtelecommunication network, one of the leading mobile networks in Poland and the leader in implementing
broadcaster in Poland in terms of both audience and advertising market shares
market in Poland
innovative solutions
5
Pay‐TV and telecommunicationy
Pay‐TV market in Polandd ll
Cyfrowy CATV operators2
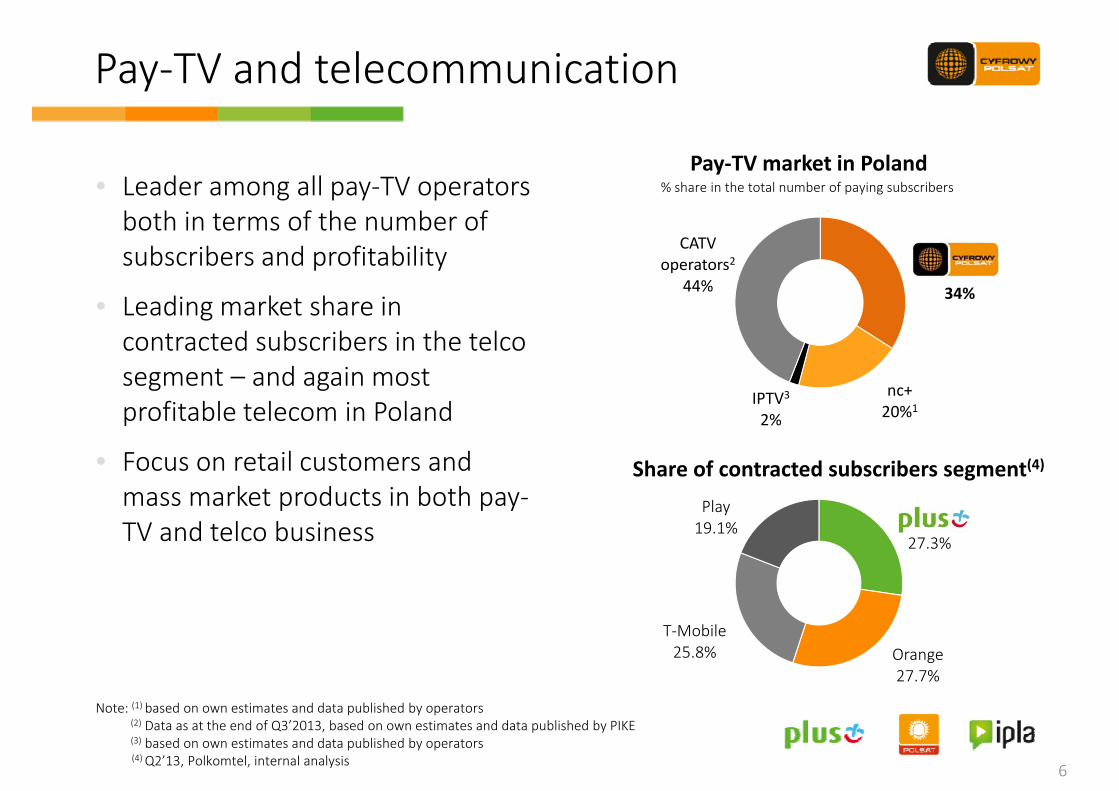
% share in the total number of paying subscribers • Leader among all pay‐TV operators both in terms of the number of subscribers and profitability
Polsat34%
operators244%
subscribers and profitability
• Leading market share in contracted subscribers in the telco
nc+20%1
IPTV3
2%
segment – and again most profitable telecom in Poland
.PlusPlay19 1%
Share of contracted subscribers segment(4)• Focus on retail customers and mass market products in both pay‐TV d t l b i .Plus
27.3%19.1%TV and telco business
Orange27.7%
T‐Mobile25.8%
(1) b d d d bl h d b
6
Note: (1) based on own estimates and data published by operators (2) Data as at the end of Q3’2013, based on own estimates and data published by PIKE(3) based on own estimates and data published by operators(4) Q2’13, Polkomtel, internal analysis
TV broadcasting and video online
Audience share
g
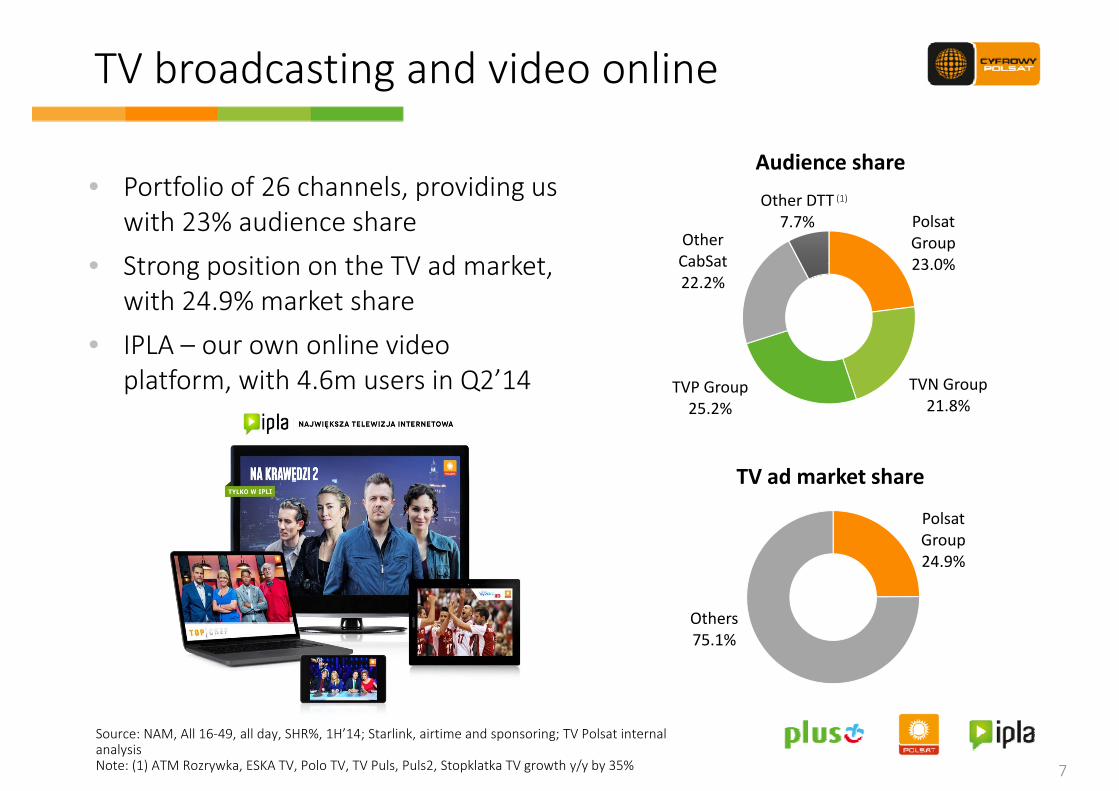
• Portfolio of 26 channels, providing us with 23% audience share
• Strong position on the TV ad market
PolsatGroup23 0%
Other CabSat
Other DTT 7.7%
(1)
• Strong position on the TV ad market, with 24.9% market share
• IPLA – our own online video
23.0%CabSat22.2%
IPLA our own online video platform, with 4.6m users in Q2’14 TVN Group
21.8%TVP Group25.2%
Polsat
TV ad market share
Group24.9%
OthOthers75.1%
7
Source: NAM, All 16‐49, all day, SHR%, 1H’14; Starlink, airtime and sponsoring; TV Polsat internal analysisNote: (1) ATM Rozrywka, ESKA TV, Polo TV, TV Puls, Puls2, Stopklatka TV growth y/y by 35%
Leader of LTE technologygy
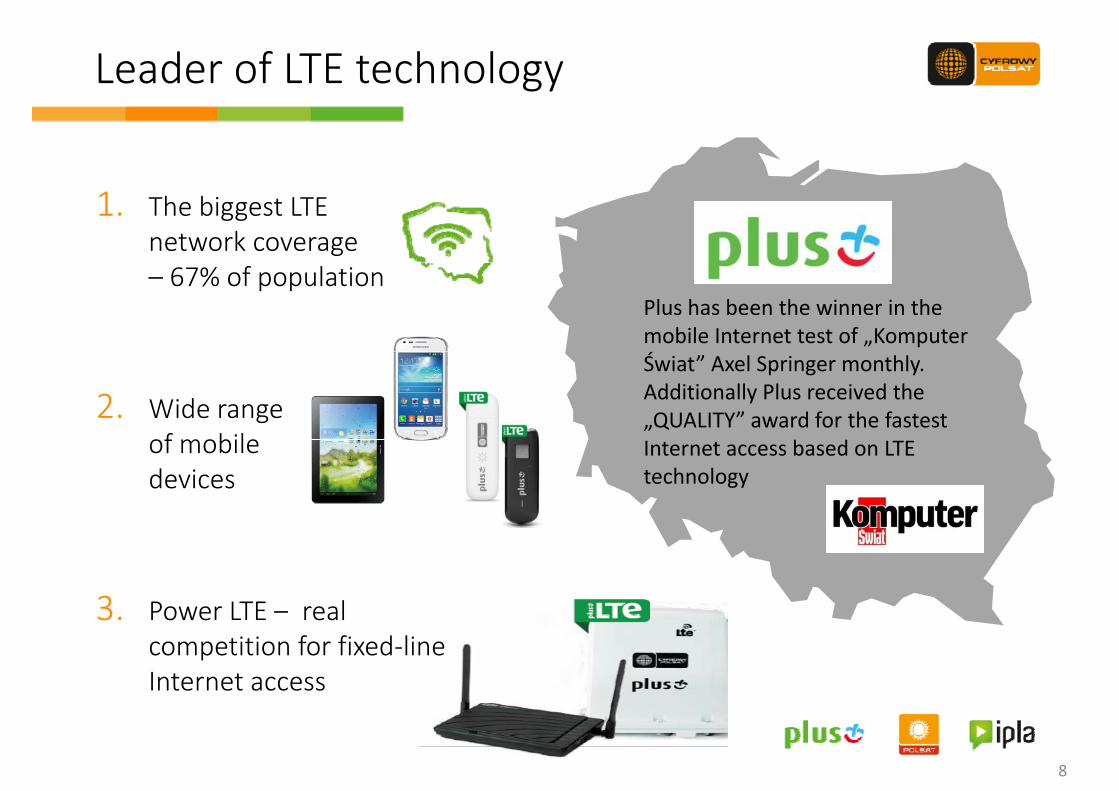
1. The biggest LTE network coverage – 67% of population
Plus has been the winner in the mobile Internet test of „Komputer
2. Wide rangeof mobile
Świat” Axel Springer monthly. Additionally Plus received the „QUALITY” award for the fastest
of mobile devices
Internet access based on LTE technology
3 Power LTE – real3. Power LTE realcompetition for fixed‐line Internet access
8
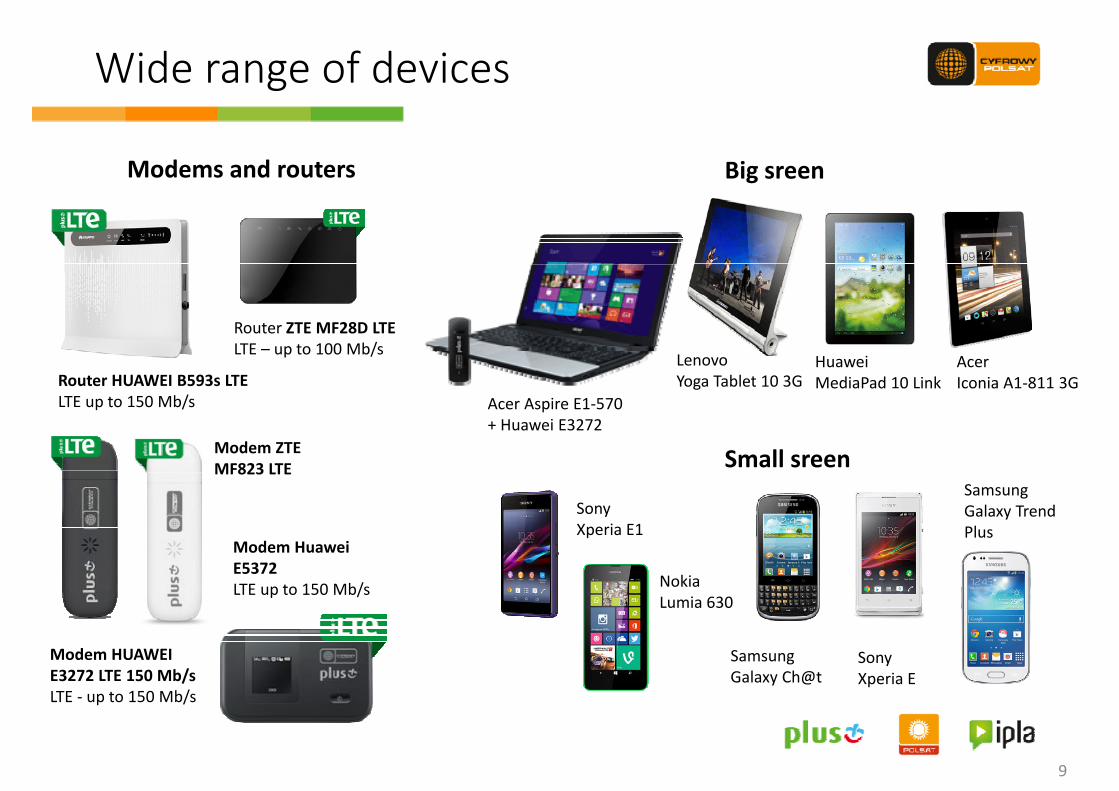
Wide range of devicesg
Modems and routers Big sreenModems and routers Big sreen
Router ZTE MF28D LTELTE – up to 100 Mb/sLTE up to 100 Mb/s
Router HUAWEI B593s LTELTE up to 150 Mb/s
HuaweiMediaPad 10 Link
LenovoYoga Tablet 10 3G
AcerIconia A1‐811 3G
Acer Aspire E1‐570 + Huawei E3272
Modem ZTE MF823 LTE Small sreen
Sony Xperia E1
Samsung Galaxy Trend Pl
Modem HuaweiE5372LTE up to 150 Mb/s
Xperia E1
NokiaLumia 630
Plus
Modem HUAWEI E3272 LTE 150 Mb/sLTE ‐ up to 150 Mb/s
Samsung Galaxy Ch@t
Sony Xperia E
9
p /
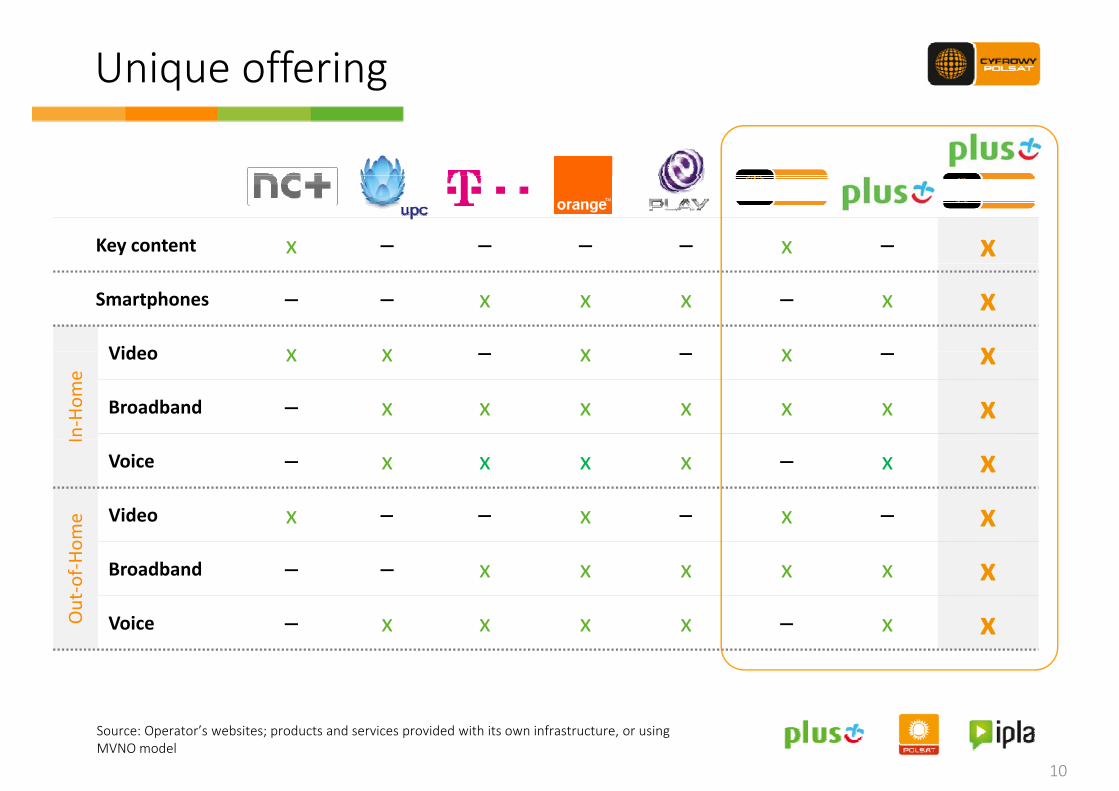
Unique offeringq g
Key content x – – – – x – xSmartphones – – x x x – x xVideo x x x x x
n‐Ho
me
Video x x – x – x – xBroadband – x x x x x x x
I
Voice – x x x x – x x
me Video x – – x – x – x
Out‐of‐H
om
Broadband – – x x x x x x
O Voice – x x x x – x x
10
Source: Operator’s websites; products and services provided with its own infrastructure, or using MVNO model
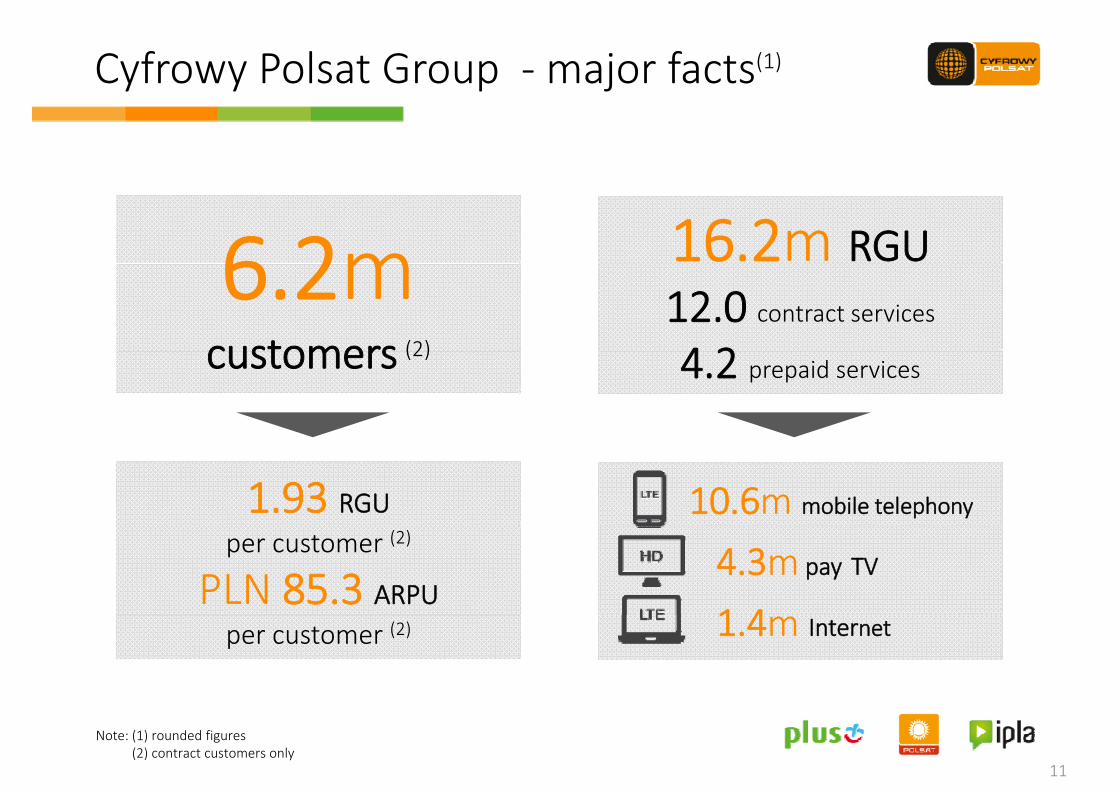
Cyfrowy Polsat Group ‐major facts(1)y y p j
6 2m 16.2m RGU6.2m customers (2)
12.0 contract services
4 2customers (2) 4.2 prepaid services
10.6m mobile telephony1.93 RGU
4.3mpay TV
1 4
per customer (2)
PLN 85.3 ARPU1.4m Internetper customer (2)
11
Note: (1) rounded figures(2) contract customers only

2 O k2. Our market strategy
Our vision
Entertainment and telecoms market leader in Poland.
W ill i d d d li h i We will continue to produce and deliver the most attractive content
and telecoms services, using the best and the latest technologies,
in order to provide high quality multi‐play services which address
changing needs, while maintaining the highest levels of customer
satisfaction
13
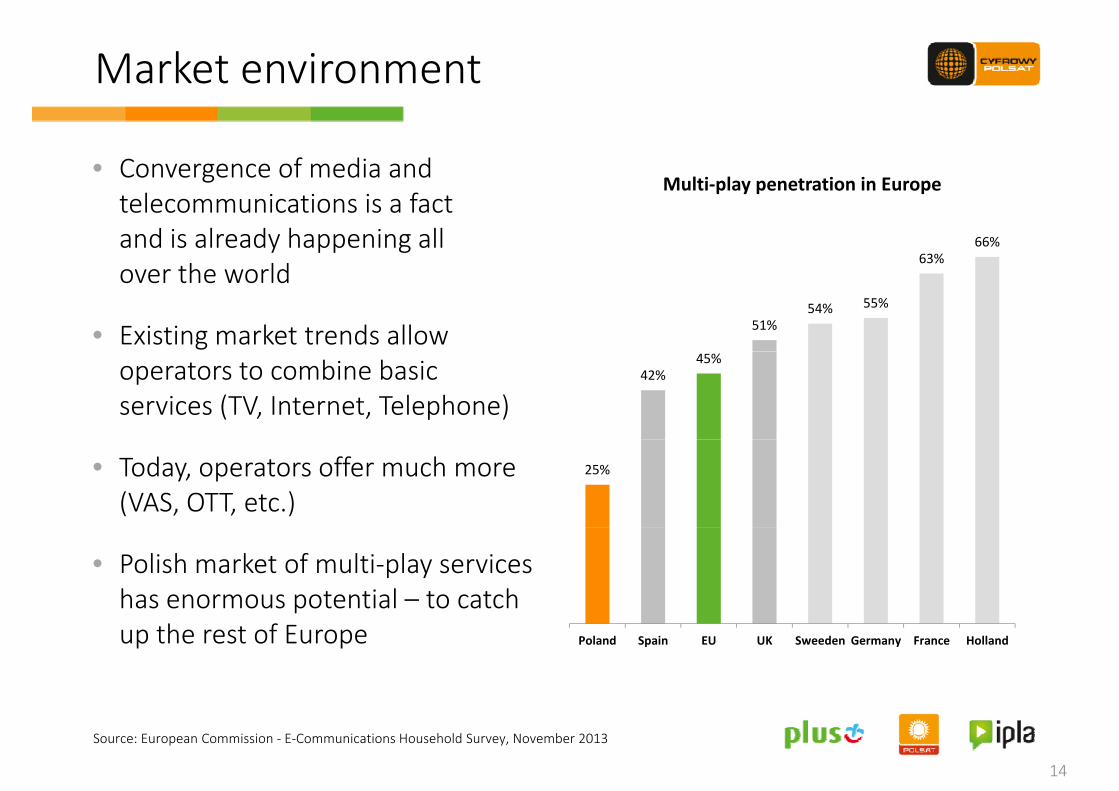
Market environment
• Convergence of media andConvergence of media and telecommunications is a fact and is already happening all
h ld63%
66%
Multi‐play penetration in Europe
over the world
• Existing market trends allow 51%54% 55%
operators to combine basic services (TV, Internet, Telephone)
42%45%
• Today, operators offer much more (VAS, OTT, etc.)
25%
• Polish market of multi‐play services has enormous potential – to catch up the rest of Europe Poland Spain EU UK Sweeden Germany France Holland
14
Source: European Commission ‐ E‐Communications Household Survey, November 2013
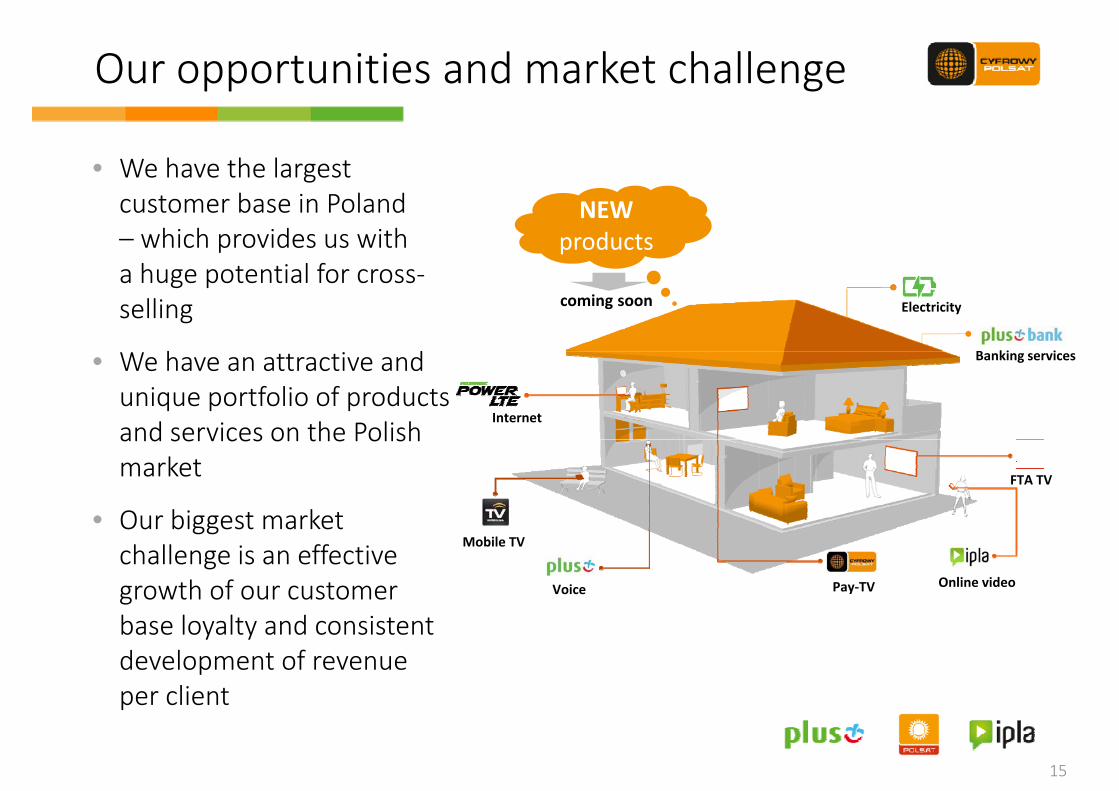
Our opportunities and market challengepp g
• We have the largestWe have the largest customer base in Poland – which provides us with h l f
NEW products
a huge potential for cross‐selling
h d B ki i
Electricitycoming soon
• We have an attractive and unique portfolio of products and services on the Polish
Internet
Banking services
and services on the Polish market
• Our biggest marketFTA TV
Our biggest market challenge is an effective growth of our customer b l l d
Pay‐TV Online videoVoice
Mobile TV
base loyalty and consistent development of revenue per client
15
per client
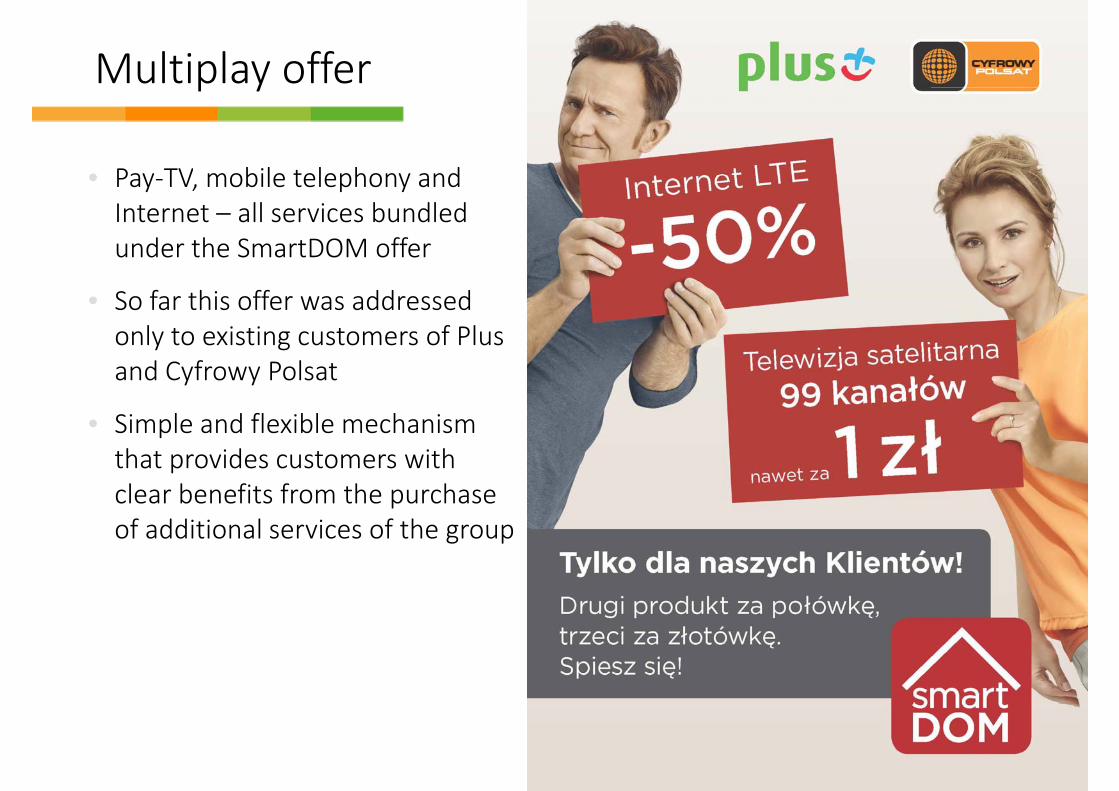
Multiplay offerp y
• Pay TV mobile telephony and• Pay‐TV, mobile telephony and Internet – all services bundled under the SmartDOM offer
• So far this offer was addressed only to existing customers of Plus and Cyfrowy Polsat
• Simple and flexible mechanism that provides customers with clear benefits from the purchase of additional services of the groupof additional services of the group
1616
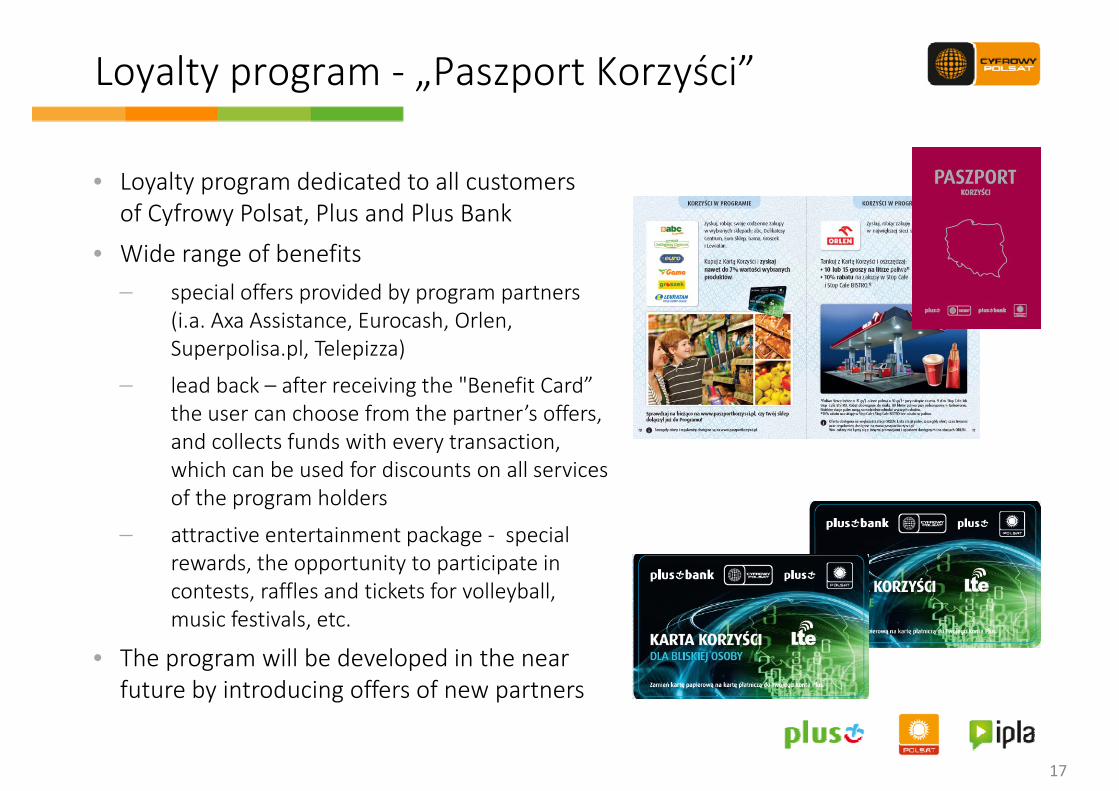
Loyalty program ‐ „Paszport Korzyści”
L lt d di t d t ll t
y y p g „ p y
• Loyalty program dedicated to all customers of Cyfrowy Polsat, Plus and Plus Bank
• Wide range of benefits g special offers provided by program partners
(i.a. Axa Assistance, Eurocash, Orlen, Superpolisa pl Telepizza)Superpolisa.pl, Telepizza)
lead back – after receiving the "Benefit Card” the user can choose from the partner’s offers, and collects funds with every transactionand collects funds with every transaction, which can be used for discounts on all services of the program holders
i i k i l attractive entertainment package ‐ special rewards, the opportunity to participate in contests, raffles and tickets for volleyball,
i f ti l tmusic festivals, etc.
• The program will be developed in the near future by introducing offers of new partners
17

3. Operating results in Q2’14
3. Operating results in Q2’14
3 1 S t f i t i di id l3.1 Segment of services to individual and business customers
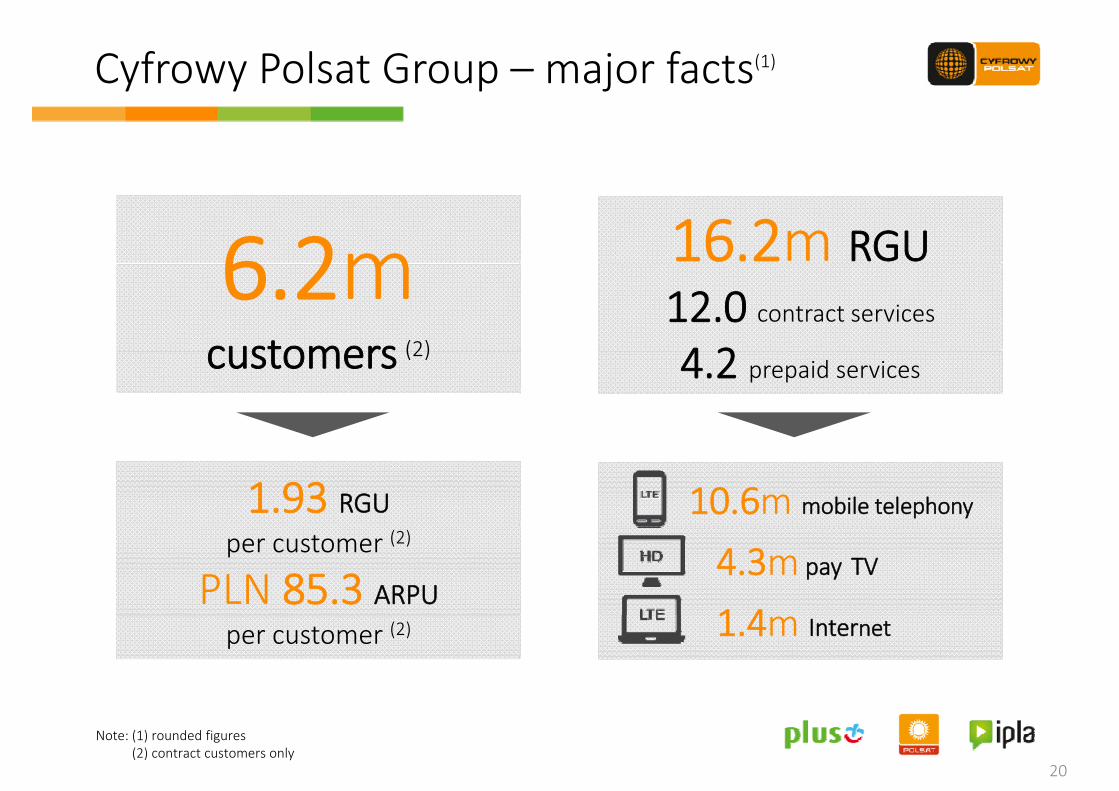
Cyfrowy Polsat Group – major facts(1)y y p j
6 2m 16.2m RGU6.2m customers (2)
12.0 contract services
4 2customers (2) 4.2 prepaid services
10.6m mobile telephony1.93 RGU
4.3mpay TV
1 4
per customer (2)
PLN 85.3 ARPU1.4m Internetper customer (2)
20
Note: (1) rounded figures(2) contract customers only
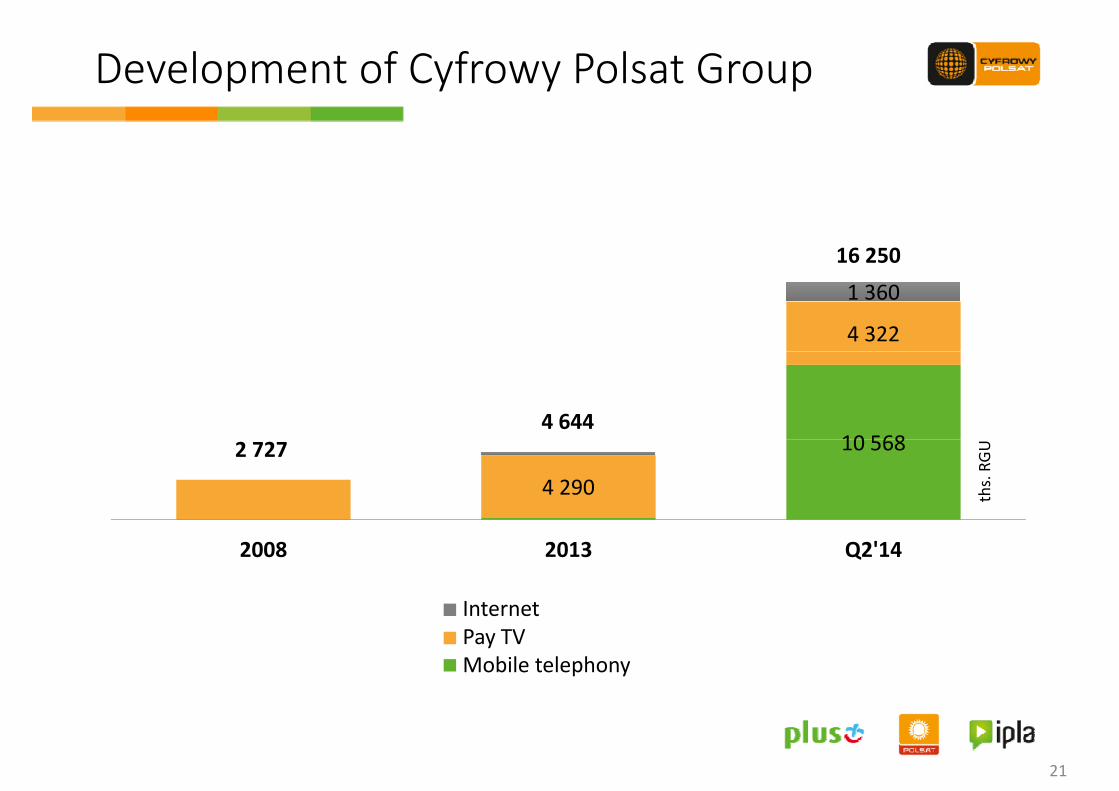
Development of Cyfrowy Polsat Groupp y y p
16 250
4 322
1 360
10 5684 644
10 568
4 290
2 727
ths. RGU
2008 2013 Q2'14
InternetInternetPay TVMobile telephony
21
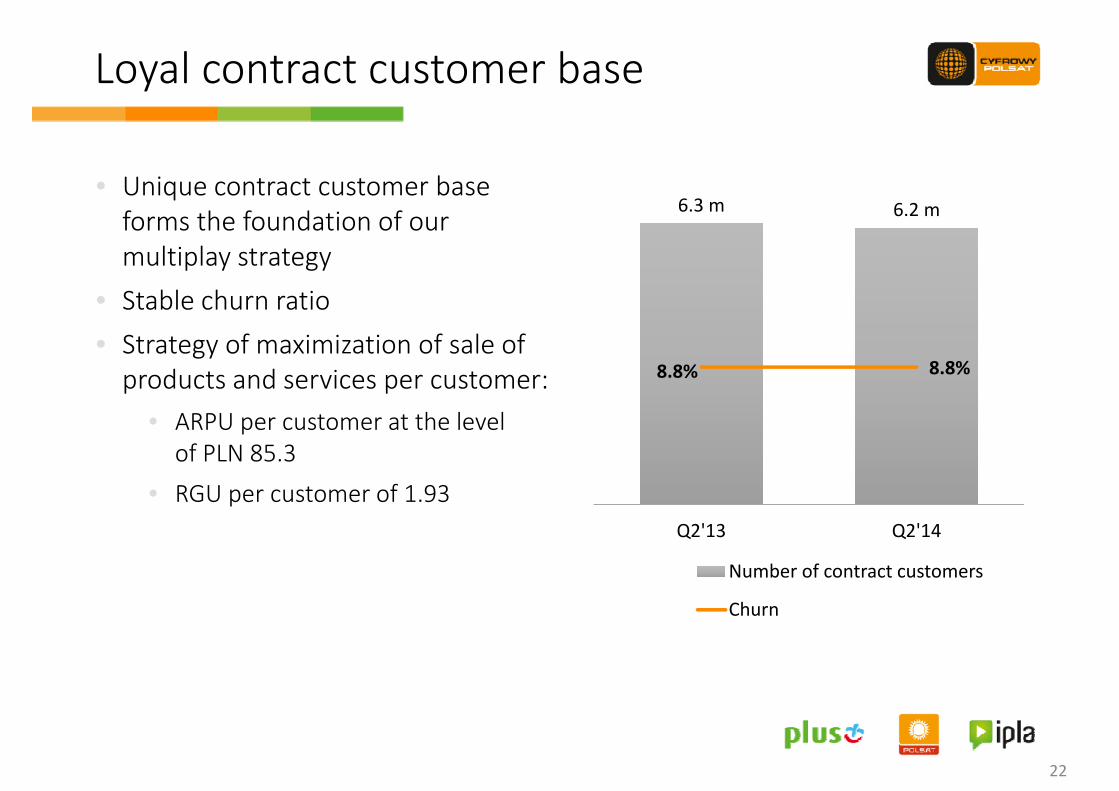
Loyal contract customer basey
b• Unique contract customer baseforms the foundation of our multiplay strategy
6.3 m 6.2 m
16%
18%
20%
6
7
multiplay strategy• Stable churn ratio• Strategy of maximization of sale of 10%
12%
14%
4
5
Strategy of maximization of sale of products and services per customer:
• ARPU per customer at the level
8.8% 8.8%
4%
6%
8%
10%
2
3
of PLN 85.3
• RGU per customer of 1.93 0%
2%
4%
0
1
Q2'13 Q2'14Q2'13 Q2'14
Number of contract customers
ChurnChurn
22
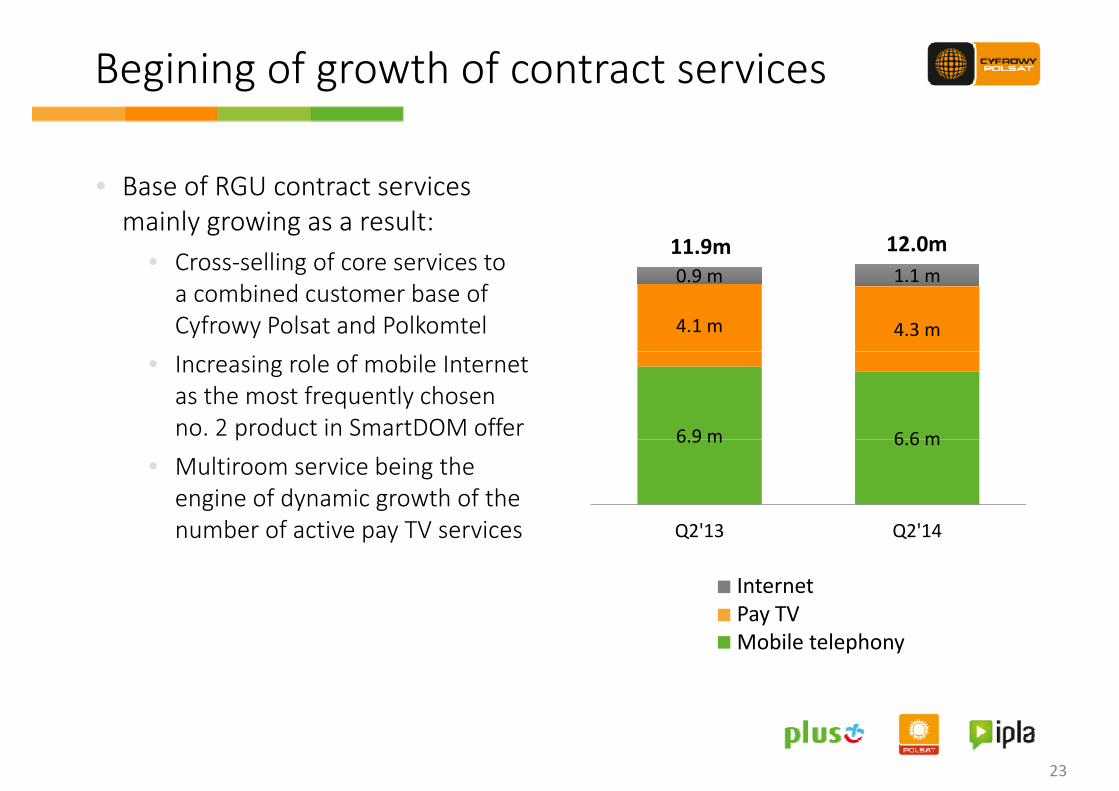
Begining of growth of contract services g g g
f• Base of RGU contract services mainly growing as a result:
• Cross‐selling of core services to11.9m 12.0m
4.1 m 4.3 m
0.9 m 1.1 m• Cross‐selling of core services to a combined customer base of Cyfrowy Polsat and Polkomtel
6 9 m 6 6 m
• Increasing role of mobile Internet as the most frequently chosen no. 2 product in SmartDOM offer 6.9 m 6.6 m
Q2'13 Q2'14
p• Multiroom service being the engine of dynamic growth of the number of active pay TV services Q2'13 Q2'14
Mobile telephony
Pay TV
number of active pay TV services
InternetPay TVPay TV
Internet
Pay TVMobile telephony
23
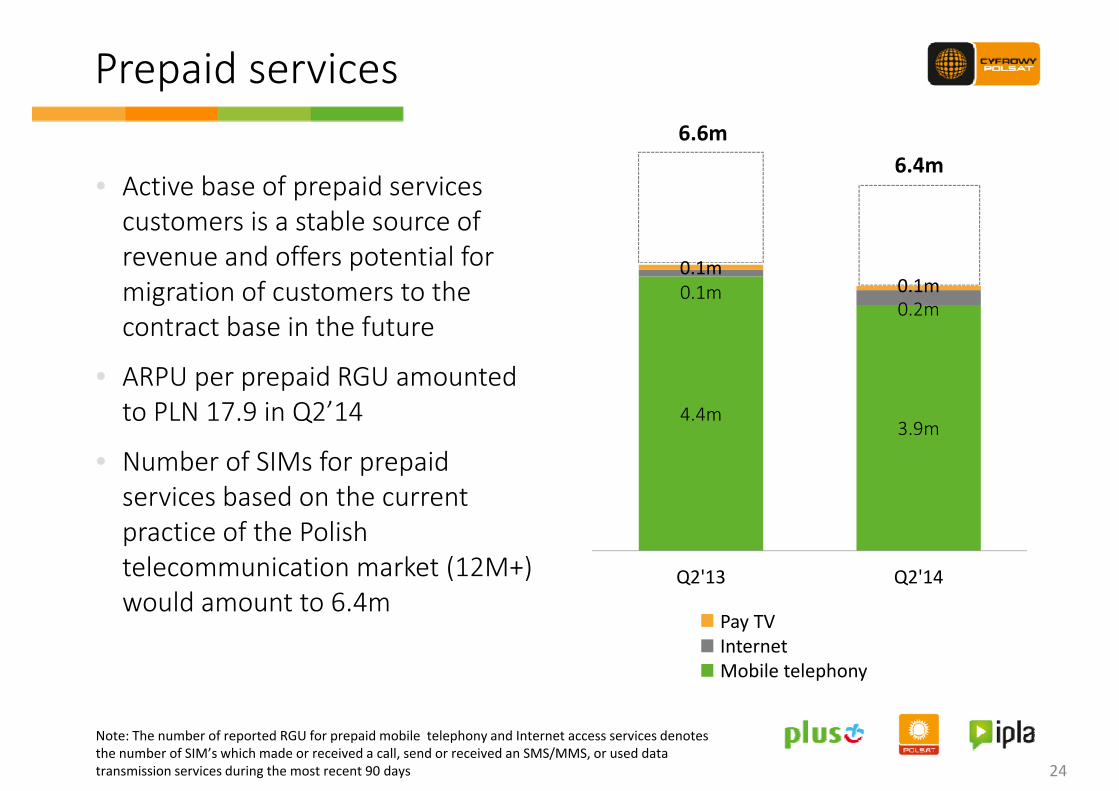
Prepaid servicesp
b f d
6.6m6.4m
• Active base of prepaid services customers is a stable source of revenue and offers potential for 0 1revenue and offers potential for migration of customers to the contract base in the future
0.1m0.2m
0.1m0.1m
• ARPU per prepaid RGU amountedto PLN 17.9 in Q2’14 4.4m
3.9m
• Number of SIMs for prepaid services based on the current
ti f th P li hpractice of the Polish telecommunication market (12M+) would amount to 6.4m
Q2'13 Q2'14
Telefonia komórkowaP TVTelefonia komórkowaInternet Płatna telewizja
Pay TVInternetMobile telephony
24
Note: The number of reported RGU for prepaid mobile telephony and Internet access services denotes the number of SIM’s which made or received a call, send or received an SMS/MMS, or used data transmission services during the most recent 90 days
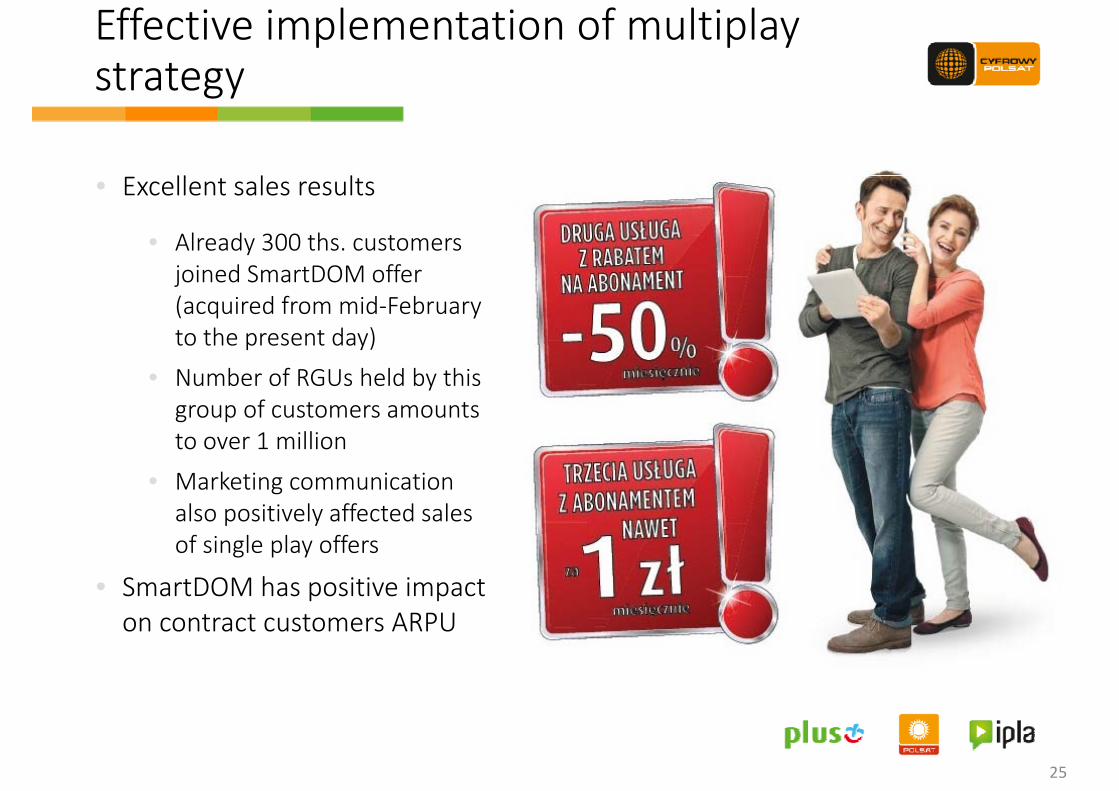
Effective implementation of multiplay strategy
ll l l
strategy
• Excellent sales results
• Already 300 ths. customers joined SmartDOM offer (acquired from mid‐February to the present day)
• Number of RGUs held by this group of customers amounts to over 1 millionto over 1 million
• Marketing communication also positively affected sales of single play offers
• SmartDOM has positive impact t t t ARPUon contract customers ARPU
25
3. Operating results in Q2’14
3.2 TV broadcasting and production segment
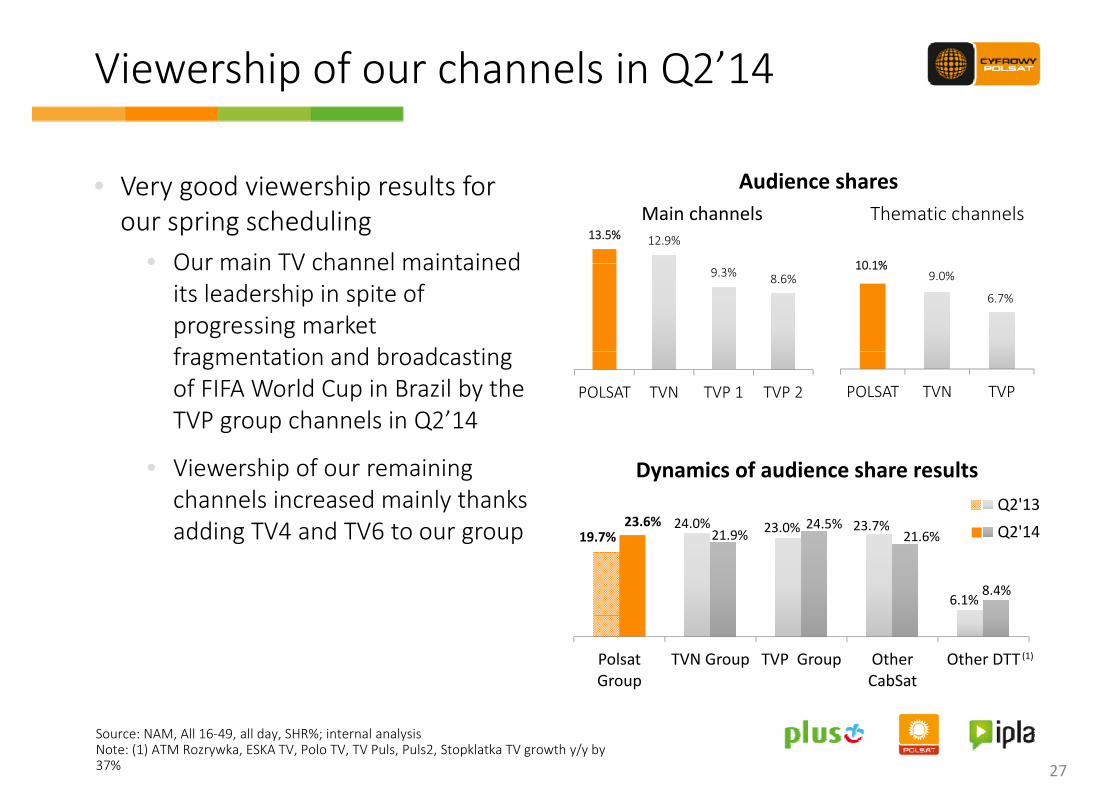
Viewership of our channels in Q2’14p
d h l f A di h
10 1%
• Very good viewership results for our spring scheduling
• Our main TV channel maintained
Thematic channels13.5% 12.9%
Audience sharesMain channels
10.1%9.0%
6.7%
• Our main TV channel maintained its leadership in spite of progressing market f t ti d b d ti
9.3% 8.6%
POLSAT TVN TVP
fragmentation and broadcasting of FIFA World Cup in Brazil by the TVP group channels in Q2’14
POLSAT TVN TVP 1 TVP 2
• Viewership of our remaining channels increased mainly thanks adding TV4 and TV6 to our group 24.0% 23 0% 23 7%23.6% 24.5%
Q2'13Q2'14
Dynamics of audience share results
adding TV4 and TV6 to our group 19.7%24.0% 23.0% 23.7%
6.1%
21.9%24.5%
21.6%
8.4%
Q2'14
Polsat Group
TVN Group TVP Group Other CabSat
Other DTT(1)
Source: NAM, All 16‐49, all day, SHR%; internal analysisNote: (1) ATM Rozrywka, ESKA TV, Polo TV, TV Puls, Puls2, Stopklatka TV growth y/y by 37% 27
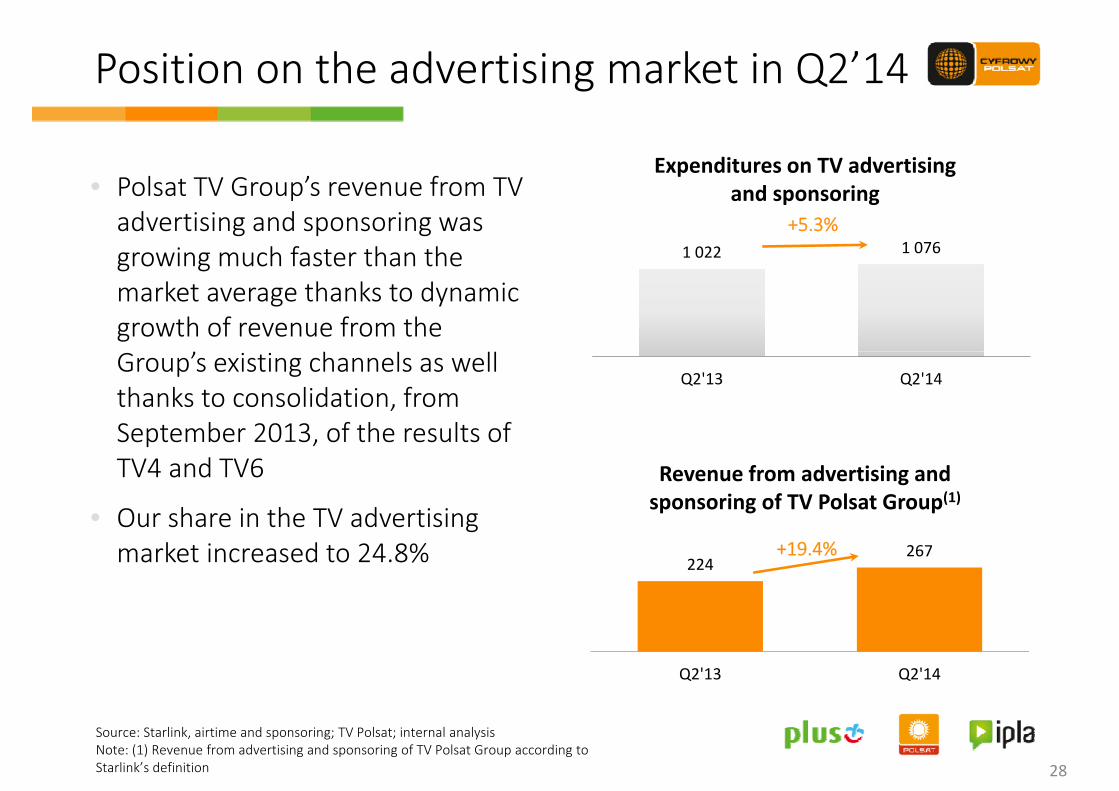
Position on the advertising market in Q2’14 g
Expenditures on TV advertising
1 022 1 076
• Polsat TV Group’s revenue from TV advertising and sponsoring was growing much faster than the
+5.3%
p gand sponsoring
growing much faster than the market average thanks to dynamic growth of revenue from the
Q2'13 Q2'14Group’s existing channels as well thanks to consolidation, from September 2013, of the results ofSeptember 2013, of the results of TV4 and TV6
• Our share in the TV advertising
Revenue from advertising and sponsoring of TV Polsat Group(1)Ou s a e e ad e s g
market increased to 24.8% 224267+19.4%
Q2'13 Q2'14
Source: Starlink, airtime and sponsoring; TV Polsat; internal analysisNote: (1) Revenue from advertising and sponsoring of TV Polsat Group according to Starlink’s definition 28

4 R li i f i4. Realization of synergies
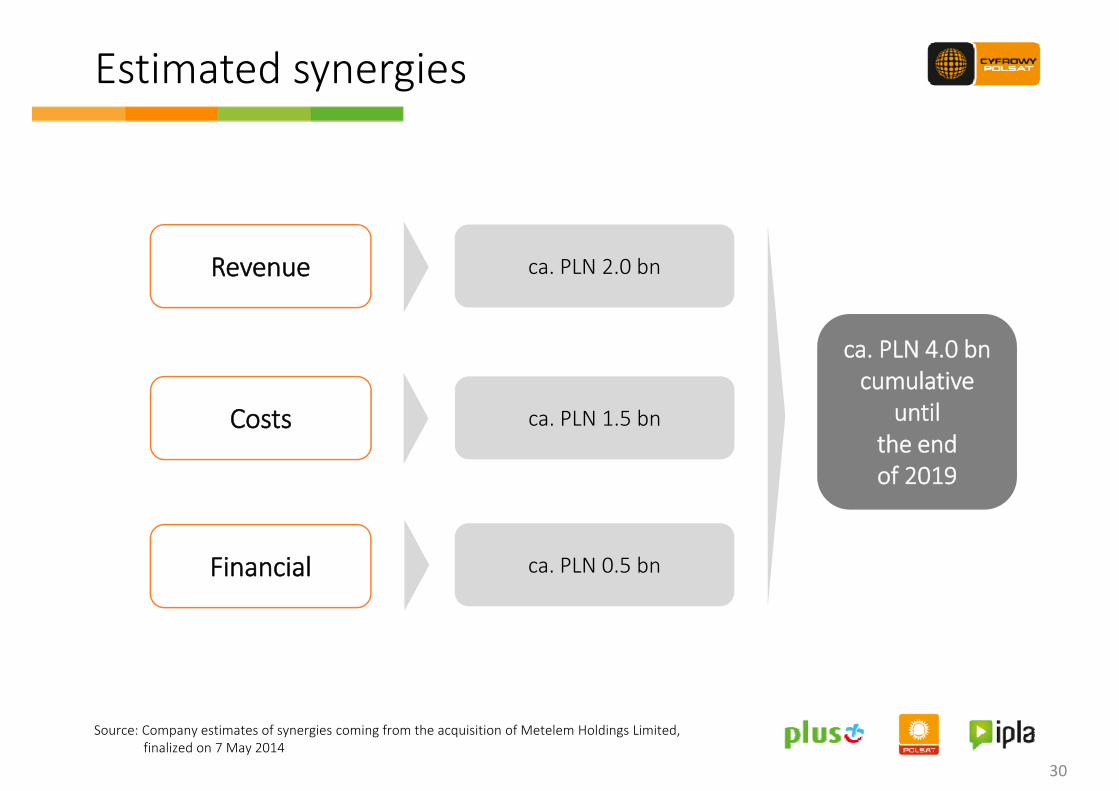
Estimated synergiesy g
Revenue ca PLN 2 0 bnRevenue ca. PLN 2.0 bn
ca PLN 4 0 bn
Costs ca. PLN 1.5 bn
ca. PLN 4.0 bncumulative
untilth dthe end of 2019
Financial ca. PLN 0.5 bn
30
Source: Company estimates of synergies coming from the acquisition of Metelem Holdings Limited, finalized on 7 May 2014
Realization of synergiesy g
• Continuation of operational integration of Cyfrowy Polsat and PolkomtelContinuation of operational integration of Cyfrowy Polsat and Polkomtel• Appointment of Dominik Libicki, CP President and CEO to the position of PLK Vice‐President
• Appointment of Tobias Solorz, President of PLK, to the position of Vice‐President of CP
• Appointment of Tomasz Szeląg, CP Board Member, to the position of PLK Board Member and entrusting him with the management of financial matters of the whole capital group
• Continuation of implementation of numerous projects with a viewContinuation of implementation of numerous projects with a view to accomplish the planned synergies in the following areas:
• Marketing
• Sales
• Customer Service and Retention
• IT• IT
• Finance
• Realization of announced financial synergies y g• New credit facilities agreement for CP
• Repayment of CP’s old bank loan, redemption of CP Senior Notes (7.125%)redemption of PLK PIK Notes (14 25%)
31
redemption of PLK PIK Notes (14.25%)
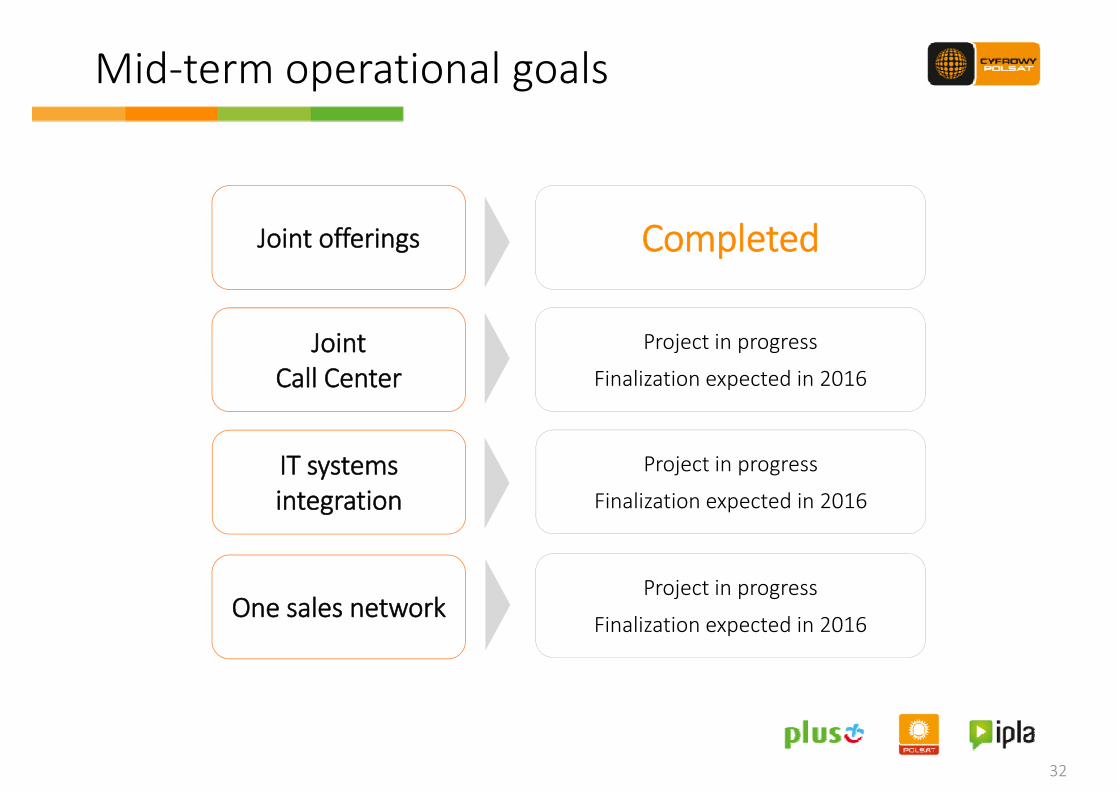
Mid‐term operational goalsp g
Joint offerings Completed
Joint Project in progressJointCall Center
j p g
Finalization expected in 2016
IT systemsintegration
Project in progress
Finalization expected in 2016
One sales networkProject in progress
One sales networkFinalization expected in 2016
32
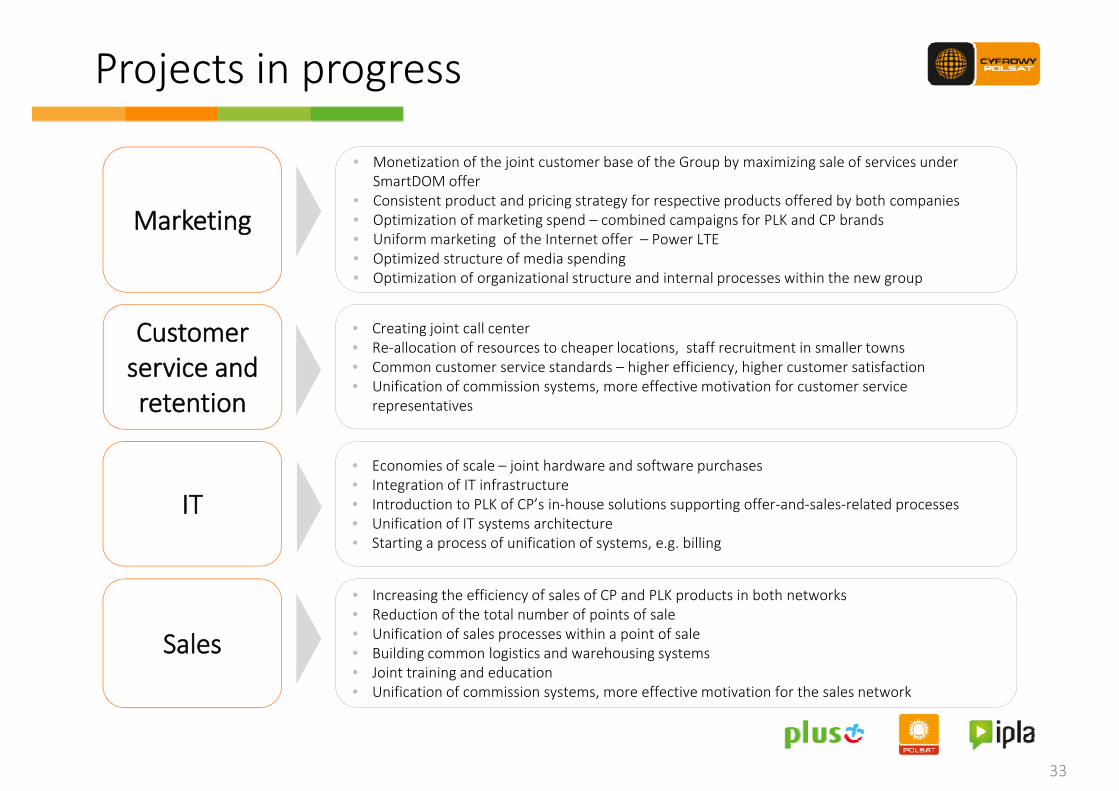
Projects in progressj p g
• Monetization of the joint customer base of the Group by maximizing sale of services under ff
MarketingSmartDOM offer
• Consistent product and pricing strategy for respective products offered by both companies• Optimization of marketing spend – combined campaigns for PLK and CP brands• Uniform marketing of the Internet offer – Power LTE• Optimized structure of media spending
Customer • Creating joint call center • Re‐allocation of resources to cheaper locations, staff recruitment in smaller towns
Optimized structure of media spending• Optimization of organizational structure and internal processes within the new group
service and retention
Re allocation of resources to cheaper locations, staff recruitment in smaller towns• Common customer service standards – higher efficiency, higher customer satisfaction• Unification of commission systems, more effective motivation for customer service
representatives
IT• Economies of scale – joint hardware and software purchases• Integration of IT infrastructure• Introduction to PLK of CP’s in‐house solutions supporting offer‐and‐sales‐related processes• Unification of IT systems architecture
• Increasing the efficiency of sales of CP and PLK products in both networks• Reduction of the total number of points of sale
Unification of IT systems architecture• Starting a process of unification of systems, e.g. billing
Sales• Reduction of the total number of points of sale• Unification of sales processes within a point of sale• Building common logistics and warehousing systems• Joint training and education• Unification of commission systems, more effective motivation for the sales network
33
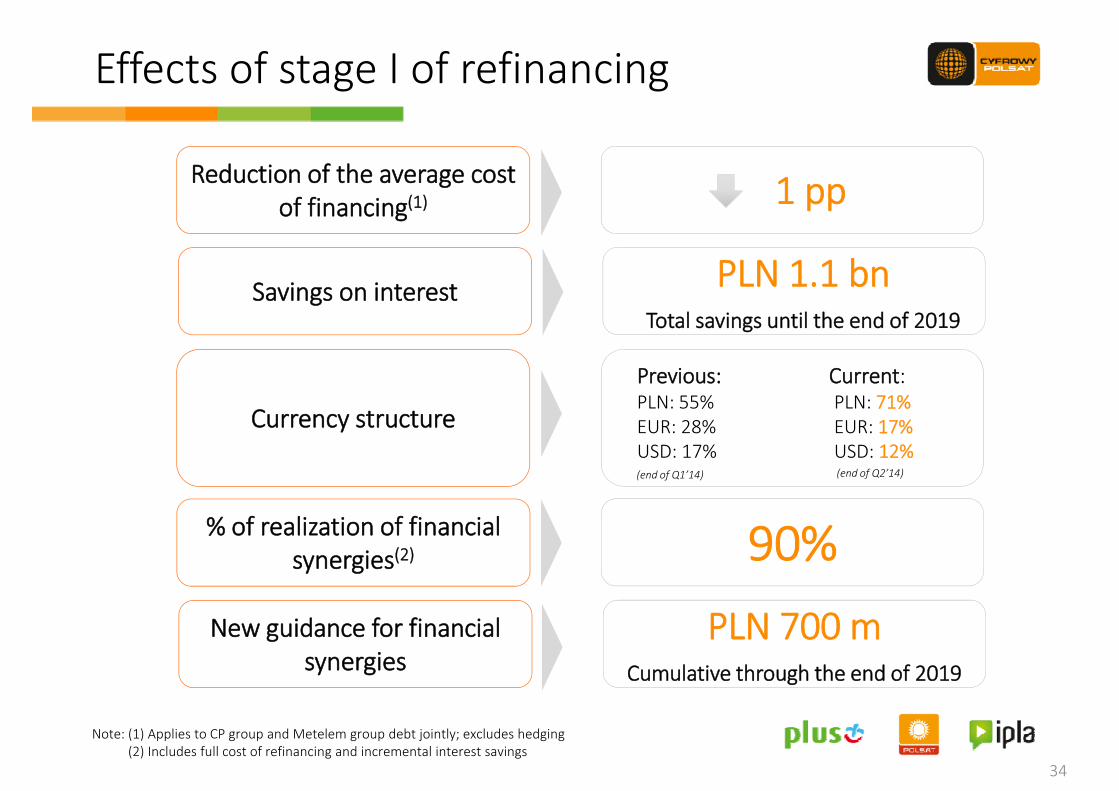
Effects of stage I of refinancingg g
Reduction of the average costReduction of the average cost of financing(1) 1 pp
PLN 1 1 bSavings on interest PLN 1.1 bnTotal savings until the end of 2019
Currency structure
Previous: Current:PLN: 55% PLN: 71% EUR: 28% EUR: 17%
% of realization of financial 90%
USD: 17% USD: 12%(end of Q2’14)(end of Q1’14)
% of realization of financial synergies(2) 90%
PLN 700New guidance for financial synergies
PLN 700 mCumulative through the end of 2019
34
Note: (1) Applies to CP group and Metelem group debt jointly; excludes hedging(2) Includes full cost of refinancing and incremental interest savings
5 Fi i l l i Q2’125. Financial results in Q2’12
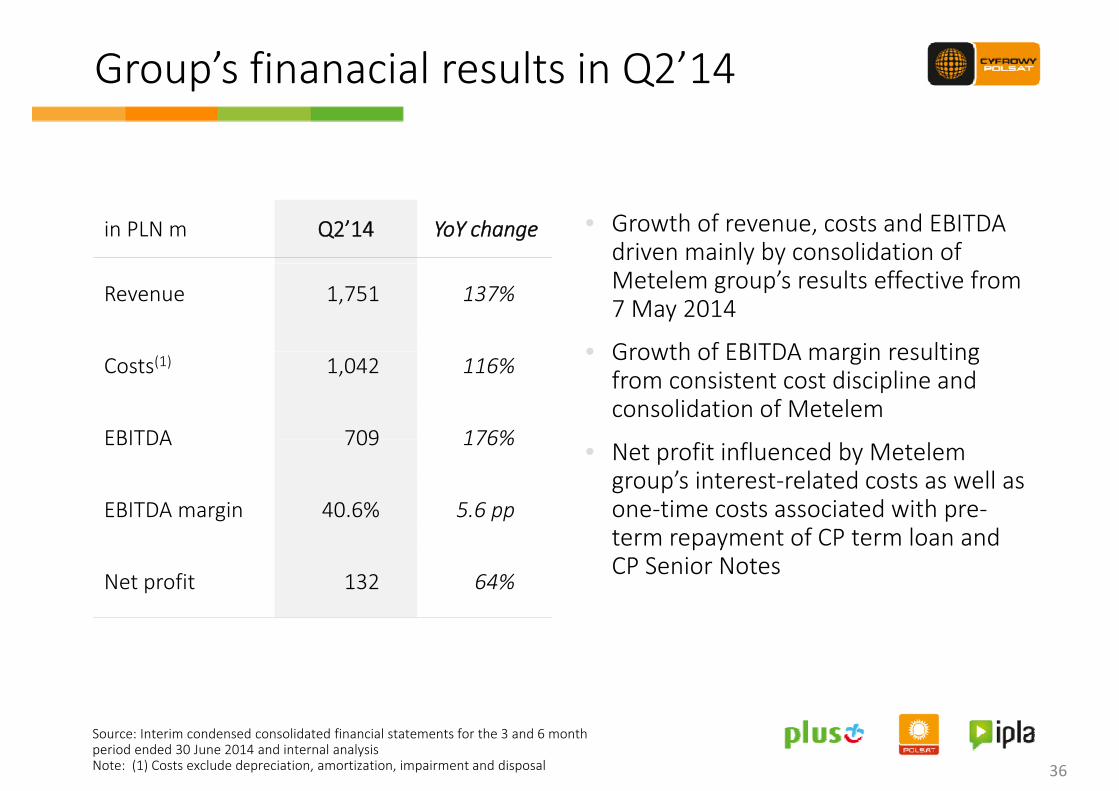
Group’s finanacial results in Q2’14p
in PLN m Q2’14 YoY change • Growth of revenue, costs and EBITDA driven mainly by consolidation of
Revenue 1,751 137%
y yMetelem group’s results effective from 7 May 2014
• Growth of EBITDA margin resultingCosts(1) 1,042 116%
EBITDA 709 176%
• Growth of EBITDA margin resulting from consistent cost discipline and consolidation of Metelem
EBITDA 709 176%
EBITDA margin 40.6% 5.6 pp
• Net profit influenced by Metelemgroup’s interest‐related costs as well as one‐time costs associated with pre‐
Net profit 132 64%
term repayment of CP term loan and CP Senior Notes
Source: Interim condensed consolidated financial statements for the 3 and 6 month period ended 30 June 2014 and internal analysisNote: (1) Costs exclude depreciation, amortization, impairment and disposal 36
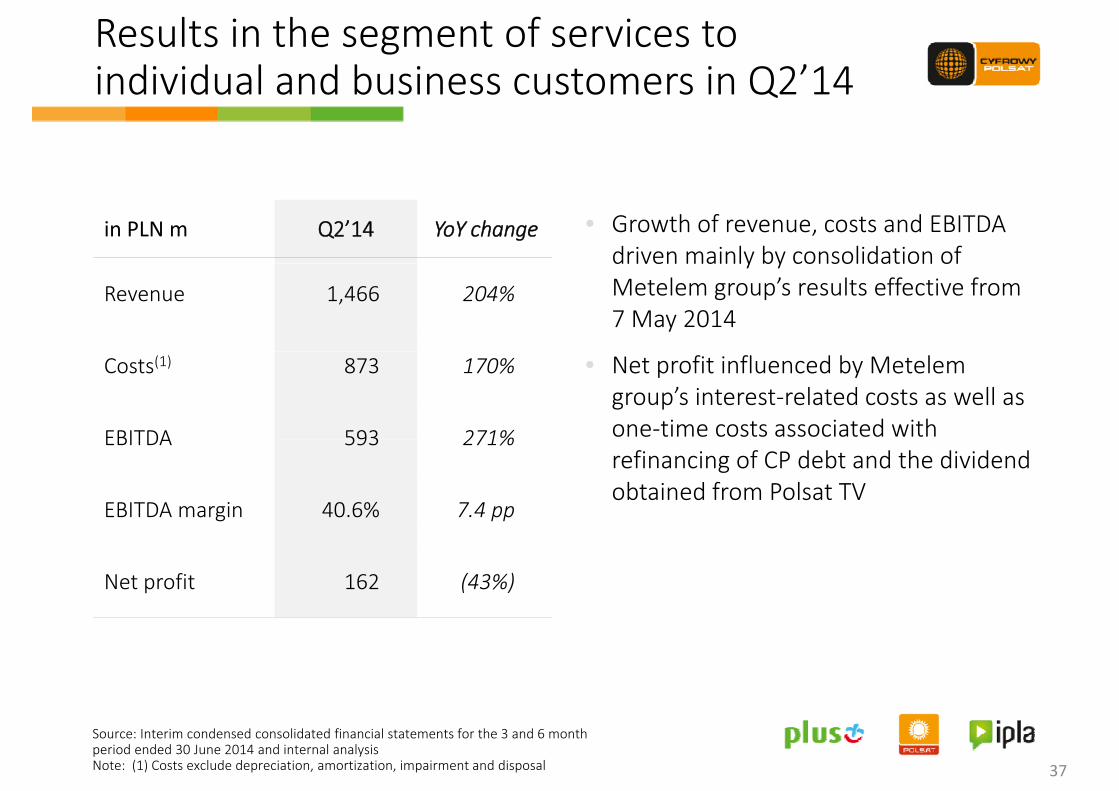
Results in the segment of services to individual and business customers in Q2’14individual and business customers in Q2 14
in PLN m Q2’14 YoY change • Growth of revenue, costs and EBITDA driven mainly by consolidation of
Revenue 1,466 204%
driven mainly by consolidation of Metelem group’s results effective from 7 May 2014
Costs(1) 873 170%
EBITDA 593 271%
• Net profit influenced by Metelemgroup’s interest‐related costs as well as one‐time costs associated with EBITDA 593 271%
EBITDA margin 40.6% 7.4 pp
refinancing of CP debt and the dividend obtained from Polsat TV
Net profit 162 (43%)
Source: Interim condensed consolidated financial statements for the 3 and 6 month period ended 30 June 2014 and internal analysisNote: (1) Costs exclude depreciation, amortization, impairment and disposal 37
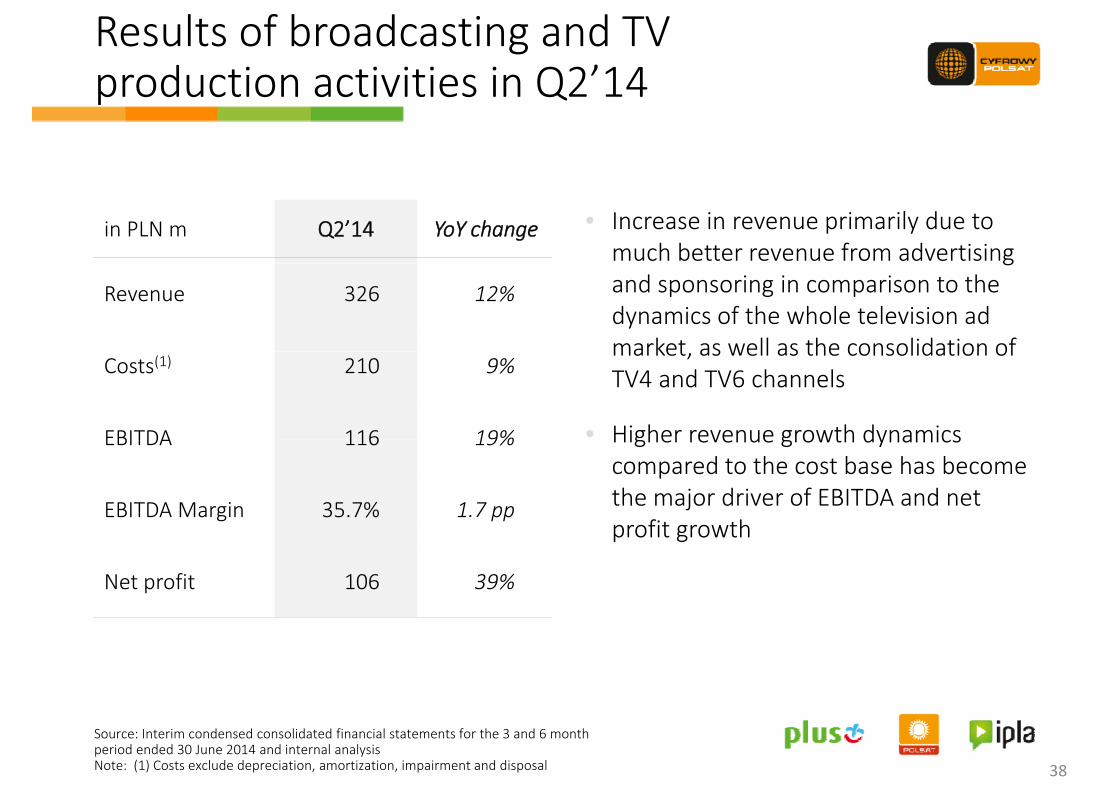
Results of broadcasting and TV production activities in Q2’14production activities in Q2 14
• Increase in revenue primarily due to much better revenue from advertising
in PLN m Q2’14 YoY changeg
and sponsoring in comparison to the dynamics of the whole television ad market as well as the consolidation of
Revenue 326 12%
market, as well as the consolidation of TV4 and TV6 channels
• Higher revenue growth dynamics
Costs(1) 210 9%
EBITDA 116 19% Higher revenue growth dynamics compared to the cost base has become the major driver of EBITDA and net profit growth
EBITDA 116 19%
EBITDA Margin 35.7% 1.7 ppprofit growth
Net profit 106 39%
Source: Interim condensed consolidated financial statements for the 3 and 6 month period ended 30 June 2014 and internal analysisNote: (1) Costs exclude depreciation, amortization, impairment and disposal 38
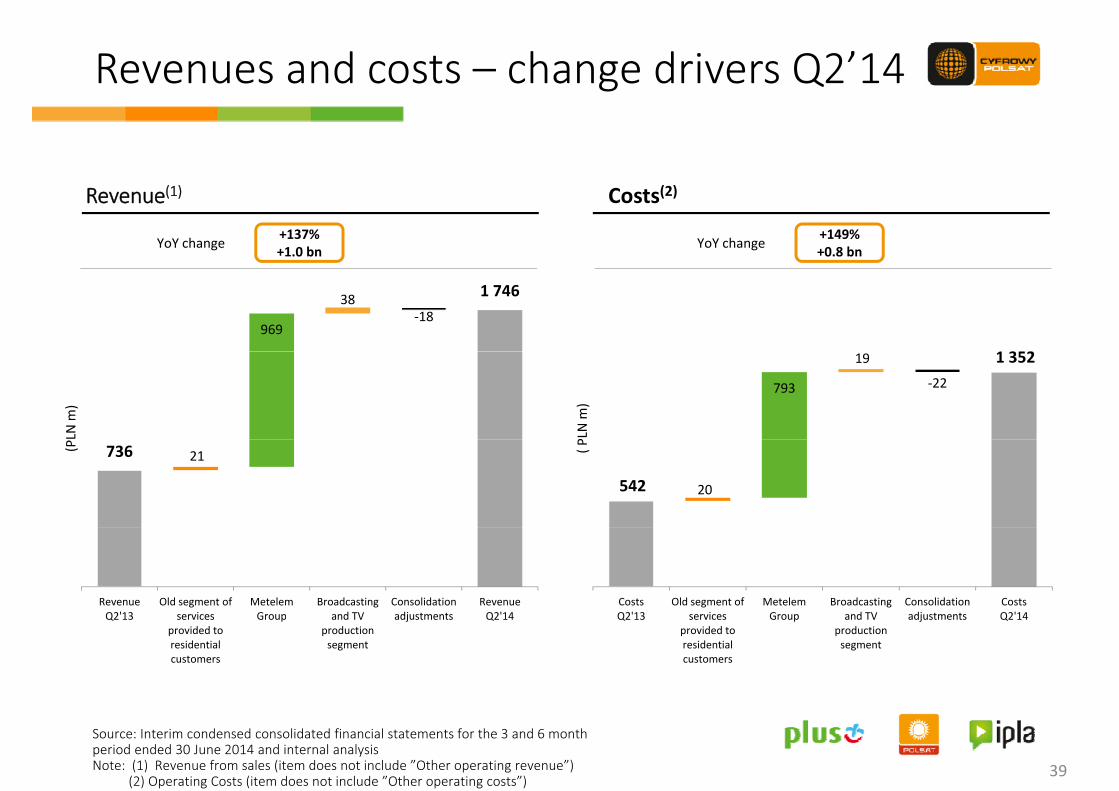
Revenues and costs – change drivers Q2’14 g
YoY change +149%+0.8 bn
Costs(2)
YoY change +137%+1.0 bn
Revenue(1)
1 746
969
38‐18
3 2
LN m
)
1 352
793
19
‐22
PLN m
)
736 21(P
542 20
( PRevenue Q2'13
Old segment of services
Metelem Group
Broadcasting and TV
Consolidation adjustments
Revenue Q2'14
Costs Q2'13
Old segment of services
Metelem Group
Broadcasting and TV
Consolidation adjustments
Costs Q2'14Q2 13 services
provided to residential customers
Group and TV production segment
adjustments Q2 14 Q2 13 services provided to residential customers
Group and TV production segment
adjustments Q2 14
39
Source: Interim condensed consolidated financial statements for the 3 and 6 month period ended 30 June 2014 and internal analysisNote: (1) Revenue from sales (item does not include ”Other operating revenue”)
(2) Operating Costs (item does not include ”Other operating costs”)
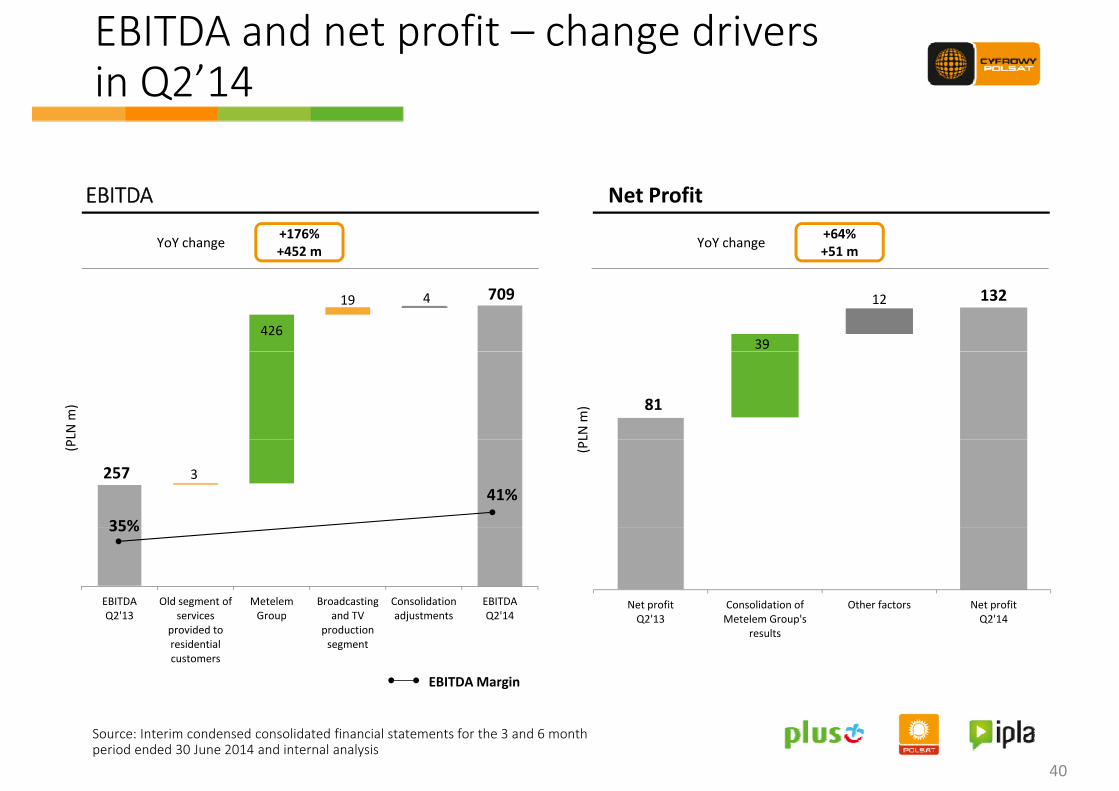
EBITDA and net profit – change driversin Q2’14in Q2 14
YoY change +64%+51 m
Net Profit
YoY change +176%+452 m
EBITDA
709
426
19 4 132
39
12
LN m
) 81
LN m
)
257 3
(P (PL
35%
41%
EBITDA Q2'13
Old segment of services
Metelem Group
Broadcasting and TV
Consolidation adjustments
EBITDA Q2'14
Net profit '
Consolidation of l '
Other factors Net profit '
35%
Q2 13 services provided to residential customers
Group and TV production segment
adjustments Q2 14 Q2'13 Metelem Group's results
Q2'14
EBITDAMargin
40
Source: Interim condensed consolidated financial statements for the 3 and 6 month period ended 30 June 2014 and internal analysis
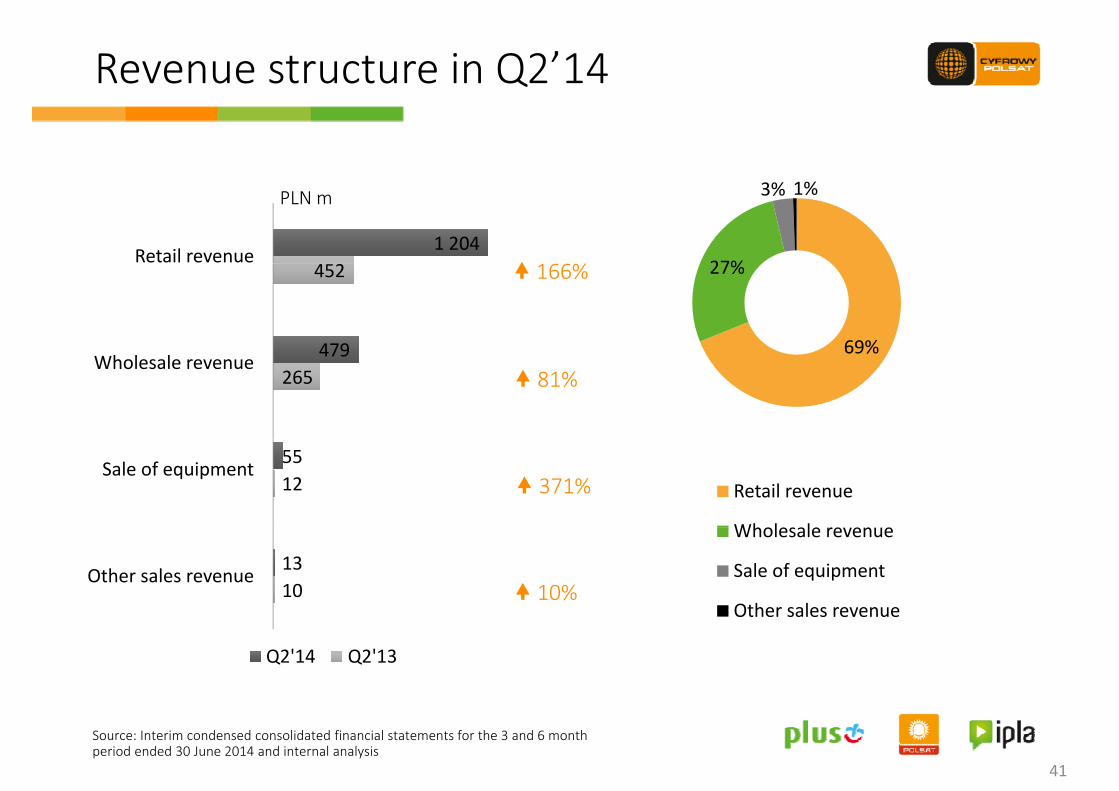
Revenue structure in Q2’14
1 204Retail revenue 27%
3% 1%
%
PLN m
479
452
69%
27% 166%
479265
Wholesale revenue69%
81%
5512
Sale of equipmentRetail revenue
Wh l l
371%
1310
Other sales revenue
Wholesale revenue
Sale of equipment
Other sales revenue 10%
Q2'14 Q2'13
Other sales revenue
Source: Interim condensed consolidated financial statements for the 3 and 6 month period ended 30 June 2014 and internal analysis
41
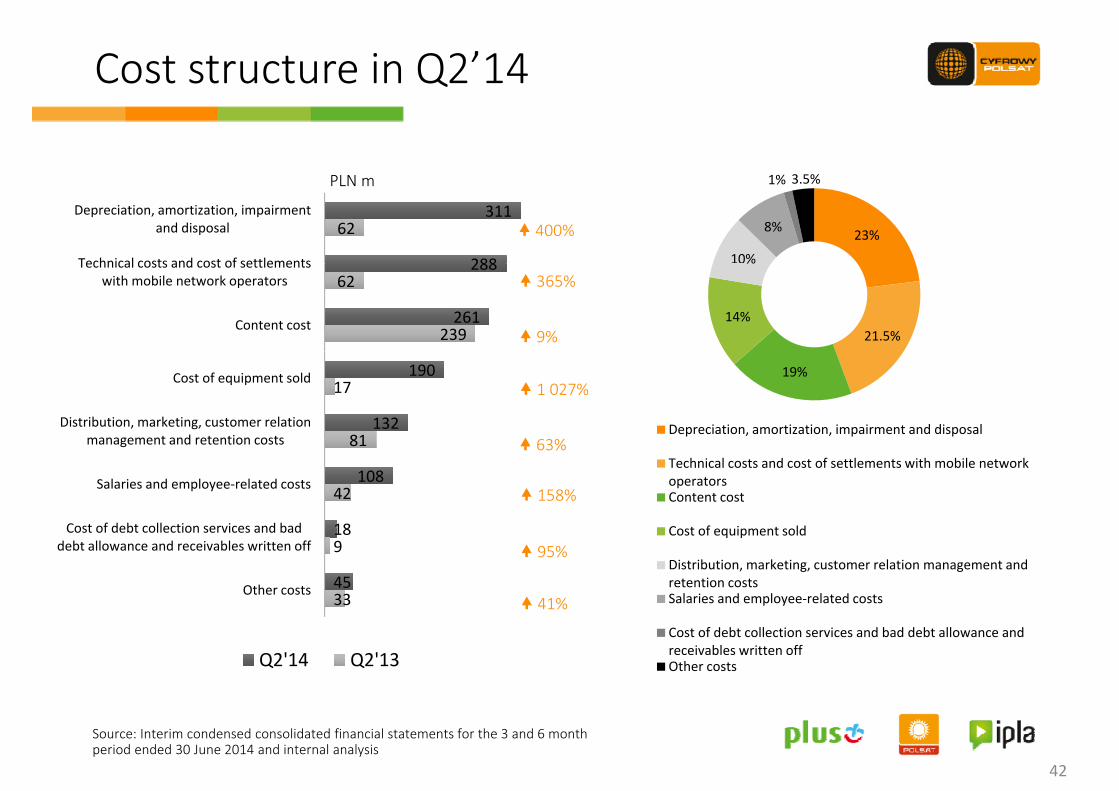
Cost structure in Q2’14
PLN 1% 3 5%
311
288
62Depreciation, amortization, impairment
and disposal
Technical costs and cost of settlements
400%
PLN m
23%
10%
8%
1% 3.5%
288
261
62
239
Technical costs and cost of settlements with mobile network operators
Content cost
365%
9% 21.5%14%
%
190
132
17
81
Cost of equipment sold
Distribution, marketing, customer relation management and retention costs
1 027%
63%
19%
Depreciation, amortization, impairment and disposal
108
18
81
42
management and retention costs
Salaries and employee‐related costs
Cost of debt collection services and bad
63%
158%
Technical costs and cost of settlements with mobile network operatorsContent cost
C t f i t ld18
45
9
33
Cost of debt collection services and bad debt allowance and receivables written off
Other costs
95%
41%
Cost of equipment sold
Distribution, marketing, customer relation management and retention costsSalaries and employee‐related costs
Q2'14 Q2'13Cost of debt collection services and bad debt allowance and receivables written offOther costs
Source: Interim condensed consolidated financial statements for the 3 and 6 month period ended 30 June 2014 and internal analysis
42
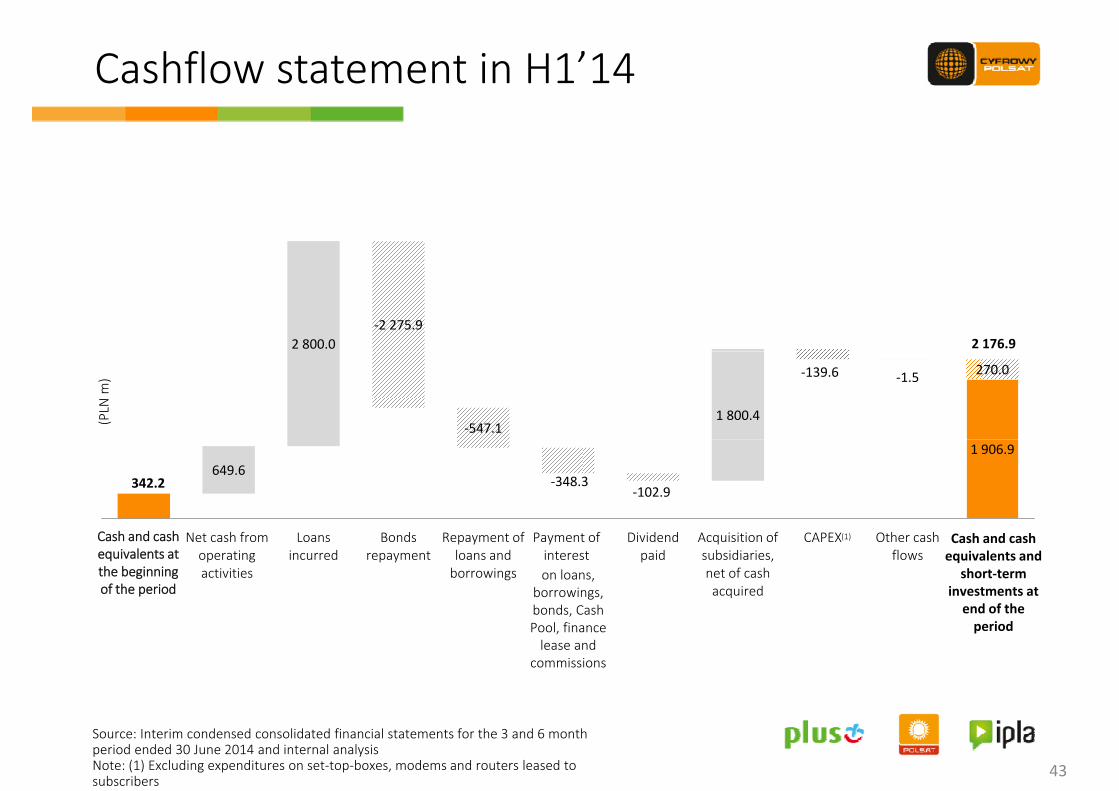
Cashflow statement in H1’14
2 800.0‐2 275.9
2 176.9
‐547.11 800.4
‐139.6 ‐1.5 270.0
(PLN
m)
1 906.9
342.2649.6
‐348.3‐102.9
Net cash from operating activities
Loans incurred
Bonds repayment
Repayment of loans and borrowings
Payment of interest
Dividend paid
Acquisition of subsidiaries, net of cash acquired
CAPEX Other cash flows
Cash and cash equivalents atthe beginningof the period
(1)
on loans, borrowings, bonds, Cash
Cash and cash equivalents and
short‐term investments at end of the,
Pool, finance lease and
commissions
period
Source: Interim condensed consolidated financial statements for the 3 and 6 month period ended 30 June 2014 and internal analysisNote: (1) Excluding expenditures on set‐top‐boxes, modems and routers leased to subscribers
43
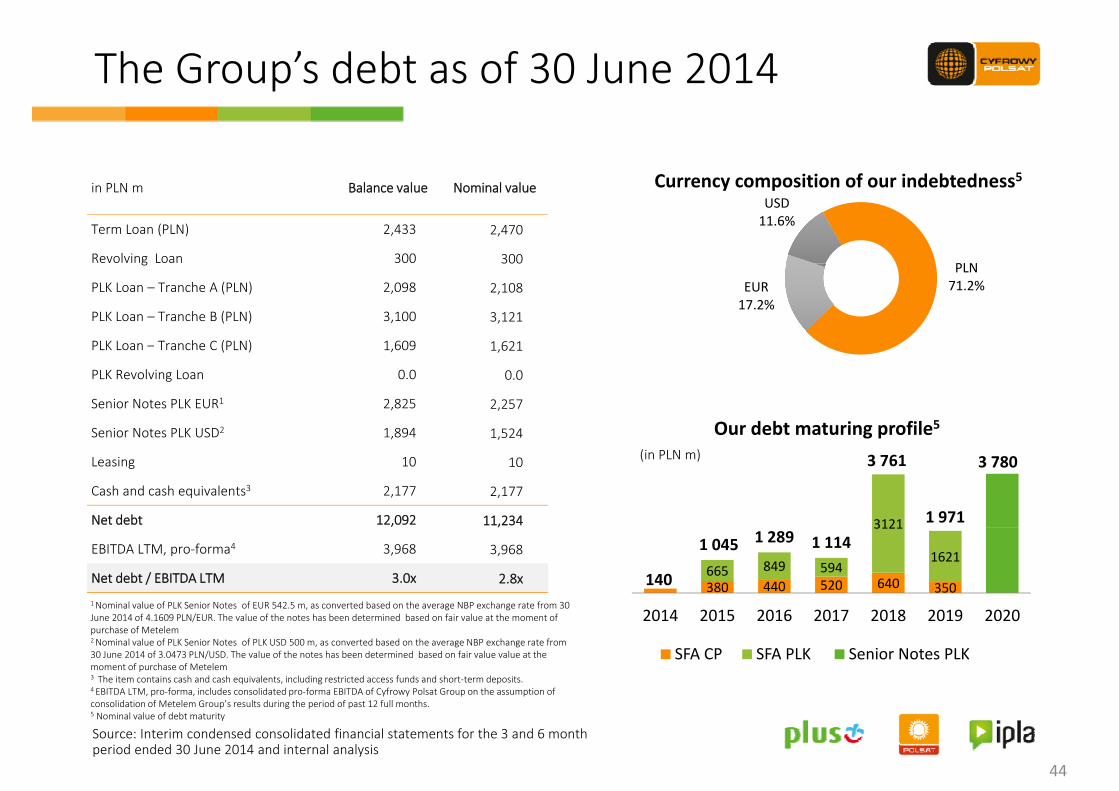
The Group’s debt as of 30 June 2014 p
C iti f i d bt d 5
PLN
USD11.6%
Currency composition of our indebtedness5in PLN m Balance value Nominal value
Term Loan (PLN) 2,433 2,470
Revolving Loan 300 300 PLN71.2%EUR
17.2%
g
PLK Loan – Tranche A (PLN) 2,098 2,108
PLK Loan – Tranche B (PLN) 3,100 3,121
PLK Loan – Tranche C (PLN) 1,609 1,621
Our debt maturing profile5
( ) , ,
PLK Revolving Loan 0.0 0.0
Senior Notes PLK EUR1 2,825 2,257
Senior Notes PLK USD2 1,894 1,524
3121
3 761
1 971
3 780(in PLN m), ,
Leasing 10 10
Cash and cash equivalents3 2,177 2,177
Net debt 12,092 11,234
140 380 440 520 640 350665 849 594
3121
16211 045 1 289 1 114
2014 2015 2016 2017 2018 2019 20201 Nominal value of PLK Senior Notes of EUR 542.5 m, as converted based on the average NBP exchange rate from 30 J 2014 f 4 1609 PLN/EUR Th l f th t h b d t i d b d f i l t th t f
EBITDA LTM, pro‐forma4 3,968 3,968
Net debt / EBITDA LTM 3.0x 2.8x
2014 2015 2016 2017 2018 2019 2020
SFA CP SFA PLK Senior Notes PLK
June 2014 of 4.1609 PLN/EUR. The value of the notes has been determined based on fair value at the moment of purchase of Metelem2 Nominal value of PLK Senior Notes of PLK USD 500 m, as converted based on the average NBP exchange rate from 30 June 2014 of 3.0473 PLN/USD. The value of the notes has been determined based on fair value value at the moment of purchase of Metelem3 The item contains cash and cash equivalents, including restricted access funds and short‐term deposits.4 EBITDA LTM, pro‐forma, includes consolidated pro‐forma EBITDA of Cyfrowy Polsat Group on the assumption of consolidation of Metelem Group’s results during the period of past 12 full months
Source: Interim condensed consolidated financial statements for the 3 and 6 month period ended 30 June 2014 and internal analysis
consolidation of Metelem Group s results during the period of past 12 full months. 5 Nominal value of debt maturity
44
6. Executive summary
Summary of Q2’14y
• Successfully completed acquisition of Metelem HoldingsSuccessfully completed acquisition of Metelem Holdings Company Limited, which opens a new chapter in the history of Polsat Group
• Excellent sales results• Very good viewership results and dynamic growth of revenue• Very good viewership results and dynamic growth of revenue from advertising in our group
• Solid financial performance• Solid financial performance• Continuation of operational integration targeted at generating the planned revenue and cost synergiesthe planned revenue and cost synergies
• Realization of vast majority of financial synergies – we are i i t ti t th l l f 700 l tiincreasing our expectations to the level of 700m cumulative through the end of 2019
46
7 A di7. Appendix
Glossaryy
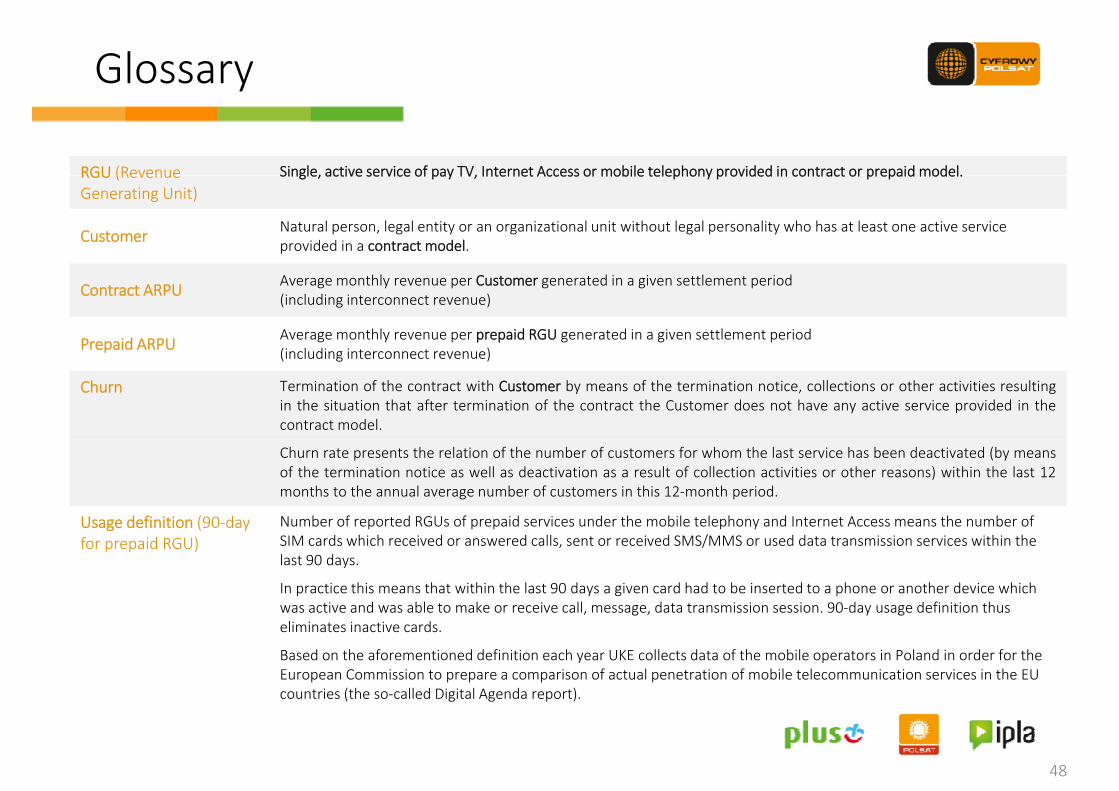
RGU (Revenue Single, active service of pay TV, Internet Access or mobile telephony provided in contract or prepaid model.RGU (Revenue Generating Unit)
Single, active service of pay TV, Internet Access or mobile telephony provided in contract or prepaid model.
Customer Natural person, legal entity or an organizational unit without legal personality who has at least one active serviceprovided in a contract model.
Contract ARPU Average monthly revenue per Customer generated in a given settlement period(including interconnect revenue)
Prepaid ARPU Average monthly revenue per prepaid RGU generated in a given settlement period(including interconnect revenue)p (including interconnect revenue)
Churn Termination of the contract with Customer by means of the termination notice, collections or other activities resultingin the situation that after termination of the contract the Customer does not have any active service provided in thecontract model.
Churn rate presents the relation of the number of customers for whom the last service has been deactivated (by meansof the termination notice as well as deactivation as a result of collection activities or other reasons) within the last 12months to the annual average number of customers in this 12‐month period.
Usage definition (90‐day Number of reported RGUs of prepaid services under the mobile telephony and Internet Access means the number of Usage definition (90 day for prepaid RGU)
p p p p ySIM cards which received or answered calls, sent or received SMS/MMS or used data transmission services within the last 90 days.
In practice this means that within the last 90 days a given card had to be inserted to a phone or another device which was active and was able to make or receive call, message, data transmission session. 90‐day usage definition thus g y geliminates inactive cards.
Based on the aforementioned definition each year UKE collects data of the mobile operators in Poland in order for the European Commission to prepare a comparison of actual penetration of mobile telecommunication services in the EU countries (the so‐called Digital Agenda report).
48
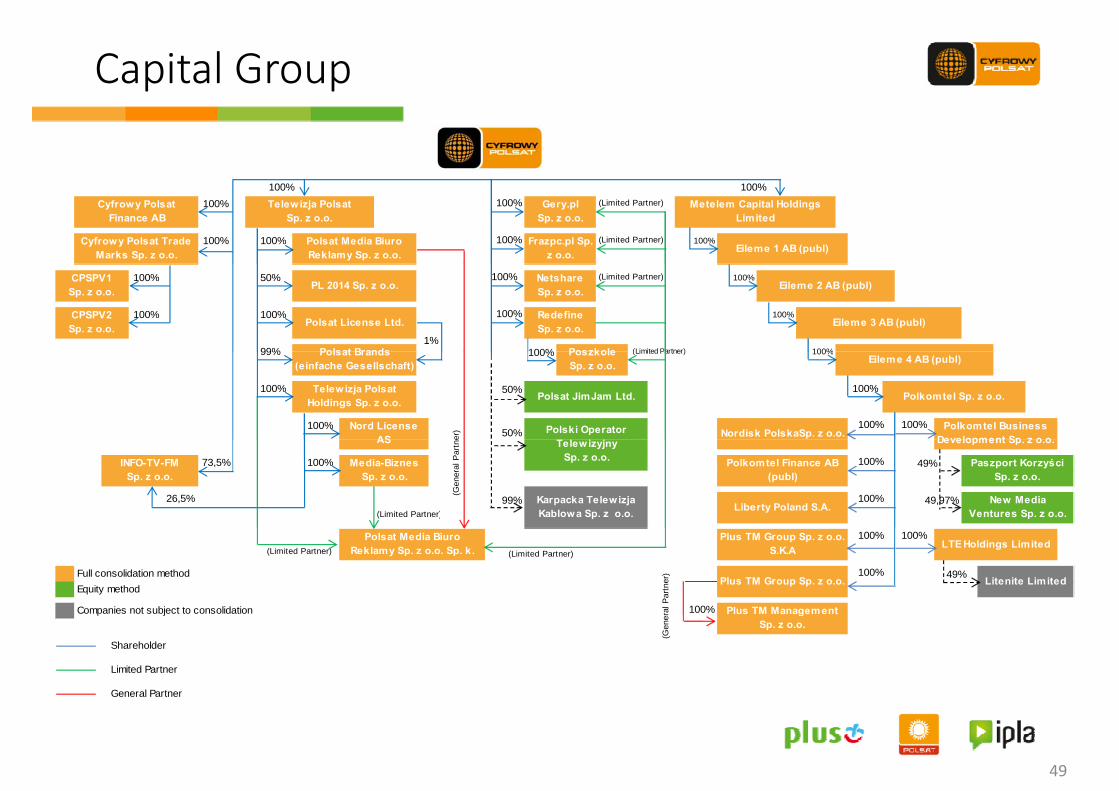
Capital Group p p
100%
100% 100% 100%
(Limited Partner) Metelem Capital Holdings Limited
Cyfrowy Polsat Trade Marks Sp. z o.o.
Polsat Media Biuro Reklamy Sp. z o.o.
100% Frazpc.pl Sp. z o.o.
(Limited Partner)Eileme 1 AB (publ)
100%100%
Cyfrowy Polsat Finance AB
Telewizja Polsat Sp. z o.o.
100% Gery.pl Sp. z o.o.
100% 50% 100%
100% 100% 100%
99% 100%
Eileme 3 AB (publ)
1%Polsat Brands
CPSPV2 Sp. z o.o. Polsat License Ltd.
100% Redefine Sp. z o.o.
100% Poszkole (Limited Partner)
Eileme 2 AB (publ)CPSPV1 Sp. z o.o. PL 2014 Sp. z o.o.
100% Netshare Sp. z o.o.
(Limited Partner)
99% 100%
100% 100%
100% 100% Polkomtel Business Development Sp z o o
Nord License AS er
) 50% Polski Operator Nordisk PolskaSp. z o.o. 100%
Telewizja Polsat Holdings Sp. z o.o.
50% Polsat JimJam Ltd. Polkomtel Sp. z o.o.
Polsat Brands (einfache Gesellschaft)
100% Poszkole Sp. z o.o.
(Limited Partner)Eileme 4 AB (publ)
73,5% 100%
26,5% 99% Liberty Poland S.A.
Paszport Korzyści Sp. z o.o.
49%
New Media Ventures Sp. z o.o.(Limited Partner)
Development Sp. z o.o. AS
49,97%
INFO-TV-FM Sp. z o.o.
Media-Biznes Sp. z o.o.
Polkomtel Finance AB (publ)
100%(G
ener
al P
artn
e Telewizyjny Sp. z o.o.
Karpacka Telewizja Kablowa Sp. z o.o.
100%
Full consolidation methodEquity method
Companies not subject to consolidation
Plus TM Group Sp. z o.o. 100%
100% Plus TM Management ral P
artn
er)
100% 100%LTE Holdings Limited
49% Litenite Limited
(Limited Partner) (Limited Partner)
Polsat Media Biuro Reklamy Sp. z o.o. Sp. k.
Plus TM Group Sp. z o.o. S.K.A
p j
Limited Partner
General Partner
gSp. z o.o.
Shareholder
(Gen
er
49
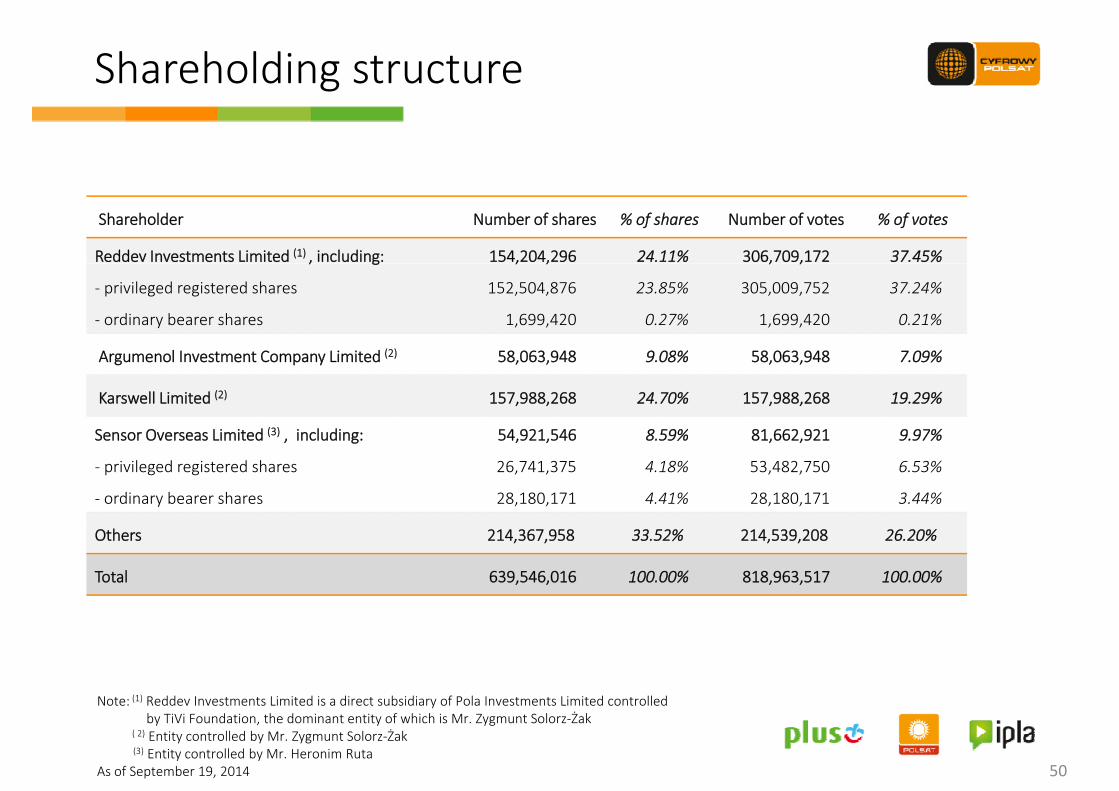
Shareholding structureg
Shareholder Number of shares % of shares Number of votes % of votes
Reddev Investments Limited (1) , including: 154,204,296 24.11% 306,709,172 37.45%, g
‐ privileged registered shares
‐ ordinary bearer shares
, ,
152,504,876
1,699,420
23.85%
0.27%
, ,
305,009,752
1,699,420
37.24%
0.21%
A l I C Li i d (2) 58 063 948 9 08% 58 063 948 7 09%Argumenol Investment Company Limited (2) 58,063,948 9.08% 58,063,948 7.09%
Karswell Limited (2) 157,988,268 24.70% 157,988,268 19.29%
Sensor Overseas Limited (3) , including: 54,921,546 8.59% 81,662,921 9.97%Sensor Overseas Limited , including:
‐ privileged registered shares
‐ ordinary bearer shares
54,921,546
26,741,375
28,180,171
8.59%
4.18%
4.41%
81,662,921
53,482,750
28,180,171
9.97%
6.53%
3.44%
Others 214,367,958 33.52% 214,539,208 26.20%
Total 639,546,016 100.00% 818,963,517 100.00%
Note: (1) Reddev Investments Limited is a direct subsidiary of Pola Investments Limited controlled
50
Note: Reddev Investments Limited is a direct subsidiary of Pola Investments Limited controlled by TiVi Foundation, the dominant entity of which is Mr. Zygmunt Solorz‐Żak
( 2) Entity controlled by Mr. Zygmunt Solorz‐Żak(3) Entity controlled by Mr. Heronim Ruta
As of September 19, 2014
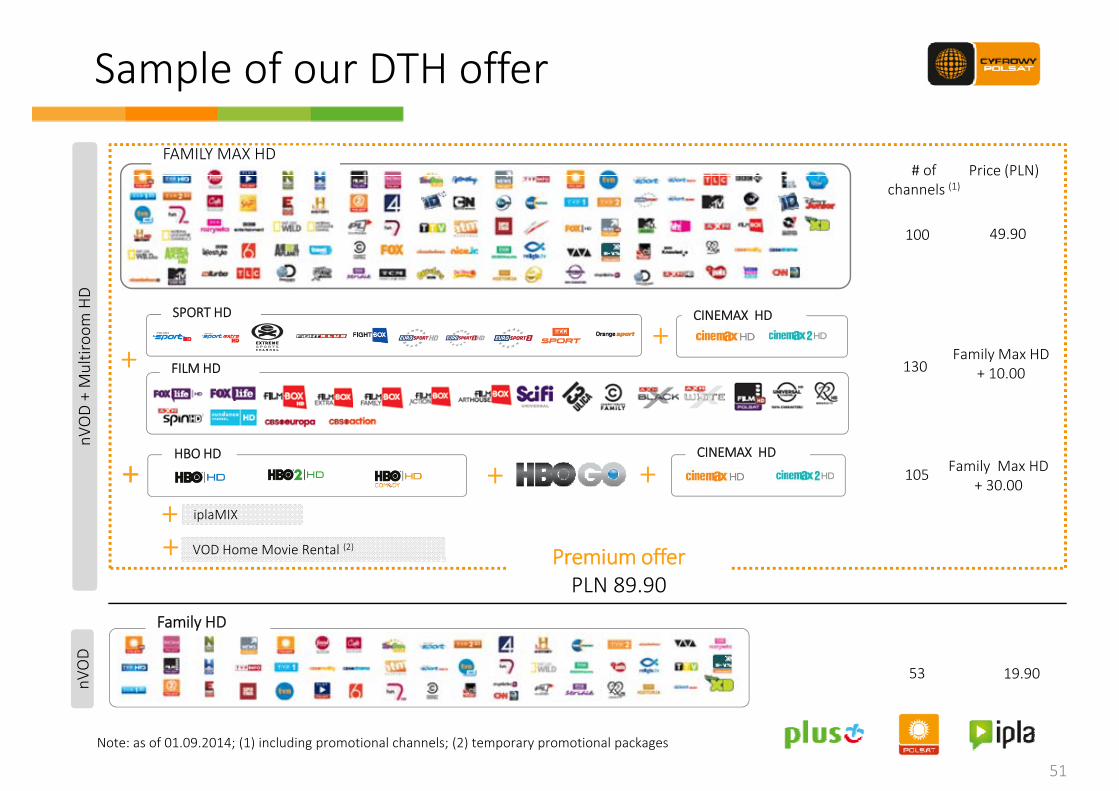
Sample of our DTH offerp
FAMILY MAX HDPrice (PLN)# of
49.90100
( )channels (1)
room
HD
F il M HD
CINEMAX HDSPORT HD
+
nVOD+ Multi + Family Max HD
+ 10.00130FILM HD
n
+ Family Max HD+ 30.00
105HBO HD
++ +
CINEMAX HD
iplaMIX
Premium offerPLN 89.90
+ VOD Home Movie Rental (2)
19.9053
nVOD
Family HD
51
Note: as of 01.09.2014; (1) including promotional channels; (2) temporary promotional packages
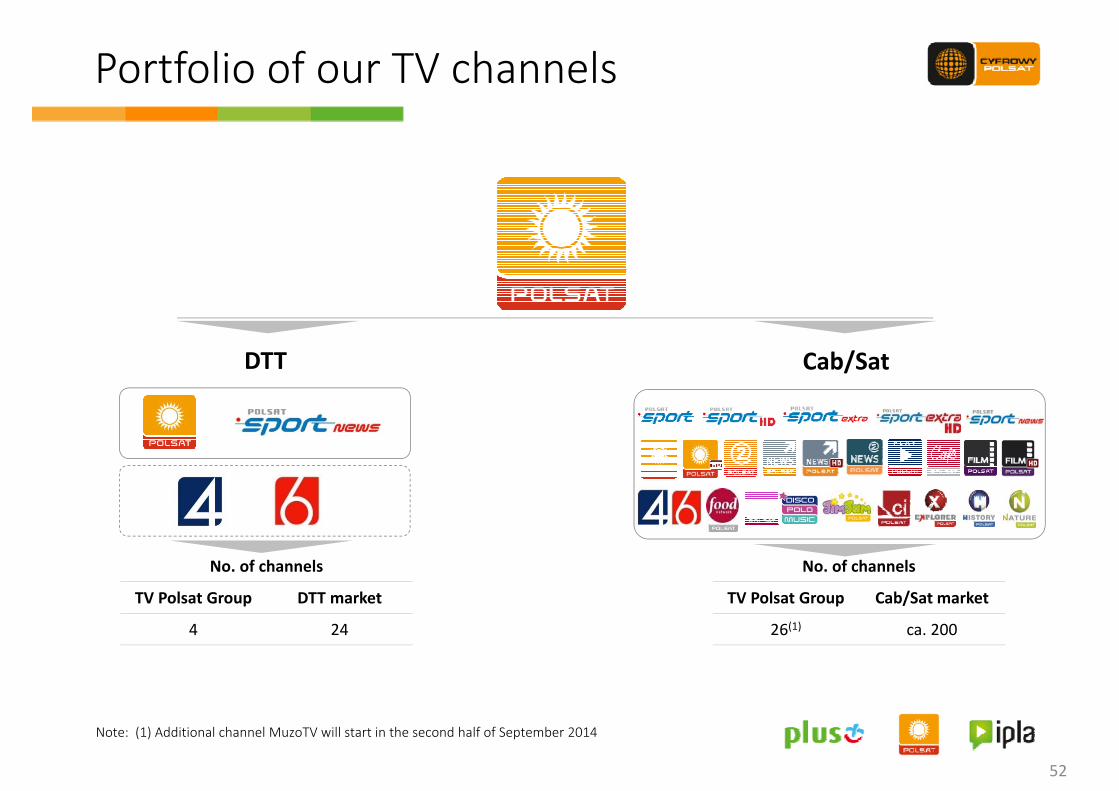
Portfolio of our TV channels
/DTT Cab/Sat
No. of channels
TV Polsat Group DTT market
No. of channels
TV Polsat Group Cab/Sat market
4 24 26(1) ca. 200
52
Note: (1) Additional channel MuzoTV will start in the second half of September 2014
ContactBartłomiej DrywaBartłomiej DrywaHead of Investor Relations Phone: +48 (22) 356 6004Fax: +48 (22) 356 6003Email: [email protected]
www.cyfrowypolsat.pl/inwestorzy

Notes
54