Embed Size (px)
Citation preview

University of Central Florida University of Central Florida
STARS STARS
Electronic Theses and Dissertations, 2004-2019
2008
Prevention Of Environmentally Induced Degradation In Carbon/Prevention Of Environmentally Induced Degradation In Carbon/
epoxy Composite Material Via Implementation Of A Polymer epoxy Composite Material Via Implementation Of A Polymer
Based Coati Based Coati
Bradford Tipton University of Central Florida
Part of the Materials Science and Engineering Commons
Find similar works at: https://stars.library.ucf.edu/etd
University of Central Florida Libraries http://library.ucf.edu
This Masters Thesis (Open Access) is brought to you for free and open access by STARS. It has been accepted for
inclusion in Electronic Theses and Dissertations, 2004-2019 by an authorized administrator of STARS. For more
information, please contact [email protected].
STARS Citation STARS Citation Tipton, Bradford, "Prevention Of Environmentally Induced Degradation In Carbon/epoxy Composite Material Via Implementation Of A Polymer Based Coati" (2008). Electronic Theses and Dissertations, 2004-2019. 3674. https://stars.library.ucf.edu/etd/3674

PREVENTION OF ENVIRONMENTALLY INDUCED DEGRADATION OF CARBON/EPOXY COMPOSITE MATERIAL VIA
IMPLEMENTATION OF A POLYMER BASED COATING SYSTEM
by
BRADFORD TIPTON B.S. Rensselaer Polytechnic Institute, 2000
A thesis submitted in partial fulfillment of the requirements for the degree of Master of Science
in the Department of Mechanical, Materials, and Aerospace Engineering in the College of Engineering and Computer Science
at the University of Central Florida Orlando, Florida
Fall Term 2008

ii
© 2008 Bradford Tipton

ABSTRACT
As the use of fiber reinforced plastics increases in such industries as
aerospace, wind energy, and sporting goods, factors effecting long-term
durability, such as environmental exposure, are of increasing interest. The
primary objectives of this study were to examine the effects of extensive
environmental exposure (i.e., UV radiation and moisture) on carbon/epoxy
composite laminate structures, and to determine the relative effectiveness of
polymer-based coatings at mitigating degradation incurred due to such exposure.
Carbon/epoxy composite specimens, both coated and uncoated, were subjected
to accelerated weathering in which prolonged outdoor exposure was simulated
by controlling the radiation wavelength (in the UV region), temperature, and
humidity. Mechanical test data obtained for the uncoated specimens indicated a
reduction in strength of approximately 6% after 750 hours of environmental
exposure. This reduction resulted from the erosion of the epoxy matrix in
additional to the formation of matrix microcracks. Test data revealed that no
further degradation occurred with increased exposure duration. The protective
coatings evaluated were all epoxy based and included two different surfacing
films and a chromate containing paint primer. The surfacing films were applied
during initial cure of the carbon/epoxy composite laminate, and the chromate
containing epoxy based paint primer was applied subsequent to curing the
carbon/epoxy composite laminate. Although the chromate primer performed well
iii

iv
initially, degradation of the underlying substrate was detected with extended
exposure durations. In contrast, the surfacing films provided superior protection
against environmentally induced degradation. Similar degradation attributes were
identified in the surfacing film as observed in the uncoated composite, but the
degradation was either confined within the surfacing film layer or only penetrated
the very near surface of the carbon/epoxy substrate. This limited degradation
results in a minimal reduction in mechanical strength.

I would like to dedicate this thesis to my family and to my wife Charlene. Without
all of your love and support my education would not have been possible.
v

ACKNOWLEDGEMENTS
I would like to offer special thanks to my advisor Dr. Yong-ho Sohn for his
patience and guidance throughout my journey through graduate school.
I would also like to express my deep gratitude to my colleagues,
particularly David Podracky, Amador Motos-Lopez, Ed Jones, Nancy Kozlowski,
Tom Chenock, Mike Gordon and Ed Nixon for all of their contributions to this
research.
Additionally, I would like to thank Yali Tang from InterCat for his most
beneficial assistance in performing the SEM analysis.
vi

TABLE OF CONTENTS
LIST OF FIGURES ............................................................................................. viii!LIST OF TABLES .................................................................................................. x!LIST OF ACRONYMS/ABBREVIATIONS .............................................................xi!1.0! INTRODUCTION ......................................................................................... 1!2.0! LITERATURE REVIEW ................................................................................ 4!
2.1! Chemistry of Epoxy Polymers ................................................................ 4!2.2! Environmental Degradation of Carbon/Epoxy Composites .................. 13!
2.2.1! Degradation Due to Moisture Exposure ........................................ 14!2.2.2! Degradation Due to Ultraviolet (UV) Radiation Exposure .............. 16!2.2.3! Synergistic Effects of Moisture and UV Radiation ......................... 18!
2.3! Mechanisms of Degradation Induced by Exposure to Ultraviolet Radiation ......................................................................................................... 20!
2.3.1! Chemical Reaction Mechanisms ................................................... 20!2.3.2! Degradation of the Epoxy Matrix as a Function of Depth .............. 28!
3.0! EXPERIMENTAL DETAILS ........................................................................ 30!3.1! Testing Methodology ............................................................................ 30!3.2! Test Panel Fabrication .......................................................................... 31!3.3! Pre-Exposure Testing ........................................................................... 35!3.4! Accelerated Weathering Exposure Testing ........................................... 37!3.5! Post Exposure Testing .......................................................................... 39!
3.5.1! Visual Micro-inspection ................................................................. 39!3.5.2! Mechanical Testing ........................................................................ 39!
4.0! RESULTS ................................................................................................... 42!4.1! Weight as a Function of Environmental Exposure Duration ................. 42!4.2! Visual Inspection of Specimens Subjected to Accelerated Environmental Exposure ......................................................................................................... 43!4.3! Mechanical Test Results ....................................................................... 54!
5.0! DISCUSSION ............................................................................................. 61!5.1! Environmentally Induced Degradation in Carbon/Epoxy Composite Material ........................................................................................................... 61!5.2! Prevention of Degradation via Implementation of Polymer Based Coatings .......................................................................................................... 63!
6.0! SUMMARY AND RECOMMENDATIONS ................................................... 67!7.0! APPENDIX A: RAW TEST DATA ............................................................... 69!8.0! APPENDIX B: SUPPORTING DOCUMENATION ...................................... 80!9.0! REFERENCES ......................................................................................... 111!
vii

LIST OF FIGURES
Figure 1 Representation of the Epoxy (a) and the Glycidyl (b) Groups [3] ............. 6 Figure 2 Common Epoxy Synthesis Reaction [3] ........................................................ 7 Figure 3 (a) Tri-functional Epoxy; (b) Tetra-functional Epoxy [3] ............................... 9 Figure 4 Epoxy Curing Reaction with Amine Curing Agent [3] ................................. 12 Figure 5 Epoxy Crosslinking Mechanism [3] ............................................................... 12 Figure 6 Proposed Mechanism for Photo-Oxidation of TGDDM/DDS Epoxy
Polymer Scheme 1 [10] .......................................................................................... 24 Figure 7 Proposed Mechanism for Photo-Oxidation of TGDDM/DDS Epoxy
Polymer Scheme 2 [10] ........................................................................................... 25 Figure 8 Proposed Mechanism for Photo-oxidation of TGDDM/DDS Epoxy
Polymer Scheme 3 [10] ........................................................................................... 26 Figure 9 Proposed Mechanism for Photo-oxidation of TGDDM/DDS Epoxy
Polymer Scheme 4 [10] .......................................................................................... 27 Figure 10 Carbon/Epoxy Composite Test Panel Cure Cycle ................................. 33 Figure 11 Control Test Panels: No Environmental Exposure ................................. 34 Figure 12 Fiber Orientation for ASTM 3518 Test Specimen [11] ............................. 36 Figure 13 In-Plane Shear Test Specimen Dimensions ............................................ 41 Figure 14 Percentage Weight Loss as a Function of Accelerated Environmental
Exposure Duration ................................................................................................. 43 Figure 15 Bare Composite (A) No Exposure (B) 1500 Hrs Exposure ................. 44 Figure 16 Chromate Primer Coated Composite (A) No Exposure (B) 1500 Hrs
Exposure .................................................................................................................. 44 Figure 17 Surfacing Film A (A) No Exposure (B) 1500 Hrs Exposure ................. 45 Figure 18 Surfacing Film B (A) No Exposure (B) 1500 Hrs Exposure ................ 45 Figure 19 Secondary Electron SEM Images (1000x) of Bare Carbon/Epoxy
Composite (A) No Exposure (B) 750 Hrs Exposure (C) 1000 Hrs Exposure (D) 1500 Hrs Exposure .......................................................................................... 48
Figure 20 Secondary Electron SEM Image (25000x) of Bare Carbon/Epoxy Composite after 1500 Hrs of Environmental Exposure .................................... 49
Figure 21 Secondary Electron SEM Images (5000x) of Bare Carbon/Epoxy Composite (A) No Exposure (B) 750 Hrs Exposure (C) 1000 Hrs Exposure (D) 1500 Hrs Exposure .......................................................................................... 50
Figure 22 Secondary Electron SEM Images (50x) of Bare Carbon/Epoxy Composite (A) No Exposure (B) 750 Hrs Exposure ....................................... 50
Figure 23 Secondary Electron SEM Image (1000x) of Chromate Primer Coated Carbon/Epoxy Composite (A) No Exposure (B) 1500 Hrs Exposure ........... 51
Figure 24 Secondary Electron SEM Image (1000x) of Carbon/Epoxy Composite Coated With Surfacing Film A (A) No Exposure (B) 1500 Hrs Exposure ..... 51
Figure 25 Secondary Electron SEM Image (1000x) of Carbon/Epoxy Composite Coated With Surfacing Film B (A) No Exposure (B) 1500 Hrs Exposure .... 52
viii

Figure 26 Secondary Electron SEM Image (50x) of Carbon/Epoxy Composite Coated with Surfacing Film A – 750 Hrs Exposure ........................................... 52
Figure 27 Cross Section Images (50x) of Carbon/Epoxy Specimens coated with (A) Surfacing Film A and (B) Surfacing Film B .................................................. 53
Figure 28 Ultimate Load vs. Exposure Time (A) Bare Composite (B) Chromate Primer Coated Composite (C) Surfacing Film A (D) Surfacing Film B .......... 59
Figure 29 Ultimate Load as a Function of Coating Configuration and Exposure Duration ................................................................................................................... 60
Figure 30 Ultimate Load as a Function of Coating Thickness and Exposure Duration ................................................................................................................... 60
ix

LIST OF TABLES
Table 1 Detailed Test Panel Fabrication Matrix ........................................................ 34!
Table 3 Mechanical Strength Values No Exposure .................................................. 57Table 2 Detailed Accelerated Weathering Test Matrix ............................................. 38!
Table 4 Mechanical Strength Values 750 Hr Exposure ........................................... 57!
Table 5 Mechanical Strength Data 1000 Hr Exposure ............................................ 58!!
Table 6 Mechanical Strength Data 1500 Hr Exposure ............................................ 58!
x

xi
LIST OF ACRONYMS/ABBREVIATIONS
ASTM American Society for Testing and Materials DDS 4, 4’-diaminodiphenyl sulfone DGEBPA Diglycidyl Ether of Bisphenol A EDX/EDAX Energy Dispersive X-ray Analysis FT-IR Spectroscopy Fourier Transform Infrared Spectroscopy PA FT-IR Photo Acoustic Fourier Transform Infrared
Spectroscopy Prepreg Woven or unidirectional carbon fiber pre-
impregnated with matrix resin SEM Scanning Electron Microscope TGDDM Tetraglycidyl-4,4’-diaminodiphenylmethane UV Ultraviolet

1.0 INTRODUCTION
In the most basic sense, a composite material is simply a mixture of two or
more distinct solid constituents that are, in theory, mechanically separable and,
when combined, produce a material with superior properties to the individual
constituents alone. Typically, the composite material consists of a binder or
matrix that surrounds and holds reinforcements in place. The separate
characteristics of the matrix and reinforcements contribute synergistically to the
overall properties of the composite material [2,3,9]. This definition includes a wide
assortment of materials including steel reinforced concrete, particle filled plastics,
ceramic mixtures, and some alloys [3]. This study focuses on a class of
composites known as fiber reinforced plastics. More specifically, materials
composed of an epoxy polymer matrix reinforced with carbon fibers.
The key advantage for using composite materials for structural
applications is the weight reduction realized due to the high strength-to-weight
and stiffness-to-weight ratios [1]. For example, in aerospace applications, weight
savings on the order of 25% are generally considered to be achievable using
current composite materials in place of metals [2].
In composite materials, all of the properties arise, to some extent, from the
interaction between the matrix and reinforcement [3]. However, each constituent
contributes different attributes to the overall composite material performance. The
principal role of the reinforcement is to provide mechanical properties such as
1

strength and stiffness and to carry the load imposed on the composite structure.
In structural applications, 70% to 90% of the load is carried by the reinforcements
[3,9]. The primary purpose of the matrix is to bind the reinforcement (fiber)
together, transfer loads to and between the fibers, and to protect the fibers from
self-abrasion and externally induced scratches. The matrix also protects the
fibers from environmental degradation, which can lead to embrittlement and
premature failure [1].
The use of fiber-reinforced plastics has steadily increased in markets such
as aerospace, wind energy, and sporting goods. In the past 15 years, the market
demand for glass-reinforced plastics has grown by 50% and the market demand
for carbon fiber composite products has increased by 250% [4]. As the use of
these fiber reinforced plastic composite materials increases, factors effecting
long-term stability and durability, such as environmental exposure, may become
a significant concern in the industries where these materials are utilized.
Previous research has determined that exposure to environmental factors such
as Ultraviolet (UV) radiation, moisture, and temperature results in a reduction in
matrix dominated properties, resulting in a decrease in the overall performance of
the composite material [1,7,8].
The primary objectives of this study were to examine the effects of
prolonged environmental exposure (specifically UV radiation and moisture) on
carbon/epoxy composites and to investigate the effectiveness of various polymer
based coatings at preventing composite substrate degradation. In order to
2

simulate extensive outdoor environmental exposure, carbon/epoxy composite
panels, each with a different coating, were subjected to accelerated
environmental weathering. After exposure, the panels underwent visual micro-
inspection and mechanical testing to determine their load carrying capability.
These results were compared with unexposed control specimens to determine
the extent of degradation and the performance of the protective coatings.
3

2.0 LITERATURE REVIEW
2.1 Chemistry of Epoxy Polymers
In composite structures designed for low temperature applications (less
than 200!F) the most widely used polymer matrix materials are epoxies.
Generally considered the workhorse of the composites industry, epoxies provide
outstanding chemical resistance (i.e. fluids and solvents), excellent adhesion
strength to fibers, and superior dimensional stability. Epoxies are also favored
due to their low cure shrinkage, long shelf life, and lack of void forming volatiles
[1].
In order to obtain a better understanding of the specific degradation
mechanisms induced by exposure to UV radiation, a basic knowledge of epoxy
chemistry must first be attained. Epoxy resins belong in a class of polymers
known as thermosets. Thermosetting resins, which are usually liquids at room
temperature, are characterized by the ability to form bonds between the
molecules of individual chains, also known as crosslinks. This is made possible
by certain molecules on the polymer chains that can be activated to form reaction
sites. The formation of these crosslinks restricts the movements of the polymer
chains, resulting in increased stiffness, strength, and temperature resistance.
Once the crosslinks are formed during cure, these materials cannot be melted
and will degrade when exposed to extreme temperatures. The other major class
4

of polymer resins are known as thermoplastics. Contrary to the thermosets, these
resin systems, usually solids at room temperature, do not form crosslink bonds
and, therefore, can be melted and reformed. Thermoplastics provide improved
toughness over thermosets [3].
Epoxies contain a high percentage of aromatic molecules, which are
characterized by the presence of variations of the aromatic functional group. In
the most basic form, the aromatic group is a cyclic hydrocarbon consisting of six
carbon atoms each including one hydrogen atom. When no other polymer groups
are attached, it is referred to as benzene. The aromatic group imparts strength
and stiffness to the polymer chain and also increases temperature resistance. On
the other hand, aliphatic compounds are characterized by their complete lack of
aromatic content and an increased presence of straight chain polymers. Aliphatic
polymers typically exhibit improved flexibility, toughness, and resistance to
weathering [3].
The basic structure of an uncured epoxy resin consists of two parts: a
three-member ring epoxy group (epoxy ring) also known as an oxirane group and
the rest of the polymer chain. The epoxy group is considered an “active site”
because it is the location where crosslinking occurs. The epoxy group also gives
rise to many of the characteristic properties observed with epoxies. In the
complete epoxy resin structure, the epoxy ring will be attached to another organic
group in the polymer chain, either directly or via an intermediate carbon atom,
known as a bridge. In the latter case, the epoxy group is then referred to as a
5

glycidyl (reference Figure 1) [3].
Figure 1 Representation of the Epoxy (a) and the Glycidyl (b) Groups [3]
6

The most common method of producing uncured epoxy resin is via the
condensation polymerization reaction of bisphenol A with epichlorohydrin. This
reaction bonds the glycidyl groups to both ends of the aromatic bisphenol A
compound (Reference to Figure 2). The epoxy nomenclature is derived from the
various components contained within the polymer resin. For example, the epoxy
polymer created per the reaction in Figure 2 is referred to as DGEBPA, or
“DiGlycidyl Ether of BisPhenol A”. This is in reference to the two glycidyl groups
(di-glycidyl) attached to the bisphenol A polymer via an ether linkage (R-O-R’) [3].
Figure 2 Common Epoxy Synthesis Reaction [3]
The other major component of the epoxy resin is the remaining polymer
chain. In figure 2, this is represented by the bisphenol A portion of the DEGBPA
molecule. The particular molecule chosen for this portion of the resin and the
7

number of repeat units (represented by “n”) can have a significant effect on the
final resin characteristics, and, ultimately, the final properties of the cured
polymer. For instance, increasing the number of bisphenol A units included in the
resin molecule depicted in figure 2, will result in an increased resin viscosity and
heat distortion temperature. Besides changing the number of polymer units,
different types of polymers can be utilized to increase the functionality of the
epoxy resin. Figure 3 illustrates examples of tri-functional and tetra-functional
epoxy resins created by utilizing different aromatic polymer linkages. These
resins have an increased number of active sites available for crosslinking
reactions. Upon cure, the ability for increased crosslinking will lead to a material
with higher strength, stiffness, and temperature resistance [3].
8

(a)
Figure 3 (a) Tri-functional Epoxy; (b) Tetra-functional Epoxy [3]
9

The methods used for synthesis of epoxy resins are quite different from
those utilized to crosslink and cure them. The crosslink reaction in epoxy resins is
based upon the opening of the epoxy ring by a reactive group on the end of
another molecule known as the curing agent or hardener. A typical curing agent
consists of a polymer molecule with an amine based reactive group (NH2) at
each end. The presence of the amine reactive groups on either end allows the
curing agent to react with two epoxy groups on two different molecules, thus
linking them together [3].
The ring-opening reaction is initiated when the reactive portion of the
curing agent comes into close proximity with the epoxy ring. The nitrogen atom
has a slightly negative charge and seeks the slightly positive charge of the
carbon atom in the epoxy ring. The end carbon of the epoxy ring, which is the
terminal carbon of the chain, is usually the more accessible of the two epoxy-ring
carbons. It is therefore the atom that usually reacts with the nitrogen. The
nitrogen forms a bond with the carbon, breaks open the epoxy ring, and loses a
hydrogen atom in the process. This hydrogen atom, which is slightly positive, will
then bond to the oxygen that was initially part of the epoxy ring.
10

This hydroxyl group (OH-) is capable of reacting with other epoxy rings in
the crosslinking reaction, which can establish a chain reaction referred to as
homopolymerization. In this instance the curing agent can be viewed as an
initiator. However, the curing agent and homopolymerization reactions will
generally occur together to complete crosslinking during cure. Figures 4 and 5
illustrate the ring-opening reaction mechanism and the epoxy crosslinking
mechanism, respectively [3].
11

Figure 4 Epoxy Curing Reaction with Amine Curing Agent [3]
Figure 5 Epoxy Crosslinking Mechanism [3]
12

2.2 Environmental Degradation of Carbon/Epoxy Composites
As mentioned in the introduction, there are several inherent advantages to
using composite materials for structural applications (i.e, high strength and
stiffness to weight ratios). Despite these benefits, there are concerns regarding
the overall long-term durability of these materials, especially as related to their
capacity for sustained performance under harsh and changing environmental
conditions [5] Composite structures must be designed to withstand the great
diversity of environments encountered in a variety of operations. For instance, in
aerospace applications, environmental effects, including combinations of heat,
cold, moisture, lightening strikes, UV radiation, fluids, and fuels, can reduce
mechanical properties to varying degrees, depending on the composite system
and the particular design application [1].
Although the most important contribution to the material strength is that of
the fiber, the overall performance of the composite structure also depends greatly
on the properties of matrix in addition to the quality of the fiber-matrix bond. The
matrix, in addition to binding the fibers together and protecting them from
environmental effects, serves to transfer applied structural loads to the fibers.
The fiber-matrix interface governs these load transfer characteristics and
contributes to the overall damage tolerance of the structure [1,5].
13

The composite matrix is generally the component most vulnerable to
environmental attack, with UV light and moisture being two of the primary
environmental factors contributing to material degradation. In general, matrix
degradation induced by environmental exposure is manifested as matrix cracking
and erosion that leads to a reduction in matrix dominated properties.
Consequently, matrix-dominated properties are of particular concern with regard
to environmental exposure of carbon/epoxy composites. [1,2,7].
Previous research determined that a carbon/epoxy laminate exposed to
500 hours of UV exposure, would see a reduction in transverse tensile strength
of 9% and a laminate exposed to 500 hours of moisture via condensation would
see a reduction of 20%. When laminates are exposed to both UV radiation and
condensation, either sequentially or in a cyclical manner, the combined effects
can produce even greater degradation [5]. The synergistic effects of UV radiation
and condensation are discussed further in subsequent sections.
2.2.1 Degradation Due to Moisture Exposure
The absorption of moisture by the epoxy matrix as a result of
environmental exposure can have detrimental effects on the overall mechanical
properties of the carbon/epoxy composite structure. The moisture diffuses into
the matrix, which leads to dilatation expansion and also chemical changes such
as plasticization and hydrolysis [1,7]
14

In degradation by moisture ingress, the controlling factor is the diffusion
constant of water vapor. As water is a very polar molecule, the diffusion
mechanism involves hydrogen bonding with polar sites in the polymer molecule.
Epoxy resins are the most polar of the normal resins as they contain hydroxyl
groups, ether groups, and C-N bonds. Thus, water permeability is highest for
epoxy resins. This can result in both reversible and irreversible damage to the
epoxy matrix. Plasticization is usually reversible upon desorption of moisture,
while hydrolysis of chemical bonds results in permanent irreversible damage.
Moisture desorption gradients may induce microcracking as the surface desorbs
and shrinks, putting the surface in tension. If the residual tension stress at the
surface is beyond the strength of the matrix, cracks occur. Additionally, moisture
wicking along the fiber-matrix interface can degrade the fiber-matrix bond,
resulting in loss of microstructural integrity [1,2,5].
All of these factors manifest in a decrease in matrix-dominated properties
such as compressive strength, interlaminar shear strength, fatigue, and impact
tolerance. Although the carbon fibers do not absorb moisture and their physical
properties remain unaffected, the deterioration of the matrix alone is sufficient to
cause a decrease in performance and overall reliability [1,5].
15

2.2.2 Degradation Due to Ultraviolet (UV) Radiation Exposure
In addition to degradation due to moisture absorption, the epoxy matrix in
carbon/epoxy composite structures is also susceptible to attack by incident light.
The most important interaction of light with the polymer matrix is from the UV
component of light. The UV components of solar radiation incident on the earth
surface are in the 290-400 nm band. The energy of these UV photons is
comparable to the dissociation energies of polymer covalent bonds, which are
typically 290-460 kJ/mole. Therefore, the interactions between this UV light and
the electrons are strong, often resulting in excitation of the electrons and a
resultant breaking of the bond. Hence, UV light can degrade polymers [3,5].
The nature of the atoms in polymer matrix has some effect on the
tendency of the electrons to become excited by the UV light and degrade.
Generally, aromatic polymers are more easily degraded by UV light then are
aliphatic polymers. All resins containing aromatic groups can absorb sufficient UV
radiation to cause bond dissociation. Of the typical resins used in composite
structures, phenolics are most sensitive, followed by epoxy resins. The high
aromatic content common to most high-performance epoxies makes them
particularly susceptible to UV radiation induced degradation [2,3].
16

The UV photons absorbed by polymers result in photo-oxidative
reactions that alter the chemical structure resulting in material deterioration. The
chemical reactions typically cause molecular chain scission and/or chain cross-
linking. Chain scission lowers the molecular weight of the polymer, giving rise to
reduced heat and strength resistance. Chain cross-linking leads to excessive
brittleness and can result in microcracking. Previous research discovered that
exposure of a carbon/epoxy laminate to UV radiation for as little as 500 hrs
results in the formation of microcracks, which lead to a reduction in matrix-
dominated properties. This was likely caused by embrittlement of the polymer
matrix due to increased crosslinking resulting from photo-oxidation reactions
induced by UV exposure. More detailed discussion of UV radiation degradation
mechanisms is included in subsequent sections [5].
Some polymers, including epoxies, exhibit a color change when exposed
to UV radiation. In addition to inducing chain scission and increasing crosslink
density, photo-oxidative reactions can also result in the production of
chromophoric chemical species. Chromophores are simply molecules that
transmit and absorb light. These chromophores, may impart discoloration to the
polymer, if they absorb visible wavelengths. Furthermore, an autocatalytic
degradation process may be established if chromophores produced also absorb
UV radiation [5].
17

2.2.3 Synergistic Effects of Moisture and UV Radiation
While the previous sections have focused on the individual degradation
effects due to UV radiation and moisture exposure, these environmental factors
can act in conjunction to further enhance the degradation of the carbon/epoxy
composite structure [5].
Exposure to UV radiation results in the formation of a thin surface layer of
chemically modified epoxy. Subsequent water condensation leaches away
soluble UV degradation products, which exposes a fresh layer that can once
again be attacked by UV radiation. In this manner, a repetitive process is
established that leads to significant erosion of the epoxy matrix. Furthermore, it is
also conceivable that the presence of absorbed water molecules in the epoxy
matrix can enhance the photo-oxidation reactions due to increased availability of
OH- and H+ ions. This would increase the chain scission and crosslinking
reactions occurring on the surface of the epoxy polymer, thus increasing the
brittleness of the matrix. These synergistic mechanisms result in more extensive
microcracking and loss of fiber confinement due to matrix erosion, ultimately
leading to a more significant reduction in the overall mechanical properties of the
composite structure [5,7].
In research conducted by Kumar et al., carbon/epoxy laminates exposed
to cyclic exposure of both UV radiation and moisture condensation totaling 1000
hrs resulted in extensive matrix erosion, void formation, and fiber-matrix interface
18

debonding. The epoxy rich layer on the specimen surface was completely
removed and the underlying carbon fibers were exposed. Furthermore,
examination of the transverse tensile strength indicated a reduction of 29% as
compared with unexposed specimens [5].
19

2.3 Mechanisms of Degradation Induced by Exposure to Ultraviolet Radiation
2.3.1 Chemical Reaction Mechanisms
Research performed by Kim et al.[6] examined the degradation due to
exposure to UV radiation and moisture. The study utilized an aluminum substrate
coated with a bisphenol A based epoxy polymer with a nominal film thickness of
30 "m. These specimens were subjected to accelerated weathering, consisting
of cyclic exposures to UV radiation @ 340 nm and water vapor condensation (4
hours each). The exposed specimens were examined using a combination of
photo acoustic (PA) Fourier transformed infrared (FT-IR) spectroscopy, FT-IR
microscopy, and Raman chemical imaging. Varying the modulation frequencies
utilized with PA FT-IR facilitated the determination of molecular level information
as a function of depth [6].
Examination of unexposed specimens at depths ranging from 5-24 "m,
using the PA FT-IR, detected an increase in the band intensities at 3399 cm-1,
which indicates an increase in -OH (hydroxyl group) content with increasing
depth. Alternatively, the spectra detected a decrease in the bands at 1250 cm-1
and 1509cm-1 with increasing depth. These bands are attributed to oxirane ring
stretching vibrations of bisphenol A epoxy polymer and N-H deformations of
polyamine crosslinker, respectively. Both of these functional groups are reaction
20

sites responsible for crosslinking reactions of epoxy polymers. This indicates that
the ring opening reactions of oxirane groups of bisphenol A epoxy polymer occur
further away from the surface, thus resulting in the increase in –OH group
content. However, the intensity of the band attributed to C=C stretching vibrations
of bisphenol A (1607 cm-1) does not change as a function of depth, indicating that
bisphenol A epoxy polymer is uniformly distributed throughout the film thickness
[6].
PA FT-IR spectroscopy performed on the surface of specimens exposed to
various durations (0, 5, 9, and 13 weeks) detected an increase the 3399 cm-1
band, indicating that UV exposure in the presence of water condensation results
in the formation of hydroxyl groups on the surface. An exposure time of 5 weeks
also detected a decrease in intensity of the 1250 cm-1 and 1509 cm-1 bands. This
indicates that UV exposure further promotes crosslinking reactions on the
surface. No further decrease in these band intensities was detected with
subsequent exposures past 5 weeks. However, the formation of a new band at
1660 cm-1 indicates that carbonyl amide formation is taking place on the surface.
This band increases in intensity with continued exposure. These observations
indicate that crosslinking reactions are responsible for degradation for exposures
up to 5 weeks. After that time, formation of amides dominates the degradation
process. FT-IR microscopy and Raman chemical imaging where utilized to
examine specific aspects of the degraded surface, comparing areas with and with
out observed microcracking. The spectra generated detected an increase in band
21

intensity at 1660 cm-1 and a decrease in band intensity at 1296 cm-1 (C-N
vibrations) band in the area with microcracking. These bands are attributed to
higher amine content, indicating that the formation of amides, via chain scission,
has a greater contribution to epoxy degradation. Spectra from the microcracked
area also detected an increase in the 1250 cm-1 and 1509 cm-1, indicating a
diminished extent of crosslinking was present [6].
Similar exposure studies support these conclusions. Kumar et al. [5]
demonstrated that carbon/epoxy laminates subjected to 500 hrs of UV radiation
exposure displayed similar spectra when analyzed with FT-IR. Specifically,
reductions in the peaks at 1250 cm-1 and 1509 cm-1 suggesting increased
crosslink density on the surface of the epoxy. A reduction in the peak at 1296 cm-
1 was also observed, attributed to C-N stretching vibrations due to amide
formation. This indicated the presence of chain scission reactions [5].
Both of these studies indicated that crosslinking and chain scission
mechanisms operate in a competing manner during the degradation process.
Increased crosslinking dominates in the early stages of degradation, after which
carbonyl amide formation by chain scission takes over. Both of these
mechanisms then result in increased microcracking and surface deterioration,
ultimately reducing the mechanical strength of the composite structure [5].
Musto et al. [10] proposed several degradation mechanisms based on FT-
IR analysis conducted on tetraglycidyl-4,4’-diaminodiphenylmethane (TGDDM)
epoxy resin cured with aromatic hardener 4,4’-diaminodiphenyl sulfone (DDS),
22

subsequent to exposure to UV radiation and humidity. They concluded that
photo-oxidative degradation of TGDDM/DDS could potentially involve several
different mechanisms, which ultimately bring about chain-scission, leading to the
formation of amide and carbonyl groups. Figures 6 through 9 illustrate proposed
degradation Schemes 1 through 4, respectively. Scheme 1 involves scission of
the carbon-nitrogen bond following hydrogen abstraction on the methylene
group, ultimately resulting in the formation of an aldedhyde (carbonyl group).
Scheme 2 begins with hydrogen abstraction of the CH-OH bond followed by a
similar chain scission reaction at the carbon-nitrogen bond, resulting in the
formation of a ketone (carbonyl group). Scheme 3 begins with the oxygen attack
of structure VII depicted in scheme 2. Chain scission at the carbon-carbon bond
produces a carboxylic acid (carbonyl group) and, via the elimination of H2O from
structure XI, an amide linkage. However, the principal route for amide formation
is proposed in scheme 4, with chain scission occurring at the carbon-carbon
bond, rather than the carbon-nitrogen bond, producing amide molecules which
may propagate the photo-oxidative sequence [10].
23

Figure 6
Proposed Mechanism for Photo-Oxidation of TGDDM/DDS Epoxy Polymer Scheme 1 [10]
24

Figure 7 Proposed Mechanism for Photo-Oxidation of TGDDM/DDS Epoxy Polymer
Scheme 2 [10]
25

Figure 8 Proposed Mechanism for Photo-oxidation of TGDDM/DDS Epoxy Polymer
Scheme 3 [10]
26

Figure 9 Proposed Mechanism for Photo-oxidation of TGDDM/DDS Epoxy Polymer
Scheme 4 [10]
27

2.3.2 Degradation of the Epoxy Matrix as a Function of Depth
In addition to studying the degradation aspects of an epoxy polymer film
exposed to both UV radiation and moisture, Kim et al. [6] also examined the
molecular level degradation as a function of depth. As mentioned previously, this
study involved an aluminum substrate coated with a bisphenol A based epoxy
polymer with a nominal film thickness of 30 "m. These specimens were
subjected to accelerated weathering, consisting of cyclic exposures to UV
radiation @ 340 nm and water vapor condensation (4 hours each). The exposed
specimens were analyzed using step-scan photo acoustic (PA) Fourier
transformed infrared (FT-IR) spectroscopy. Varying the modulation frequencies
facilitated the determination of molecular level information as a function of depth
[6].
The first portion of the study determined that increased crosslinking
reactions were initially responsible for degradation. However, with increased
exposure time the predominate degradation mechanism was the formation of
carbonyl amides. The other portion of the study examined specimens exposed
for a 5 weeks, utilizing the PA FT-IR, at depths of 5, 9, 18 and 24 "m. To
determine the depth of degradation from the exposed surface, the specimens
were examined from the substrate side. Examination of the spectra indicated that
28

the bands at 1250 and 1509 cm-1 increased in intensity as the detection depth
approached the exposure surface. These bands are attributed to oxirane ring
stretching vibrations of bisphenol A and N-H deformations, respectively.
Increased intensity of these bands indicates a lower incidence of crosslinking.
Therefore, it can be concluded that a lesser extent of crosslinking reactions occur
near the exposure surface. Furthermore, in comparing the spectra at increasing
depths from the substrate side, the onset of primary amine formation begins at
24 "m, as evidenced by the first appearance of the band at 1660 cm-1. This
indicates (based on the nominal coating thickness of 30 "m) that degradation
occurs up to a depth of approximately 6 "m from the exposure surface. Additional
evaluation indicates that this holds true, even with increased exposure time [6].
29

3.0 EXPERIMENTAL DETAILS
3.1 Testing Methodology
As stated in the introduction, the primary focus of this research was to
study the effects of environmental weathering (specifically UV radiation and
humidity) on carbon/epoxy composite material. Additionally the effectiveness of
various polymer-based coatings in mitigating degradation was also examined.
This was accomplished by subjecting carbon/epoxy composite panels, each with
a different coating configuration, to accelerated weathering exposure. By
controlling the radiation wavelength, temperature, and humidity, extended
environmental exposure can be simulated in a relatively short time frame. For
example, a 750-hour exposure in an accelerated weathering chamber simulates
approximately 6 months of actual exposure in an extreme environment (F. Lopez,
personal communication, April 14, 2008). Each composite coating configuration
was subjected to several different durations of accelerated weathering. Visual
inspection and mechanical testing performed on the exposed specimens were
compared to unexposed control panels to determine the extent of degradation.
30

3.2 Test Panel Fabrication
Previous research indicates that degradation of carbon/epoxy composites
due to UV radiation is localized near the surface [6]. To increase the probability of
detecting degradation this study utilized a thin (4 plies) carbon/epoxy laminate
construction. Test panels were constructed utilizing the following materials:
Carbon/Epoxy Prepreg: Standard modulus Carbon fiber woven into a plain weave fabric impregnated with an uncured epoxy resin (designated as 3K-70-PW). The nominal cured ply thickness is 0.008” and the nominal resin content is 36%. Plies of the pre-impregnated carbon fabric are applied to a flat aluminum tool, successively one on top of another and then cured under elevated temperature and pressure to create a composite part. Surfacing Film “A”: Light weight surfacing film consisting of an epoxy based polymer adhesive supported by a non-woven polyester scrim (carrier). Surfacing film is incorporated during the lay-up and cure of carbon/epoxy prepreg plies. Nominal Coating Thickness is 0.004” Surfacing Film “B”: Heavy weight surfacing film consisting of an epoxy based polymer adhesive supported by a non-woven polyester scrim (carrier). Surfacing film is incorporated during the lay-up and cure of carbon/epoxy prepreg plies. Nominal Coating Thickness is 0.005”. Chromate Containing Epoxy Paint Primer: A coating usually applied to components to improve adhesion of subsequent coatings. It is also commonly used to protect substrates against corrosion and environmental degradation. In this case, the epoxy primer was applied to a bare carbon/epoxy test panel after it had been cured. Nominal Coating Thickness is 0.001”.
31

Each test panel was fabricated using four plies of prepreg fabric placed in
a [45/-45]s stacking sequence. All composite test panels were cured under
elevated temperature and pressure in the same autoclave cycle. The cure cycle
consisted of an intermediate hold at 150ºF ± 10 ºF for 60 ± 10 minutes followed
by a hold at the cure temperature of 350ºF ± 10 ºF for 120 ± 10 minutes. The
nominal ramp rate used to achieve these temperatures was 4 ºF/min. The
maximum autoclave pressure was 100 psi, applied during the ramp up to the
cure temperature. The tests panels were cooled to 140 ºF ± 10 ºF at 4 ºF/min
prior to removal from the autoclave (Reference Figure 10). The surfacing film
coatings were incorporated in the fabrication of the laminate test panels by laying
them on the aluminum tool surface prior to adding the carbon prepreg plies. The
surfacing film is then cured along with the carbon/epoxy prepreg layers. The
chromate primer coating was added to the carbon/epoxy test panels after they
had been cured (Reference Figure 11).
32

Autoclave Cure Cycle - Carbon/Epoxy Test Panels
0
50
100
150
200
250
300
350
400
0 50 100 150 200 250 300 350
Time (minutes)
Tem
pera
ture
(F)
Apply 22" Hg Vacuum Pressure
Apply 100 psi positive pressure &
Vent Vacuum
Release Pressure and Remove
Panels
Autoclave Cure Cycle - Carbon/Epoxy Test Panels
0
50
100
150
200
250
300
350
400
0 50 100 150 200 250 300 350
Time (minutes)
Tem
pera
ture
(F)
Apply 22" Hg Vacuum Pressure
Apply 100 psi positive pressure &
Vent Vacuum
Release Pressure and Remove
Panels
Figure 10 Carbon/Epoxy Composite Test Panel Cure Cycle
Four sets of test panels were constructed with the composite/coating
configurations listed below. In addition to the test panels used for visual and
mechanical evaluation, smaller specimens were fabricated and used to monitor
weight loss over the duration of the UV/moisture exposure. Reference Table 1 for
a more detailed test panel fabrication matrix.
1. Bare Composite (BC): Carbon/epoxy composite panel with no coating
2. Chromate Primer (CP): Carbon/epoxy composite panel coated with a chromate containing epoxy paint primer.
3. Surfacing Film A: Carbon/epoxy composite panel coated with light weight
surfacing film.
4. Surfacing Film B: Carbon/epoxy composite panel coated with heavy weight surfacing film
33

Table 1
Detailed Test Panel Fabrication Matrix
8" x 10" 2" x 3" 8" x 10" 2" x 3"BC-C ! SFA-C !
BC-750 ! SFA-750 !
BC-1000 ! SFA-1000 !
BC-1500 ! SFA-1500 !
BC-1500-WG ! SFA-1500-WG !
CP-C ! SFBC !
CP-750 ! SFB-750 !
CP-1000 ! SFB-1000 !
CP-1500 ! SFB-1500 !
CP-1500-WG ! SFB-1500-WG !
Test Panel I.D. Test Panel Dimensions(1)
(1) Tolerance of ±0.25"
Test Panel Dimensions(1)
Bare Composite Surfacing Film A
Surfacing Film B
Composite Configuration
Chromate Primer
Composite Configuration Test Panel I.D.
Figure 11 Control Test Panels:
No Environmental Exposure
34

3.3 Pre-Exposure Testing
Prior to subjecting the test panels to accelerated weathering, a set of
control specimens, representing the composite/coating configurations described
in the previous section, were mechanically tested to establish a baseline strength
value. This testing was performed immediately after test panel fabrication to
preclude any effects due to incidental environmental exposure. In composite
laminate structures, tensile strength is considered a fiber-dominated property,
while other properties, such as shear and compression, are matrix-dominated
properties. UV radiation preferentially affects the polymer matrix, resulting in
microcracking and matrix erosion. This decreases the load carrying capability of
the matrix, reducing the overall strength of the composite laminate structure. In
order to detect the effects of degradation due to environmental exposure, a
standard mechanical test method (ASTM D 3518 [11]) was chosen to evaluate the
matrix integrity. ASTM D 3518 performs a standard tensile test (ASTM D 3039
[12]) on a composite laminate comprised of layers with the fibers oriented at 45!
(Reference Figure 12). When the test specimen of this configuration is loaded in
tension, the orientation of the fibers creates a maximum shear stress, which is
matrix-dominated property. Therefore, this test should identify any degradation in
the matrix due to environmental exposure. Due to the inherently variable nature
of mechanical properties in composite materials, eight specimens per composite
coating configuration were tested to provide statistically significant data.
35

Figure 12 Fiber Orientation for ASTM 3518 Test Specimen [11]
36

3.4 Accelerated Weathering Exposure Testing
Each of the composite configurations described in the previous section
were subjected to accelerated weathering exposure. Weathering was performed
using an Atlas, Ci4000 Xenon Weatherometer which controls radiation
wavelength (in the UV range), temperature, and humidity to simulate extended
exposures to outdoor environmental conditions. The humidity in the chamber is
created and maintained from a pressurized mixture of air and water, which
creates a fine, moist fog that enters the test chamber through the floor vents. Test
panels were oriented to ensure that only the coated surface was exposed. Each
configuration was exposed for three different time durations: 750, 1000, and
1500 hours. Previous research indicated that the onset of degradation to UV
exposure could occur in as little as 500 hrs [5]. These exposure times were
selected in an attempt to bound any degradation incurred by the composite
material. Throughout the entire 1500-hour exposure, representative panels from
each coating configuration were monitored for weight gain/loss at 72-hour
intervals. Refer to Table 2 for a detailed test matrix.
37

The testing was conducted per standard test method, ASTM G 155 [13],
with the following parameters:
Test Method: ASTM G 155, Cycle 1 Apparatus Type: Xenon Arc Lamp Optical Filters: Daylight Sepctral Irradiance: 0.55 W/m2 x nm (@ 340nm) Temperature: 140 +/- 10! F Relative Humidity: 50 +/- 5% RH
Table 2
Detailed Accelerated Weathering Test Matrix
0 (Control) 750 1000 1500
BC-C !BC-750 !BC-1000 !BC-1500 !
BC-1500-WG !CP-C !
CP-750 !CP-1000 !CP-1500 !
CP-1500-WG !SFA-C !
SFA-750 !SFA-1000 !SFA-1500 !
SFA-1500-WG !SFB-C !
SFB-750 !SFB-1000 !SFB-1500 !
SFB-1500-WG !
Surfacing Film A
Surfacing Film B
Exposure Time (hr)Composite Configuration Test Panel I.D.
Bare Composite
Chromate Primer
38

3.5 Post Exposure Testing
3.5.1 Visual Micro-inspection
Upon completion of the accelerated exposure testing, the panels were
examined visually for signs of degradation (i.e., matrix micro-cracking, polymer
coating discoloration, etc.). The exposed specimens were compared to the
baseline control specimens to determine the extent of degradation as a function
of coating configuration and exposure time. Higher magnification images of the
specimens (both exposed and unexposed) were obtained using a Hitachi S-4800
Scanning Electron Microscope (SEM) equipped with a field emission electron
gun and an EDAX Energy Dispersive X-Ray (EDX) spectrometer. To increase the
surface conductivity each specimen was sputter coated with Iridium using an
Emitech K575X Peltier cooled coating sputter machine. Secondary electron
images were generated using an electron beam with an acceleration voltage of
15keV, with magnification ranging from 50x to 25000x.
3.5.2 Mechanical Testing
Upon completion of the accelerated environmental exposure, each panel
was subjected to mechanical testing per standard test method ASTM D 3518 [11].
As mentioned previously, this test creates a maximum shear stress in the
specimen, which should identify degradation in the composite matrix due to the
accelerated weathering. Subsequent to exposure, 0.25” was machined from the
39

perimeter of each test panel to eliminate any degradation incurred on the edges
of the panels. For each coating configuration and exposure duration, eight
individual specimens were tested. The edges of each specimen were lightly
polished using 400 to 600-grit silicone carbide sand paper to remove any
microstructural damage induced during machining. All mechanical testing was
performed on a universal load machine utilizing a specimen grip length of 2.75”
and a constant head speed of 0.05 in/min (2mm/min). No bonded tabs were
required due to the relatively low failure strength expected. However, emery cloth
was used to aid in gripping of the specimens during loading. During the test, load
vs. cross head speed was monitored. Previous research [5] has shown little effect
on the elastic modulus of carbon/epoxy laminates as a result of environmental
exposure. Therefore, strain measurements were not acquired. The mechanical
test values were compared with the baseline strength values of unexposed
specimens to determine the degradation effects of environmental exposure. Due
to the difficulty of quantifying the contribution of the coating to the overall
composite strength, this study utilized the ultimate load to evaluate the
performance of each composite configuration as a function of exposure duration.
The contribution of the coating to the shear strength made it difficult to Each test
panel was machined into tensile specimens measuring 7.0” in length and 1.0” in
width (Reference Figure 13). Due to the inherently variable nature of mechanical
properties in composite materials, eight specimens were tested to produce a
statistically significant value for strength. The strength values obtained for the
40

exposed test panels were compared to control panels to determine the extent of
degradation.
Figure 13 In-Plane Shear Test Specimen Dimensions
41

4.0 RESULTS
4.1 Weight as a Function of Environmental Exposure Duration
In conjunction with the environmental exposure testing, small specimens
representing each composite coating configuration (Bare, Chromate Primer
Coated, Surfacing Film A, and Surfacing Film B) were monitored at 72 hour
intervals to determine the weight gain or loss due to environmental exposure. As
anticipated, the exposure resulted in a weight loss for each coating configuration
indicating that material was being removed from the exposure surface.
Furthermore, the decrease in weight continued up to the end of the 1500-hour
test duration. It appears that weight loss would have continued had the exposure
duration been extended. This coincides with the data presented by Kumar et al.
[5] and reinforces the synergistic nature of UV and moisture exposure induced
degradation of carbon/epoxy composites. The percentage weight loss vs.
exposure time for each coating configuration is presented in Figure 14. The
panels coated with Surfacing Film B exhibited the greatest amount of cumulative
weight loss (-0.3%) while the weight of the panels coated with the chromate
primer (-0.14%) was least affected by the environmental exposure.
42

Figure 14 Percentage Weight Loss as a Function of Accelerated Environmental Exposure Duration
4.2 Visual Inspection of Specimens Subjected to Accelerated Environmental Exposure
Initial visual inspection of the exposed test panels did not reveal any
obvious signs of degradation (i.e. cracking). However, all of the panels exhibited
varying degrees of discoloration. The bare composite panels revealed a slight
yellow tint post exposure while the chromate primer coated panels exhibited a
chalky appearance with a slight dark discoloration. Furthermore, the panels
coated with surfacing acquired a brownish tint, which became more pronounced
with increasing exposure duration. Refer to Figures 15 through 18 for comparison
of each coating configuration before and after environmental exposure.
43

Figure 15 Bare Composite
(A) No Exposure (B) 1500 Hrs Exposure
Figure 16
Chromate Primer Coated Composite (A) No Exposure (B) 1500 Hrs Exposure
44

Figure 17
Surfacing Film A (A) No Exposure (B) 1500 Hrs Exposure
Figure 18
Surfacing Film B (A) No Exposure (B) 1500 Hrs Exposure
45

Figures 19 through 22 show SEM images of the Bare Carbon/Epoxy
composite specimens before and after environmental exposure. Figure 19
indicates the formation of matrix microcracking, beginning with as low as 750
hours of exposure and increasing in severity with extended exposure duration.
Figure 20 provides the same images at higher magnification (5000x). These
images provide better detail of the change in surface topography due to epoxy
matrix erosion. As noted in the previous figure, the extent of erosion is more
pronounced with increasing exposure duration. Finally, Figure 22 depicts images
focused on a bundle of carbon fiber tows. In comparing the images obtained
before and after environmental exposure, it is clear that degradation in the form
of matrix erosion has resulted increased surface visibility of the carbon fibers.
Images of the Carbon/Epoxy specimens coated with Chromate Primer are
show in Figure 23. Comparison of the baseline specimen image (A) with the one
obtained after 1500 hours of exposure (B) does reveals minimal signs of
degradation. After exposure, the coating appears less continuous with a slightly
more rough surface texture.
Figures 24 through 27 depict images obtained for the Carbon/Epoxy
specimens coated with Surfacing Film. Examination of Figures 24 and 25
indicates the presence of the microcracking and matrix erosion that increases in
severity with exposure duration. This is similar to the observations made from
examination of the images generated of the Bare Carbon/Epoxy panels. Another
interesting observation can be noted from examination of Figure 26, which
46

depicts Surfacing Film A after an exposure duration of 750 hours. The image
shows several small fibers emanating from the coating surface. These fibers are
likely from the non-woven polyester mat carrier used to support the epoxy resin
during surfacing film manufacture. This was also observed in specimens coated
with Surfacing Film B. Furthermore, cross section images of specimens coated
with Surfacing Film A and B (Figure 27) indicate the fibers are only present after
an exposure duration of 750 hours. The fact that these fibers are not present in
the images of the surfacing film specimens taken at later exposure durations
suggest they are degraded or removed during the exposure process.
47

Figure 19 Secondary Electron SEM Images (1000x) of Bare Carbon/Epoxy Composite
(A) No Exposure (B) 750 Hrs Exposure (C) 1000 Hrs Exposure (D) 1500 Hrs Exposure
48

Figure 20
Secondary Electron SEM Image (25000x) of Bare Carbon/Epoxy Composite after 1500 Hrs of Environmental Exposure
49

Figure 21
Secondary Electron SEM Images (5000x) of Bare Carbon/Epoxy Composite (A) No Exposure (B) 750 Hrs Exposure (C) 1000 Hrs Exposure (D) 1500 Hrs Exposure
Figure 22
Secondary Electron SEM Images (50x) of Bare Carbon/Epoxy Composite (A) No Exposure (B) 750 Hrs Exposure
50

Figure 23
Secondary Electron SEM Image (1000x) of Chromate Primer Coated Carbon/Epoxy Composite
(A) No Exposure (B) 1500 Hrs Exposure
Figure 24
Secondary Electron SEM Image (1000x) of Carbon/Epoxy Composite Coated With Surfacing Film A
(A) No Exposure (B) 1500 Hrs Exposure
51

Figure 25
Secondary Electron SEM Image (1000x) of Carbon/Epoxy Composite Coated With Surfacing Film B
(A) No Exposure (B) 1500 Hrs Exposure
Figure 26
Secondary Electron SEM Image (50x) of Carbon/Epoxy Composite Coated with Surfacing Film A – 750 Hrs Exposure
52

Figure 27
Cross Section Images (50x) of Carbon/Epoxy Specimens coated with (A) Surfacing Film A and (B) Surfacing Film B
53

4.3 Mechanical Test Results
Upon completion of the accelerated environmental exposure, each panel
was subjected to mechanical testing per standard test method ASTM D 3518.
There were no abnormal failures noted during coupon testing (i.e. coupon failed
in the specimen grip area). The mechanical test values were compared with the
baseline strength values of unexposed specimens to determine the degradation
effects of environmental exposure.
The results of the mechanical testing are presented in Tables 3 through 6
as well as Figures 28-30. For the bare composite panels, a decrease in load
carrying capability of approximately 6% (as compared with the baseline value)
was observed after 750 hours of exposure. Examining the mechanical strength
values for bare specimens exposed to 1000 and 1500-hour duration shows they
are statistically equivalent (difference is within one standard deviation) to the
values obtained after 750 hours of exposure. This indicates that no further
degradation takes place in the bare carbon/epoxy composite panels after 750
hours of exposure.
Examining the data for the composite panels coated with chromate primer,
there was no statistically significant decrease in load carrying capability (as
compared with the baseline value) observed after 750 hours of exposure. The
mechanical strength values obtained for panels subjected to 1000 and 1500 hour
duration revealed a decrease of approximately 4% and 8%, respectively. This
54

indicated, as expected, an increased level of degradation with increasing
exposure duration.
For the composite panels coated with Surfacing Film A, a decrease in load
carrying capability of approximately 5% (as compared with the baseline value)
was observed after 750 hours of exposure and a decrease of 12% (as compared
with the baseline value) was observed after 1000 hours. Examining the
mechanical strength values for specimens exposed to a 1500-hour duration
shows they are statistically equivalent (difference is within one standard
deviation) to the values obtained after 1000 hours of exposure. This indicates
that no further degradation takes place in the carbon/epoxy composite panels
coated with the Surfacing Film A after 1000 hours of exposure.
For the composite panels coated with Surfacing Film B, a decrease in load
carrying capability of approximately 4% was observed after 750 hours (as
compared with the baseline value). Examining the mechanical strength values for
specimens exposed to 1000 and 1500-hour duration shows they are statistically
equivalent (difference is within one standard deviation) to the values obtained
after 750 hours of exposure. This indicates that no further degradation takes
place in the carbon/epoxy composite panels coated with Surfacing Film B after
750 hours of exposure.
Figure 30 depicts the strength (ultimate load) of the carbon/epoxy
composite material as a function of coating thickness and environmental
exposure duration. Examination of this figure indicates that in most cases the
55

strength increases with increasing coating thickness. Although this trend is
generally upheld regardless of the exposure duration, a deviation is observed at
a coating thickness of 4 mils (corresponding to panels coated with Surfacing Film
A) for exposure times exceeding 750 hrs.
56

Table 3 Mechanical Strength Values No Exposure
Table 4 Mechanical Strength Values
750 Hr Exposure
57

Table 5 Mechanical Strength Data 1000 Hr Exposure
Table 6 Mechanical Strength Data 1500 Hr Exposure
58

Figure 28 Ultimate Load vs. Exposure Time (A) Bare Composite (B) Chromate Primer Coated Composite
(C) Surfacing Film A (D) Surfacing Film B
59

Figure 29 Ultimate Load as a Function of Coating Configuration and Exposure Duration
Figure 30 Ultimate Load as a Function of Coating Thickness and Exposure Duration
60

5.0 DISCUSSION
5.1 Environmentally Induced Degradation in Carbon/Epoxy Composite Material
Based on the mechanical results obtained from bare, uncoated panels
subsequent to accelerated weathering, it is evident that exposure to UV radiation
and moisture, in the presence of elevated temperature, results in degradation of
the carbon/epoxy laminate structure. The mechanical test results as detailed in
the previous section indicated a reduction in strength of approximately 6% (in
comparison with bare unexposed specimens) after 750 hrs of exposure. This
conclusion is supported by research performed by Kumar et al. [5], although the
degree of mechanical degradation observed in this study was not as severe. This
is likely due to the differences in laminate construction and test methods chosen
to identify the extent of degradation.
The observed reduction in strength is primarily attributed to the formation
of microcracks in the epoxy matrix in addition to extensive matrix erosion, both of
which are caused by the synergistic effects of the simultaneous exposure to both
UV radiation and moisture. Microcracks are a direct result of chain scission and
crosslinking reactions initiated on the exposure surface by radiation from UV
photons. Furthermore, the presence of microcracking can lead to increased
moisture ingress, affecting the fiber-matrix bond integrity. All of these factors,
when combined, result in a diminished capacity of the epoxy matrix to transfer
applied loads to the fibers, ultimately reducing the overall strength of the
61

composite laminate.
The presence of extensive matrix erosion can be verified by examining the
high magnification (SEM) images of the bare carbon/epoxy specimens before
and after environmental exposure (Figures 19 through 22). The mechanism for
matrix erosion, as suggested by Kumar et al., involves the creation of a thin
surface layer of chemically modified epoxy, which is induced by UV radiation.
Subsequent water condensation leaches away soluble degradation products,
which exposes a fresh layer that can once again be attacked by UV radiation [5].
This mechanism is supported by the weight monitoring data obtained during this
study, which demonstrated that the weight of the bare composite specimen
continued to decline right up until the end of the exposure duration, thus
indicating that material is being removed from the surface.
Several reaction mechanisms have been proposed by Kim et al., Kumar et
al, and Musto et al [5,6,10] to explain the degradation in carbon/epoxy
composites as a result of exposure to UV radiation and moisture. Exposure to UV
radiation results in the formation of microcracks with the dominant mechanism
being amide formation due to chain scission of the carbon-nitrogren bonds.
Furthermore, combined exposure to both UV and moisture leads to extensive
matrix erosion by removing the initial degradation reaction products, thus
exposing a fresh surface for UV attack. While the chemical reactions that lead to
degradation were not investigated in this study, visual and microscopic
observations along with mechanical test data correspond well to previous
62

research carried out by Kim, Kumar and Musto [5,6,10]. Specifically, exposure to
UV and moisture resulted in the formation of microcracks and the presence of
matrix erosion, which lead to a decrease in mechanical strength.
5.2 Prevention of Degradation via Implementation of Polymer Based Coatings
This study also evaluated three different polymer-based coating systems
at preventing degradation of the underlying carbon/epoxy substrate when
subjected to environmental exposure. All of the systems were based on epoxy
polymers. Two systems (Surfacing Film A and B) were applied during the initial
cure of the carbon/epoxy laminate. The other system (chromate containing epoxy
paint primer) was applied to the test panel after the laminate had been cured. As
seen in Figure 30, all of the coating applications provided an increase in
mechanical strength over the bare, uncoated laminates, with the more substantial
improvement noted in the panels coated with surfacing film. This increase can
generally be attributed to the presence of the additional cured epoxy resin layer
on the surface of the specimens. The difference in strength between the
chromate primer coated specimens and those coated with surfacing film can be
attributed to the inclusion of polyester fibers in the form of a non-woven mat
carrier. This mat is incorporated into the epoxy surfacing film during fabrication as
a means of resin support. The combination of this nonwoven fiber carrier and
epoxy resin can be viewed as a separate composite system that, when bonded
to the carbon/epoxy substrate, provides additionally strength.
63

Review of the mechanical test data obtained from chromate primer coated
panels indicated that the coating performed well initially, but progressively
degraded with increased exposure duration. Specimens exposed for 750 hrs
exhibited a statistically insignificant decline in strength in comparison to
unexposed specimens with the same coating configuration. On the other hand,
specimens exposed for longer durations exhibited a more significant reduction in
strength (4% for specimens exposed to 1000 hours and 8% for specimens
exposed to 1500 hours) . This was as expected, as one would anticipate a
greater reduction in strength with increasing exposure duration.
Of the two epoxy based surfacing films evaluated, Surfacing Film B
performed the best in terms of degradation prevention. Examination of the
mechanical test results revealed a small initial drop in strength after 750 hrs (4%)
with no additional reduction in strength for subsequent exposure durations.
Surfacing Film A exhibited a similar reduction in strength initially (5%), however, a
sharp decline (12%) was observed after 1000 hrs of exposure. This sudden
decline may be explained by the observations noted in Figure 26 and 27, which
depict an SEM image taken of the Surfacing Film A specimen after 750 hrs of
exposure and cross section images of specimens coated with Surfacing Film A
and B after each exposure duration, respectively. These images reveal the
presence of small fibers emanating from the coating surface for the both
Surfacing Film A and B after 750 hours. These fibers are likely from the
nonwoven polyester mat contained within the epoxy surfacing film. Upon
64

exposure to UV radiation in combination with moisture, erosion of the epoxy
polymer film may have resulted in exposing the underlying polyester fibers.
These fibers were not detected during the visual examination of specimens
exposed to increased durations (refer to Figure 27), indicating they were
degraded. Without these fibers in place, a reduction in strength would be
expected. The fundamental difference in Surfacing Film A and B is the weight of
the epoxy resin (i.e. the thickness) applied to the polyester mat. This would
explain why the “heavier” weight Surfacing Film B did not experience a similar
decline in strength after 1000 hrs exposure. The increased thickness of Surfacing
Film B prevented the underlying polyester fibers from degrading to the extent
observed in Surfacing Film A. It should also be noted that for the sharp decline in
strength observed after 1000 hours of exposure for the Surfacing Film A coating,
the strength values obtained fell only slightly below the minimum strength values
obtained for the bare uncoated carbon/epoxy specimens. This indicates that the
degradation may have penetrated through the surfacing film coating and into the
underlying substrate. This does not coincide with the results obtained from
research conducted by Kim et al, which determined that degradation was
confined to a depth of approximately 6 "m from the exposure surface [6].
Visual inspection of the exposed surfacing film under magnification using
SEM (Figures 24 and 25) reveals similar degradation characteristics exhibited in
the bare carbon/epoxy composite specimens. These images indicate the
formation of microcracks and, additionally, the change in surface morphology
65

signifies some level of matrix erosion. Despite the existence of these epoxy
degradation markers, the mechanical strength data demonstrates that the
underlying carbon/epoxy substrate is only marginally affected in the specimens
coated with Surfacing Film A and not affected at all in those coated with
Surfacing Film B.
66

6.0 SUMMARY AND RECOMMENDATIONS
This study aspired to investigate the degradation of carbon/epoxy
composite materials induced by environmental exposure. Additionally, epoxy
based coatings were examined to determine their effectiveness at preventing
degradation to the underlying carbon/epoxy laminate. By exposing uncoated
composite panels to accelerated weathering, and subsequently performing visual
and mechanical tests, it was determined that degradation does occur. Combined
exposure to UV radiation moisture results in matrix microcracking and erosion,
which reduces the overall strength of carbon/epoxy composite. It was also
determined that although applying a chromate containing epoxy based paint
primer provides protection initially, the underlying carbon/epoxy substrate is
eventually degraded with extended exposure duration. Alternatively, application
of an epoxy based polymer film to the exposure surface during the initial laminate
cure can prevent environmentally induced degradation from affecting the
underlying carbon/epoxy substrate over extended exposure durations. Although
similar degradation attributes were identified in the surfacing film as observed in
the uncoated composite, it is likely that this degradation was either confined
within the surfacing film layer (SF B) or only penetrated the very near surface of
the carbon/epoxy substrate (SF A), as it did not result in a substantial reduction in
mechanical strength.
67

The unexpectedly low mechanical strength results obtained for the
unexposed bare composite specimens warrant further investigation. Research
conducted by Kumar et al. [5] indicated a reduction of approximately 29% in
transverse tensile strength of carbon/epoxy composite material exposed to UV
radiation and condensation. Although the disparity in values obtained in previous
research and this study could be attributed to differences in laminate construction
or test methods additional testing is recommended. Such testing should utilize
various laminate configurations (i.e. thickness, fiber orientation) constructed from
different materials forms (i.e., woven fabric, unidirectional tape) to evaluate the
damage tolerance and durability of the composite specimen after environmental
exposure. For example, carbon\epoxy composite panels subjected to
environmental exposure could be tested for compressive residual strength per
ASTM D7136/D7137 [15,16]. Another approach could use ultrasonic non-
destructive evaluation to monitor the damage (delamination initiated by an
impact) growth characteristics as a function of environmental exposure duration.
These tests may identify additional failure mechanisms, not identified in this
study, that indicate environmentally induced degradation.
68

7.0 APPENDIX A: RAW TEST DATA
69

Weight Monitoring Data
BC-1500-WG CP-1500-WG SF3-1500-WG SF4-1500-WG0 4.8625 5.0904 5.0576 5.352672 4.8615 5.0901 5.0568 5.3522144 4.8609 5.0897 5.0555 5.3520216 4.8601 5.0894 5.0546 5.3516288 4.8596 5.0888 5.0541 5.3513360 4.8590 5.0885 5.0534 5.3510432 4.8587 5.0881 5.0528 5.3506504 4.8572 5.0877 5.0513 5.3493576 4.8563 5.0872 5.0508 5.3489648 4.8555 5.0869 5.0501 5.3472720 4.8548 5.0864 5.0492 5.3464792 4.8542 5.0861 5.0488 5.3456864 4.8536 5.0858 5.0473 5.3441936 4.8531 5.0857 5.0466 5.34311008 4.8528 5.0852 5.0459 5.34271080 4.8526 5.0850 5.0457 5.34201152 4.8521 5.0849 5.0451 5.34091224 4.8517 5.0847 5.0446 5.33971296 4.8510 5.0841 5.0441 5.33931368 4.8508 5.0838 5.0438 5.33841440 4.8506 5.0835 5.0435 5.33761500 4.8499 5.0833 5.0431 5.3366
Specimen I.D.Exposure Time
Weight Loss (g) vs. Exposure Time
70

BC-1500-WG CP-1500-WG SF3-1500-WG SF4-1500-WG0 0 0 0 0
72 -0.0206 -0.0059 -0.0158 -0.0075144 -0.0329 -0.0138 -0.0415 -0.0112216 -0.0494 -0.0196 -0.0593 -0.0187288 -0.0596 -0.0314 -0.0692 -0.0243360 -0.0720 -0.0373 -0.0830 -0.0299432 -0.0781 -0.0452 -0.0949 -0.0374504 -0.1090 -0.0530 -0.1246 -0.0617576 -0.1275 -0.0629 -0.1345 -0.0691648 -0.1440 -0.0688 -0.1483 -0.1009720 -0.1584 -0.0786 -0.1661 -0.1158792 -0.1707 -0.0845 -0.1740 -0.1308864 -0.1830 -0.0904 -0.2037 -0.1588936 -0.1933 -0.0923 -0.2175 -0.1775
1008 -0.1995 -0.1022 -0.2313 -0.18501080 -0.2036 -0.1061 -0.2353 -0.19801152 -0.2139 -0.1080 -0.2472 -0.21861224 -0.2221 -0.1120 -0.2570 -0.24101296 -0.2365 -0.1238 -0.2669 -0.24851368 -0.2406 -0.1297 -0.2729 -0.26531440 -0.2447 -0.1355 -0.2788 -0.28021500 -0.2591 -0.1395 -0.2867 -0.2989
Exposure Time
Specimen I.D.
Percentage Weight Loss vs. Exposure Time
71

Bare Composite Mechanical Test Data
Coupon I.D. Width (in) Thickness (in)
Cross Section Area
(in2)
Peak Tensile
Load (lbf)BC-C-1 1.003 0.032 0.0321 1099BC-C-2 1.003 0.032 0.0321 1160BC-C-3 1.003 0.032 0.0321 1092BC-C-4 1.003 0.032 0.0321 1150BC-C-5 1.003 0.032 0.0321 1086BC-C-6 1.005 0.032 0.0321 1088BC-C-7 1.000 0.032 0.0320 1124BC-C-8 1.003 0.032 0.0321 1076
1109
32
2.9
Test Panel I.D. - BC-CPanel Description - Bare Composite, No Exposure
Coefficient of Variation (%)
Mean Peak Load (lbf)
Standard Deviation
Coupon I.D. Width (in) Thickness (in)
Cross Section Area
(in2)
Peak Tensile
Load (lbf)BC-750-1 1.003 0.031 0.0311 1067BC-750-2 1.003 0.032 0.0316 1016BC-750-3 0.998 0.031 0.0309 1017BC-750-4 1.003 0.031 0.0311 1082BC-750-5 1.002 0.031 0.0311 1057BC-750-6 1.000 0.031 0.0310 1051BC-750-7 1.002 0.031 0.0310 1044BC-750-8 1.000 0.031 0.0310 1027
1045
24
2.3
64
5.8
Test Panel I.D. - BC-750Panel Description - Bare Composite, 750 Hour
Exposure
Standard Deviation
Decrease in Mean Max Load from Baseline (lbf)Percentage Decrease in Mean Max Load from Baseline
Coefficient of Variation (%)
Mean Peak Load (lbf)
72

Coupon I.D. Width (in) Thickness (in)
Cross Section Area
(in2)
Peak Tensile
Load (lbf)BC-1000-1 0.996 0.032 0.0319 1076BC-1000-2 0.998 0.032 0.0319 1049BC-1000-3 0.998 0.031 0.0309 1051BC-1000-4 0.996 0.032 0.0319 1053BC-1000-5 0.998 0.032 0.0319 1065BC-1000-6 0.997 0.031 0.0309 1042BC-1000-7 1.005 0.032 0.0321 1058BC-1000-8 1.000 0.031 0.0310 1061
1057
11
1.0
52
4.7
Test Panel I.D. - BC-1000Panel Description - Bare Composite, 1000 Hour
Exposure
Decrease in Mean Max Load from Baseline (lbf)Percentage Decrease in Mean Max Load from Baseline
Mean Peak Load (lbf)
Coefficient of Variation (%)
Standard Deviation
Coupon I.D. Width (in) Thickness (in)
Cross Section Area
(in2)
Peak Tensile
Load (lbf)BC-1500-1 1.000 0.031 0.0310 1056BC-1500-2 0.997 0.031 0.0309 1046BC-1500-3 0.997 0.030 0.0299 1025BC-1500-4 0.998 0.031 0.0309 1063BC-1500-5 0.999 0.031 0.0310 1042BC-1500-6 1.000 0.031 0.0310 1083BC-1500-7 0.995 0.031 0.0308 1040BC-1500-8 0.998 0.031 0.0309 1045
1050
17
1.7
59
5.3
Standard Deviation
Decrease in Mean Max Load from Baseline (lbf)
Test Panel I.D. - BC-1500Panel Description - Bare Composite, 1500 Hour
Exposure
Mean Peak Load (lbf)
Coefficient of Variation (%)
Percentage Decrease in Mean Max Load from Baseline
73

Chromate Primer Coating Mechanical Test Data
Coupon I.D. Width (in) Thickness (in)
Cross Section Area
(in2)
Peak Tensile
Load (lbf)CP-C-1 1.003 0.033 0.0331 1173CP-C-2 1.000 0.033 0.0330 1159CP-C-3 1.000 0.033 0.0330 1197CP-C-4 1.004 0.033 0.0331 1151CP-C-5 1.003 0.033 0.0331 1189CP-C-6 1.003 0.032 0.0321 1071CP-C-7 1.002 0.033 0.0331 1148CP-C-8 1.002 0.033 0.0330 1097
1148443.8
Test Panel I.D. - CP-CPanel Description - Chromated Primer Coated
Composite, No Exposure
Mean Peak Load (lbf)Standard DeviationCoefficient of Variation (%)
Coupon I.D. Width (in) Thickness (in)
Cross Section Area
(in2)
Peak Tensile
Load (lbf)CP-750-1 0.999 0.032 0.0320 1164CP-750-2 1.002 0.033 0.0331 1132CP-750-3 1.000 0.034 0.0340 1145CP-750-4 1.005 0.033 0.0332 1138CP-750-5 1.000 0.032 0.0320 1171CP-750-6 0.999 0.032 0.0320 1164CP-750-7 1.002 0.033 0.0331 1115CP-750-8 1.003 0.033 0.0331 1091
1140272.48
0.7
Standard Deviation
Decrease in Mean Max Load from Baseline (lbf)Percentage Decrease in Mean Max Load from Baseline
Coefficient of Variation (%)
Mean Peak Load (lbf)
Test Panel I.D. - CP-750Panel Description - Chromated Primer Coated
Composite, 750 Hour Exposure
74

Coupon I.D. Width (in) Thickness (in)
Cross Section Area
(in2)
Peak Tensile
Load (lbf)CP-1000-1 0.997 0.032 0.0319 1108CP-1000-2 0.996 0.033 0.0329 1103CP-1000-3 0.996 0.034 0.0338 1086CP-1000-4 0.996 0.033 0.0329 1121CP-1000-5 0.999 0.033 0.0330 1067CP-1000-6 0.996 0.032 0.0319 1119CP-1000-7 0.993 0.033 0.0328 1099CP-1000-8 1.000 0.033 0.0330 1089
109918
1.649
4.3
Decrease in Mean Max Load from Baseline (lbf)Percentage Decrease in Mean Max Load from Baseline
Test Panel I.D. - CP-1000Panel Description - Chromated Primer Coated
Composite, 1000 Hour Exposure
Coefficient of Variation (%)
Mean Peak Load (lbf)Standard Deviation
Coupon I.D. Width (in) Thickness (in)
Cross Section Area
(in2)
Peak Tensile
Load (lbf)CP-1500-1 1.003 0.032 0.0321 1091CP-1500-2 1.003 0.033 0.0331 1051CP-1500-3 1.005 0.033 0.0332 1085CP-1500-4 1.005 0.032 0.0322 1077CP-1500-5 1.002 0.032 0.0321 1035CP-1500-6 1.003 0.033 0.0331 1086CP-1500-7 1.000 0.033 0.0330 1016CP-1500-8 1.002 0.032 0.0321 1039
1060282.7887.7
Decrease in Mean Max Load from Baseline (lbf)Percentage Decrease in Mean Max Load from
Coefficient of Variation (%)
Mean Peak Load (lbf)Standard Deviation
Test Panel I.D. - CP-1500Panel Description - Chromated Primer Coated
Composite, 1500 Hour Exposure
75

Surfacing Film A Mechanical Test Data
Coupon I.D. Width (in) Thickness (in)
Cross Section Area
(in2)
Peak Tensile
Load (lbf)SF3-C-1 0.999 0.037 0.0364 1241SF3-C-2 1.004 0.036 0.0361 1155SF3-C-3 1.000 0.036 0.0360 1225SF3-C-4 1.000 0.036 0.0355 1227SF3-C-5 1.001 0.036 0.0360 1239SF3-C-6 1.001 0.036 0.0355 1195SF3-C-7 1.002 0.036 0.0356 1177SF3-C-8 1.003 0.035 0.0351 1235
1212322.7
Test Panel I.D. - SFA-CPanel Description - 0.035 psf Surfacing Film, No
Exposure
Mean Peak Load (lbf)Standard DeviationCoefficient of Variation (%)
Coupon I.D. Width (in) Thickness (in)
Cross Section Area
(in2)
Peak Tensile
Load (lbf)SF3-750-1 0.999 0.034 0.0340 1169SF3-750-2 1.000 0.034 0.0340 1156SF3-750-3 0.995 0.034 0.0338 1197SF3-750-4 1.002 0.034 0.0341 1122SF3-750-5 0.997 0.034 0.0339 1168SF3-750-6 0.997 0.034 0.0339 1166SF3-750-7 0.996 0.035 0.0349 1114SF3-750-8 0.998 0.034 0.0339 1167
1157272.354
4.5
Standard Deviation
Decrease in Mean Max Load from Baseline (lbf)Percentage Decrease in Mean Max Load from Baseline
Coefficient of Variation (%)
Mean Peak Load (lbf)
Test Panel I.D. - SFA-750Panel Description - 0.035 psf Surfacing Film, 750 Hour
Exposure
76

Coupon I.D. Width (in) Thickness (in)
Cross Section Area
(in2)
Peak Tensile
Load (lbf)SF3-1000-1 0.996 0.035 0.0349 1020SF3-1000-2 0.999 0.035 0.0349 1070SF3-1000-3 1.002 0.035 0.0351 1110SF3-1000-4 1.001 0.034 0.0340 1119SF3-1000-5 1.000 0.035 0.0350 1100SF3-1000-6 1.000 0.035 0.0350 1063SF3-1000-7 1.000 0.035 0.0350 1038SF3-1000-8 0.998 0.035 0.0349 1051
1071333.114011.6
Decrease in Mean Max Load from Baseline (lbf)Percentage Decrease in Mean Max Load from
Test Panel I.D. - SFA-1000Panel Description - 0.035 psf Surfacing Film, 1000
Hour Exposure
Coefficient of Variation (%)
Mean Peak Load (lbf)Standard Deviation
Coupon I.D. Width (in) Thickness (in)
Cross Section Area
(in2)
Peak Tensile
Load (lbf)SF3-1500-1 0.997 0.035 0.0349 1003SF3-1500-2 0.996 0.034 0.0339 1100SF3-1500-3 0.996 0.035 0.0349 1069SF3-1500-4 0.995 0.036 0.0353 1072SF3-1500-5 1.003 0.035 0.0351 1059SF3-1500-6 0.996 0.034 0.0339 1099SF3-1500-7 0.998 0.036 0.0359 1103SF3-1500-8 1.004 0.035 0.0351 1107
1077353.213511.2
Decrease in Mean Max Load from Baseline (lbf)Percentage Decrease in Mean Max Load from
Coefficient of Variation (%)
Mean Peak Load (lbf)Standard Deviation
Test Panel I.D. - SFA-1500Panel Description - 0.035 psf Surfacing Film, 1500
Hour Exposure
77

Surfacing Film B Mechanical Test Data
Coupon I.D. Width (in) Thickness (in)
Cross Section Area
(in2)
Peak Tensile
Load (lbf)SF4-C-1 1.001 0.037 0.0370 1280SF4-C-2 0.998 0.038 0.0374 1261SF4-C-3 1.000 0.038 0.0375 1298SF4-C-4 1.003 0.038 0.0376 1248SF4-C-5 1.001 0.038 0.0375 1257SF4-C-6 1.001 0.038 0.0375 1269SF4-C-7 1.002 0.037 0.0371 1235SF4-C-8 1.003 0.038 0.0376 1260
1264191.5Coefficient of Variation (%)
Test Panel I.D. - SFB-CPanel Description - 0.045 psf Surfacing Film, No
Exposure
Mean Peak Load (lbf)Standard Deviation
Coupon I.D. Width (in) Thickness (in)
Cross Section Area
(in2)
Peak Tensile
Load (lbf)SF4-750-1 1 0.036 0.036 1218SF4-750-2 0.998 0.0377 0.0376246 1174SF4-750-3 0.999 0.0365 0.0364635 1224SF4-750-4 0.998 0.0364 0.0363272 1224SF4-750-5 0.9985 0.0365 0.03644525 1253SF4-750-6 0.995 0.0365 0.0363175 1223SF4-750-7 0.997 0.0358 0.0356926 1185SF4-750-8 1.0025 0.036 0.03609 1211
1214252.050
3.9Percentage Decrease in Mean Max Load from Baseline
Test Panel I.D. - SFB-750Panel Description - 0.045 psf Surfacing Film, 750 Hour
Exposure
Decrease in Mean Max Load from Baseline (lbf)Coefficient of Variation (%)
Mean Peak Load (lbf)Standard Deviation
78

Coupon I.D. Width (in) Thickness (in)
Cross Section Area
(in2)
Peak Tensile
Load (lbf)SF4-1000-1 0.997 0.036 0.0359 1242SF4-1000-2 1.012 0.037 0.0374 1184SF4-1000-3 1.000 0.037 0.0370 1227SF4-1000-4 1.000 0.037 0.0370 1149SF4-1000-5 0.998 0.037 0.0369 1210SF4-1000-6 0.999 0.038 0.0380 1135SF4-1000-7 1.000 0.037 0.0370 1182SF4-1000-8 1.000 0.036 0.0360 1170
118737
3.1766.0
Coefficient of Variation (%)
Standard Deviation
Test Panel I.D. - SFB-1000Panel Description - 0.045 psf Surfacing Film, 1000
Exposure
Mean Peak Load (lbf)
Decrease in Mean Max Load from Baseline (lbf)Percentage Decrease in Mean Max Load from
Coupon I.D. Width (in) Thickness (in)
Cross Section Area
(in2)
Peak Tensile
Load (lbf)SF4-1500-1 0.995 0.037 0.0368 1210SF4-1500-2 0.996 0.037 0.0369 1204SF4-1500-3 0.997 0.036 0.0359 1177SF4-1500-4 0.998 0.037 0.0369 1238SF4-1500-5 0.996 0.036 0.0359 1167SF4-1500-6 0.997 0.036 0.0359 1228SF4-1500-7 1.000 0.037 0.0370 1213SF4-1500-8 0.995 0.036 0.0358 1214
1206242.0574.5
Standard Deviation
Test Panel I.D. - SFB-1500Panel Description - 0.045 psf Surfacing Film, 1500
Hour Exposure
Decrease in Mean Max Load from Baseline (lbf)Coefficient of Variation (%)
Mean Peak Load (lbf)
Percentage Decrease in Mean Max Load from
79

8.0 APPENDIX B: SUPPORTING DOCUMENATION
80

ASTM D 3518/D 3518M - In-Plane Shear Response of Polymer Matrix Composite Materials by Tensile Test of a ±45° Laminate [11]
81

82

83

84

85

86

87

ASTM D3039/D3039M, 2007, “Standard Test Method for Tensile Properties of Polymer Matrix Composite Materials” [12]
88

89

90

91

92

93

94

95

96

97

98

99

100

ASTM G 155, 2005, “Operating Xenon Arc Light Apparatus for Exposure of Non-Metallic Materials”[13]
101

102

103

104

105
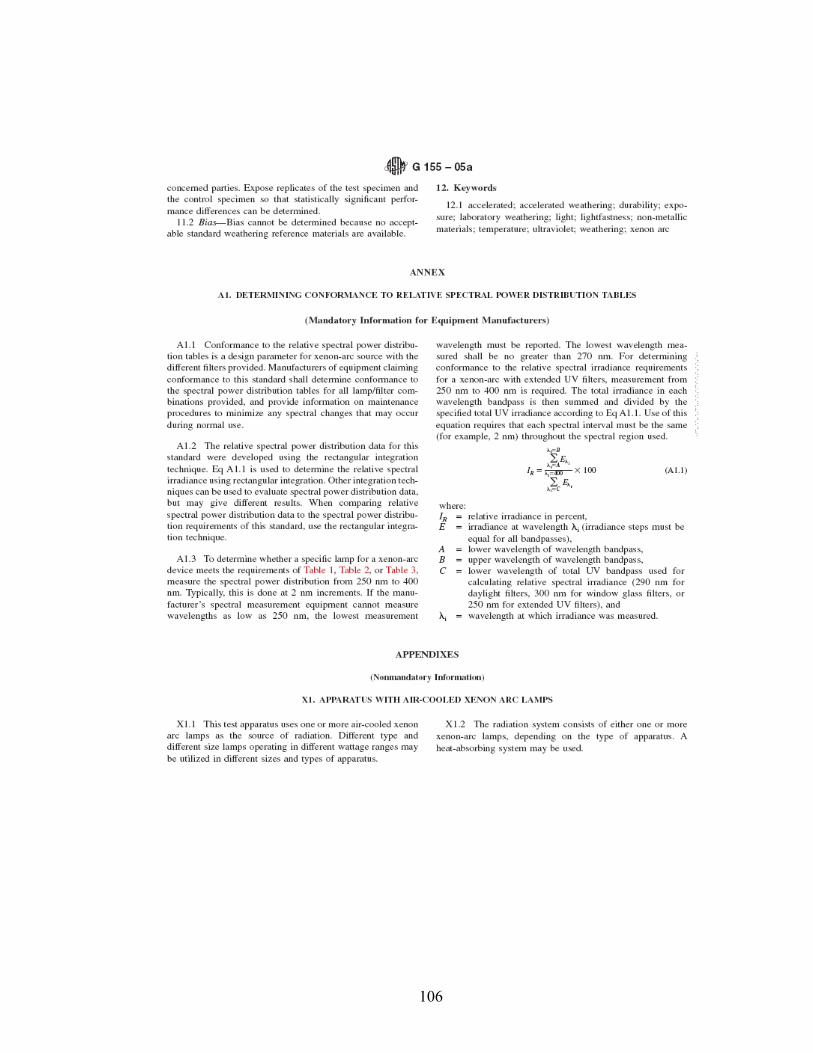
106

107

108

109

110

9.0 REFERENCES
1. Niu, Michael C.Y. Composite Airframe Structures: Practical Design Information and Data. Hong Kong: Commilit Press Ltd., 1992
2. Hoskin, Brian C. and Alan A. Baker. Composite Materials for Aircraft Structures.
New York, New York: American Institute of Aeronautics and Astronautics, Inc., 1986 3. Strong, A. Brent. Composites Manufacturing Materials, Methods, and Applications.
Dearborn, Michigan: Society of Manufacturing Engineers, 2008 4. Lofgren, Sean. “Global Composites Industry Outlook in 2008 and Beyond: The
Composite Products Market Reached $56 billion in 2007.” Rueters. February 2008. September 2008. < http://www.reuters.com/article/pressRelease/idUS136283+07-Feb-2008+PRN20080207>
5. Kumar, B.G.., Singh R.P, and Nakamura T. (2002). Degradation of Carbon Fiber-
reinforced Epoxy Composites by Ulraviolet Radiation and Condensation. Jounal of Composite Matrerials, 36(24), 2713-33.
6. Heung K. and Urban M. (2000). Molecular Level Chain Scission Mechanisms of
Epoxy and Urethane Polymeric Films Exposed to UV/H20. Multidimensional Spectroscopic Studies. Langmuir, 16(12), 5382-5390.
7. Nakamura, T., Singh, R.P., and Vaddadi, P. (2006). Effects of Environmental
Degradation on Flexural Failure Strength of Fiber Reinforced Composites. Experimental Mechanics, 0, 1-12.
8. Xiaojun L., Zhang, Q., Guojun, X., Guanjie, L. (2006). Degradation of Carbon
Fiber/Epoxy Composites by XE Lamp and Humidity. International Journal of Modern Physics B, 20,25-27, 3686-3691.
9. Mazumdar, Sanjay K. Composites Manufacturing. Materials, Product, and Process
Engineering. Boca Raton, Florida: CRC Press LLC, 2002. 10. Musto, P., Ragosta, G, Abbate, A., and Scarinzi, G. (2008) Photo-Oxidation of High
Performance Epoxy Networks: Correlation between the Molecular Mechanisms of Degradation and the Viscoelastic and Mechanical Response. Macromolecules, 41, 5729-5743
111

112
11. ASTM D 3518/D 3518M, 1994, “ In-Plane Shear Response of Polymer Matrix Composite Materials by Tensile Test of a ±45° Laminate”, American Society for Testing and Materials, West Conshohocken, PA.
12. ASTM D3039/D3039M, 2007, “Standard Test Method for Tensile Properties of
Polymer Matrix Composite Materials”, American Society for Testing and Materials, West Conshohocken, PA.
13. ASTM G 155, 2005, “Operating Xenon Arc Light Apparatus for Exposure of Non-
Metallic Materials”, American Society for Testing and Materials, West Conshohocken, PA.
14. ASTM D 7136/D7136M, 2007, “Standard Test Method for Measuring the Damage
Resistance of a Fiber-Reinforced Polymer Matrix Composite to a Drop-Weight Impact Event”, American Society for Testing and Materials, West Conshohocken, PA.
15. ASTM D 71377137M, 2007, “Compressive Residual Strength Properties of Damaged
Polymer Matrix Composite Plates”, American Society for Testing and Materials, West Conshohocken, PA.