Embed Size (px)
Citation preview

Prevention First 2012Finding a green ship in a blue ocean
October 2012

• About RightShip
• The Existing Vessel Design Index
• Age vs. Performance
• Practical application examples
Agenda

• Independent company formed in Oct 2001• Melbourne, London & Houston• 200+ Customers globally
• Ship Vetting & Risk Management• Petroleum & Dry Cargo Vetting Service • Environmental Rating & CO2 Benchmarking
• Worldwide dedicated vetting specialists• Former serving Masters and Chief Engineers
• Award winning proven system• ISO9001 and ISO27001 Certified
About Rightship

The Existing Vessel Design
Index
Part Two

Framing the Opportunity
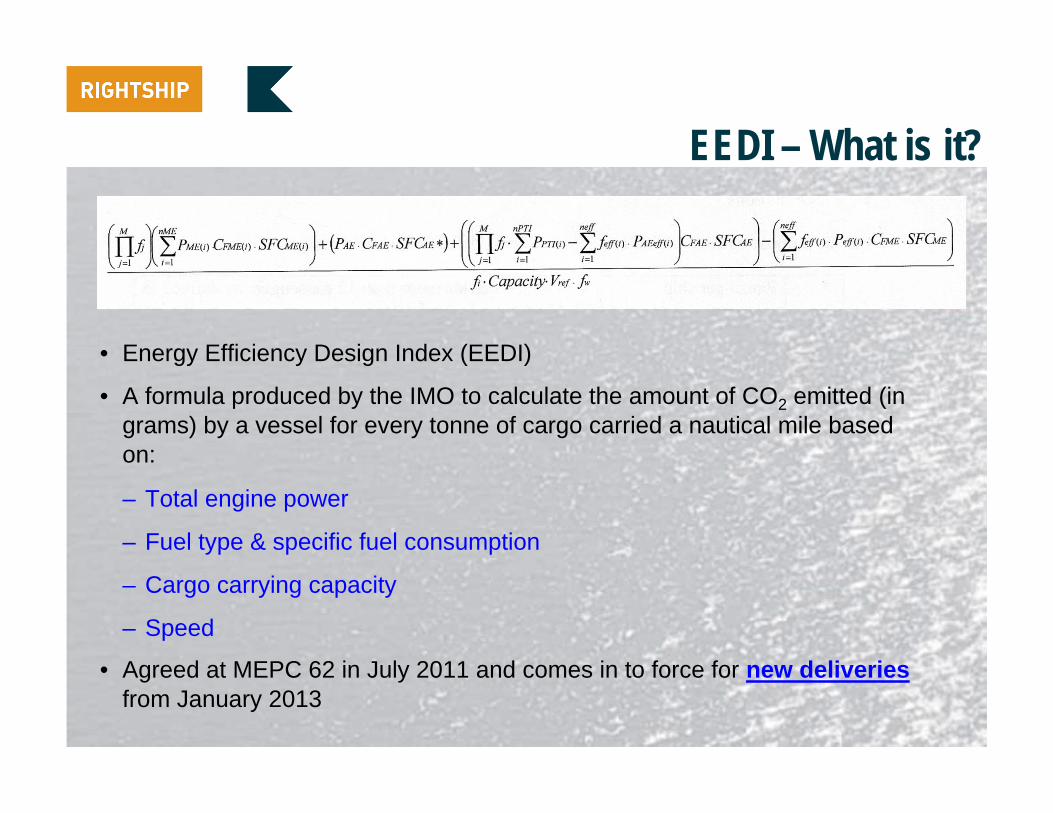
EEDI – What is it?
• Energy Efficiency Design Index (EEDI)
• A formula produced by the IMO to calculate the amount of CO2 emitted (in grams) by a vessel for every tonne of cargo carried a nautical mile based on:
– Total engine power
– Fuel type & specific fuel consumption
– Cargo carrying capacity
– Speed
• Agreed at MEPC 62 in July 2011 and comes in to force for new deliveries from January 2013

EVDI™ – What is it?
• Existing Vessel Design Index (EVDI™)
• This formula produces the amount of CO2 emitted (in grams) by a vessel for every tonne of cargo carried a nautical mile based on:
– Total engine power
– Fuel type & specific fuel consumption
– Cargo carrying capacity
– Speed
• Developed by RightShip based on the same assumption as the EEDI, this formula can be validly applied to existing vessels right now

EVDI™ – What it is not?•Not a replacement for the EEDI
•Not a mechanism to drive retrospective legislation
•Not a measure of the vessel’s operational performance
•Not going to tell you if a vessel has been designed efficiently (comparison only)

The Relative Efficiency of the Existing Fleet

Basis of Comparison
Ship Type Basis of Size Range
Size Rating Range
(Vessels)
ApproximateNumber of
Ships
Bulk Carrier DWT 200 11,300
Chemical Tanker DWT 50 700
Container TEU 200 5,300
Crude & Products Tanker (inc. OBO) DWT 200 10,300
Cruise GT 50 600
General Cargo DWT 100 11,700
LNG Tanker CBM 50 400
LPG Tanker CBM 50 1,200
Refrigerated Cargo Ship DWT 50 1,000
Vehicle DWT 50 800

Let’s Compare

Let’s Compare
Age vs Performance
Part Three

Bulk Carriers 75,000 - 80,000dwt vs Reference Line (1990 – 2012)
Most efficient

Bulk Carriers 75,000 - 80,000dwt vs Reference Line (2007– 2012)
Least Efficient

Practical Applications
Part Four

For the Terminal

For the Ship Owner
• Charterers • Owners • Terminals• Finance companies• Industry
Results so far

• Emissions of the existing fleet already form part of the decision making process
• RightShip A - G Greenhouse Gas Emissions is a statistically valid means of determining relative efficiency of existing tonnage
• Promote market solutions through the logistics chain
• Welcome your feedback and input –www.shippingefficiency.org
Conclusions