Embed Size (px)
Citation preview
Preventing biofilm formation using antibacterial loaded mesoporous surfaces
Master of Science Thesis
Emma Andersson
Department of Chemical and Biological Engineering
Division of Applied Surface Chemistry
CHALMERS UNIVERSITY OF TECHNOLOGY
Göteborg, Sweden, 2013

1
2
Abstract
Infections caused by microbial biofilms are a large problem related to implants. Biofilms are
responsible for 80 % of all infections in the world. When treating patients with implant related
infections using antibiotics the drug reaches the biofilm from above, which may lead to eradication of
bacteria only at the top of the biofilm, leaving viable bacteria in the lower part. One of the aims of
this project was to test an option where the antibiotic was fed locally from the surface of the
implant. Another aim was to try to integrate an antimicrobial peptide within the surface and see if it
had the same or even better killing effect as the antibiotic. Mesoporous titania was spin coated on
top of glass slides and charged with antimicrobial substance (Cloxacillin or RRP9W4N) and the
bacterium Staphylococcus epidermidis. The samples were analyzed with QCM-D, SEM, light
microscopy, UV-Vis and ESCA. The study was performed at Chalmers University of Technology at the
department of Applied chemistry. The QCM-D and ESCA measurements on Cloxacillin indicate that
Cloxacillin enters the pores of the mesoporous titania. The SEM images showed a mesoporous
structure where RRP9W4N had the best effect. The UV-Vis spectra gave the same results, RRP9W4N
was the best antimicrobial substance, but the light microscopy images favored Cloxacillin.
3
Table of Contents Abstract ................................................................................................................................................... 2
1. Introduction ..................................................................................................................................... 5
2. Background ...................................................................................................................................... 6
2.1 Mesoporous titania ................................................................................................................. 6
2.2 Staphylococcus epidermidis ..................................................................................................... 6
2.3 Cloxacillin ................................................................................................................................. 6
2.4 Antimicrobial peptide .............................................................................................................. 7
3. Experimental ................................................................................................................................... 7
3.1 Synthesis of mesoporous titania ............................................................................................. 7
3.2 Thin film preparation ............................................................................................................... 7
3.3 Quartz crystal microbalance with dissipation measurements ................................................ 8
3.4 Scanning electron microscope measurements ....................................................................... 8
3.4.1 Preparation for measurement of the mesoporous surface ............................................ 9
3.4.2 Preparation for measurement of the surface with bacteria and antimicrobial substance
9
3.5 Preparation of cell media ........................................................................................................ 9
3.5.1 Preparation of Todd Hewitt broth ................................................................................... 9
3.5.2 Preparation of 0.85% NaCl ............................................................................................ 10
3.6 Making agar plates ................................................................................................................ 10
3.7 Bacterial growth .................................................................................................................... 10
3.7.1 Growth with Cloxacillin ................................................................................................. 10
3.7.2 Growth with RRP9W4N ................................................................................................. 12
3.8 Ultraviolet-visible spectrophotometer measurements ......................................................... 13
3.9 Electron spectroscopy for chemical analysis ......................................................................... 13
3.10 Colony forming units ............................................................................................................. 14
4. Results ........................................................................................................................................... 14
4.1 QCM-D graphs ....................................................................................................................... 14
4.2 SEM images ........................................................................................................................... 16
4.3 Light microscopy images of the different surfaces ............................................................... 17
4.3.1 Light microscopy images of bacterial solutions treated with Cloxacillin ...................... 17
4.3.2 Light microscopy images of bacterial solutions treated with RRP9W4N ...................... 18
4.4 UV-Vis .................................................................................................................................... 19
4.4.1 Measurements from bacterial growth with Cloxacillin ................................................. 20
4.4.2 Measurements from bacterial growth with RRP9W4N ................................................. 21
4
4.4.3 Statistics ......................................................................................................................... 23
4.5 ESCA ....................................................................................................................................... 24
4.6 CFU ........................................................................................................................................ 25
5. Discussion ...................................................................................................................................... 26
6. Conclusion ..................................................................................................................................... 28
7. Future work ................................................................................................................................... 28
8. Acknowledgements ....................................................................................................................... 28
9. References ..................................................................................................................................... 29
10. Appendix .................................................................................................................................... 30
10.1 Calculations of antibiotic solutions ....................................................................................... 30
10.1.1 Cloxacillin concentration 0.5 g/L ................................................................................... 30
10.1.2 Cloxacillin concentration 0.5 mg/L ................................................................................ 30
10.1.3 Cloxacillin concentration 2.25 mg/L .............................................................................. 30
10.1.4 Cloxacillin for test 2 ....................................................................................................... 30
10.1.5 Cloxacillin for test 3 and control 3 ................................................................................. 30
10.2 Calculations of peptide solutions .......................................................................................... 31
10.2.1 RRP9W4N concentration 200µM .................................................................................. 31
10.2.2 RRP9W4N for test 2 ....................................................................................................... 31
10.2.3 RRP9W4N for test 3 and control 3 ................................................................................ 31
10.3 Making 0.1% safranin solution .............................................................................................. 32
10.4 Tables with UV-Vis values ...................................................................................................... 32
5
1. Introduction
Infections caused by microbial biofilms are a large problem related to implants. Biofilms are
responsible for 80 % of all infections in the world [2]. Their resistance to antibiotics can be even a
thousand times more than the corresponding planktonic counterparts which makes them
problematic to eradicate [3]. These biofilms consist of bacteria living on surfaces embedded in a
matrix of polysaccharides, proteins and DNA among other things [2]. When treating patients with
implant related infections using antibiotics the drug reaches the biofilm from above which may lead
to eradication of bacteria only at the top of the biofilm, leaving viable bacteria in the lower part.
Usually antibiotics are given preventively in association with implant surgery but instead of giving a
systematic prophylactic feed one of the aims of this project was to test an option where the
antibiotics are fed locally. A disadvantage when using antibiotics is that the bacteria can develop
resistance towards the antibiotics. That is why another aim was to try to integrate antimicrobial
peptides into the implant surface and compare its bactericidal effect with the effect of the antibiotic.
The antibiotic used in this project was Cloxacillin, a commercially available drug. The antimicrobial
peptide used was RRPRPRPRPWWWW-NH2, which has shown high bactericidal effect. The bacterium
that was cultured is Staphylococcus epidermidis, a common skin bacterium. As this work is only one
part of a larger project there will be no animal testing included in this thesis.
6
2. Background
A brief introduction to the materials and methods used will be presented in the sections below.
2.1 Mesoporous titania
Mesoporous materials can, due to their high surface area and rich porosity, work as a local drug
delivery system. Recent studies have indicated that in the biomedical field sol-gel-derived titania
coatings on Ti alloys are potentially applicable. Mesoporous titania films (MTF) have shown a higher
strength than conventional titania films for two reasons; there is a low amount of polymer and
carbon left in the MTF after heat treatment which increases the bonding with the substrate, and
there are a lot of Ti-OH groups in the MTF with the ability to work as binders providing strength [4].
Mesoporous titania (MpTiO2) has been evaluated as coating on titania implants. The results showed
more bone formation and increased tissue integration to the coated implants [5]. The advantage of
using MpTiO2 is its low toxicity, bio-stability, large specific surface area and a pore system with
tunable drug loading and release rate [6].
2.2 Staphylococcus epidermidis
Staphylococcus epidermidis, or S. epidermidis, is a bacterium situated in the skin and mucous
membranes of the human body. As it belongs to the normal human bacterial flora, a predisposed
host is necessary for it to become a cause infection. It is a common pathogen causing hospital
acquired infections in bloodstream, eye, ear, nose and throat as well as cardiovascular infections. S.
epidermidis often leads to subacute or chronic infections due to lack of tissue-damaging toxins.
Another type of infection, that is very common, caused by S. epidermidis, is related to foreign bodies
like indwelling catheters and implanted devices. S. epidermidis forms a biofilm on the indwelling
device which makes the bacterium difficult to eliminate since the biofilm decreases the penetration
of antibiotics to the target along with a decreased immune response. Therefore, the device often
needs to be reinserted [7].
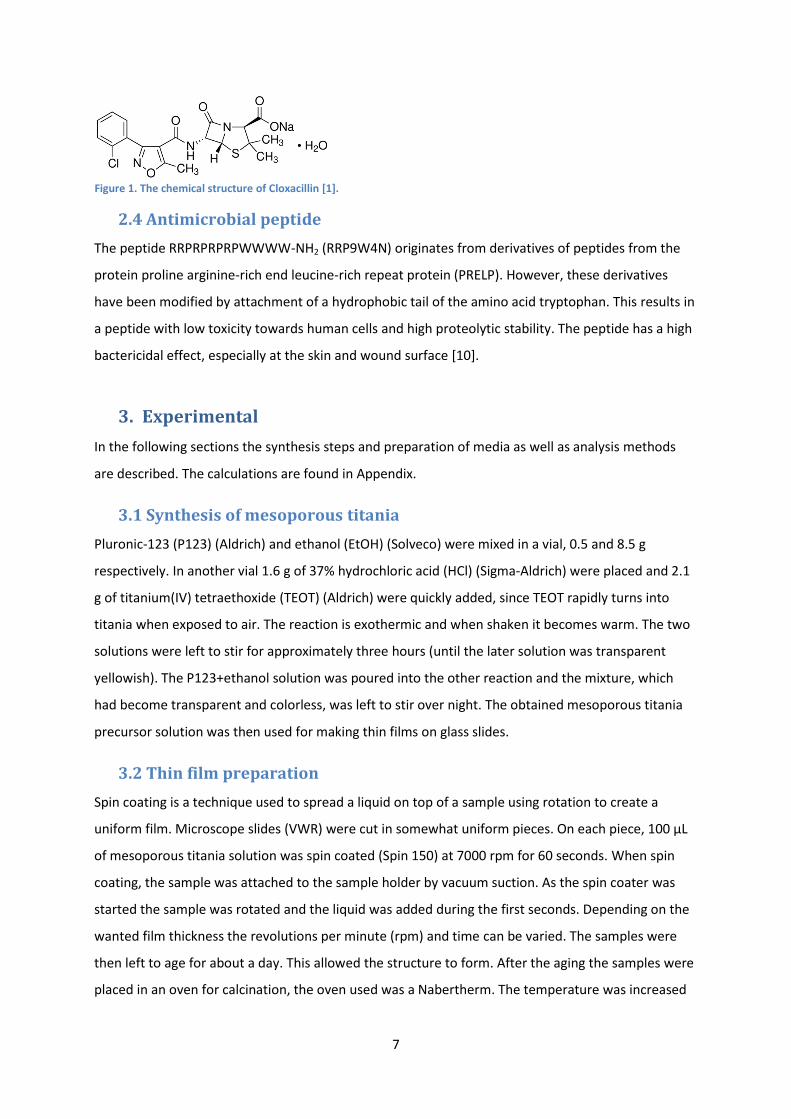
2.3 Cloxacillin
Cloxacillin is a semi-synthetic penicillin commonly used in human and veterinary medicine. The
antimicrobial property comes from its beta-lactam ring [8]. Due to this beta-lactam it has a time-
dependent bactericidal activity which means that an increase in the concentration past a certain
point does not improve the bactericidal activity significantly. How effective these antibiotics are
depends on the time that the bacteria are exposed to the penicillin, as the mechanism is to inhibit
the construction of the bacterial wall. Cloxacillin can diffuse into the skin, soft tissue and even to fetal
blood [9]. The structure of Cloxacillin is illustrated in Figure 1.
7
2.4 Antimicrobial peptide
The peptide RRPRPRPRPWWWW-NH2 (RRP9W4N) originates from derivatives of peptides from the
protein proline arginine-rich end leucine-rich repeat protein (PRELP). However, these derivatives
have been modified by attachment of a hydrophobic tail of the amino acid tryptophan. This results in
a peptide with low toxicity towards human cells and high proteolytic stability. The peptide has a high
bactericidal effect, especially at the skin and wound surface [10].
3. Experimental
In the following sections the synthesis steps and preparation of media as well as analysis methods
are described. The calculations are found in Appendix.
3.1 Synthesis of mesoporous titania
Pluronic-123 (P123) (Aldrich) and ethanol (EtOH) (Solveco) were mixed in a vial, 0.5 and 8.5 g
respectively. In another vial 1.6 g of 37% hydrochloric acid (HCl) (Sigma-Aldrich) were placed and 2.1
g of titanium(IV) tetraethoxide (TEOT) (Aldrich) were quickly added, since TEOT rapidly turns into
titania when exposed to air. The reaction is exothermic and when shaken it becomes warm. The two
solutions were left to stir for approximately three hours (until the later solution was transparent
yellowish). The P123+ethanol solution was poured into the other reaction and the mixture, which
had become transparent and colorless, was left to stir over night. The obtained mesoporous titania
precursor solution was then used for making thin films on glass slides.
3.2 Thin film preparation
Spin coating is a technique used to spread a liquid on top of a sample using rotation to create a
uniform film. Microscope slides (VWR) were cut in somewhat uniform pieces. On each piece, 100 µL
of mesoporous titania solution was spin coated (Spin 150) at 7000 rpm for 60 seconds. When spin
coating, the sample was attached to the sample holder by vacuum suction. As the spin coater was
started the sample was rotated and the liquid was added during the first seconds. Depending on the
wanted film thickness the revolutions per minute (rpm) and time can be varied. The samples were
then left to age for about a day. This allowed the structure to form. After the aging the samples were
placed in an oven for calcination, the oven used was a Nabertherm. The temperature was increased
Figure 1. The chemical structure of Cloxacillin [1].
8
to 350°C at a rate of 1°C/minute and this temperature was maintained for four hours. During the
calcination, Pluronic was removed and cross-linking had occurred. After the samples had cooled they
were stored in sterile 99.7% ethanol at room temperature.
3.3 Quartz crystal microbalance with dissipation measurements
The Quartz Crystal Microbalance with Dissipation (QCM-D) technique is based on the frequency and
energy dissipation response of a freely oscillating sensor [11]. It consists of a thin quartz disc that is
connected to two electrodes. Two QCM-D titanium discs (qsense) were spin coated with mesoporous
titania solution (60 µL) and calcined in the same way as described in the section above. The samples
were loaded in the q-sense E4 and Milli-Q water was passed through the system, at the highest
speed of 0.606 mL/minute. The crystal was excited so that it began to oscillate when an AC voltage
was applied across the electrodes. A baseline was created with Milli-Q water for four minutes at the
speed 50 µL/minute. Then the antimicrobial substance was applied and the time was measured for
how long it took for the substance to enter the pores. The flow 50 µL/minute is much faster than the
flow in the body. The frequency was measured and as the instrument was running a thin film was
attached to the sensor which gave a decrease in the frequency. The energy dissipation indicates the
viscoelasticity of the film. Milli-Q water was applied again to measures the release time. Three
different Cloxacillin (Sigma-Aldrich) concentrations were run at separate times; 0.5 g/L, 0.5 mg/L and
2.25 mg/L and one RRP9W4N (Biopeptide Co., San Diego, USA) concentration; 200 µM. After finishing
the instrument was cleaned with Milli-Q water and SDS (2%) at the highest speed. The QCM-D discs
were cleaned in the following way:
1) Sonication in UV for 15 minutes.
2) Suspension in SDS (2%) for 15 minutes.
3) Rinsing in water.
4) Drying with N2.
3.4 Scanning electron microscope measurements
In a scanning electron microscope (SEM) a focused beam of high-energy electrons is applied to
produce a variety of signals at solid specimens’ surface. The accelerated electrons contain substantial
amounts of kinetic energy that is dissipated as these signals that are provided by the interactions
between the electrons and the sample. A few of the obtained signals are secondary electrons,
backscattered electrons, photons and visible light. The information obtained is for example external
morphology, chemical composition, crystalline structure and orientation of materials in the sample
[12]. The two sections below describe the sample preparations for measurements of the mesoporous
TiO2 surface and bacterial growth with/without antimicrobial substance.
9
3.4.1 Preparation for measurement of the mesoporous surface
Two titanium discs (Alfa Aesar) that had been stored in sterile filtered EtOH were rinsed with sterile
filtered Milli-Q water. They were further dried with N2. Since their size was similar to the size of the
QCM-D discs, they were spin coated with the same amount of mesoporous titania solution, 60 µL.
The discs were left to age for a day and a half, after which they were calcined in the same way as the
QCM-D discs. The discs were stored on the shelf, covered with aluminum foil, before they were
analyzed in the SEM. Before analysis the samples were mounted onto the sample holders with
double-coated adhesive carbon tape. The instrument used for SEM was a Zeiss Gemini.
3.4.2 Preparation for measurement of the surface with bacteria and antimicrobial
substance
The two titanium discs for the previous SEM measurements were reused (sterilized in the autoclave)
and a third surface was prepared in the same way. They were stored in sterile filtered EtOH and
before use they were rinsed with sterile filtered Milli-Q water. The samples were charged, each in a
separate sterile petri dish, with antimicrobial substance; one with 0.5 g/L Cloxacillin, one with 200
µM peptide and the last one is used as control and contains no antimicrobial substance. S.
epidermidis was then added to the surfaces, 10 mL for the samples with Cloxacillin and the one
without any antimicrobial substance, and 2 mL to the sample with peptide. The dishes were then
placed in the oven to grow the bacteria for 24h at 37°C. The next day the created biofilms were
fixated in the following way:
1) Remove the bacteria with a pipette.
2) Quickly add 5 mL EtOH (50 %) and wait three minutes.
3) Remove the EtOH (50 %), add 5 mL EtOH (80 %) and wait three minutes.
4) Remove the EtOH (80 %), add 5 mL EtOH (99.7 %) and wait three minutes.
5) Remove the EtOH (99.7 %) and let the samples dry in air until they are completely dry.
The samples were then sputtered with gold in a Jeol JFC-1100E Ion Sputter at 10 mA for 90 seconds.
They were then studied with the same SEM instrument as in the section above.
3.5 Preparation of cell media
Preparations of the different cell media needed to grow bacteria are presented in the sections below.
3.5.1 Preparation of Todd Hewitt broth
In a beaker, 36.4 g of Todd Hewitt broth (Oxoid CM0189) (TH) were added and a small amount of
Milli-Q water, approx. 200 mL was added. The solution was left to stir for a while until the powder
had dissolved. The rotation of the stirrer should be slow to avoid the formation of bubbles. Then the
10
rest of the water (800 mL) was added and it was left to stir for a few minutes. The broth was poured
into bottles and placed in the autoclave (Systec DX-65) for 15 minutes at 121°C. The bottles were
stored in room temperature.
3.5.2 Preparation of 0.85% NaCl
The solution was prepared in percentage by weight to the wanted volume of 50 mL:
0.85% NaCl (Merck): 0.00085*50*10-3 = 4.25*10-5 L
The density of NaCl is 2165 g/dm3
m = 2165*4.25*10-5 = 0.0920125 g
92 mg of NaCl was dissolved in Milli-Q water until the volume measured 50 mL. The solution was
autoclaved in smaller vials in volumes of 10 and 1.8 mL and stored in the fridge at -4°C.
3.6 Making agar plates
52 g of Brain Heart Infusion Agar (Fluka) was dissolved in 1 L of Milli-Q water. This was poured into a
bottle (together with the stirrer) and the bottle was placed in the autoclave at 121°C for 15 min.
When removed from the autoclave the bottle was placed on a stirring plate to keep the agar from
falling to the bottom. The agar was quickly transferred with a sterile pipette to petri dishes, 25 mL in
each. One pipette is used only for five dishes to keep it sterile. The bubbles were removed with a
crème brûlée burner after each ten dishes. This was done fast to avoid burning the agar or the dish.
The agar plates were left to cool with the lid open and covered with aluminum foil on the bench until
the next day, and then they were stored in the fridge.
3.7 Bacterial growth
Bacterial growths with the two different antimicrobial substances were performed in the ways
described in the following sections. Each growth has been done two times in order to get reliable
results.
3.7.1 Growth with Cloxacillin
S. epidermidis grown on an agar plate with horse blood was transferred to a clean agar plate using an
antiseptic technique. Some bacteria was also transferred to four vials containing 1 mL each of 10%
skim milk and these vials were stored in a freezer at -80°C. The agar plate was placed in an oven at
37°C over night and thereafter stored in the fridge. Bacteria from the agar plate was added to 8 small
vials containing 5 mL of TH and the vials were put in the oven at 37°C with their lids loosely attached,
to allow bacterial growth. The next day the vials were removed from the oven and the solution was
11
transferred from the vials to larger bottles containing TH; 5 mL of bacterial solution per 100 mL fresh
TH. The bottles were placed in the oven for another day with the lid loosely attached to allow the
bacteria to grow. On the next day, three glass slides were charged with 2 mL of Cloxacillin (0.5 g/L) in
the surface for 2.5 hours (see Section 4.1). In the meantime, bacteria were washed and harvested.
Bacteria were harvested by centrifugation at 2500 rpm for 15 min, and the pellets were resuspended
in fresh TH and washed (2500 rpm, 10 min). Bacteria were then transferred to a larger bottle giving a
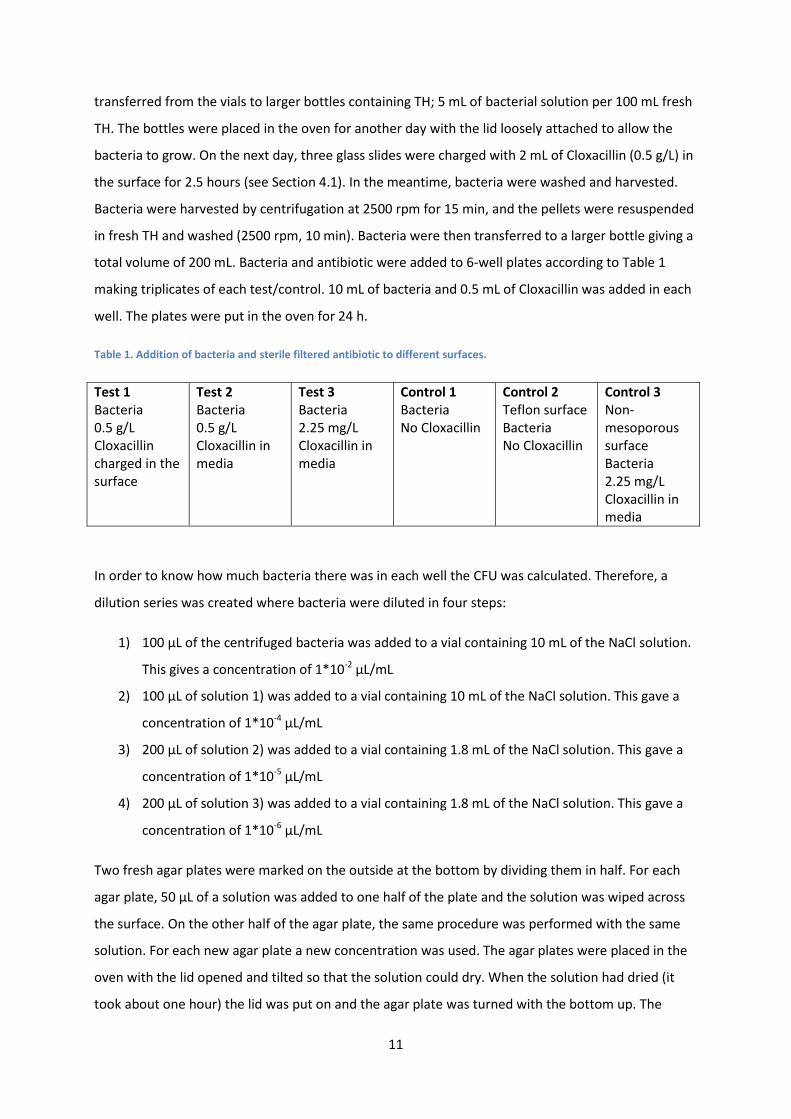
total volume of 200 mL. Bacteria and antibiotic were added to 6-well plates according to Table 1
making triplicates of each test/control. 10 mL of bacteria and 0.5 mL of Cloxacillin was added in each
well. The plates were put in the oven for 24 h.
Table 1. Addition of bacteria and sterile filtered antibiotic to different surfaces.
Test 1 Bacteria 0.5 g/L Cloxacillin charged in the surface
Test 2 Bacteria 0.5 g/L Cloxacillin in media
Test 3 Bacteria 2.25 mg/L Cloxacillin in media
Control 1 Bacteria No Cloxacillin
Control 2 Teflon surface Bacteria No Cloxacillin
Control 3 Non-mesoporous surface Bacteria 2.25 mg/L Cloxacillin in media
In order to know how much bacteria there was in each well the CFU was calculated. Therefore, a
dilution series was created where bacteria were diluted in four steps:
1) 100 µL of the centrifuged bacteria was added to a vial containing 10 mL of the NaCl solution.
This gives a concentration of 1*10-2 µL/mL
2) 100 µL of solution 1) was added to a vial containing 10 mL of the NaCl solution. This gave a
concentration of 1*10-4 µL/mL
3) 200 µL of solution 2) was added to a vial containing 1.8 mL of the NaCl solution. This gave a
concentration of 1*10-5 µL/mL
4) 200 µL of solution 3) was added to a vial containing 1.8 mL of the NaCl solution. This gave a
concentration of 1*10-6 µL/mL
Two fresh agar plates were marked on the outside at the bottom by dividing them in half. For each
agar plate, 50 µL of a solution was added to one half of the plate and the solution was wiped across
the surface. On the other half of the agar plate, the same procedure was performed with the same
solution. For each new agar plate a new concentration was used. The agar plates were placed in the
oven with the lid opened and tilted so that the solution could dry. When the solution had dried (it
took about one hour) the lid was put on and the agar plate was turned with the bottom up. The
12
plates were left in the oven over night. The next day the plates were taken out and the colonies that
had grown during the night were measured. For the solution with concentration 10-5 µL/mL the agar
plates were divided into quarters to be able to count each colony and then the value were multiplied
by 2.
The 6-well plates that were left for growth for 24 h were removed from the oven and the bacterial
solutions were removed with a pipette. The next day the wells were stained following the safranin
biofilm protocol:
1) The wells were emptied from bacterial solutions and rinsed 5 times with 10 mL of Milli-Q
water by filling the wells with fresh water, carefully rotating them and removing the liquid
from the wells with a pipette. The pipette was put on the side of the Titania slides so that the
biofilm was not destroyed.
2) The biofilm was fixated with 5 mL of absolute methanol (Fluka) for 20 min and after the
methanol was removed the slides were left to dry tilted against the wall of the well, approx.
one hour.
3) The surfaces were stained with 3 mL of 0.1% safranin (Alfa Aesar) (5mL for the Teflon
surfaces since they are so thick) for 15 min. A control was added, a clean well, which was
stained in the same way.
4) The stain was removed and the wells were washed 5 times with 10 mL of Milli-Q water in the
same way as in 2). The wells were left to dry for another hour with the slides tilted.
5) The samples were analyzed with a light microscope to see how the bacterial growth was
affected by the Cloxacillin.
3.7.2 Growth with RRP9W4N
The bacteria were handled in the same way as was done in the section above but the difference
being the preparation of the surfaces. Three glass slides were charged with 2 mL of RRP9W4N (200
µM) in the surface for 1 hour (see Section 4.1). The centrifugation was done in the same way and
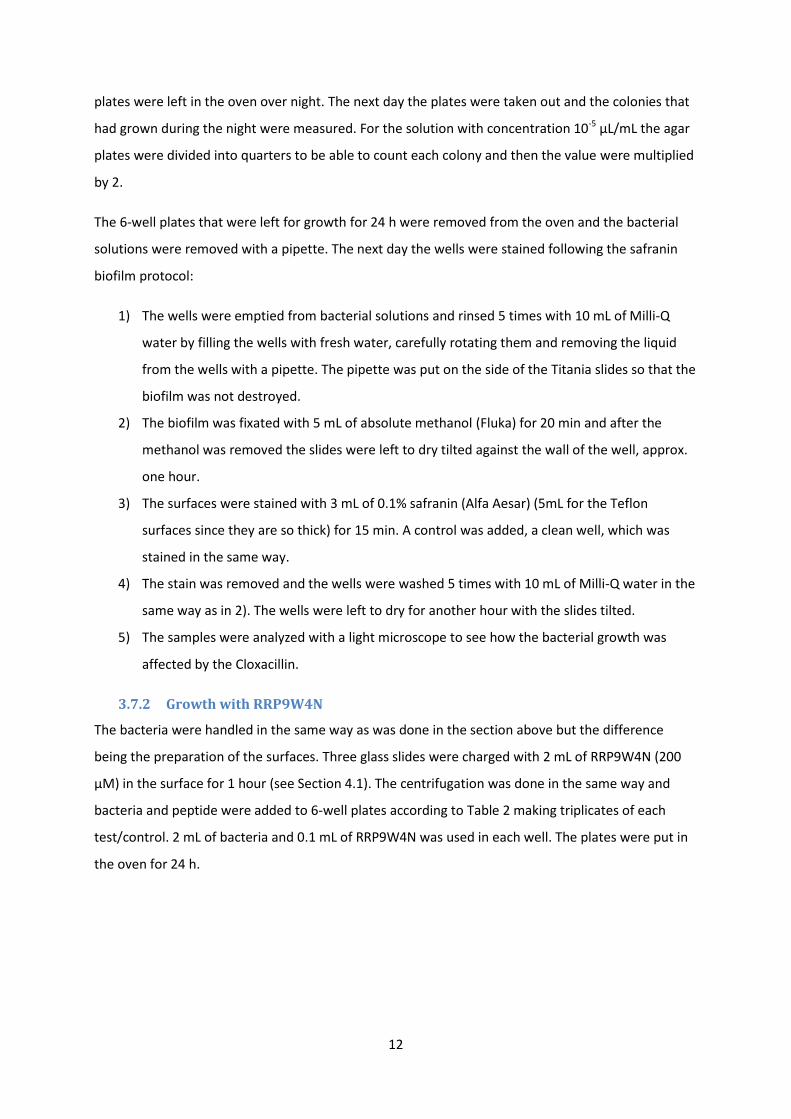
bacteria and peptide were added to 6-well plates according to Table 2 making triplicates of each
test/control. 2 mL of bacteria and 0.1 mL of RRP9W4N was used in each well. The plates were put in
the oven for 24 h.
13
Table 2. Addition of bacteria and peptide to different surfaces.
Test 1 Bacteria 200 µM RRP9W4N charged in the surface
Test 2 Bacteria 200 µM RRP9W4N in media
Test 3 Bacteria 120 µM RRP9W4N in media
Control 1 Bacteria No RRP9W4N
Control 2 Teflon surface Bacteria No RRP9W4N
Control 3 Non-mesoporous surface Bacteria 120 µM RRP9W4N in media
The dilution series and safranin biofilm protocol were performed as in the section above.
3.8 Ultraviolet-visible spectrophotometer measurements
In the ultraviolet-visible spectrophotometer (UV-Vis) there is a combined deuterium-discharge lamp
that works as a radiation source for the ultraviolet (UV) wavelengths and a tungsten lamp for the
visible (Vis) and short wave near-infrared (SWNIR) wavelengths. A special rear-access lamp design
makes it possible for both light sources to share the same axis to the source lens, creating a single
beam of light. This beam travels through the shutter/stray-light correction filter area to the
spectrograph lens and slit, passing through the sample. This gives information about all the
wavelengths at the same time and this is then displayed in a spectrum [13]. The lamp was turned on
approx. 30 minutes before the instrument HP Agilent 8453 was used. 2 mL of 95% EtOH was added
to each well containing stained slides including the control well. After 8 min the slides were removed
(the time it takes for the biofilm to dissolve). The program “Instrument Online” was started and the
prepared method was selected. The cuvettes were blown with N2 to remove any possible dirt. Each
cuvette was charged with 1.4 mL of each solution, respectively. Each sample was run once, then the
cuvette was turned upside down and run again (this should not make any difference in the spectrum,
should give the same values as the first run). The control well in the safranin biofilm protocol (Section
3.7.1) was used as the blank.
3.9 Electron spectroscopy for chemical analysis
Electron spectroscopy for chemical analysis (ESCA), or X-ray photoelectron spectroscopy (XPS), is an
instrument that measures the ejection of an electron from the core level by an X-ray photon with the
energy hν. An electron spectrometer is used to analyze the energy of the emitted photoelectrons and
this is presented in a graph with the electron energy as a function of the intensity (given in counts or
counts/s). The important parameters in ESCA are:
EB = hν – EK – W
14
where hν is the photon energy and W is the spectrometer work function. The quantity
experimentally measured is the kinetic energy (EK) which depends on the photon energy of the
applied X-rays. The binding energy (EB) is specific for electron, both due to the element and atomic
energy level. EB is calculated by the data system and the operator chooses an appropriate binding or
kinetic energy scale. The electronic structure of an element is reproduced accurately due to all
electrons with a binding energy less than the photon energy appearing in the spectrum. The
characteristic peaks in the spectrum come from the electrons that are excited and escape without
energy loss. The ones that have inelastic scattering and energy loss are included in the background of
the spectrum. The relaxation of the emitted photoelectron results in emission of an X-ray photon (X.-
ray fluorescence) [14]. Ten smaller pieces (between 5 and 8 mm from edge to edge) of glass slides
were cut out and spin coated with 15 µL of the mesoporous titania solution. They were left to age a
day and then calcined in the same way as the other glass slides. The pieces were then stored on the
shelf, covered with aluminum foil. Since three of the small glass slides should contain antibiotic when
analyzed in ESCA they were charged with 2 mL of the 0.5 g/L Cloxacillin for 2.5 hours. The liquid was
then removed and the pieces were stored on the shelf in a petri dish until the analysis. The ESCA
used was a Quantum 2000 scanning ESCA microprobe from Physical Electronics and the X-ray source
was Al Kα (1486.6 eV). The samples were mounted onto a metal plate where they were attached
with a smaller, thin metal plate and two screws per sample. The beam size was 100 µm and the
approx. analyzed area was 400*500 µm. The take-off angle was 45° with respect to the sample
surface and the information depth was approx. 4-5 nm.
3.10 Colony forming units
The number of microorganisms in or on the surface of a sample can be determined by measuring the
colony forming units (CFU). This is done by spreading the prepared sample uniformly on the surface
of an agar plate. The agar plate is then incubated for some days at an arbitrary temperature. The CFU
is established by counting the colonies and presenting it either as CFU per unit weight, CFU per unit
area or CFU per unit volume [15].
4. Results
The sections below present the results from characterization and analysis along with some statistics.
4.1 QCM-D graphs
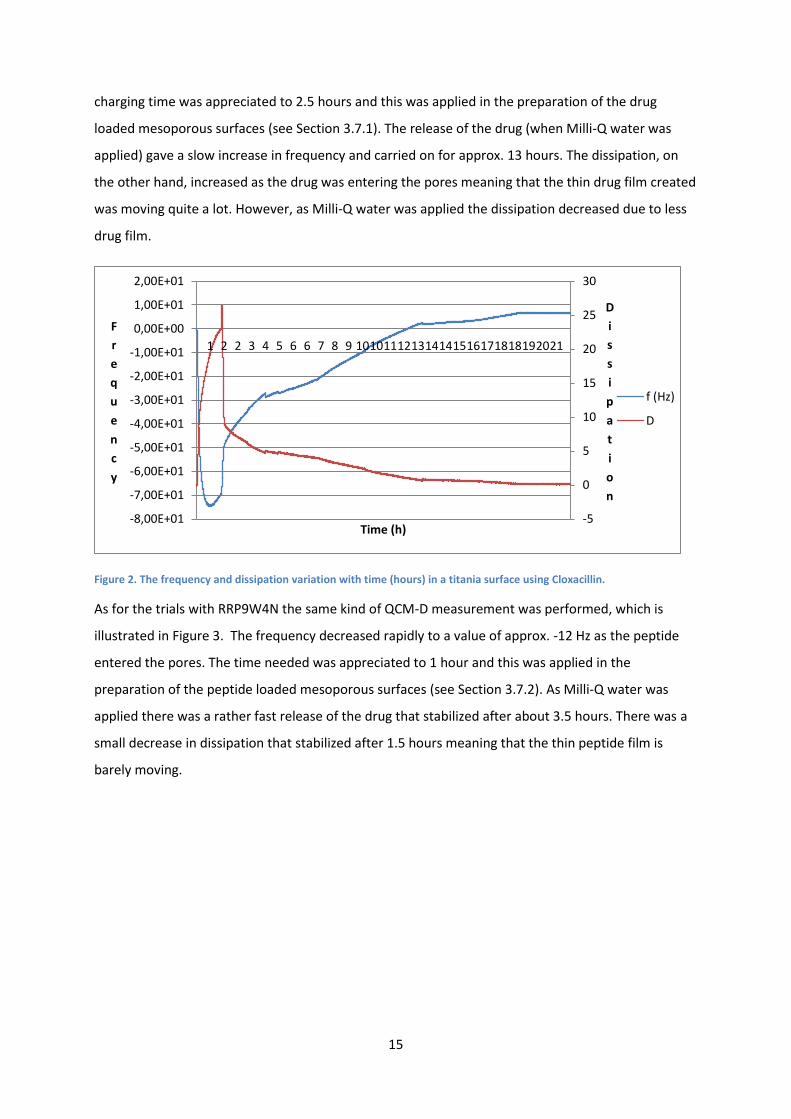
In order to know how much time is needed for Cloxacillin to enter the pores as well as the time for
the release of the drug a QCM-D measurement had to be performed. This is illustrated in Figure 2.
The frequency rapidly decreased to a value of about -74 Hz as the drug entered the pores. The
15
charging time was appreciated to 2.5 hours and this was applied in the preparation of the drug
loaded mesoporous surfaces (see Section 3.7.1). The release of the drug (when Milli-Q water was
applied) gave a slow increase in frequency and carried on for approx. 13 hours. The dissipation, on
the other hand, increased as the drug was entering the pores meaning that the thin drug film created
was moving quite a lot. However, as Milli-Q water was applied the dissipation decreased due to less
drug film.
Figure 2. The frequency and dissipation variation with time (hours) in a titania surface using Cloxacillin.
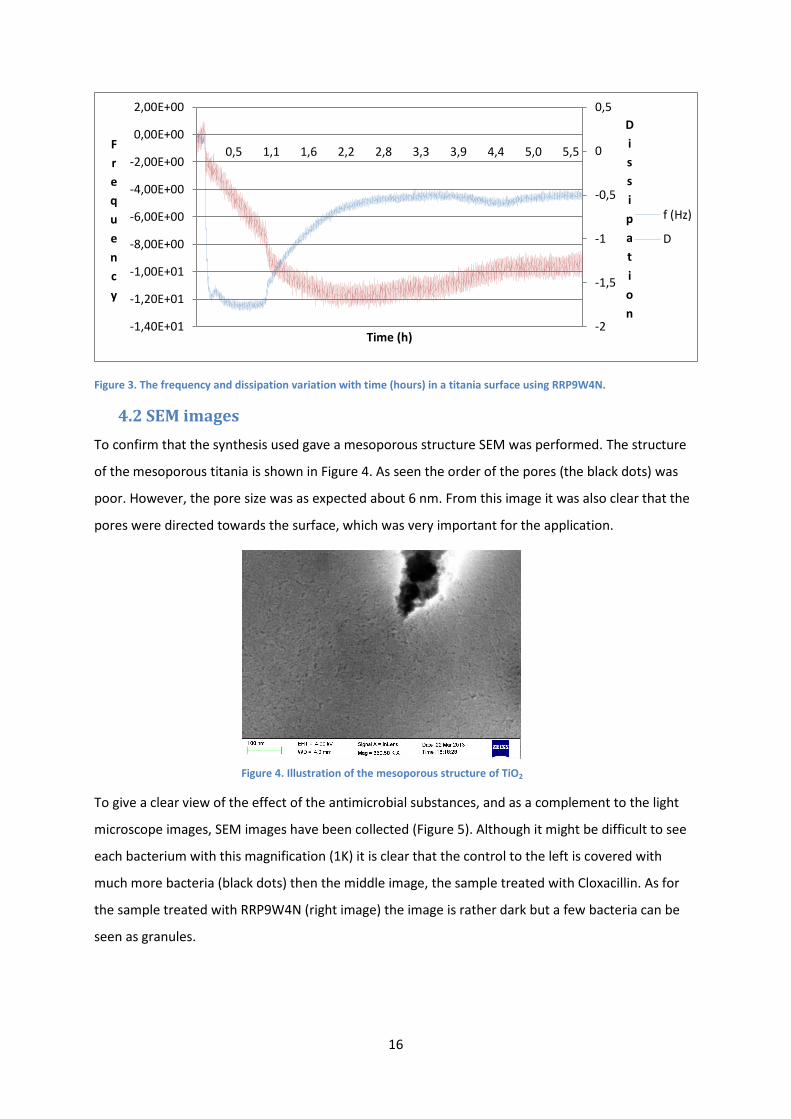
As for the trials with RRP9W4N the same kind of QCM-D measurement was performed, which is
illustrated in Figure 3. The frequency decreased rapidly to a value of approx. -12 Hz as the peptide
entered the pores. The time needed was appreciated to 1 hour and this was applied in the
preparation of the peptide loaded mesoporous surfaces (see Section 3.7.2). As Milli-Q water was
applied there was a rather fast release of the drug that stabilized after about 3.5 hours. There was a
small decrease in dissipation that stabilized after 1.5 hours meaning that the thin peptide film is
barely moving.
-5
0
5
10
15
20
25
30
-8,00E+01
-7,00E+01
-6,00E+01
-5,00E+01
-4,00E+01
-3,00E+01
-2,00E+01
-1,00E+01
0,00E+00
1,00E+01
2,00E+01
1 2 2 3 4 5 6 6 7 8 9 101011121314141516171818192021
D
i
s
s
i
p
a
t
i
o
n
F
r
e
q
u
e
n
c
y
Time (h)
f (Hz)
D
16
Figure 3. The frequency and dissipation variation with time (hours) in a titania surface using RRP9W4N.
4.2 SEM images
To confirm that the synthesis used gave a mesoporous structure SEM was performed. The structure
of the mesoporous titania is shown in Figure 4. As seen the order of the pores (the black dots) was
poor. However, the pore size was as expected about 6 nm. From this image it was also clear that the
pores were directed towards the surface, which was very important for the application.
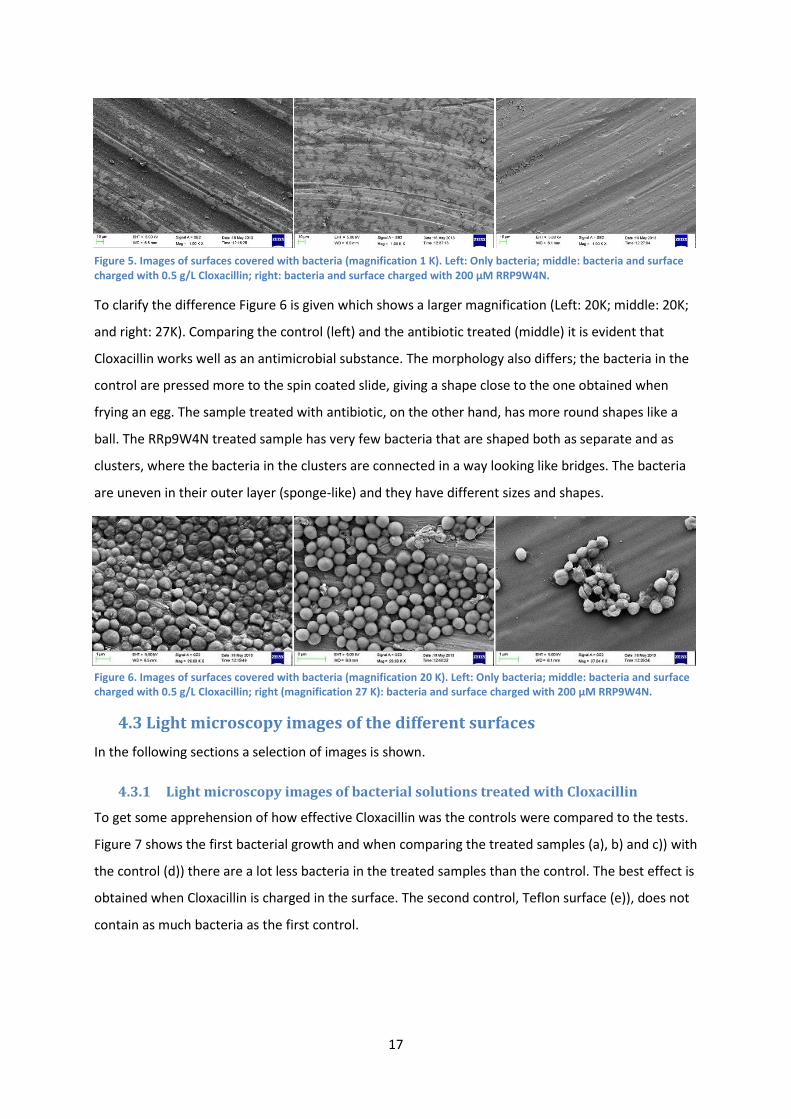
To give a clear view of the effect of the antimicrobial substances, and as a complement to the light
microscope images, SEM images have been collected (Figure 5). Although it might be difficult to see
each bacterium with this magnification (1K) it is clear that the control to the left is covered with
much more bacteria (black dots) then the middle image, the sample treated with Cloxacillin. As for
the sample treated with RRP9W4N (right image) the image is rather dark but a few bacteria can be
seen as granules.
-2
-1,5
-1
-0,5
0
0,5
-1,40E+01
-1,20E+01
-1,00E+01
-8,00E+00
-6,00E+00
-4,00E+00
-2,00E+00
0,00E+00
2,00E+00
0,5 1,1 1,6 2,2 2,8 3,3 3,9 4,4 5,0 5,5
D
i
s
s
i
p
a
t
i
o
n
F
r
e
q
u
e
n
c
y
Time (h)
f (Hz)
D
Figure 4. Illustration of the mesoporous structure of TiO2
17
Figure 5. Images of surfaces covered with bacteria (magnification 1 K). Left: Only bacteria; middle: bacteria and surface charged with 0.5 g/L Cloxacillin; right: bacteria and surface charged with 200 µM RRP9W4N.
To clarify the difference Figure 6 is given which shows a larger magnification (Left: 20K; middle: 20K;
and right: 27K). Comparing the control (left) and the antibiotic treated (middle) it is evident that
Cloxacillin works well as an antimicrobial substance. The morphology also differs; the bacteria in the
control are pressed more to the spin coated slide, giving a shape close to the one obtained when
frying an egg. The sample treated with antibiotic, on the other hand, has more round shapes like a
ball. The RRp9W4N treated sample has very few bacteria that are shaped both as separate and as
clusters, where the bacteria in the clusters are connected in a way looking like bridges. The bacteria
are uneven in their outer layer (sponge-like) and they have different sizes and shapes.
Figure 6. Images of surfaces covered with bacteria (magnification 20 K). Left: Only bacteria; middle: bacteria and surface charged with 0.5 g/L Cloxacillin; right (magnification 27 K): bacteria and surface charged with 200 µM RRP9W4N.
4.3 Light microscopy images of the different surfaces
In the following sections a selection of images is shown.
4.3.1 Light microscopy images of bacterial solutions treated with Cloxacillin
To get some apprehension of how effective Cloxacillin was the controls were compared to the tests.
Figure 7 shows the first bacterial growth and when comparing the treated samples (a), b) and c)) with
the control (d)) there are a lot less bacteria in the treated samples than the control. The best effect is
obtained when Cloxacillin is charged in the surface. The second control, Teflon surface (e)), does not
contain as much bacteria as the first control.
18
Figure 7. The first bacterial growth trial with antibiotic using a magnification of x50: a) bacteria and 0.5 g/L Cloxacillin charged in the surface, b) bacteria and 0.5 g/L Cloxacillin in media, c) bacteria and 2.25 mg/L Cloxacillin in media, d) bacteria and e) Teflon surface and bacteria.
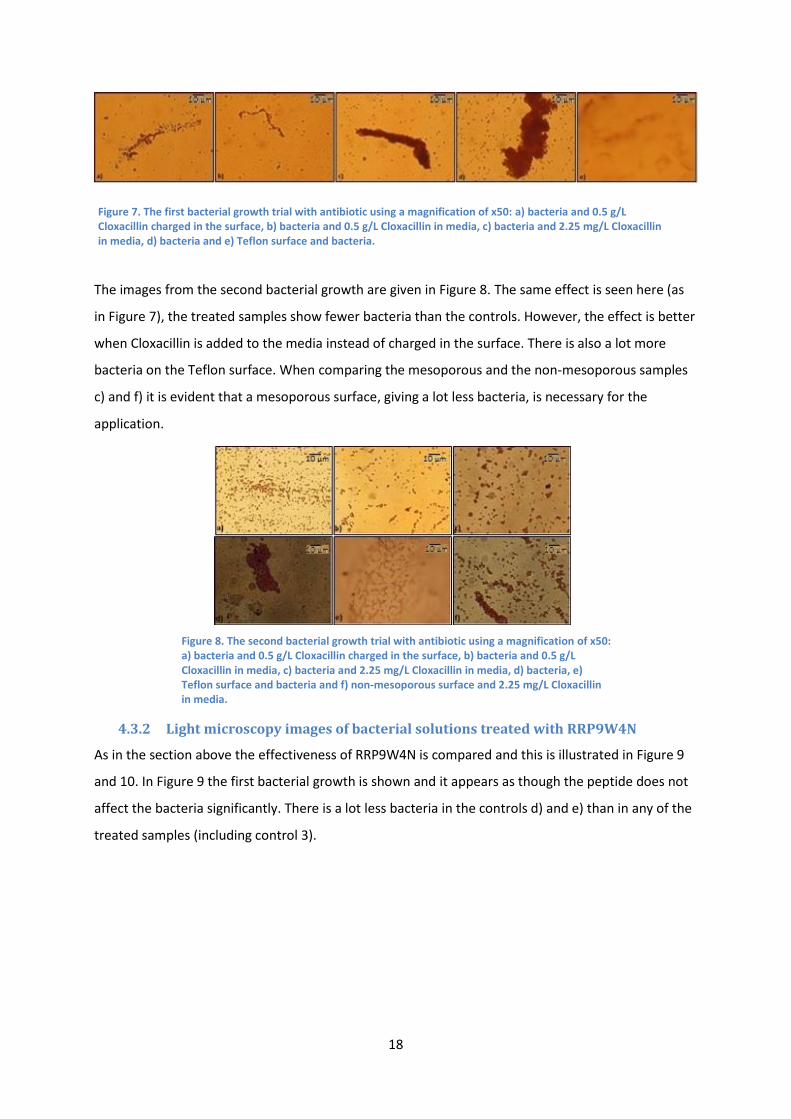
The images from the second bacterial growth are given in Figure 8. The same effect is seen here (as
in Figure 7), the treated samples show fewer bacteria than the controls. However, the effect is better
when Cloxacillin is added to the media instead of charged in the surface. There is also a lot more
bacteria on the Teflon surface. When comparing the mesoporous and the non-mesoporous samples
c) and f) it is evident that a mesoporous surface, giving a lot less bacteria, is necessary for the
application.
4.3.2 Light microscopy images of bacterial solutions treated with RRP9W4N
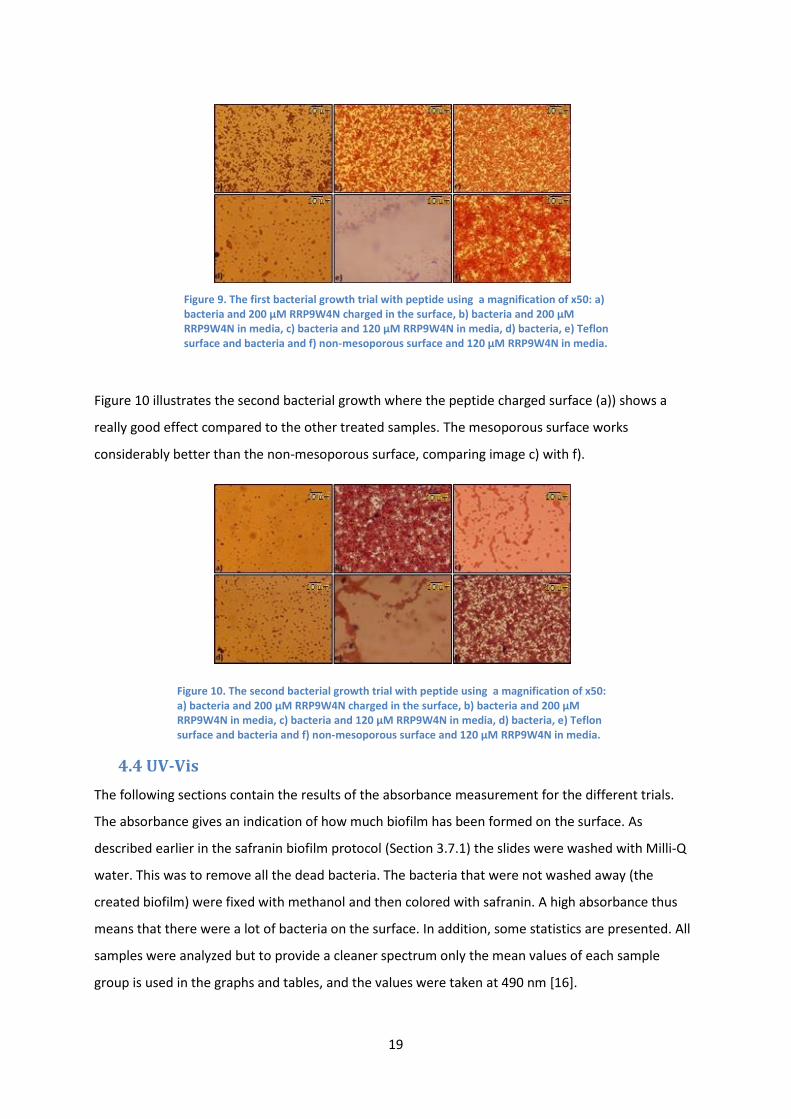
As in the section above the effectiveness of RRP9W4N is compared and this is illustrated in Figure 9
and 10. In Figure 9 the first bacterial growth is shown and it appears as though the peptide does not
affect the bacteria significantly. There is a lot less bacteria in the controls d) and e) than in any of the
treated samples (including control 3).
Figure 8. The second bacterial growth trial with antibiotic using a magnification of x50: a) bacteria and 0.5 g/L Cloxacillin charged in the surface, b) bacteria and 0.5 g/L Cloxacillin in media, c) bacteria and 2.25 mg/L Cloxacillin in media, d) bacteria, e) Teflon surface and bacteria and f) non-mesoporous surface and 2.25 mg/L Cloxacillin in media.
19
Figure 10 illustrates the second bacterial growth where the peptide charged surface (a)) shows a
really good effect compared to the other treated samples. The mesoporous surface works
considerably better than the non-mesoporous surface, comparing image c) with f).
4.4 UV-Vis
The following sections contain the results of the absorbance measurement for the different trials.
The absorbance gives an indication of how much biofilm has been formed on the surface. As
described earlier in the safranin biofilm protocol (Section 3.7.1) the slides were washed with Milli-Q
water. This was to remove all the dead bacteria. The bacteria that were not washed away (the
created biofilm) were fixed with methanol and then colored with safranin. A high absorbance thus
means that there were a lot of bacteria on the surface. In addition, some statistics are presented. All
samples were analyzed but to provide a cleaner spectrum only the mean values of each sample
group is used in the graphs and tables, and the values were taken at 490 nm [16].
Figure 9. The first bacterial growth trial with peptide using a magnification of x50: a) bacteria and 200 µM RRP9W4N charged in the surface, b) bacteria and 200 µM RRP9W4N in media, c) bacteria and 120 µM RRP9W4N in media, d) bacteria, e) Teflon surface and bacteria and f) non-mesoporous surface and 120 µM RRP9W4N in media.
Figure 10. The second bacterial growth trial with peptide using a magnification of x50: a) bacteria and 200 µM RRP9W4N charged in the surface, b) bacteria and 200 µM RRP9W4N in media, c) bacteria and 120 µM RRP9W4N in media, d) bacteria, e) Teflon surface and bacteria and f) non-mesoporous surface and 120 µM RRP9W4N in media.
20
-2
-1,5
-1
-0,5
0
0,5
1
19
02
09
22
82
47
26
62
85
30
43
23
34
23
61
38
03
99
41
84
37
45
64
75
49
45
13
53
25
51
57
05
89
60
86
27
64
66
65
68
47
03
72
27
41
76
07
79
79
8
Control 1Control 2Test 1Test 2Test 3
4.4.1 Measurements from bacterial growth with Cloxacillin
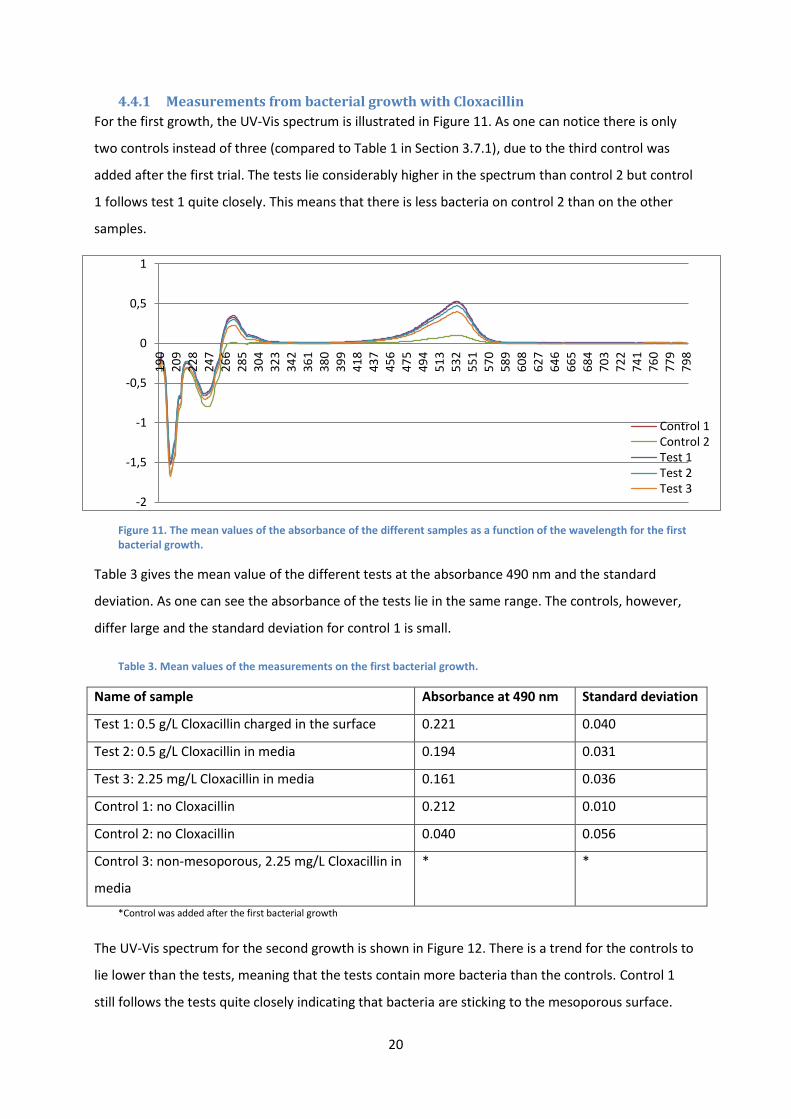
For the first growth, the UV-Vis spectrum is illustrated in Figure 11. As one can notice there is only
two controls instead of three (compared to Table 1 in Section 3.7.1), due to the third control was
added after the first trial. The tests lie considerably higher in the spectrum than control 2 but control
1 follows test 1 quite closely. This means that there is less bacteria on control 2 than on the other
samples.
Figure 11. The mean values of the absorbance of the different samples as a function of the wavelength for the first bacterial growth.
Table 3 gives the mean value of the different tests at the absorbance 490 nm and the standard
deviation. As one can see the absorbance of the tests lie in the same range. The controls, however,
differ large and the standard deviation for control 1 is small.
Table 3. Mean values of the measurements on the first bacterial growth.
Name of sample Absorbance at 490 nm Standard deviation
Test 1: 0.5 g/L Cloxacillin charged in the surface 0.221 0.040
Test 2: 0.5 g/L Cloxacillin in media 0.194 0.031
Test 3: 2.25 mg/L Cloxacillin in media 0.161 0.036
Control 1: no Cloxacillin 0.212 0.010
Control 2: no Cloxacillin 0.040 0.056
Control 3: non-mesoporous, 2.25 mg/L Cloxacillin in
media
* *
*Control was added after the first bacterial growth
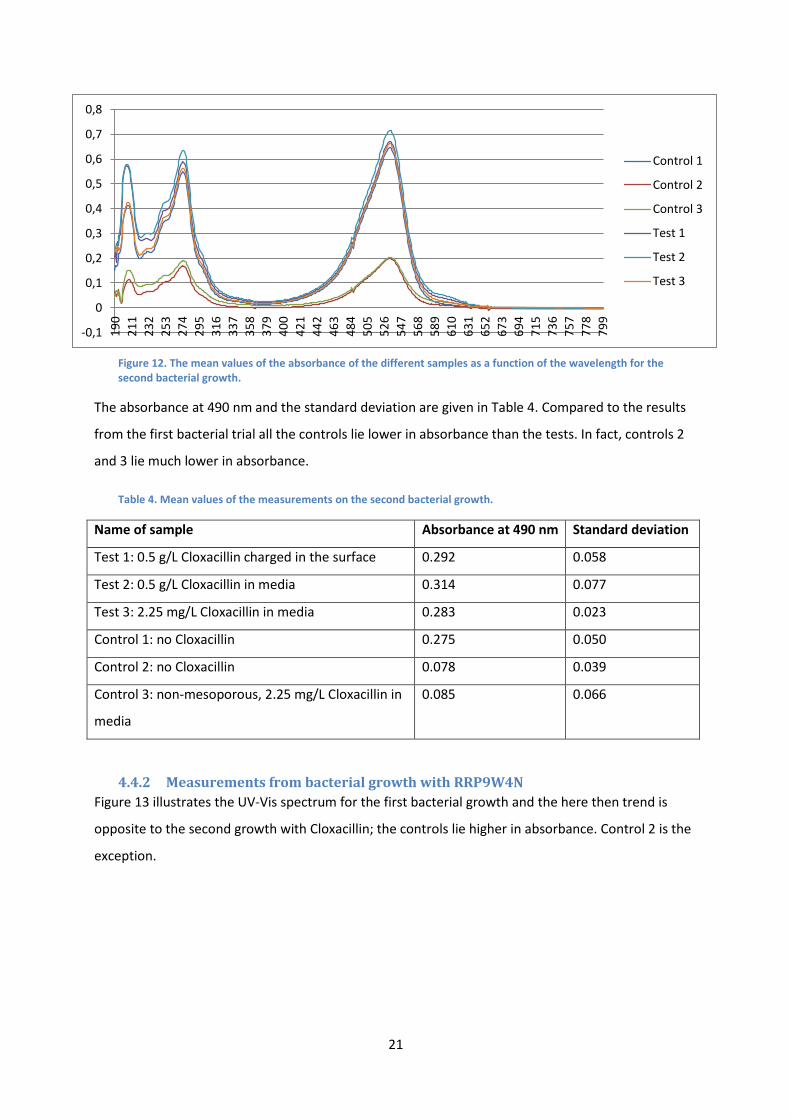
The UV-Vis spectrum for the second growth is shown in Figure 12. There is a trend for the controls to
lie lower than the tests, meaning that the tests contain more bacteria than the controls. Control 1
still follows the tests quite closely indicating that bacteria are sticking to the mesoporous surface.
21
-0,1
0
0,1
0,2
0,3
0,4
0,5
0,6
0,7
0,81
90
21
1
23
2
25
3
27
4
29
5
31
6
33
7
35
8
37
9
40
0
42
1
44
2
46
3
48
4
50
5
52
6
54
7
56
8
58
9
61
0
63
1
65
2
67
3
69
4
71
5
73
6
75
7
77
8
79
9
Control 1
Control 2
Control 3
Test 1
Test 2
Test 3
Figure 12. The mean values of the absorbance of the different samples as a function of the wavelength for the second bacterial growth.
The absorbance at 490 nm and the standard deviation are given in Table 4. Compared to the results
from the first bacterial trial all the controls lie lower in absorbance than the tests. In fact, controls 2
and 3 lie much lower in absorbance.
Table 4. Mean values of the measurements on the second bacterial growth.
Name of sample Absorbance at 490 nm Standard deviation
Test 1: 0.5 g/L Cloxacillin charged in the surface 0.292 0.058
Test 2: 0.5 g/L Cloxacillin in media 0.314 0.077
Test 3: 2.25 mg/L Cloxacillin in media 0.283 0.023
Control 1: no Cloxacillin 0.275 0.050
Control 2: no Cloxacillin 0.078 0.039
Control 3: non-mesoporous, 2.25 mg/L Cloxacillin in
media
0.085 0.066
4.4.2 Measurements from bacterial growth with RRP9W4N
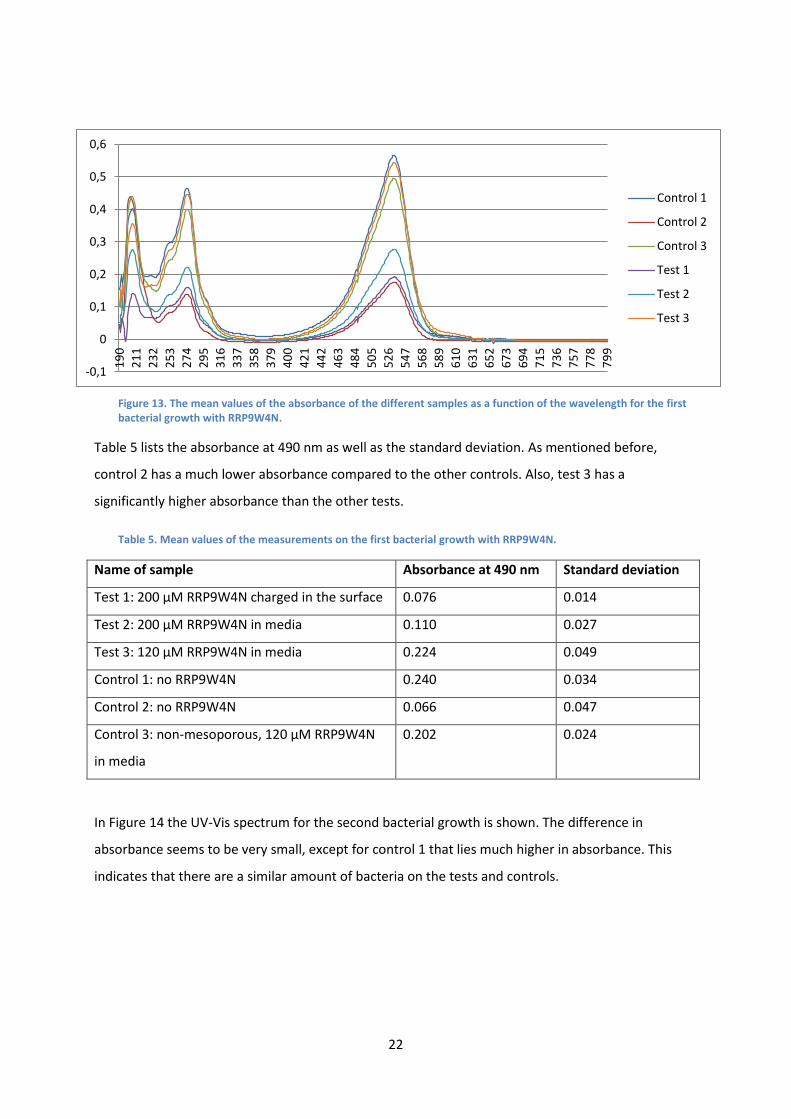
Figure 13 illustrates the UV-Vis spectrum for the first bacterial growth and the here then trend is
opposite to the second growth with Cloxacillin; the controls lie higher in absorbance. Control 2 is the
exception.
22
-0,1
0
0,1
0,2
0,3
0,4
0,5
0,6
19
0
21
1
23
2
25
3
27
4
29
5
31
6
33
7
35
8
37
9
40
0
42
1
44
2
46
3
48
4
50
5
52
6
54
7
56
8
58
9
61
0
63
1
65
2
67
3
69
4
71
5
73
6
75
7
77
8
79
9
Control 1
Control 2
Control 3
Test 1
Test 2
Test 3
Figure 13. The mean values of the absorbance of the different samples as a function of the wavelength for the first bacterial growth with RRP9W4N.
Table 5 lists the absorbance at 490 nm as well as the standard deviation. As mentioned before,
control 2 has a much lower absorbance compared to the other controls. Also, test 3 has a
significantly higher absorbance than the other tests.
Table 5. Mean values of the measurements on the first bacterial growth with RRP9W4N.
Name of sample Absorbance at 490 nm Standard deviation
Test 1: 200 µM RRP9W4N charged in the surface 0.076 0.014
Test 2: 200 µM RRP9W4N in media 0.110 0.027
Test 3: 120 µM RRP9W4N in media 0.224 0.049
Control 1: no RRP9W4N 0.240 0.034
Control 2: no RRP9W4N 0.066 0.047
Control 3: non-mesoporous, 120 µM RRP9W4N
in media
0.202 0.024
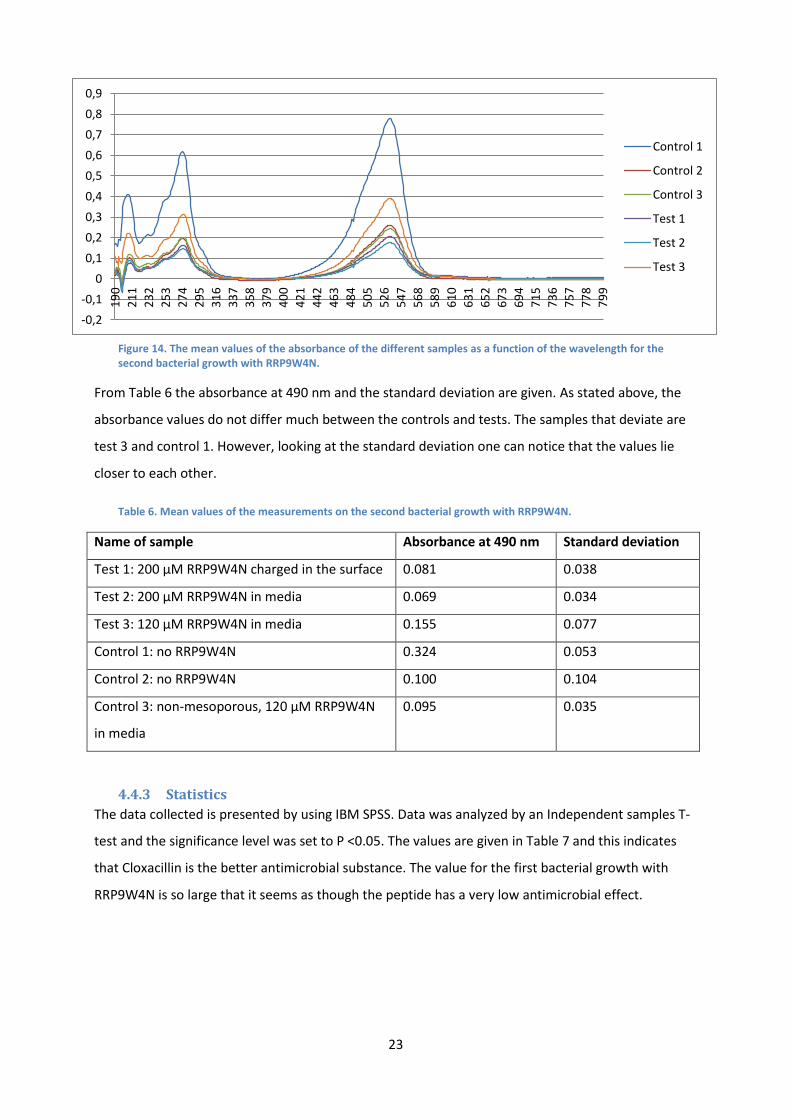
In Figure 14 the UV-Vis spectrum for the second bacterial growth is shown. The difference in
absorbance seems to be very small, except for control 1 that lies much higher in absorbance. This
indicates that there are a similar amount of bacteria on the tests and controls.
23
-0,2
-0,1
0
0,1
0,2
0,3
0,4
0,5
0,6
0,7
0,8
0,9
19
0
21
1
23
2
25
3
27
4
29
5
31
6
33
7
35
8
37
9
40
0
42
1
44
2
46
3
48
4
50
5
52
6
54
7
56
8
58
9
61
0
63
1
65
2
67
3
69
4
71
5
73
6
75
7
77
8
79
9
Control 1
Control 2
Control 3
Test 1
Test 2
Test 3
Figure 14. The mean values of the absorbance of the different samples as a function of the wavelength for the second bacterial growth with RRP9W4N.
From Table 6 the absorbance at 490 nm and the standard deviation are given. As stated above, the
absorbance values do not differ much between the controls and tests. The samples that deviate are
test 3 and control 1. However, looking at the standard deviation one can notice that the values lie
closer to each other.
Table 6. Mean values of the measurements on the second bacterial growth with RRP9W4N.
Name of sample Absorbance at 490 nm Standard deviation
Test 1: 200 µM RRP9W4N charged in the surface 0.081 0.038
Test 2: 200 µM RRP9W4N in media 0.069 0.034
Test 3: 120 µM RRP9W4N in media 0.155 0.077
Control 1: no RRP9W4N 0.324 0.053
Control 2: no RRP9W4N 0.100 0.104
Control 3: non-mesoporous, 120 µM RRP9W4N
in media
0.095 0.035
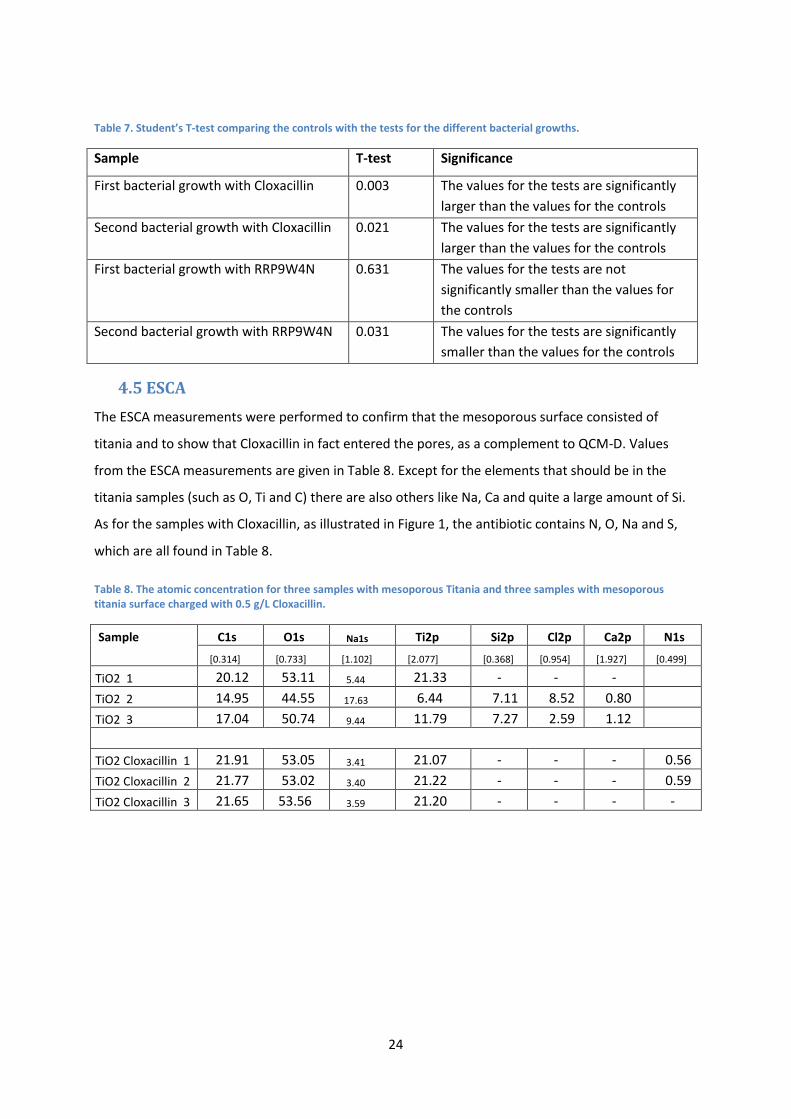
4.4.3 Statistics
The data collected is presented by using IBM SPSS. Data was analyzed by an Independent samples T-
test and the significance level was set to P <0.05. The values are given in Table 7 and this indicates
that Cloxacillin is the better antimicrobial substance. The value for the first bacterial growth with
RRP9W4N is so large that it seems as though the peptide has a very low antimicrobial effect.
24
Table 7. Student’s T-test comparing the controls with the tests for the different bacterial growths.
Sample T-test Significance
First bacterial growth with Cloxacillin 0.003 The values for the tests are significantly
larger than the values for the controls
Second bacterial growth with Cloxacillin 0.021 The values for the tests are significantly
larger than the values for the controls
First bacterial growth with RRP9W4N 0.631 The values for the tests are not
significantly smaller than the values for
the controls
Second bacterial growth with RRP9W4N 0.031 The values for the tests are significantly
smaller than the values for the controls
4.5 ESCA
The ESCA measurements were performed to confirm that the mesoporous surface consisted of
titania and to show that Cloxacillin in fact entered the pores, as a complement to QCM-D. Values
from the ESCA measurements are given in Table 8. Except for the elements that should be in the
titania samples (such as O, Ti and C) there are also others like Na, Ca and quite a large amount of Si.
As for the samples with Cloxacillin, as illustrated in Figure 1, the antibiotic contains N, O, Na and S,
which are all found in Table 8.
Table 8. The atomic concentration for three samples with mesoporous Titania and three samples with mesoporous titania surface charged with 0.5 g/L Cloxacillin.
Sample C1s O1s Na1s Ti2p Si2p Cl2p Ca2p N1s
[0.314] [0.733] [1.102] [2.077] [0.368] [0.954] [1.927] [0.499]
TiO2 1 20.12 53.11 5.44 21.33 - - -
TiO2 2 14.95 44.55 17.63 6.44 7.11 8.52 0.80
TiO2 3 17.04 50.74 9.44 11.79 7.27 2.59 1.12
TiO2 Cloxacillin 1 21.91 53.05 3.41 21.07 - - - 0.56
TiO2 Cloxacillin 2 21.77 53.02 3.40 21.22 - - - 0.59
TiO2 Cloxacillin 3 21.65 53.56 3.59 21.20 - - - -
25
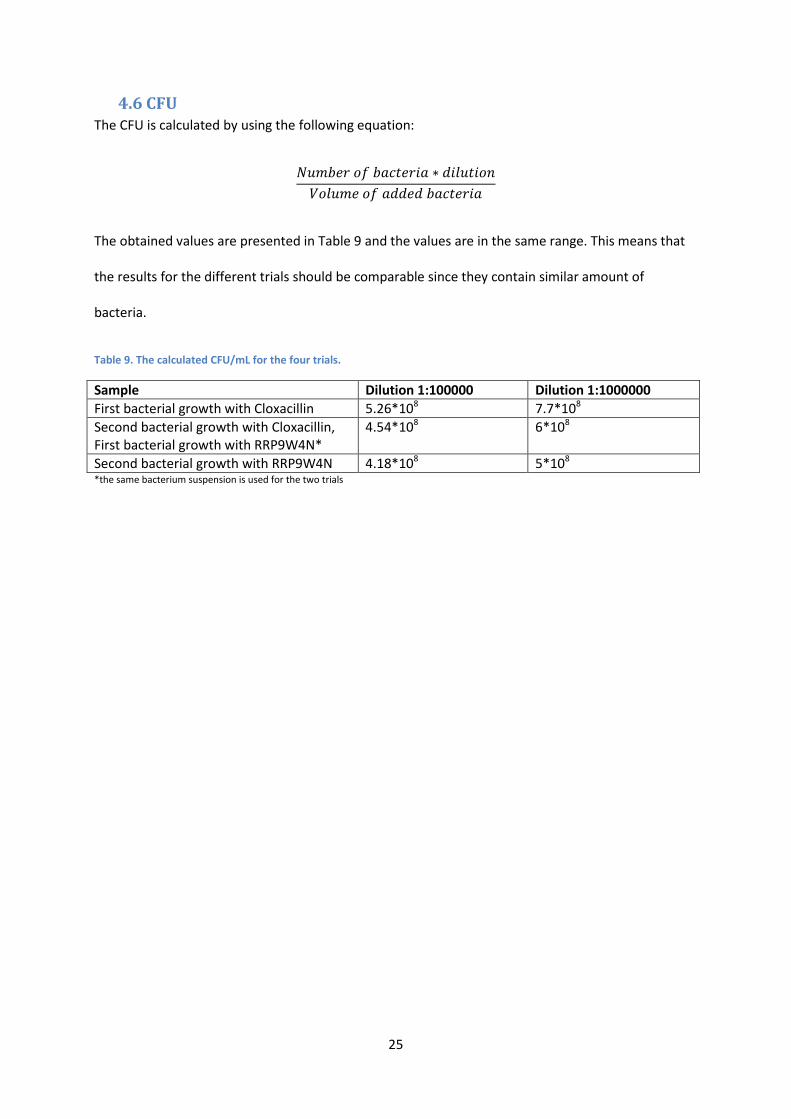
4.6 CFU The CFU is calculated by using the following equation:
The obtained values are presented in Table 9 and the values are in the same range. This means that
the results for the different trials should be comparable since they contain similar amount of
bacteria.
Table 9. The calculated CFU/mL for the four trials.
Sample Dilution 1:100000 Dilution 1:1000000
First bacterial growth with Cloxacillin 5.26*108 7.7*108
Second bacterial growth with Cloxacillin, First bacterial growth with RRP9W4N*
4.54*108 6*108
Second bacterial growth with RRP9W4N 4.18*108 5*108 *the same bacterium suspension is used for the two trials
26
5. Discussion
As the QCM-D measurement on Cloxacillin indicates, since there is a rapid decrease in frequency, the
antibiotic enters the pores of the MpTiO2. The increase in dissipation is due to the movement of the
created antibiotic film. The slow increase in frequency is good for the application because it means
that the dose will last for a longer time, having a larger impact on the biofilm. The plateau in
frequency after approx. two hours may be due to the fact that Cloxacillin has a tendency to stick to
the walls and as the Milli-Q water is applied the first antibiotic molecules to be washed away are the
ones in the center of the pores and after a while the rest will wash away too. In comparison, the
peptide charged surface shows a frequency decrease which is rather small and the release rate is
quite fast. However, the dissipation is very small which means that RRP9W4N creates a stable film.
The ESCA values confirm that the antibiotic enters the pores of the MpTiO2, which is given by looking
at how much of the elements in Cloxacillin are actually detected at the surface. The values for Na are
even higher for the TiO2 samples than the samples charged with the antibiotic. Why other elements
like Si, Cl and Ca are detected in the TiO2 might be due to the fact that the samples were stored in a
glove on an open shelf. The exposure to air may have introduced new elements to the surface.
The SEM image of the mesoporous titania shows, as mentioned before, that the pore size is around 6
nm. Though the order is poor it does not affect the application since the most important features of
the mesoporous surface are the pore size and how the pores are directed. The image clearly
illustrates that the pores are directed towards the surface which makes it possible for Cloxacillin to
enter as it is added on top of the surface. When comparing the SEM images for the three different
surfaces (magnification 1K) it is clear that RRP9W4N has a much better effect as an antimicrobial
substance. There is much less bacteria on the surface treated with peptide than any of the two other
surfaces. Cloxacillin also shows a good antimicrobial effect (more easily viewed due to brighter
images) but the difference compared to RRP9W4N is so large that the most determining issue is the
cost. The peptide is much more expensive than the antibiotic meaning that every peptide trial needs
to be handled with much more care to avoid contamination and errors in characterization
measurements.
For the SEM images at the magnification 20K the differences in morphology between the three
separate treatments are clearly shown. As mentioned in Section 4.2 the bacteria in the untreated
sample have spread out into a shape that resembles a frying egg. They stay close to the mesoporous
surface and their round shape is uneven. There are a lot of them and they are stacked closely. The
Cloxacillin treated surface, on the other hand, displays bacteria with a rounder shape, larger spaces
between the bacteria and a tendency not to spread out on the surface. The surface treated with
27
RRP9W4N shows a very small amount of bacteria with varying shape and roundness. There seems to
be some kind of bonding between the bacteria that is not seen in the other images. There is a larger
separation between the bacteria colonies.
From the UV-Vis spectrum (and table) given for the first trial with the antibiotic it appears as though
control 1 and the tests lie in the same range of absorbance, control 2 is much lower. For the second
trial, however, there is a trend for the controls to lie lower in absorbance than the tests. This means
that there are more bacteria in the tests (more safranin due to more biofilm on the surface).
Comparing these results with the spectra and tables for the trials with the peptide it seems as though
the peptide is a much better antimicrobial substance. The controls lie higher in absorbance than the
tests (with the exceptions control 2 and test 3) for the first trial. The results from the second trial
show the same trend but the exception is test 3. The light microscopy images indicate that Cloxacillin
is the better antimicrobial substance. In the images from the first trial with Cloxacillin there is much
less bacteria in the control. This is also the case for the second trial and these images also illustrate
how the mesoporous surface has a better effect than the non-mesoporous surface. The images from
the first trial with RRP9W4N show that there is less bacteria in the controls then in the treated
surfaces and that the mesoporous surface has a better effect than the non-mesoporous surface. It is
though uncertain if all the bacteria displayed in the light microscopy images are living or if there is
some dead bacteria still left in the biofilm after washing. A LIVE/DEAD staining would be necessary to
confirm this. The second growth with peptide shows the opposite of the first, less bacteria in the
treated samples than in the control (with the exception of addition of 200 µM peptide in media). The
impact of mesoporous versus non-mesoporous surface is though the same.
During the experiment it was also tested if the antimicrobial effect would be better when growing
the biofilms for two days instead of one. However, due to contamination of all these trials the
original one day growth had to be used. The cause of the contamination is still unclear since other
factors, such as addition of an air inlet into the oven, were included in the change.
28
6. Conclusion
It is still unclear whether Cloxacillin or RRP9W4N is the better antimicrobial substance and more
analysis needs to be done. However, the obtained results show that they both affect S. epidermidis in
the way wanted. Both substances show good results in the application of the mesoporous titania as a
drug delivery system for them and their release rates are promising.
7. Future work
It would be interesting to see how the bacteria are affected when growing with antimicrobial
substance for two days instead of just one. Since each antimicrobial substance is studied only twice,
more trials are needed to be able to show a clear effect although this research gives an indication. It
would also be good to do a LIVE/DEAD study on the different surface to clearly show the difference
between the antimicrobial substances and the control. Further, when making the decision about
which antimicrobial substance to use the possibility of S. epidermidis becoming resistant needs to be
considered. Finally, when a clear method is obtained it should be tested in animals, such as rats.
8. Acknowledgements
I would like to thank my examiner Associate Professor Martin Andersson for all his help and devotion
to the project. I would also like to thank my supervisor Maria Pihl for her help and knowledge when
teaching me to handle the bacteria. My family, boyfriend and friends deserve special thanks for their
understanding and support during these very interesting but busy months. Finally, I would like to
thank the people at Applied Chemistry, especially Anne Bee Hegge.
29
9. References
1. Co., S.-A. Cloxacillin sodium salt monohydrate 2013 [cited 2013 May 23]; Available from: http://www.sigmaaldrich.com/catalog/product/sigma/c9393?lang=en®ion=SE.
2. (NIH), N.I.o.H. Immunology of Biofilms (R01). 2007 January 9, 2007 [cited 2013 May 23]; Available from: http://grants1.nih.gov/grants/guide/pa-files/PA-07-288.html.
3. Høiby, N., et al., Antibiotic resistance of bacterial biofilms. International journal of antimicrobial agents, 2010. 35(4): p. 322-332.
4. Tang, H., et al., Preparation and in vitro characterization of crack-free mesoporous titania films. Surface & Coatings Technology, 2011. 206(1): p. 8-15.
5. Karlsson, J., et al., In vivo biomechanical stability of osseointegrating mesoporous TiO(2) implants. Acta biomaterialia, 2012. 8(12): p. 4438.
6. Harmankaya, N., et al., Raloxifene and alendronate containing thin mesoporous titanium oxide films improve implant fixation to bone. Acta biomaterialia, 2013. 9(6): p. 7064.
7. Vuong, C. and M. Otto, Staphylococcus epidermidis infections. Microbes and Infection, 2002. 4(4): p. 481-489.
8. Elmolla, E.S. and M. Chaudhuri, Degradation of amoxicillin, ampicillin and cloxacillin antibiotics in aqueous solution by the UV/ZnO photocatalytic process. Journal of hazardous materials, 2010. 173(1-3): p. 445-449.
9. Bru, J.P. and R. Garraffo, Role of intravenous cloxacillin for inpatient infections. Médecine et maladies infectieuses, 2012. 42(6): p. 241.
10. Malmsten, M., et al., Highly selective end-tagged antimicrobial peptides derived from PRELP. PloS one, 2011. 6(1): p. e16400.
11. Q-Sense, B. QCM-D Technology. [cited 2013 May 23]; Available from: http://www.q-sense.com/qcm-d-technology.
12. Susan Swapp, U.o.W. Scanning Electron Microscopy (SEM). July 23, 2012 [cited 2013 May 27]; Available from: http://serc.carleton.edu/research_education/geochemsheets/techniques/SEM.html.
13. Technologies, A., Agilent 8453 UV-visible Spectroscopy System Service Manual. 2000. 14. Ratner, B., J.F. Watts and J. Wolstenholme, An Introduction to Surface Analysis by XPS and
AES, John Wiley & Sons Ltd., Chichester, UK (2003) 224 pp. Journal of Controlled Release, 2005. 105(1-2): p. 178-179.
15. (MBL), M.B.C.L. Colony Forming Units (CFU). October 5, 2007 [cited 2013 May 23]; Available from: http://www.moldbacteriaconsulting.com/fungi/colony-forming-units-cfu.html.
16. Atshan, S.S., et al., A simple and rapid differentiation method for combating therapeutically challenging planktonic and biofilm-producing Staphylococcus aureus. African Journal of Microbiology Research, 2011. 5(22): p. 3720-3725.
30
10. Appendix
10.1 Calculations of antibiotic solutions
The following calculations are based on the molecular weight of 435.88 g/mol for Cloxacillin.
10.1.1 Cloxacillin concentration 0.5 g/L
The required volume is 40 mL, since 20 mL are going to be used in the QCM-D measurement and 20
mL in test 1.
c1*V1 = c2*V2 0.5 g/L*0.040 L = 0.02 g
0.02 grams are measured and diluted with Milli-Q water to a volume of 40 mL.
10.1.2 Cloxacillin concentration 0.5 mg/L
The required volume is 20 mL. Since it is such a low concentration the dilution is done in two steps. A
stock solution of 5 mg/L is made by dissolving 0.25 mg in Milli-Q water to a volume of 50 mL.
c1*V1 = c2*V2 (0.5*10-3*0.020)/5*10-3 = 0.002 L
2 mL of the stock solution is mixed with Milli-Q water to a volume of 20 mL.
10.1.3 Cloxacillin concentration 2.25 mg/L
The required volume is 20 mL in two separate bottles, since 20 mL are going to be used in the QCM-D
measurement and 20 mL in other tests. A stock solution of 5 mg/L is made by dissolving 5 mg in Milli-
Q water to a volume of 1000 mL.
c1*V1 = c2*V2 (2.25*10-3*0.020)/5*10-3 = 0.009 L
9 mL of the stock solution is mixed with Milli-Q to a volume of 20 mL in each bottle.
10.1.4 Cloxacillin for test 2
The required volume is 10 mL and the solution should have the concentration 0.5 g/L when it is
mixed with 10 mL of bacteria.
c1*V1 = c2*V2 (0.5*10.5*10-3)/0.5*10-3 = 10.5 g/L
0.21 g of Cloxacillin is dissolved in Milli-Q water to a volume of 20 mL. From this, 10 mL is saved since
only 9 mL is needed for the trials.
10.1.5 Cloxacillin for test 3 and control 3
The required volume is 20 mL and the solution should have the concentration 2.25 mg/L when it is
mixed with 10 mL of bacteria.
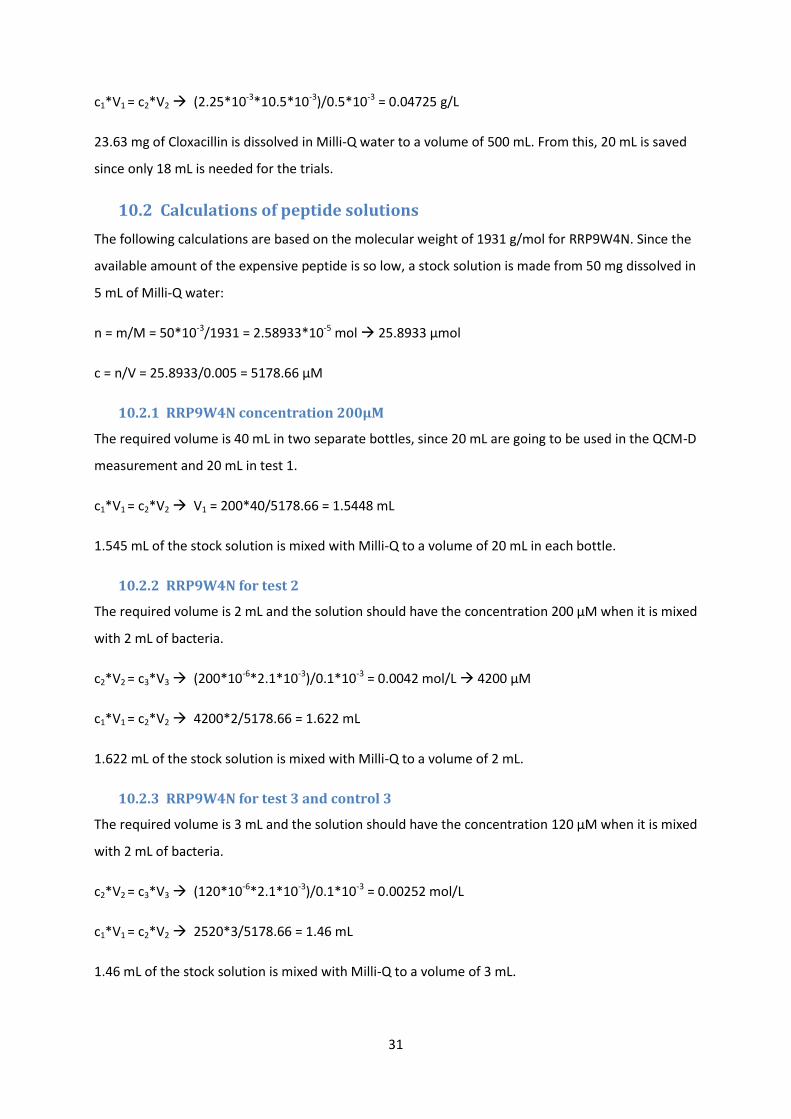
31
c1*V1 = c2*V2 (2.25*10-3*10.5*10-3)/0.5*10-3 = 0.04725 g/L
23.63 mg of Cloxacillin is dissolved in Milli-Q water to a volume of 500 mL. From this, 20 mL is saved
since only 18 mL is needed for the trials.
10.2 Calculations of peptide solutions
The following calculations are based on the molecular weight of 1931 g/mol for RRP9W4N. Since the
available amount of the expensive peptide is so low, a stock solution is made from 50 mg dissolved in
5 mL of Milli-Q water:
n = m/M = 50*10-3/1931 = 2.58933*10-5 mol 25.8933 µmol
c = n/V = 25.8933/0.005 = 5178.66 µM
10.2.1 RRP9W4N concentration 200µM
The required volume is 40 mL in two separate bottles, since 20 mL are going to be used in the QCM-D
measurement and 20 mL in test 1.
c1*V1 = c2*V2 V1 = 200*40/5178.66 = 1.5448 mL
1.545 mL of the stock solution is mixed with Milli-Q to a volume of 20 mL in each bottle.
10.2.2 RRP9W4N for test 2
The required volume is 2 mL and the solution should have the concentration 200 µM when it is mixed
with 2 mL of bacteria.
c2*V2 = c3*V3 (200*10-6*2.1*10-3)/0.1*10-3 = 0.0042 mol/L 4200 µM
c1*V1 = c2*V2 4200*2/5178.66 = 1.622 mL
1.622 mL of the stock solution is mixed with Milli-Q to a volume of 2 mL.
10.2.3 RRP9W4N for test 3 and control 3
The required volume is 3 mL and the solution should have the concentration 120 µM when it is mixed
with 2 mL of bacteria.
c2*V2 = c3*V3 (120*10-6*2.1*10-3)/0.1*10-3 = 0.00252 mol/L
c1*V1 = c2*V2 2520*3/5178.66 = 1.46 mL
1.46 mL of the stock solution is mixed with Milli-Q to a volume of 3 mL.
32
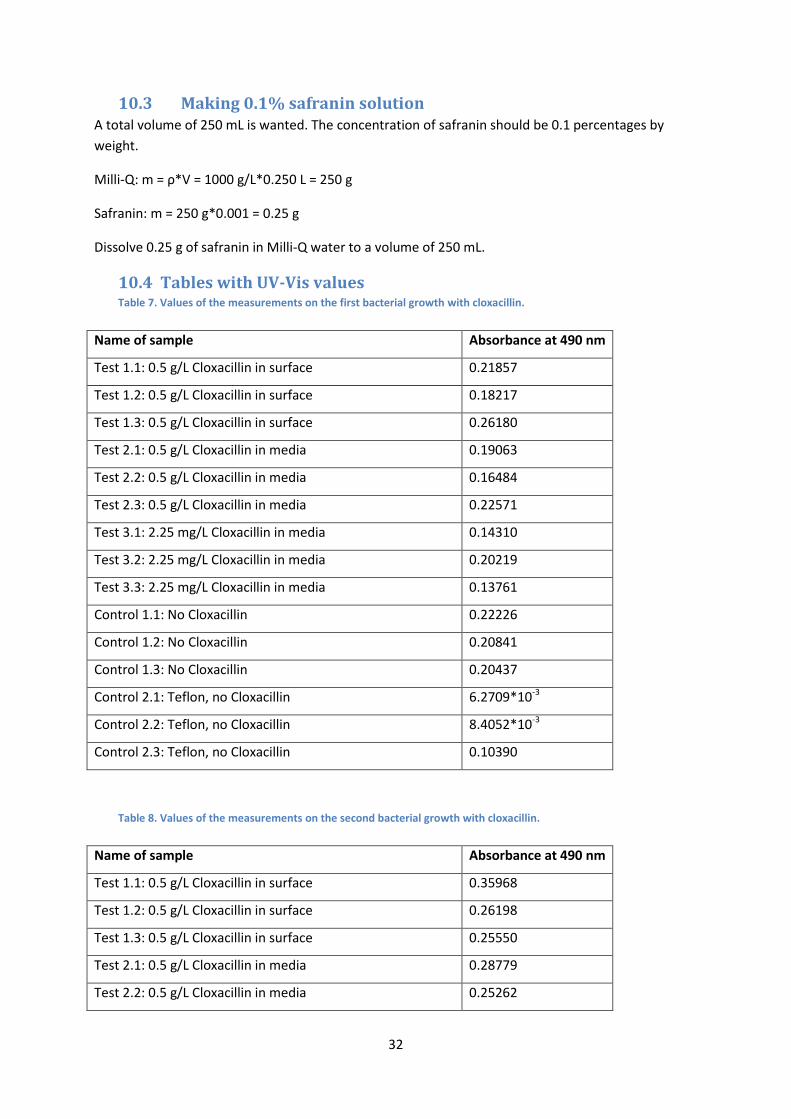
10.3 Making 0.1% safranin solution A total volume of 250 mL is wanted. The concentration of safranin should be 0.1 percentages by
weight.
Milli-Q: m = ρ*V = 1000 g/L*0.250 L = 250 g
Safranin: m = 250 g*0.001 = 0.25 g
Dissolve 0.25 g of safranin in Milli-Q water to a volume of 250 mL.
10.4 Tables with UV-Vis values Table 7. Values of the measurements on the first bacterial growth with cloxacillin.
Name of sample Absorbance at 490 nm
Test 1.1: 0.5 g/L Cloxacillin in surface 0.21857
Test 1.2: 0.5 g/L Cloxacillin in surface 0.18217
Test 1.3: 0.5 g/L Cloxacillin in surface 0.26180
Test 2.1: 0.5 g/L Cloxacillin in media 0.19063
Test 2.2: 0.5 g/L Cloxacillin in media 0.16484
Test 2.3: 0.5 g/L Cloxacillin in media 0.22571
Test 3.1: 2.25 mg/L Cloxacillin in media 0.14310
Test 3.2: 2.25 mg/L Cloxacillin in media 0.20219
Test 3.3: 2.25 mg/L Cloxacillin in media 0.13761
Control 1.1: No Cloxacillin 0.22226
Control 1.2: No Cloxacillin 0.20841
Control 1.3: No Cloxacillin 0.20437
Control 2.1: Teflon, no Cloxacillin 6.2709*10-3
Control 2.2: Teflon, no Cloxacillin 8.4052*10-3
Control 2.3: Teflon, no Cloxacillin 0.10390
Table 8. Values of the measurements on the second bacterial growth with cloxacillin.
Name of sample Absorbance at 490 nm
Test 1.1: 0.5 g/L Cloxacillin in surface 0.35968
Test 1.2: 0.5 g/L Cloxacillin in surface 0.26198
Test 1.3: 0.5 g/L Cloxacillin in surface 0.25550
Test 2.1: 0.5 g/L Cloxacillin in media 0.28779
Test 2.2: 0.5 g/L Cloxacillin in media 0.25262
33
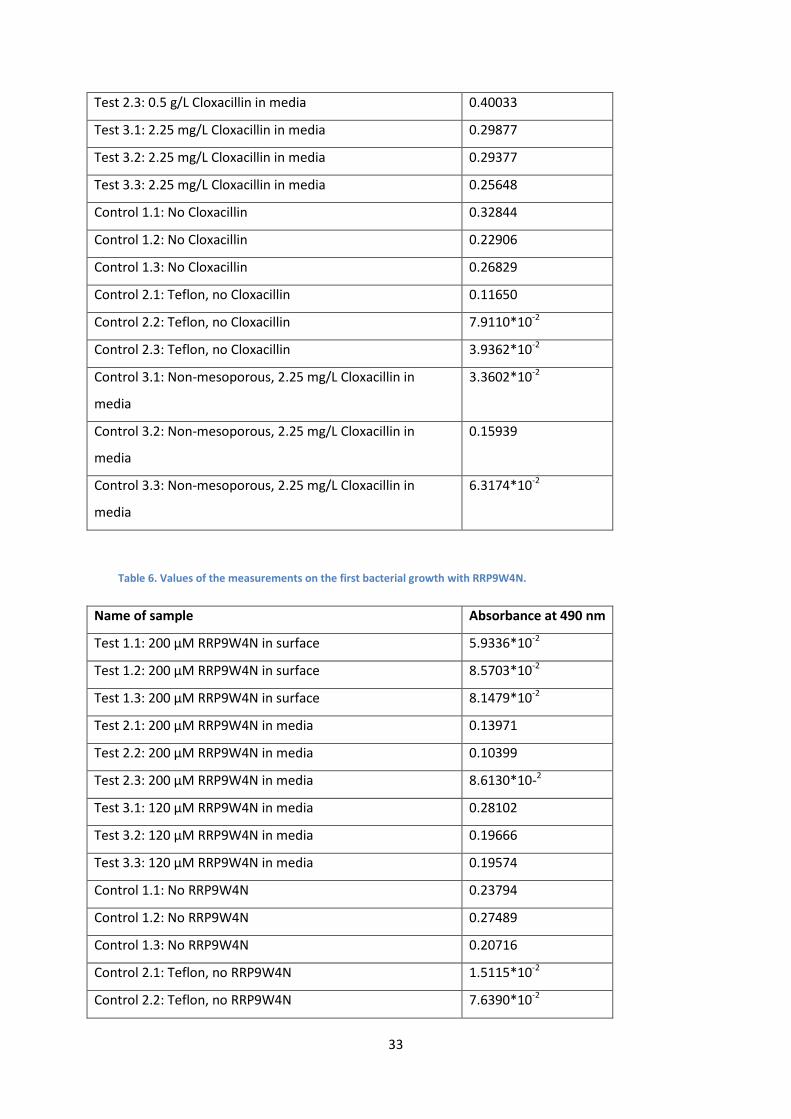
Test 2.3: 0.5 g/L Cloxacillin in media 0.40033
Test 3.1: 2.25 mg/L Cloxacillin in media 0.29877
Test 3.2: 2.25 mg/L Cloxacillin in media 0.29377
Test 3.3: 2.25 mg/L Cloxacillin in media 0.25648
Control 1.1: No Cloxacillin 0.32844
Control 1.2: No Cloxacillin 0.22906
Control 1.3: No Cloxacillin 0.26829
Control 2.1: Teflon, no Cloxacillin 0.11650
Control 2.2: Teflon, no Cloxacillin 7.9110*10-2
Control 2.3: Teflon, no Cloxacillin 3.9362*10-2
Control 3.1: Non-mesoporous, 2.25 mg/L Cloxacillin in
media
3.3602*10-2
Control 3.2: Non-mesoporous, 2.25 mg/L Cloxacillin in
media
0.15939
Control 3.3: Non-mesoporous, 2.25 mg/L Cloxacillin in
media
6.3174*10-2
Table 6. Values of the measurements on the first bacterial growth with RRP9W4N.
Name of sample Absorbance at 490 nm
Test 1.1: 200 µM RRP9W4N in surface 5.9336*10-2
Test 1.2: 200 µM RRP9W4N in surface 8.5703*10-2
Test 1.3: 200 µM RRP9W4N in surface 8.1479*10-2
Test 2.1: 200 µM RRP9W4N in media 0.13971
Test 2.2: 200 µM RRP9W4N in media 0.10399
Test 2.3: 200 µM RRP9W4N in media 8.6130*10-2
Test 3.1: 120 µM RRP9W4N in media 0.28102
Test 3.2: 120 µM RRP9W4N in media 0.19666
Test 3.3: 120 µM RRP9W4N in media 0.19574
Control 1.1: No RRP9W4N 0.23794
Control 1.2: No RRP9W4N 0.27489
Control 1.3: No RRP9W4N 0.20716
Control 2.1: Teflon, no RRP9W4N 1.5115*10-2
Control 2.2: Teflon, no RRP9W4N 7.6390*10-2
34
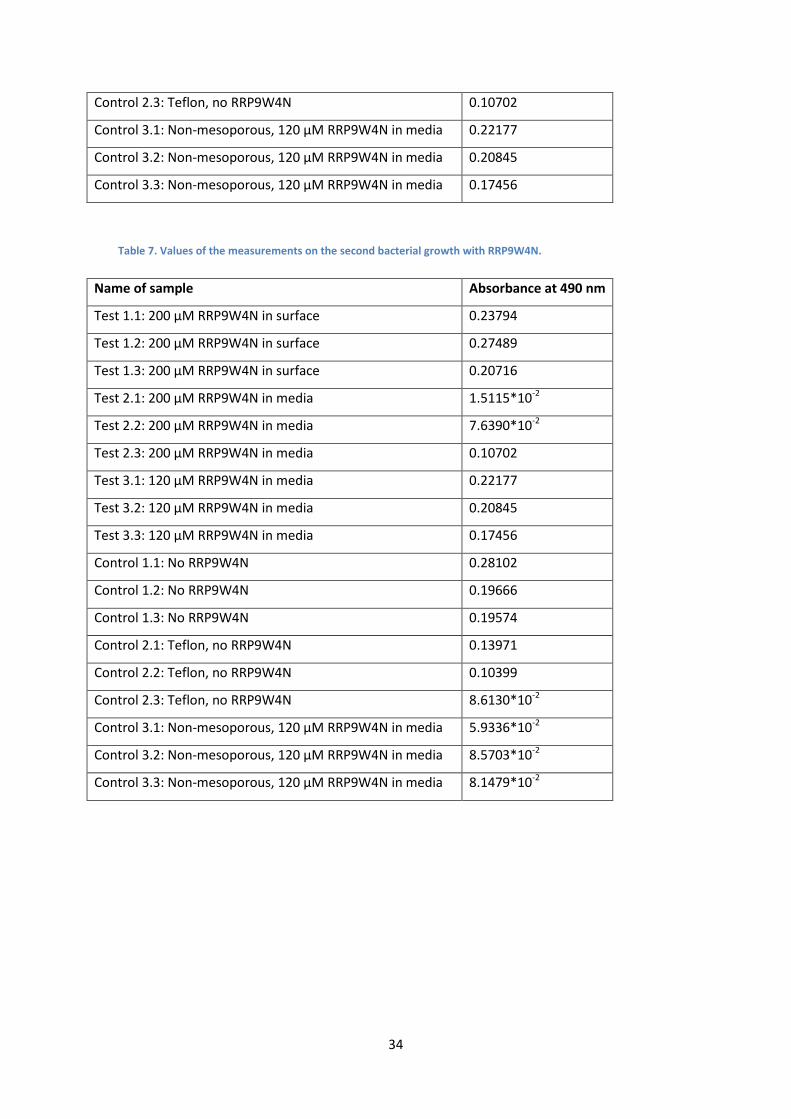
Control 2.3: Teflon, no RRP9W4N 0.10702
Control 3.1: Non-mesoporous, 120 µM RRP9W4N in media 0.22177
Control 3.2: Non-mesoporous, 120 µM RRP9W4N in media 0.20845
Control 3.3: Non-mesoporous, 120 µM RRP9W4N in media 0.17456
Table 7. Values of the measurements on the second bacterial growth with RRP9W4N.
Name of sample Absorbance at 490 nm
Test 1.1: 200 µM RRP9W4N in surface 0.23794
Test 1.2: 200 µM RRP9W4N in surface 0.27489
Test 1.3: 200 µM RRP9W4N in surface 0.20716
Test 2.1: 200 µM RRP9W4N in media 1.5115*10-2
Test 2.2: 200 µM RRP9W4N in media 7.6390*10-2
Test 2.3: 200 µM RRP9W4N in media 0.10702
Test 3.1: 120 µM RRP9W4N in media 0.22177
Test 3.2: 120 µM RRP9W4N in media 0.20845
Test 3.3: 120 µM RRP9W4N in media 0.17456
Control 1.1: No RRP9W4N 0.28102
Control 1.2: No RRP9W4N 0.19666
Control 1.3: No RRP9W4N 0.19574
Control 2.1: Teflon, no RRP9W4N 0.13971
Control 2.2: Teflon, no RRP9W4N 0.10399
Control 2.3: Teflon, no RRP9W4N 8.6130*10-2
Control 3.1: Non-mesoporous, 120 µM RRP9W4N in media 5.9336*10-2
Control 3.2: Non-mesoporous, 120 µM RRP9W4N in media 8.5703*10-2
Control 3.3: Non-mesoporous, 120 µM RRP9W4N in media 8.1479*10-2