Embed Size (px)
DESCRIPTION
Preventable Hospitalization Costs: A County-Level Mapping Tool. June 16, 2008 Marybeth Farquhar Agency for Healthcare Research and Quality Melanie Chansky Battelle Centers for Public Health Research and Evaluation. Webinar Overview. Overview of Mapping Tool Demonstration Overview of Data - PowerPoint PPT Presentation
Citation preview
Preventable Hospitalization Costs: Preventable Hospitalization Costs: A County-Level Mapping Tool A County-Level Mapping Tool
June 16, 2008
Marybeth FarquharAgency for Healthcare Research and Quality
Melanie ChanskyBattelle Centers for Public Health Research and Evaluation
2
Webinar OverviewWebinar Overview
Overview of Mapping ToolOverview of Mapping Tool DemonstrationDemonstration Overview of DataOverview of Data Interpretation and Use of ResultsInterpretation and Use of Results Future PlansFuture Plans
3
Overview of Mapping ToolOverview of Mapping Tool
4
AHRQ Quality Indicators AHRQ Quality Indicators (QIs)(QIs)
Use existing hospital discharge data, based on Use existing hospital discharge data, based on readily available data elementsreadily available data elements
Incorporate severity adjustment methods (APR-Incorporate severity adjustment methods (APR-DRGs, comorbidity groupings and hierarchical DRGs, comorbidity groupings and hierarchical modeling)modeling)
Five modules: Inpatient, Patient Safety, Prevention, Five modules: Inpatient, Patient Safety, Prevention, Pediatric, and NeonatalPediatric, and Neonatal
5
Preventable Hospitalization Costs: Preventable Hospitalization Costs: A County-Level Mapping ToolA County-Level Mapping Tool
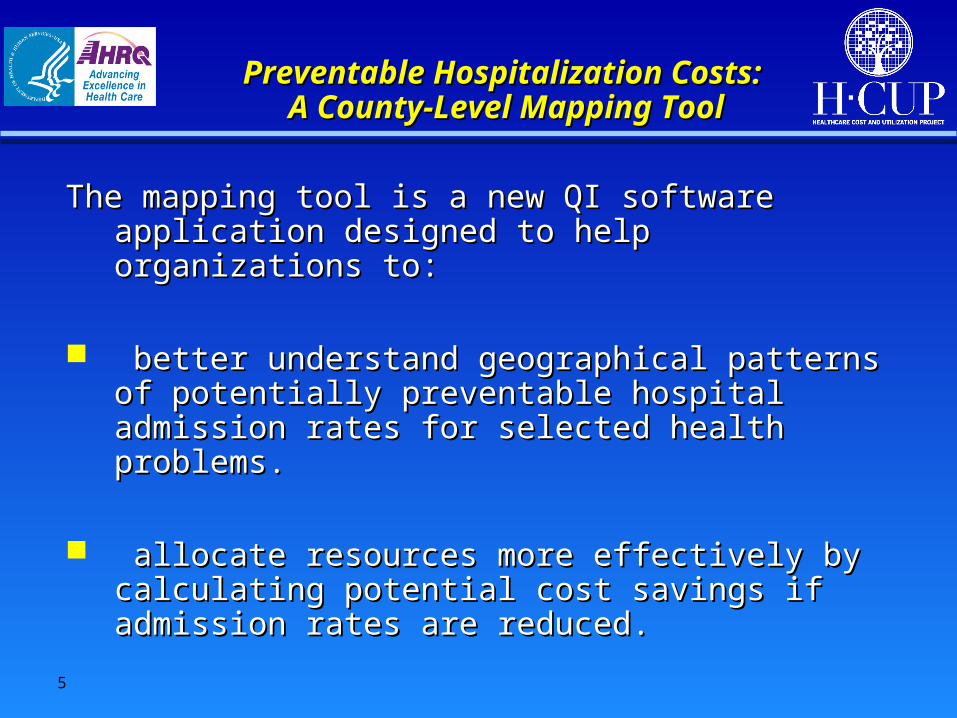
The mapping tool is a new QI software application The mapping tool is a new QI software application designed to help organizations to:designed to help organizations to:
better understand geographical patterns of potentially better understand geographical patterns of potentially preventable hospital admission rates for selected preventable hospital admission rates for selected health problems.health problems.
allocate resources more effectively by calculating allocate resources more effectively by calculating potential cost savings if admission rates are reduced.potential cost savings if admission rates are reduced.
6
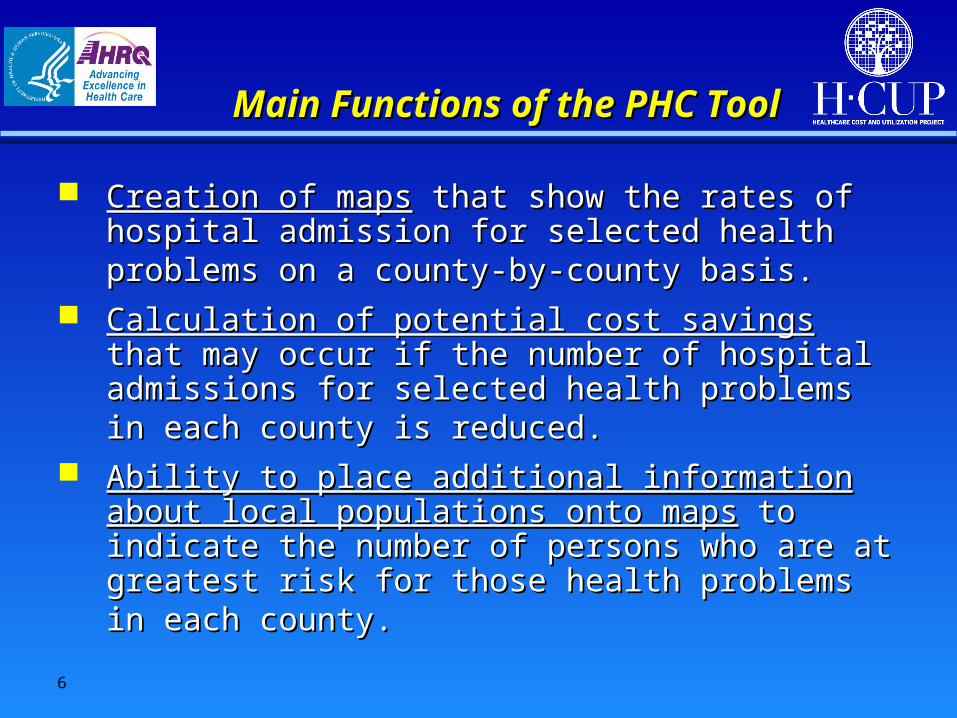
Main Functions of the PHC ToolMain Functions of the PHC Tool
Creation of mapsCreation of maps that show the rates of hospital that show the rates of hospital admission for selected health problems on a county-by-admission for selected health problems on a county-by-county basis.county basis.
Calculation of potential cost savingsCalculation of potential cost savings that may occur if that may occur if the number of hospital admissions for selected health the number of hospital admissions for selected health problems in each county is reduced.problems in each county is reduced.
Ability to place additional information about local Ability to place additional information about local populations onto mapspopulations onto maps to indicate the number of to indicate the number of persons who are at greatest risk for those health persons who are at greatest risk for those health problems in each county.problems in each county.
7
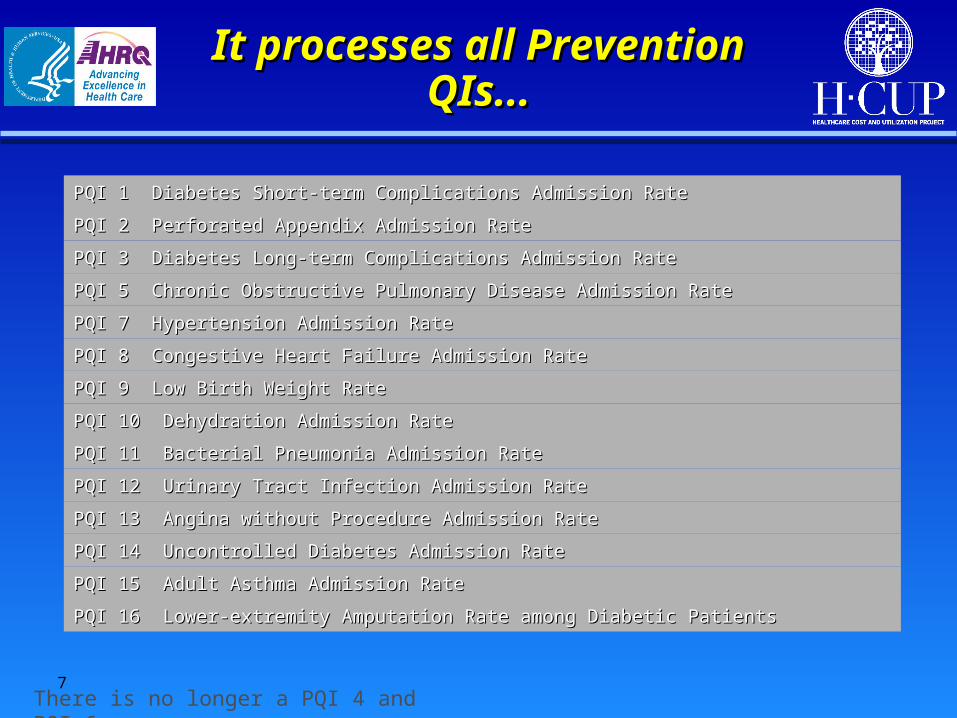
It processes all Prevention It processes all Prevention QIs...QIs...
PQI 1 Diabetes Short-term Complications Admission RatePQI 1 Diabetes Short-term Complications Admission Rate
PQI 2 Perforated Appendix Admission RatePQI 2 Perforated Appendix Admission Rate
PQI 3 Diabetes Long-term Complications Admission RatePQI 3 Diabetes Long-term Complications Admission Rate
PQI 5 Chronic Obstructive Pulmonary Disease Admission RatePQI 5 Chronic Obstructive Pulmonary Disease Admission Rate
PQI 7 Hypertension Admission RatePQI 7 Hypertension Admission Rate
PQI 8 Congestive Heart Failure Admission RatePQI 8 Congestive Heart Failure Admission Rate
PQI 9 Low Birth Weight RatePQI 9 Low Birth Weight Rate
PQI 10 Dehydration Admission RatePQI 10 Dehydration Admission Rate
PQI 11 Bacterial Pneumonia Admission RatePQI 11 Bacterial Pneumonia Admission Rate
PQI 12 Urinary Tract Infection Admission RatePQI 12 Urinary Tract Infection Admission Rate
PQI 13 Angina without Procedure Admission RatePQI 13 Angina without Procedure Admission Rate
PQI 14 Uncontrolled Diabetes Admission RatePQI 14 Uncontrolled Diabetes Admission Rate
PQI 15 Adult Asthma Admission RatePQI 15 Adult Asthma Admission Rate
PQI 16 Lower-extremity Amputation Rate among Diabetic PatientsPQI 16 Lower-extremity Amputation Rate among Diabetic Patients
There is no longer a PQI 4 and PQI 6.
8
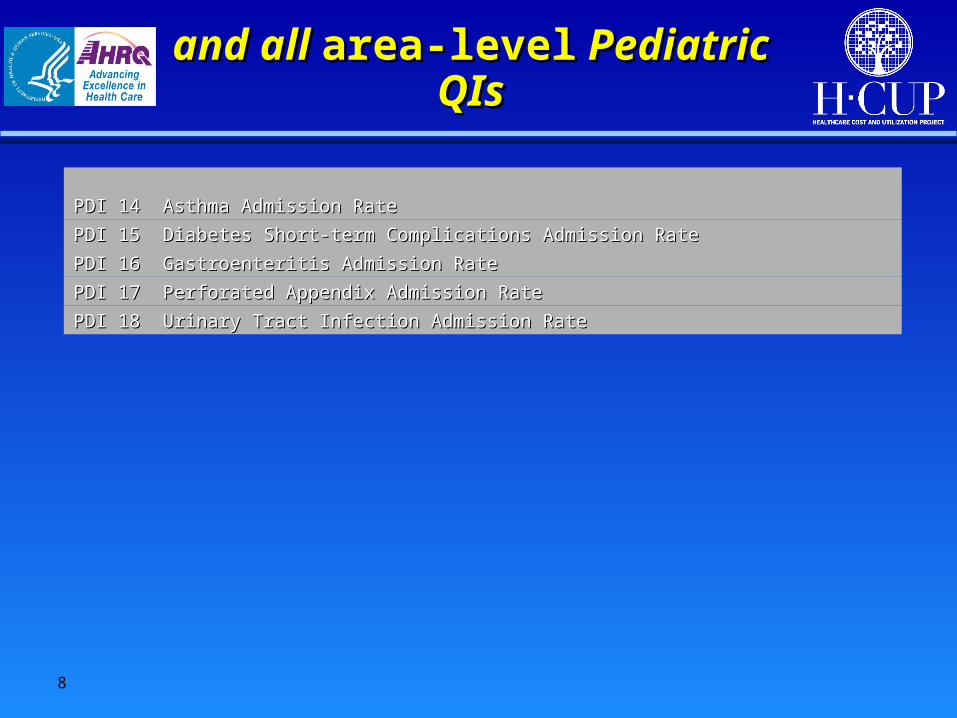
and all and all area-levelarea-level Pediatric QIs Pediatric QIs
PDI 14 Asthma Admission RatePDI 14 Asthma Admission Rate
PDI 15 Diabetes Short-term Complications Admission RatePDI 15 Diabetes Short-term Complications Admission Rate
PDI 16 Gastroenteritis Admission RatePDI 16 Gastroenteritis Admission Rate
PDI 17 Perforated Appendix Admission RatePDI 17 Perforated Appendix Admission Rate
PDI 18 Urinary Tract Infection Admission RatePDI 18 Urinary Tract Infection Admission Rate
9
Tool DemonstrationTool Demonstration
10
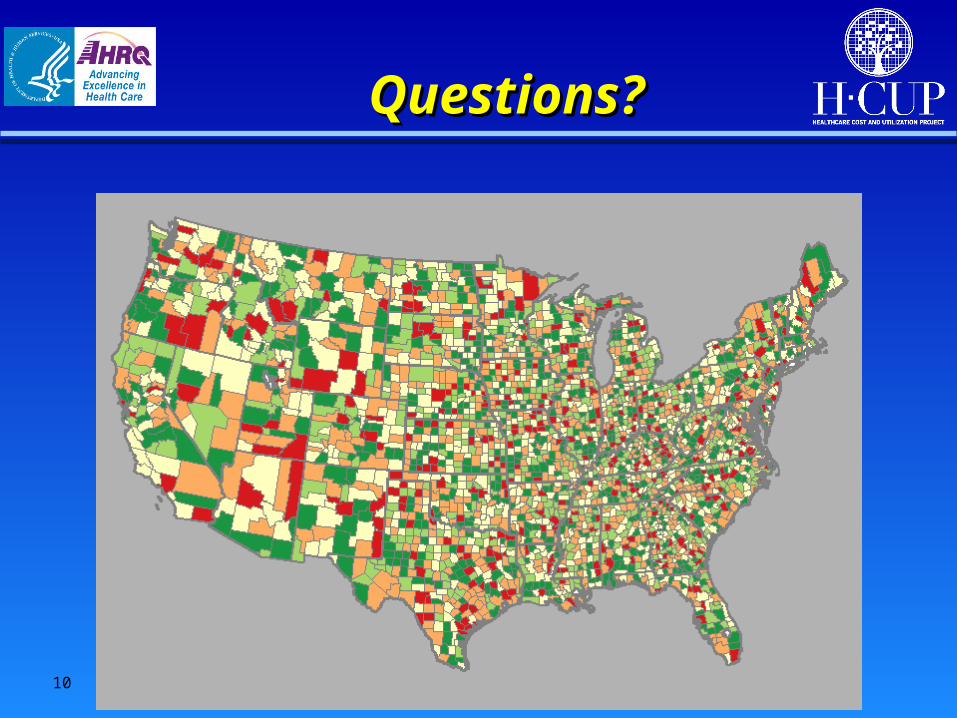
Questions?Questions?
11
Overview of DataOverview of Data
12
Underlying Data Used Underlying Data Used by the Toolby the Tool
Current indicator specificationsCurrent indicator specifications
Cost-to-charge ratiosCost-to-charge ratios
Census dataCensus data
13
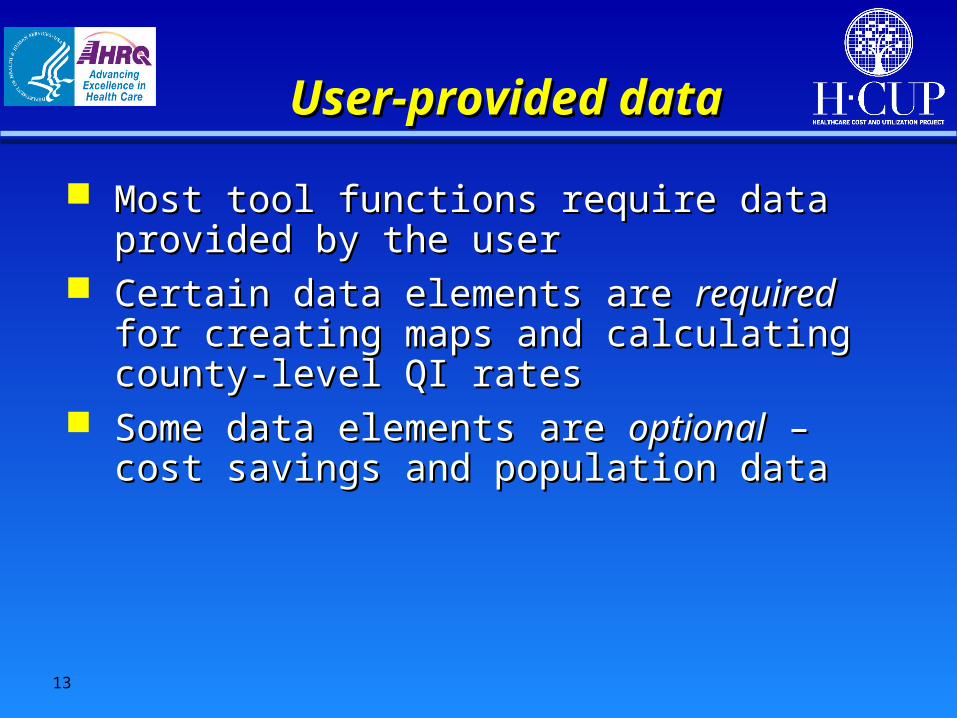
User-provided dataUser-provided data
Most tool functions require data provided by Most tool functions require data provided by the userthe user
Certain data elements are Certain data elements are requiredrequired for creating for creating maps and calculating county-level QI ratesmaps and calculating county-level QI rates
Some data elements are Some data elements are optionaloptional – cost – cost savings and population datasavings and population data
14
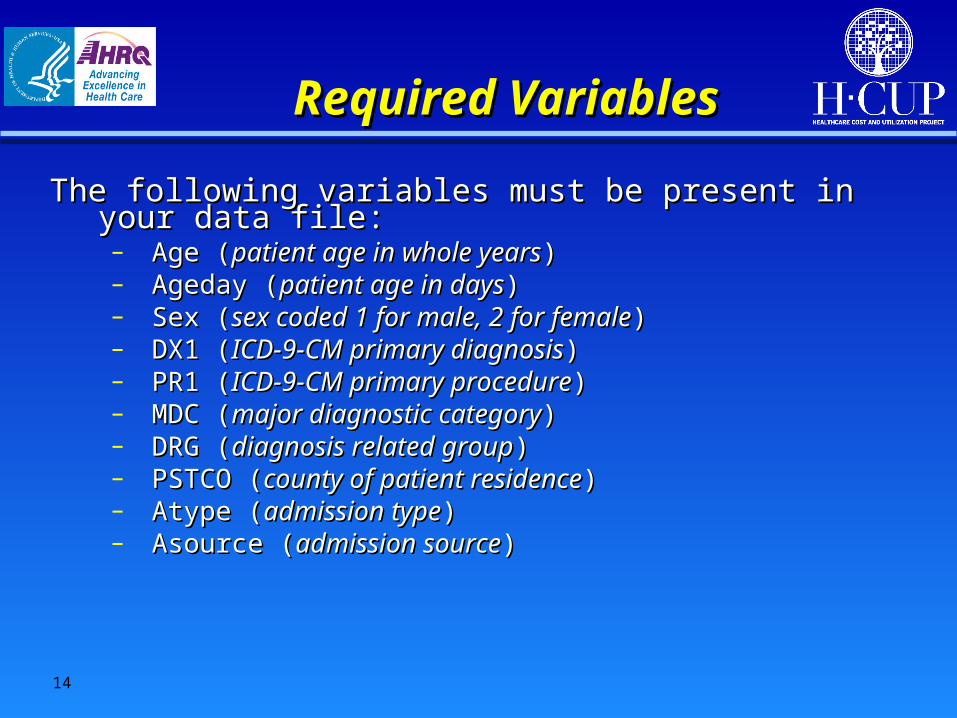
Required VariablesRequired Variables
The following variables must be present in your data file:The following variables must be present in your data file:– Age (Age (patient age in whole yearspatient age in whole years))– Ageday (Ageday (patient age in dayspatient age in days))– Sex (Sex (sex coded 1 for male, 2 for femalesex coded 1 for male, 2 for female))– DX1 (DX1 (ICD-9-CM primary diagnosisICD-9-CM primary diagnosis))– PR1 (PR1 (ICD-9-CM primary procedureICD-9-CM primary procedure))– MDC (MDC (major diagnostic categorymajor diagnostic category))– DRG (DRG (diagnosis related groupdiagnosis related group))– PSTCO (PSTCO (county of patient residencecounty of patient residence))– Atype (Atype (admission typeadmission type))– Asource (Asource (admission sourceadmission source))
15
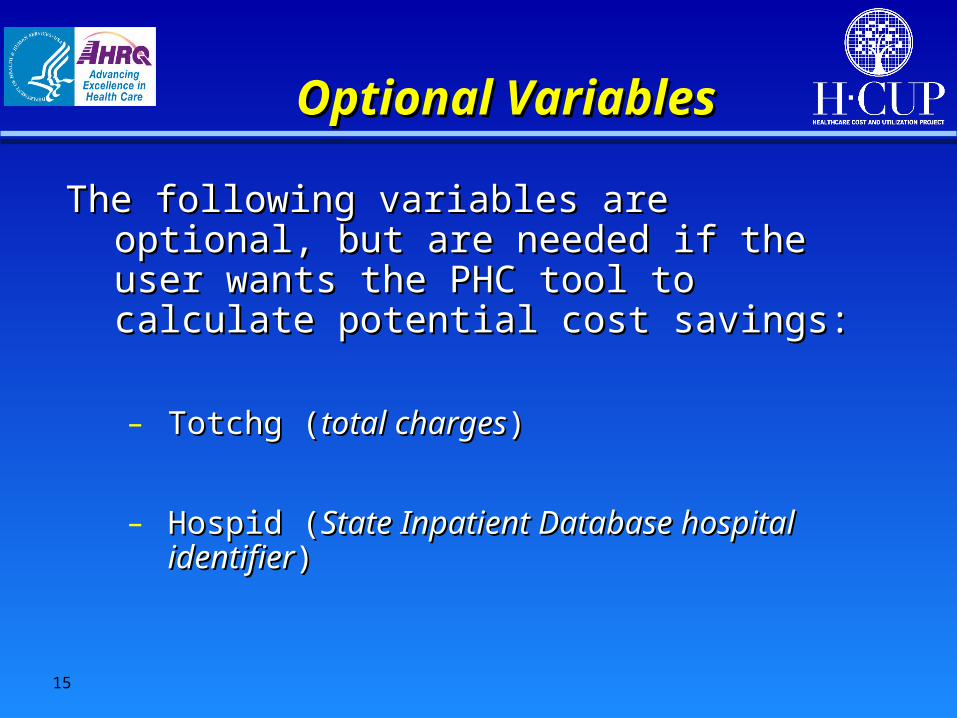
Optional VariablesOptional Variables
The following variables are optional, but are The following variables are optional, but are needed if the user wants the PHC tool to needed if the user wants the PHC tool to calculate potential cost savings:calculate potential cost savings:
– Totchg (Totchg (total chargestotal charges))
– Hospid (Hospid (State Inpatient Database hospital State Inpatient Database hospital identifieridentifier))
16
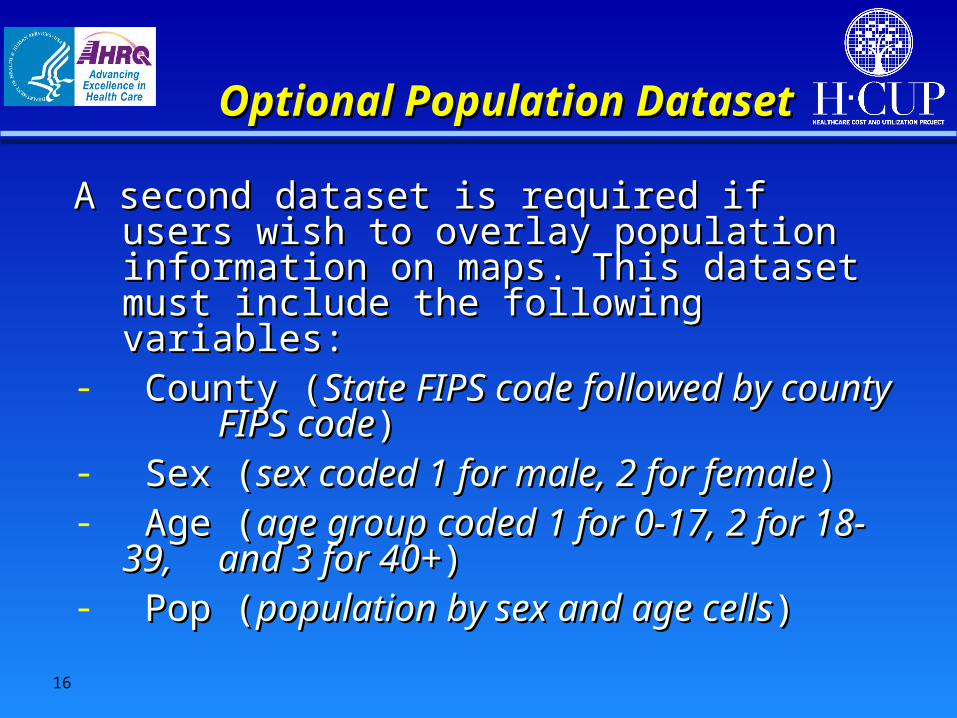
Optional Population DatasetOptional Population Dataset
A second dataset is required if users wish to A second dataset is required if users wish to overlay population information on maps. This overlay population information on maps. This dataset must include the following variables:dataset must include the following variables:
- County (County (State FIPS code followed by county State FIPS code followed by county FIPS codeFIPS code))
- Sex (Sex (sex coded 1 for male, 2 for femalesex coded 1 for male, 2 for female))- Age (Age (age group coded 1 for 0-17, 2 for 18-39, age group coded 1 for 0-17, 2 for 18-39,
and 3 for 40+and 3 for 40+))- Pop (Pop (population by sex and age cellspopulation by sex and age cells))
17
Data ProblemsData Problems
Most reported problems are related to the user Most reported problems are related to the user datasets.datasets.
The QI team can provide technical assistance The QI team can provide technical assistance with your dataset if you cannot solve your with your dataset if you cannot solve your problem with the information provided here.problem with the information provided here.
18
OutputsOutputs
All outputs are automatically placed in the All outputs are automatically placed in the folder where your dataset is locatedfolder where your dataset is located
Outputs include:Outputs include:– CSV fileCSV file
– Excel fileExcel file
– MapsMaps
19
CSV & Excel Files Include:CSV & Excel Files Include:
Numerator count of flagged casesNumerator count of flagged cases Denominator count of the at-risk populationDenominator count of the at-risk population Observed rateObserved rate Risk-adjusted rateRisk-adjusted rate Standard error of risk-adjusted rateStandard error of risk-adjusted rate Whether county is significantly higher or lower than Whether county is significantly higher or lower than
statewide ratestatewide rate Potential cost savings associated with a 10% Potential cost savings associated with a 10%
reduction in flagged cases (reduction in flagged cases (optionaloptional))
20
MapsMaps
Separate maps will be created for each Separate maps will be created for each selected QIselected QI
Files will be named after the QI, e.g., Files will be named after the QI, e.g., PQI14PQI14, , PQI1PQI1
Can be opened and manipulated using any Can be opened and manipulated using any graphics program or picture viewergraphics program or picture viewer
21
Interpretation and Use of ResultsInterpretation and Use of Results
22
There are many possible uses There are many possible uses for mapping tool data…for mapping tool data…
Public ReportingPublic Reporting
Intervention TargetingIntervention Targeting
Tracking Intervention ImpactTracking Intervention Impact
Identification of Best PracticesIdentification of Best Practices
23
……but several issues that must be but several issues that must be addressed to addressed to effectivelyeffectively use the use the
datadata
Data leaves you with more questions: Are Data leaves you with more questions: Are these rates reasonable? Do they present these rates reasonable? Do they present significant quality concerns?significant quality concerns?
Excel data needs to be manipulated to present Excel data needs to be manipulated to present a more dynamic, appealing, and concise data a more dynamic, appealing, and concise data display. display.
24
Sources of Comparison DataSources of Comparison Data
State benchmarks (provided by tool)State benchmarks (provided by tool)
PQI and PDI User GuidesPQI and PDI User Guides
HCUPnetHCUPnet
NHQR / NHDRNHQR / NHDR
25
Presentation of DataPresentation of Data
Focus on using maps for presentations of dataFocus on using maps for presentations of data
Focus on using Excel outputs for further Focus on using Excel outputs for further analysis or as source data for new graphicsanalysis or as source data for new graphics
Consider creating concise narrative data Consider creating concise narrative data summaries summaries

26
Future PlansFuture Plans
27
We’re exploring ways to We’re exploring ways to improve the mapping tool…improve the mapping tool…
Incorporation into Windows QI SoftwareIncorporation into Windows QI Software
Allow for mapping below the county-level (zip-Allow for mapping below the county-level (zip-code, etc.)code, etc.)
Other ideas??Other ideas??
28
Further Info on the Mapping Further Info on the Mapping ToolTool
2 versions available:2 versions available:– SASSAS (requires SAS version 9 or higher and Office 2003 or (requires SAS version 9 or higher and Office 2003 or
higher)higher)
– WindowsWindows (runs on Windows NT, XP, 2000, and Vista only; (runs on Windows NT, XP, 2000, and Vista only; requires Office 2003 or higher)requires Office 2003 or higher)
Download the Mapping Tool at:Download the Mapping Tool at:
http://http://www.qualityindicators.ahrq.gov/mappingtool.htmwww.qualityindicators.ahrq.gov/mappingtool.htm
29
Additional AssistanceAdditional Assistance
Technical Assistance:Technical Assistance: Margie Shofer,Margie Shofer, [email protected]@ahrq.hhs.gov
Senior Program Analyst, Office of Communications and Knowledge Senior Program Analyst, Office of Communications and Knowledge TransferTransfer
For questions about the tool:For questions about the tool: [email protected]@qualityindicators.ahrq.gov
For more information about AHRQ Quality Tools:For more information about AHRQ Quality Tools: http://http://www.academyhealth.org/ahrq/qualitytools/index.htmwww.academyhealth.org/ahrq/qualitytools/index.htm

30
Questions?Questions?