Embed Size (px)
Citation preview

Prevalence of Serious Psychological Distress and Mental HealthTreatment in a National Sample of Pregnant and PostpartumWomen
Cristie Glasheen • Lisa Colpe • Valerie Hoffman •
Lauren Klein Warren
� Springer Science+Business Media New York (outside the USA) 2014
Abstract This study examines the prevalence and corre-
lates of past month serious psychological distress (SPD) and
past year mental health treatment (MHT) across pregnancy
and the postpartum. Data are from the 2008 to 2012 National
Surveys on Drug Use and Health. Prevalence estimates of
SPD as well as MHT among women with SPD were gener-
ated for each trimester and across the postpartum period.
Correlates of SPD and MHT were examined among pregnant
and postpartum women. The prevalence of past month SPD
was 6.4 % in first trimester women and 3.9 % in third tri-
mester women. In postpartum women, SPD prevalence
ranged from 4.6 % (0–2 months) to 6.9 % (3–5 months).
Correlates of SPD among pregnant and postpartum women
included being younger; non-Hispanic black; unmarried;
making under $20,000 annually; having past month cigarette
use; or having a past year alcohol or illicit drug use disorder.
Only 38.5 % of pregnant and 49.5 % of postpartum women
with past month SPD reported past year MHT. Those who
received MHT were more likely to be white; widowed,
divorced, or separated; have insurance; and have a history of
depression or anxiety than their counterparts with no MHT.
Pregnant women with SPD were less likely to report past
year MHT than postpartum women, even after adjusting for
potential confounders. Over half of pregnant and postpartum
women with past month SPD are not receiving MHT.
Increased contact with health care professionals during this
time may be an opportunity for screening, identification, and
referral to MHT.
Keywords Pregnancy � Postpartum � Psychological
distress � Mental health treatment � Mental health service
use
Introduction
Maternal distress during pregnancy and the postpartum
period may adversely affect fetal and early childhood
development [1–5] and have a negative impact on maternal
quality of life [6, 7]. Moreover, the severity of distress may
affect these outcomes [8, 9]. Despite this, few studies have
estimated the prevalence of serious psychological distress
(SPD) among pregnant or postpartum women from general
populations, and methodological issues with those studies
limit their generalizability [10, 11].
Previous studies have shown fluctuation in psychologi-
cal distress across pregnancy and the postpartum period.
Kearns et al. [11] examined patterns of psychological
distress from pregnancy into the postpartum period in a
small group of New Zealand women recruited from ante-
natal classes. Using the Edinburgh Postnatal Depression
Scale, the study found a decrease in psychological distress
from the third trimester through 10 weeks postpartum. In a
small study of women with low-risk pregnancies, DiPietro
et al. [10] followed women from the second half of preg-
nancy through 2 years postpartum and also found that
mean levels of psychological distress decreased from
C. Glasheen � V. Hoffman � L. K. Warren
RTI International, 3040 Cornwallis Rd., Research Triangle Park,
NC 27709, USA
e-mail: [email protected]
V. Hoffman
e-mail: [email protected]
L. K. Warren
e-mail: [email protected]
L. Colpe (&)
National Institute of Mental Health, 6001 Executive Boulevard,
Bethesda, MD 20892-9663, USA
e-mail: [email protected]; [email protected]
123
Matern Child Health J
DOI 10.1007/s10995-014-1511-2
pregnancy to 2 years postpartum but only among multip-
arous women. Psychological distress was lower and more
stable among primiparous women when compared with
distress levels of multiparous women. However, none of
these studies examined the prenatal and postpartum periods
with nationally representative samples.
Researchers have examined factors associated with
psychological distress during pregnancy and the post-
partum and found that pregnant and postpartum women are
at higher risk for distress if they are older [11, 12], are
single [13], have less education [12, 14–17], have low
social support [11, 14], are unemployed [12, 14, 18], or
have financial instability [12]. In addition, tobacco [19, 20],
alcohol use [20, 21], and prior psychological problems [16,
22] have been linked to distress among pregnant and
postpartum women.
One under researched area is mental health treatment
(MHT) among pregnant and postpartum women. Preg-
nancy and the postpartum are times of increased contact
with medical professionals and present opportunities for
women experiencing psychological distress to be identified
and advised of treatment options. One report using data
from a nationally representative study of US adults found
that pregnant women with psychiatric disorders were less
likely to seek MHT than nonpregnant women with psy-
chiatric disorders [23].
The current study uses US population-based data to
examine (a) the prevalence of SPD by pregnancy trimester
and postpartum period; (b) the demographic, health, and
behavioral correlates of SPD in pregnant and postpartum
women; and (c) the proportion and correlates of pregnant and
postpartum women with SPD who received MHT. Better
identification of the prevalence and correlates of SPD among
pregnant and postpartum women may help target screening
and treatment for women at high risk for SPD.
Methods
Sample
Data are from the 2008 to 2012 National Surveys on Drug
Use and Health (NSDUHs), a nationally representative
cross-sectional survey of the civilian, noninstitutionalized
US population aged 12 and older conducted by the Substance
Abuse and Mental Health Services Administration (SAM-
HSA). This stratified household-based survey covers resi-
dents of households, civilians living on military bases, and
persons in noninstitutional group quarters. Excluded from
the survey are persons with no fixed household address (e.g.,
homeless and/or transient persons not in shelters), active-
duty military personnel, and residents of institutional group
quarters, such as correctional facilities and mental
institutions. Data are collected in person using computer-
assisted interviewing (CAI) methods to provide a private and
confidential setting for the interview [24]. The primary
analytic sample consisted of women aged 18–44 who were
currently pregnant (n * 4,600), postpartum (n * 8,000),
and not pregnant or postpartum (n * 80,400). Women who
were missing trimester data (n \ 30) were excluded.
Measures
Pregnancy/Postpartum Status
Pregnancy status was self-reported. Postpartum status was
identified through questions asking respondents about the
age and number of biological children living in the
household. Women were classified as postpartum if they
had a biological child of 12 months or younger living in the
household. Women who were both pregnant and post-
partum were classified as pregnant.
Outcomes
There were two outcomes of interest: SPD and MHT. Past
month (30 days) psychological distress was measured using
the Kessler 6-item (K6) distress scale, a self-report screener
that evaluates nonspecific psychological distress and has
been clinically validated to maximize the scale’s discern-
ment of serious mental illness [25, 26]. A cut point of 13 or
higher is an indicator of SPD [27, 28]. Past year MHT was
defined as having received inpatient or outpatient treatment,
or prescription medication for ‘‘problems with emotions,
nerves, or mental health’’ in the 12 months before the survey,
not including treatment for alcohol or drug use.
Covariates
Covariates were drawn from the relevant literature and include
demographics, family environment, physical and mental health
status, and tobacco, alcohol, and drug use. Demographics
included age, race/ethnicity, marital status, education, employ-
ment, income, and poverty status [using the US Census Bureau’s
Federal Poverty Level calculation (FPL)]. Family environment-
related covariates included having had a rapid repeat birth
(defined in Healthy People 2010 as having two biological
children within 24 months of age of each other living in the
household [29]) and the number of biological children in the
household. Physical and mental health-related covariates
included health insurance status, overall health status, number of
significant health problems in the past year, and lifetime history
of depression or anxiety (respondent reported being diagnosed
with depression or anxiety by a doctor). Substance use included
past month cigarette use, past year alcohol use disorder, and past
year illicit drug use and illicit drug use disorder.
Matern Child Health J
123

Analyses
SPD Analyses
Prevalence estimates of SPD were generated for all preg-
nant women and for each trimester and for all postpartum
women and then grouped into four categories of post-
partum months (0–2, 3–5, 6–8, and 9–12 months post-
partum). Prevalence estimates were also estimated for
nonpregnant/nonpostpartum women. Differences in demo-
graphic characteristics between women with and without
SPD were evaluated among pregnant and postpartum
women. Statistical testing was conducted using Shah’s
Wald F tests (transformed from the standard Wald Chi
square) for overall significance to control for multiple
comparisons and t tests for post hoc comparisons of pro-
portions. T tests are used because the t-distribution more
accurately describes the test statistic under finite sample
sizes when the variances of the test statistic are estimated.
For more details, see the 2012 National Survey on Drug
Use and Health: Statistical Inference Report [30]. Multi-
variable logistic regression analyses were used to evaluate
the adjusted association of pregnancy status with SPD.
MHT Analyses
Prevalence estimates of MHT were generated for pregnant
and postpartum women with SPD, overall and by trimester/
postpartum category and among nonpregnant/non-
postpartum women. Differences in demographic character-
istics between women with SPD who did and did not receive
MHT were evaluated similar to the methods used for SPD.
For these analyses, pregnant and postpartum women with
SPD were combined to increase the sample size. Multivari-
able logistic regression analyses were used to evaluate the
adjusted association of pregnancy status with MHT.
All analyses were conducted using SUDAAN� [31] to
account for NSDUH’s complex survey design. All statistical
tests were two-tailed, with an alpha of 0.05; 95 % confidence
intervals (CIs) are also shown. The study was approved by
the RTI International Institutional Review Board.
Results
SPD
Prevalence of SPD
Past month SPD prevalence was similar in pregnant
(4.8 %) and postpartum women (5.4 %); these rates were
lower than the prevalence of SPD among nonpregnant/
nonpostpartum women (7.4 %; p \ 0.001 and p \ 0.001,
respectively; Fig. 1). Across trimesters, SPD prevalence
was 6.4 % in first trimester women, significantly higher
than the 4.3 % among second trimester women
(p = 0.036), and the 3.9 % among third trimester women
(p = 0.016). In postpartum women, SPD prevalence was
4.6 % at 0–2 months postpartum and then hovered between
5.1 % (9–12 months postpartum) and 6.9 % (3–5 months
postpartum). The prevalence of SPD in the first trimester
did not differ significantly from the prevalence in each of
the postpartum windows (p [ 0.05). Examining only
women who had been pregnant at least once, the preva-
lence of SPD increased linearly from 4.8 % among preg-
nant women to 5.4 % among postpartum women to 6.3 %
among women who had at least one biological child but
were not currently pregnant or postpartum (t test for linear
trend = 3.32, p \ 0.001).
The prevalence of SPD was significantly lower among
pregnant women aged 35–44 (0.8 %) than among post-
partum (3.2 %) and nonpregnant/nonpostpartum women
(5.9 %, Table 1). A similar pattern of differences (SPD
being lower among pregnant than among postpartum and
nonpregnant/nonpostpartum women) was seen among
married women, women with an annual income between
$50,000 and $74,999, women with a family income 200 %
or more above FPL, women who had had a prior rapid
repeat birth, and women with no serious health problems.
The prevalence of SPD across race/ethnicity, education,
employment, insurance status, health status, history of
depression or anxiety, past month cigarette use, and past
year alcohol or illicit drug use, did not differ by pregnancy
status.
Correlates of SPD Among Pregnant and Postpartum
Women
Correlates of past month SPD were largely similar among
pregnant and postpartum women (Table 2). SPD was
associated with being in the youngest age group (18–25),
being unmarried, having less education, being unemployed,
making \$20,000 annually, living below FPL, being in
good or fair/poor health, having a significant health prob-
lem, having a lifetime history of depression or anxiety,
smoking cigarettes in the past month, having an alcohol use
disorder in the past year, using illicit drugs in the past year
and having a past year illicit drug use disorder. Race/eth-
nicity was also associated with SPD. However, this asso-
ciation was not the same in pregnant and postpartum
women. An estimated 20.9 % of pregnant women with
SPD were black, compared with 13.1 % of pregnant
women without SPD. Among postpartum women, there
was no association between being black and having past
month SPD, but fewer postpartum women with SPD were
Matern Child Health J
123

Hispanic (14.5 %) than women without SPD (21.7 %).
Number of biological children in the household, and health
insurance status were not associated with SPD.
Adjusted Odds of SPD by Pregnancy Status
Evaluating the adjusted odds of past month SPD among
women aged 18–44 indicated that nonpregnant/non-
postpartum women had 50 % greater odds of SPD than
pregnant women [odds ratio (OR) 1.51, p \ 0.001; Table 3].
The odds of SPD was also higher among postpartum women
than pregnant women; however, this difference only
approached significance (OR 1.27, p = 0.051).
MHT
Prevalence and Pattern of MHT
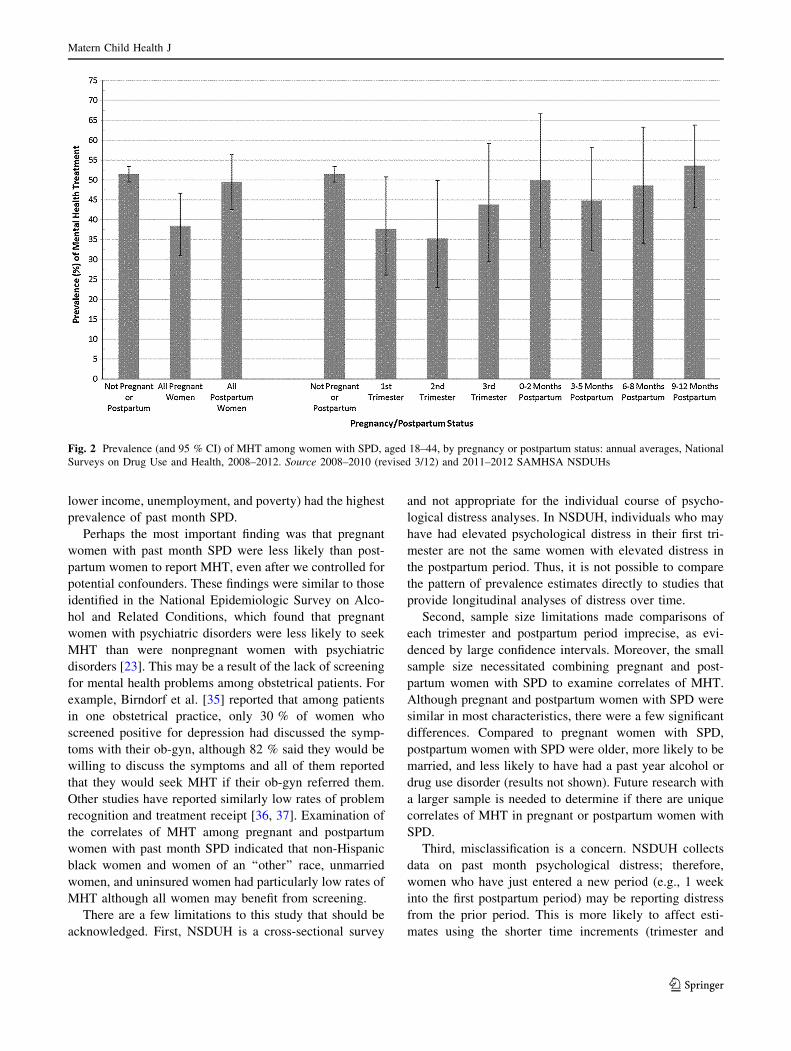
Only 38.5 % of pregnant women, 49.5 % of postpartum
women, and 51.5 % of nonpostpartum/nonpregnant women
with past month SPD reported receiving MHT in the past
year (Fig. 2). The prevalence of MHT among pregnant
women ranged from 35.5 % among second trimester women
to 43.8 % among third trimester women. The prevalence of
MHT in the postpartum period ranged between 44.8 %
(3–5 months) to 53.6 % (9–12 months). The prevalence of
past year MHT was lower among pregnant women than
among postpartum women (p = 0.036) and nonpregnant/
nonpostpartum controls (p = 0.002).
The prevalence of MHT was lower among never married
pregnant or postpartum women (36.6 %; Table 1) than among
their nonpregnant/nonpostpartum counterparts (46.1 %).
Similarly, the prevalence of MHT was lower among pregnant
and postpartum women with an employment status of ‘‘other’’
(45.5 %) than among their nonpregnant/nonpostpartum
counterparts (60.7 %). A similar pattern of SPD prevalence
(lower in pregnant/postpartum women than their non-
pregnant/nonpostpartum counterparts) was seen among
women making \$20,000 annually, women with a family
income below the federal poverty threshold, women with one
or two biological children living in the household, women
with insurance, those with a health problem, and women who
did not smoke cigarettes in the past month. The prevalence of
MHT across pregnancy/postpartum status did not differ by
age, race/ethnicity, education, rapid repeat birth, health status,
and history of depression or anxiety.
Correlates of MHT Receipt Among Pregnant
and Postpartum Women
Pregnant and postpartum women with past month SPD who
received MHT in the past year were more likely to be
Fig. 1 Prevalence (and 95 % CI) of SPD among females aged 18–44 by pregnancy or postpartum status: annual averages, National Surveys on
Drug Use and Health, 2008–2012. Source 2008–2010 (revised 3/12) and 2011–2012 SAMHSA NSDUHs
Matern Child Health J
123
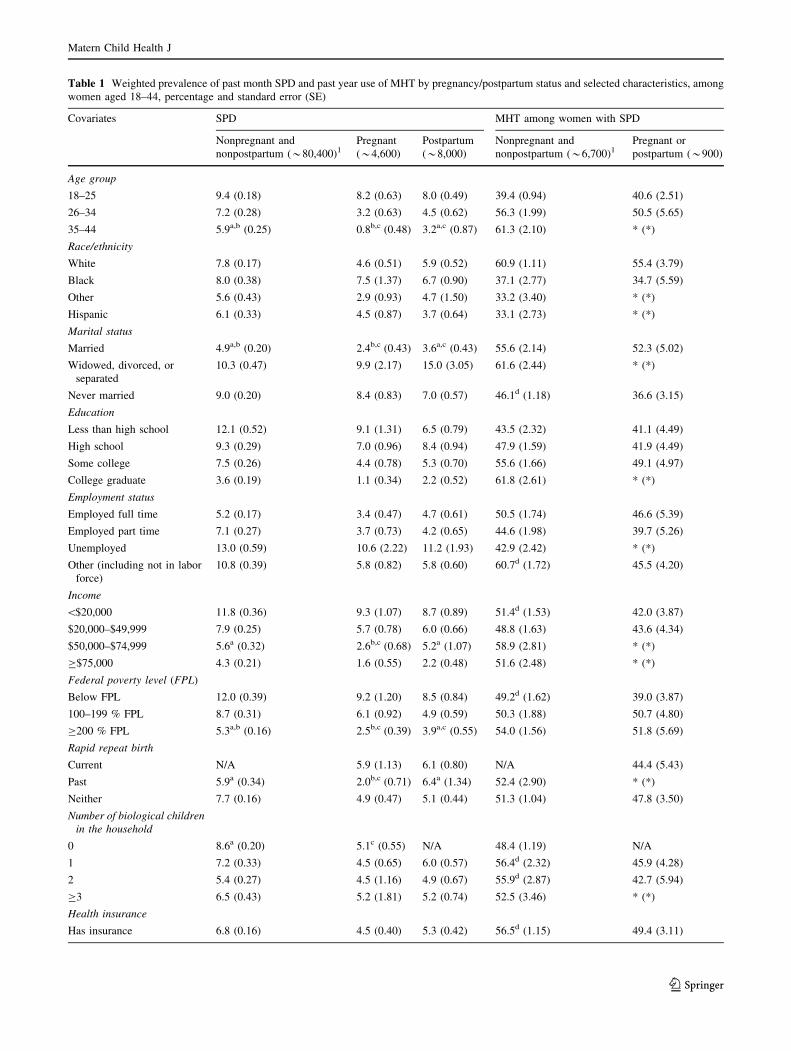
Table 1 Weighted prevalence of past month SPD and past year use of MHT by pregnancy/postpartum status and selected characteristics, among
women aged 18–44, percentage and standard error (SE)
Covariates SPD MHT among women with SPD
Nonpregnant and
nonpostpartum (*80,400)1Pregnant
(*4,600)
Postpartum
(*8,000)
Nonpregnant and
nonpostpartum (*6,700)1Pregnant or
postpartum (*900)
Age group
18–25 9.4 (0.18) 8.2 (0.63) 8.0 (0.49) 39.4 (0.94) 40.6 (2.51)
26–34 7.2 (0.28) 3.2 (0.63) 4.5 (0.62) 56.3 (1.99) 50.5 (5.65)
35–44 5.9a,b (0.25) 0.8b,c (0.48) 3.2a,c (0.87) 61.3 (2.10) * (*)
Race/ethnicity
White 7.8 (0.17) 4.6 (0.51) 5.9 (0.52) 60.9 (1.11) 55.4 (3.79)
Black 8.0 (0.38) 7.5 (1.37) 6.7 (0.90) 37.1 (2.77) 34.7 (5.59)
Other 5.6 (0.43) 2.9 (0.93) 4.7 (1.50) 33.2 (3.40) * (*)
Hispanic 6.1 (0.33) 4.5 (0.87) 3.7 (0.64) 33.1 (2.73) * (*)
Marital status
Married 4.9a,b (0.20) 2.4b,c (0.43) 3.6a,c (0.43) 55.6 (2.14) 52.3 (5.02)
Widowed, divorced, or
separated
10.3 (0.47) 9.9 (2.17) 15.0 (3.05) 61.6 (2.44) * (*)
Never married 9.0 (0.20) 8.4 (0.83) 7.0 (0.57) 46.1d (1.18) 36.6 (3.15)
Education
Less than high school 12.1 (0.52) 9.1 (1.31) 6.5 (0.79) 43.5 (2.32) 41.1 (4.49)
High school 9.3 (0.29) 7.0 (0.96) 8.4 (0.94) 47.9 (1.59) 41.9 (4.49)
Some college 7.5 (0.26) 4.4 (0.78) 5.3 (0.70) 55.6 (1.66) 49.1 (4.97)
College graduate 3.6 (0.19) 1.1 (0.34) 2.2 (0.52) 61.8 (2.61) * (*)
Employment status
Employed full time 5.2 (0.17) 3.4 (0.47) 4.7 (0.61) 50.5 (1.74) 46.6 (5.39)
Employed part time 7.1 (0.27) 3.7 (0.73) 4.2 (0.65) 44.6 (1.98) 39.7 (5.26)
Unemployed 13.0 (0.59) 10.6 (2.22) 11.2 (1.93) 42.9 (2.42) * (*)
Other (including not in labor
force)
10.8 (0.39) 5.8 (0.82) 5.8 (0.60) 60.7d (1.72) 45.5 (4.20)
Income
\$20,000 11.8 (0.36) 9.3 (1.07) 8.7 (0.89) 51.4d (1.53) 42.0 (3.87)
$20,000–$49,999 7.9 (0.25) 5.7 (0.78) 6.0 (0.66) 48.8 (1.63) 43.6 (4.34)
$50,000–$74,999 5.6a (0.32) 2.6b,c (0.68) 5.2a (1.07) 58.9 (2.81) * (*)
C$75,000 4.3 (0.21) 1.6 (0.55) 2.2 (0.48) 51.6 (2.48) * (*)
Federal poverty level (FPL)
Below FPL 12.0 (0.39) 9.2 (1.20) 8.5 (0.84) 49.2d (1.62) 39.0 (3.87)
100–199 % FPL 8.7 (0.31) 6.1 (0.92) 4.9 (0.59) 50.3 (1.88) 50.7 (4.80)
C200 % FPL 5.3a,b (0.16) 2.5b,c (0.39) 3.9a,c (0.55) 54.0 (1.56) 51.8 (5.69)
Rapid repeat birth
Current N/A 5.9 (1.13) 6.1 (0.80) N/A 44.4 (5.43)
Past 5.9a (0.34) 2.0b,c (0.71) 6.4a (1.34) 52.4 (2.90) * (*)
Neither 7.7 (0.16) 4.9 (0.47) 5.1 (0.44) 51.3 (1.04) 47.8 (3.50)
Number of biological children
in the household
0 8.6a (0.20) 5.1c (0.55) N/A 48.4 (1.19) N/A
1 7.2 (0.33) 4.5 (0.65) 6.0 (0.57) 56.4d (2.32) 45.9 (4.28)
2 5.4 (0.27) 4.5 (1.16) 4.9 (0.67) 55.9d (2.87) 42.7 (5.94)
C3 6.5 (0.43) 5.2 (1.81) 5.2 (0.74) 52.5 (3.46) * (*)
Health insurance
Has insurance 6.8 (0.16) 4.5 (0.40) 5.3 (0.42) 56.5d (1.15) 49.4 (3.11)
Matern Child Health J
123

white; have health insurance; have a history of depression
or anxiety; and have used cigarettes in the past month
(Table 2). Not receiving MHT was associated with being
black or of an ‘‘other’’ race/ethnicity, and having never
been married. Age, education, employment, income, pov-
erty, rapid repeat birth, the number of biological children in
the household, health status and significant health prob-
lems, past year illicit drug use, and past year alcohol or
illicit drug use disorder were not associated with past year
MHT among pregnant and postpartum women with SPD.
Adjusted Odds of MHT Receipt
Postpartum women with past month SPD had significantly
greater odds of having MHT in the past year than pregnant
women (OR 1.77, p = 0.045), after controlling for age,
race/ethnicity, marital status, education, employment sta-
tus, poverty status, history of rapid repeat birth, number of
biological children in the household, health insurance,
physical health status, number of physical health problems,
history of depression or anxiety, past month cigarette use,
Table 1 continued
Covariates SPD MHT among women with SPD
Nonpregnant and
nonpostpartum (*80,400)1Pregnant
(*4,600)
Postpartum
(*8,000)
Nonpregnant and
nonpostpartum (*6,700)1Pregnant or
postpartum (*900)
Does not have insurance 9.3 (0.33) 7.6 (1.88) 6.0 (0.89) 37.4 (1.70) * (*)
Health status
Excellent 3.1 (0.17) 1.8 (0.34) 2.4 (0.44) 38.9 (2.96) * (*)
Very good 5.6 (0.19) 3.5 (0.50) 4.5 (0.57) 48.1 (1.72) 50.7 (4.95)
Good 9.8 (0.31) 8.8 (1.17) 7.7 (0.90) 49.7 (1.68) 44.5 (4.60)
Fair/poor 22.1 (0.81) 19.9 (4.14) 19.6 (2.81) 63.6 (1.90) * (*)
Health problems
None 6.2a,b (0.16) 3.5b,c (0.38) 4.7a,c (0.40) 46.4 (1.29) 44.4 (3.65)
One 9.3 (0.35) 9.5 (1.35) 6.6 (0.82) 53.6d (1.88) 43.3 (4.83)
Two or more 16.3 (0.86) * (*) 17.5 (3.98) 73.8 (2.43) * (*)
History of depression
Yes 22.5 (0.55) 16.3 (1.84) 18.6 (1.77) 74.9 (1.15) 73.6 (3.57)
No 4.1 (0.12) 3.1 (0.36) 3.3 (0.31) 23.6 (1.22) 21.6 (3.32)
History of anxiety
Yes 22.9 (0.61) 15.8 (2.21) 17.7 (2.30) 79.2 (1.21) 77.7 (4.02)
No 5.0 (0.13) 3.7 (0.39) 4.2 (0.34) 32.8 (1.22) 32.6 (3.13)
Past month cigarette use
Yes 13.1 (0.36) 11.8 (1.45) 10.9 (1.04) 55.9 (1.36) 55.6 (4.04)
No 5.1 (0.14) 3.5 (0.39) 3.8 (0.37) 47.1d (1.42) 38.4 (3.69)
Past year alcohol use
disorder
Yes 18.1 (0.68) 19.3 (3.05) 25.4 (4.98) 53.1 (2.10) * (*)
No 6.4 (0.14) 4.0 (0.39) 5.0 (0.37) 51.1d (1.12) 44.0 (3.06)
Past year illicit drug use
No illicit drug use 5.5 (0.15) 3.4 (0.39) 4.4 (0.38) 50.1d (1.33) 42.8 (3.39)
Illicit drug use, no SUD 11.1 (0.38) 8.3 (1.34) 10.6 (1.65) 50.9 (1.84) * (*)
Illicit drug SUD 32.2 (1.28) 31.2 (4.65) 31.0 (4.61) 58.4 (2.30) * (*)
Source: 2008–2010 (revised 3/12) and 2011–2012 SAMHSA National Surveys on Drug Use and Health (NSDUHs)
N/A not applicable, SUD substance use disorder, * low precision, no estimate reported1 SAMHSA does not permit the reporting of exact sample sizes from the restricted data file to protect against the accidental identification of
respondents. Totals may not equal pregnant and postpartum women separately due to roundinga Difference between estimate and pregnant SPD estimate, p \ 0.05b Difference between estimate and postpartum SPD estimate, p \ 0.05c Difference between estimate and Nonpregnant and Nonpostpartum SPD estimate, p \ 0.05d Difference between estimate and pregnant/postpartum MHT/counseling estimate, p \ 0.05
Matern Child Health J
123

Table 2 Correlates of past month SPD and past year use of MHT among pregnant and postpartum women, aged 18–44, percentage and standard
error (SE)
Characteristic Pregnant women Postpartum women Pregnant or postpartum women
with SPD
SPD
% (SE)
No SPD
% (SE)
SPD
% (SE)
No SPD
% (SE)
MHT
% (SE)
No MHT
% (SE)
Age group
18–25 65.3 (4.71)** 36.9 (1.08) 48.4 (3.53)** 31.8 (0.71) 47.4 (4.04) 59.1 (4.00)
26–34 32.5 (4.74)** 49.6 (1.26) 41.2 (3.87)* 50.1 (0.94) 42.2 (4.58) 35.2 (3.82)
35–44 2.3 (1.29)** 13.6 (1.00) 10.4 (2.63)** 18.1 (0.91) 10.3 (3.34) 5.7 (1.95)
Race/ethnicity
White 56.7 (4.24) 59.8 (1.32) 61.4 (3.48) 56.4 (1.03) 72.2 (3.60)** 49.4 (3.87)
Black 20.9 (3.44)* 13.1 (0.75) 17.0 (2.21) 13.6 (0.63) 13.8 (2.68)* 22.1 (2.83)
Other 4.6 (1.45)* 7.9 (0.90) 7.2 (2.19) 8.3 (0.61) 2.6 (0.73)* 9.6 (2.76)
Hispanic 17.7 (3.14) 19.2 (1.05) 14.5 (2.31)** 21.7 (0.92) 11.5 (2.61) 19.0 (2.75)
Marital status
Married 30.3 (4.30)** 62.8 (1.19) 42.2 (3.57)** 63.9 (0.94) 43.8 (4.38) 33.9 (3.70)
Widowed, divorced, or separated 13.2 (2.72)* 6.1 (0.61) 17.8 (3.32)** 5.7 (0.53) 20.2 (4.14) 13.0 (2.71)
Never married 56.5 (4.21)** 31.1 (1.09) 40.1 (3.30)** 30.3 (0.88) 36.1 (3.81)** 53.0 (3.73)
Education
Less than high school 31.2 (3.83)** 15.7 (0.87) 20.0 (2.35) 16.4 (0.75) 21.1 (2.90) 25.7 (2.86)
High school 37.8 (4.14)** 25.2 (1.11) 42.5 (3.52)** 26.5 (0.77) 37.3 (4.20) 43.9 (3.35)
Some college 24.2 (3.67) 26.4 (1.12) 25.2 (2.97) 25.6 (0.85) 26.7 (3.39) 23.5 (2.91)
College graduate 6.9 (2.14)** 32.6 (1.29) 12.3 (2.65)** 31.5 (0.94) 15.0 (3.59) 6.9 (1.81)
Employment status
Employed full time 29.3 (3.61)** 42.0 (1.24) 32.5 (3.42) 37.9 (0.93) 31.9 (4.33) 31.1 (3.20)
Employed part time 13.3 (2.51) 17.4 (0.94) 13.7 (1.97)* 17.9 (0.70) 11.8 (2.10) 15.2 (2.16)
Unemployed 15.6 (3.13)** 6.7 (0.47) 12.0 (2.09)** 5.5 (0.36) 15.0 (3.17) 11.6 (1.72)
Other (including not in labor force) 41.8 (4.21) 34.0 (1.19) 41.8 (3.33) 38.8 (0.89) 41.4 (3.96) 42.1 (3.49)
Income
\$20,000 44.2 (4.10)** 21.8 (0.97) 37.5 (3.46)** 22.6 (0.76) 36.2 (4.08) 42.5 (3.38)
$20,000–$49,999 37.2 (4.13) 31.3 (1.15) 35.6 (3.20) 32.2 (0.89) 34.2 (3.73) 37.7 (3.31)
$50,000–$74,999 8.8 (2.24)** 16.6 (0.92) 15.9 (3.01) 16.7 (0.74) 18.0 (4.06) 9.9 (1.88)
C$75,000 9.7 (3.09)** 30.2 (1.30) 11.0 (2.27)** 28.6 (0.94) 11.5 (3.13) 9.9 (2.10)
Federal poverty level (FPL)
Below FPL 43.6 (4.18)** 21.8 (1.02) 43.7 (3.65)** 27.0 (0.86) 37.0 (4.15) 49.2 (3.59)
100–199 % FPL 27.3 (3.64) 21.2 (1.02) 21.6 (2.53) 23.8 (0.76) 25.9 (3.42) 21.4 (2.62)
C200 % FPL 29.0 (3.74)** 57.0 (1.28) 34.6 (3.64)** 49.2 (1.00) 37.1 (4.37) 29.3 (3.53)
Rapid repeat birth
Current 23.6 (3.98) 19.0 (0.98) 22.0 (2.68) 19.4 (0.76) 21.8 (3.15) 23.2 (3.11)
Past 3.9 (1.37)** 9.8 (0.80) 12.5 (2.42) 10.4 (0.64) 7.9 (2.17) 11.4 (2.62)
Neither 72.5 (4.05) 71.2 (1.15) 65.6 (3.17) 70.1 (0.91) 70.4 (3.61) 65.5 (3.49)
Number of biological children in the household
0 43.9 (4.03) 41.4 (1.19) N/A N/A 12.3 (2.23) 15.5 (2.06)
1 30.2 (3.70) 32.3 (1.18) 43.1 (3.40) 38.6 (0.95) 38.8 (4.04) 38.9 (3.40)
2 15.7 (3.64) 16.9 (0.94) 30.7 (3.38) 33.9 (0.92) 24.1 (3.79) 27.5 (3.56)
C3 10.3 (3.36) 9.5 (0.84) 26.2 (3.22) 27.5 (0.90) 24.7 (3.97) 18.1 (3.16)
Health insurance
Insured 86.2 (3.10) 91.6 (0.78) 80.2 (2.68) 82.3 (0.77) 88.3 (3.08) * 76.9 (3.05)
Uninsured 13.8 (3.10) 8.4 (0.78) 19.8 (2.68) 17.7 (0.77) 11.7 (3.08) 23.1 (3.05)
Health status
Matern Child Health J
123

and past year alcohol and illicit drug use. The odds of past
year MHT was not significantly different among non-
pregnant/nonpostpartum women and pregnant women.
Discussion
In a nationally representative sample, the prevalence of
past month SPD was 4.8 % among pregnant women and
5.4 % among postpartum women. These prevalence esti-
mates appear lower than those reported by Ahluwalia,
Mack, and Mokdad (12.3 %) [20], Skari et al. [13] (9 %),
and Saurel-Cubizolles et al. [32] (8.7 %). However, there
are methodological differences that may account for dif-
ferences in prevalence and patterns over time. Our study
used the K6 instrument to detect SPD, whereas Skari et al.
[13] and Saurel-Cubizolles et al. [32] examined clinically
significant distress using the General Health Questionnaire,
and Ahluwalia et al. [20] used a measure of stress and
anxiety frequency from Health Related Quality of Life
indicators used in the Behavioral Risk Factor Surveillance
System. Thus, the prevalence estimates may reflect
differences in both instrumentation and the cut point for
distress. Furthermore, we report on the overall average
prevalence during the first year postpartum, whereas Skari
Table 2 continued
Characteristic Pregnant women Postpartum women Pregnant or postpartum women
with SPD
SPD
% (SE)
No SPD
% (SE)
SPD
% (SE)
No SPD
% (SE)
MHT
% (SE)
No MHT
% (SE)
Excellent 13.2 (2.35)** 35.8 (1.25) 13.9 (2.43)** 32.5 (0.92) 10.4 (2.11) 16.6 (2.76)
Very good 27.6 (3.41)** 38.6 (1.18) 33.5 (3.40)* 40.5 (0.91) 34.9 (4.29) 28.9 (2.83)
Good 42.1 (4.18)** 22.1 (0.95) 32.3 (3.25)** 22.2 (0.79) 34.2 (3.85) 36.3 (3.56)
Fair/poor 17.2 (3.44)** 3.5 (0.43) 20.3 (2.84)** 4.8 (0.42) 20.6 (3.42) 18.2 (2.89)
Health problems
0 56.8 (4.37)** 79.4 (0.96) 66.9 (3.08)** 78.7 (0.75) 61.5 (4.16) 65.7 (3.26)
1 36.6 (4.23)** 17.8 (0.91) 22.6 (2.60) 18.5 (0.73) 25.4 (3.56) 28.4 (3.06)
C2 6.6 (2.61) 2.8 (0.34) 10.4 (2.53)** 2.8 (0.28) 13.1 (3.38) 5.9 (1.91)
History of depression
Yes 44.3 (4.14)** 11.5 (0.75) 48.2 (3.39)** 12.2 (0.62) 75.1 (3.66)** 23.0 (2.96)
No 55.7 (4.14) 88.5 (0.75) 51.8 (3.39) 87.8 (0.62) 24.9 (3.66) 77.0 (2.96)
History of anxiety
Yes 29.3 (3.80)** 7.9 (0.62) 30.1 (3.42)** 8.0 (0.51) 50.4 (4.42)** 12.3 (2.12)
No 70.7 (3.80) 92.1 (0.62) 69.9 (3.42) 92.0 (0.51) 49.6 (4.42) 87.7 (2.12)
Past month cigarette use
Yes 39.4 (4.13)** 14.9 (0.82) 46.3 (3.51)** 21.7 (0.75) 53.3 (4.32)** 36.2 (3.29)
No 60.6 (4.13) 85.1 (0.82) 53.7 (3.51) 78.3 (0.75) 46.7 (4.32) 63.8 (3.29)
Past year alcohol use disorder
Yes 21.8 (3.32)** 4.6 (0.47) 10.3 (2.25)** 1.7 (0.21) 17.6 (3.42) 10.9 (1.87)
No 78.2 (3.32) 95.4 (0.47) 89.7 (2.25) 98.3 (0.21) 82.4 (3.42) 89.1 (1.87)
Past year illicit drug use
No illicit drug use 59.9 (4.08)** 86.6 (0.78) 72.2 (3.09)** 89.4 (0.55) 63.5 (4.08) 72.2 (2.87)
Illicit drug use, no SUD 19.8 (3.01)** 11.1 (0.73) 19.8 (2.90)** 9.6 (0.53) 21.2 (3.88) 18.7 (2.41)
Illicit drug SUD 20.3 (3.32)** 2.3 (0.27) 8.1 (1.39)** 1.0 (0.14) 15.3 (2.48) 9.1 (1.71)
Past year MHT
Yes 38.5 (4.04)** 10.4 (0.72) 49.5 (3.53)** 11.7 (0.60) 100 N/A
No 61.5 (4.04) 89.6 (0.72) 50.5 (3.53) 88.3 (0.60) N/A 100
Source: 2008–2010 (revised 3/12) and 2011–2012 SAMHSA National Surveys on Drug Use and Health (NSDUHs)
N/A not applicable, SUD substance use disorder, – low precision, no estimate reported
* Difference (t test of proportion) between SPD and no SPD or MHT and no MHT, p \ 0.05
** Difference (t test of proportion) between SPD and no SPD or MHT and no MHT, p \ 0.01
Matern Child Health J
123
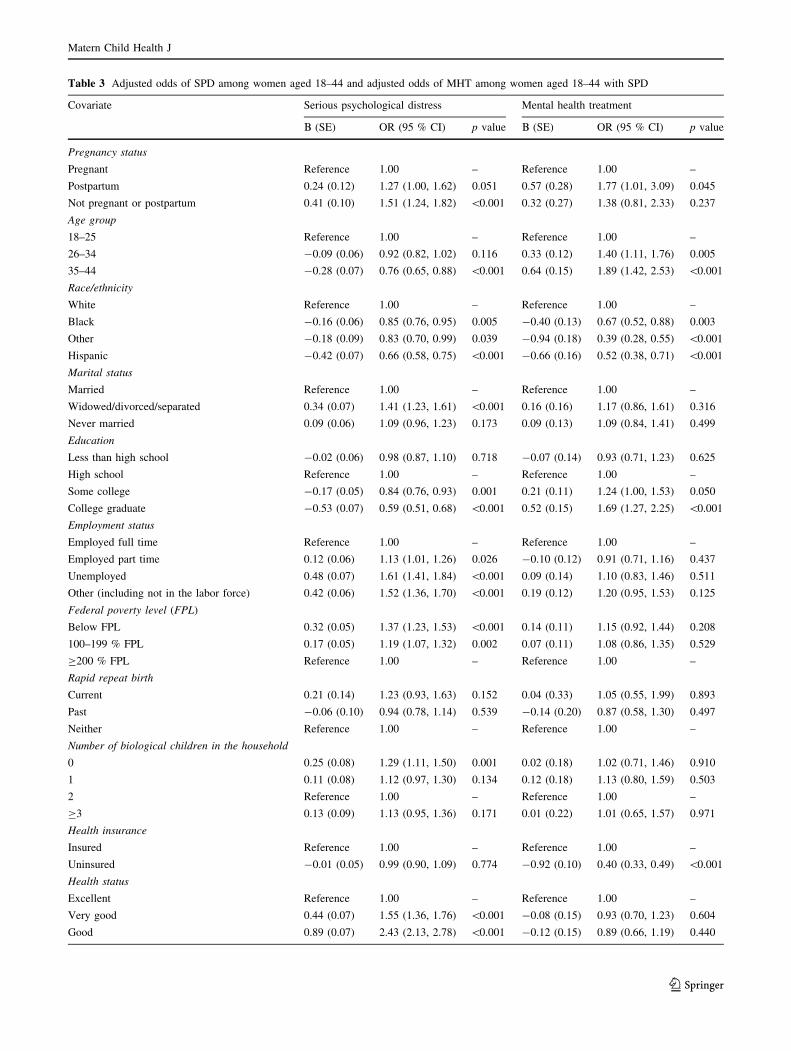
Table 3 Adjusted odds of SPD among women aged 18–44 and adjusted odds of MHT among women aged 18–44 with SPD
Covariate Serious psychological distress Mental health treatment
B (SE) OR (95 % CI) p value B (SE) OR (95 % CI) p value
Pregnancy status
Pregnant Reference 1.00 – Reference 1.00 –
Postpartum 0.24 (0.12) 1.27 (1.00, 1.62) 0.051 0.57 (0.28) 1.77 (1.01, 3.09) 0.045
Not pregnant or postpartum 0.41 (0.10) 1.51 (1.24, 1.82) \0.001 0.32 (0.27) 1.38 (0.81, 2.33) 0.237
Age group
18–25 Reference 1.00 – Reference 1.00 –
26–34 -0.09 (0.06) 0.92 (0.82, 1.02) 0.116 0.33 (0.12) 1.40 (1.11, 1.76) 0.005
35–44 -0.28 (0.07) 0.76 (0.65, 0.88) \0.001 0.64 (0.15) 1.89 (1.42, 2.53) \0.001
Race/ethnicity
White Reference 1.00 – Reference 1.00 –
Black -0.16 (0.06) 0.85 (0.76, 0.95) 0.005 -0.40 (0.13) 0.67 (0.52, 0.88) 0.003
Other -0.18 (0.09) 0.83 (0.70, 0.99) 0.039 -0.94 (0.18) 0.39 (0.28, 0.55) \0.001
Hispanic -0.42 (0.07) 0.66 (0.58, 0.75) \0.001 -0.66 (0.16) 0.52 (0.38, 0.71) \0.001
Marital status
Married Reference 1.00 – Reference 1.00 –
Widowed/divorced/separated 0.34 (0.07) 1.41 (1.23, 1.61) \0.001 0.16 (0.16) 1.17 (0.86, 1.61) 0.316
Never married 0.09 (0.06) 1.09 (0.96, 1.23) 0.173 0.09 (0.13) 1.09 (0.84, 1.41) 0.499
Education
Less than high school -0.02 (0.06) 0.98 (0.87, 1.10) 0.718 -0.07 (0.14) 0.93 (0.71, 1.23) 0.625
High school Reference 1.00 – Reference 1.00 –
Some college -0.17 (0.05) 0.84 (0.76, 0.93) 0.001 0.21 (0.11) 1.24 (1.00, 1.53) 0.050
College graduate -0.53 (0.07) 0.59 (0.51, 0.68) \0.001 0.52 (0.15) 1.69 (1.27, 2.25) \0.001
Employment status
Employed full time Reference 1.00 – Reference 1.00 –
Employed part time 0.12 (0.06) 1.13 (1.01, 1.26) 0.026 -0.10 (0.12) 0.91 (0.71, 1.16) 0.437
Unemployed 0.48 (0.07) 1.61 (1.41, 1.84) \0.001 0.09 (0.14) 1.10 (0.83, 1.46) 0.511
Other (including not in the labor force) 0.42 (0.06) 1.52 (1.36, 1.70) \0.001 0.19 (0.12) 1.20 (0.95, 1.53) 0.125
Federal poverty level (FPL)
Below FPL 0.32 (0.05) 1.37 (1.23, 1.53) \0.001 0.14 (0.11) 1.15 (0.92, 1.44) 0.208
100–199 % FPL 0.17 (0.05) 1.19 (1.07, 1.32) 0.002 0.07 (0.11) 1.08 (0.86, 1.35) 0.529
C200 % FPL Reference 1.00 – Reference 1.00 –
Rapid repeat birth
Current 0.21 (0.14) 1.23 (0.93, 1.63) 0.152 0.04 (0.33) 1.05 (0.55, 1.99) 0.893
Past -0.06 (0.10) 0.94 (0.78, 1.14) 0.539 -0.14 (0.20) 0.87 (0.58, 1.30) 0.497
Neither Reference 1.00 – Reference 1.00 –
Number of biological children in the household
0 0.25 (0.08) 1.29 (1.11, 1.50) 0.001 0.02 (0.18) 1.02 (0.71, 1.46) 0.910
1 0.11 (0.08) 1.12 (0.97, 1.30) 0.134 0.12 (0.18) 1.13 (0.80, 1.59) 0.503
2 Reference 1.00 – Reference 1.00 –
C3 0.13 (0.09) 1.13 (0.95, 1.36) 0.171 0.01 (0.22) 1.01 (0.65, 1.57) 0.971
Health insurance
Insured Reference 1.00 – Reference 1.00 –
Uninsured -0.01 (0.05) 0.99 (0.90, 1.09) 0.774 -0.92 (0.10) 0.40 (0.33, 0.49) \0.001
Health status
Excellent Reference 1.00 – Reference 1.00 –
Very good 0.44 (0.07) 1.55 (1.36, 1.76) \0.001 -0.08 (0.15) 0.93 (0.70, 1.23) 0.604
Good 0.89 (0.07) 2.43 (2.13, 2.78) \0.001 -0.12 (0.15) 0.89 (0.66, 1.19) 0.440
Matern Child Health J
123
et al. [13] report prevalence estimates a few days after
birth. Additionally, the study by Saurel-Cubizolles and
et al. [32] was conducted in France; cultural variation
potentially could affect the comparability of results.
Our finding that the prevalence of past month distress
was lower among pregnant and postpartum women than
among nonpregnant/nonpostpartum women was consistent
with other studies that have compared prevalence estimates
in these groups. Ahluwalia et al. [20] found that frequent
mental distress was more common among nonpregnant
women than among pregnant women. Similarly, Wallace
et al. [33] and Saurel-Cubizolles et al. [32] found that the
lowest prevalence of psychological distress was among
pregnant women, compared with postpartum and non-
pregnant/nonpostpartum women.
This study demonstrates a linear increase in past month
SPD prevalence in pregnant, postpartum, and nonpregnant/
nonpostpartum women who had at least one biological
child in the household. Previous within-person studies
generally have found women to have stable or decreasing
levels of psychological distress from pregnancy through
postpartum [10, 11, 13, 14, 34]. However, comparisons
must be made with caution because studies examining
symptom course in individuals often examine changes in
overall mean levels of psychological distress [10, 11, 14]
and not among individuals meeting a clinical cut point for
SPD. It may be that the patterns are different for women
reaching clinical thresholds than for women with lower
distress scores. Both of these possibilities present an
opportunity for future research.
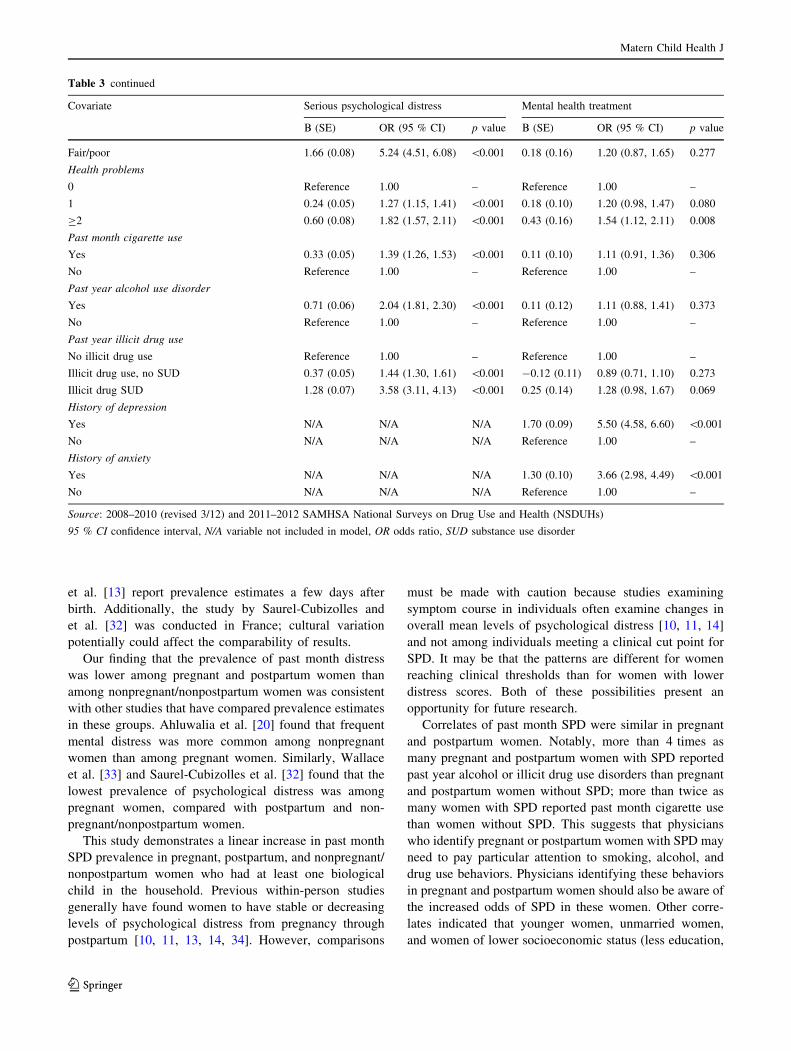
Correlates of past month SPD were similar in pregnant
and postpartum women. Notably, more than 4 times as
many pregnant and postpartum women with SPD reported
past year alcohol or illicit drug use disorders than pregnant
and postpartum women without SPD; more than twice as
many women with SPD reported past month cigarette use
than women without SPD. This suggests that physicians
who identify pregnant or postpartum women with SPD may
need to pay particular attention to smoking, alcohol, and
drug use behaviors. Physicians identifying these behaviors
in pregnant and postpartum women should also be aware of
the increased odds of SPD in these women. Other corre-
lates indicated that younger women, unmarried women,
and women of lower socioeconomic status (less education,
Table 3 continued
Covariate Serious psychological distress Mental health treatment
B (SE) OR (95 % CI) p value B (SE) OR (95 % CI) p value
Fair/poor 1.66 (0.08) 5.24 (4.51, 6.08) \0.001 0.18 (0.16) 1.20 (0.87, 1.65) 0.277
Health problems
0 Reference 1.00 – Reference 1.00 –
1 0.24 (0.05) 1.27 (1.15, 1.41) \0.001 0.18 (0.10) 1.20 (0.98, 1.47) 0.080
C2 0.60 (0.08) 1.82 (1.57, 2.11) \0.001 0.43 (0.16) 1.54 (1.12, 2.11) 0.008
Past month cigarette use
Yes 0.33 (0.05) 1.39 (1.26, 1.53) \0.001 0.11 (0.10) 1.11 (0.91, 1.36) 0.306
No Reference 1.00 – Reference 1.00 –
Past year alcohol use disorder
Yes 0.71 (0.06) 2.04 (1.81, 2.30) \0.001 0.11 (0.12) 1.11 (0.88, 1.41) 0.373
No Reference 1.00 – Reference 1.00 –
Past year illicit drug use
No illicit drug use Reference 1.00 – Reference 1.00 –
Illicit drug use, no SUD 0.37 (0.05) 1.44 (1.30, 1.61) \0.001 -0.12 (0.11) 0.89 (0.71, 1.10) 0.273
Illicit drug SUD 1.28 (0.07) 3.58 (3.11, 4.13) \0.001 0.25 (0.14) 1.28 (0.98, 1.67) 0.069
History of depression
Yes N/A N/A N/A 1.70 (0.09) 5.50 (4.58, 6.60) \0.001
No N/A N/A N/A Reference 1.00 –
History of anxiety
Yes N/A N/A N/A 1.30 (0.10) 3.66 (2.98, 4.49) \0.001
No N/A N/A N/A Reference 1.00 –
Source: 2008–2010 (revised 3/12) and 2011–2012 SAMHSA National Surveys on Drug Use and Health (NSDUHs)
95 % CI confidence interval, N/A variable not included in model, OR odds ratio, SUD substance use disorder
Matern Child Health J
123
lower income, unemployment, and poverty) had the highest
prevalence of past month SPD.
Perhaps the most important finding was that pregnant
women with past month SPD were less likely than post-
partum women to report MHT, even after we controlled for
potential confounders. These findings were similar to those
identified in the National Epidemiologic Survey on Alco-
hol and Related Conditions, which found that pregnant
women with psychiatric disorders were less likely to seek
MHT than were nonpregnant women with psychiatric
disorders [23]. This may be a result of the lack of screening
for mental health problems among obstetrical patients. For
example, Birndorf et al. [35] reported that among patients
in one obstetrical practice, only 30 % of women who
screened positive for depression had discussed the symp-
toms with their ob-gyn, although 82 % said they would be
willing to discuss the symptoms and all of them reported
that they would seek MHT if their ob-gyn referred them.
Other studies have reported similarly low rates of problem
recognition and treatment receipt [36, 37]. Examination of
the correlates of MHT among pregnant and postpartum
women with past month SPD indicated that non-Hispanic
black women and women of an ‘‘other’’ race, unmarried
women, and uninsured women had particularly low rates of
MHT although all women may benefit from screening.
There are a few limitations to this study that should be
acknowledged. First, NSDUH is a cross-sectional survey
and not appropriate for the individual course of psycho-
logical distress analyses. In NSDUH, individuals who may
have had elevated psychological distress in their first tri-
mester are not the same women with elevated distress in
the postpartum period. Thus, it is not possible to compare
the pattern of prevalence estimates directly to studies that
provide longitudinal analyses of distress over time.
Second, sample size limitations made comparisons of
each trimester and postpartum period imprecise, as evi-
denced by large confidence intervals. Moreover, the small
sample size necessitated combining pregnant and post-
partum women with SPD to examine correlates of MHT.
Although pregnant and postpartum women with SPD were
similar in most characteristics, there were a few significant
differences. Compared to pregnant women with SPD,
postpartum women with SPD were older, more likely to be
married, and less likely to have had a past year alcohol or
drug use disorder (results not shown). Future research with
a larger sample is needed to determine if there are unique
correlates of MHT in pregnant or postpartum women with
SPD.
Third, misclassification is a concern. NSDUH collects
data on past month psychological distress; therefore,
women who have just entered a new period (e.g., 1 week
into the first postpartum period) may be reporting distress
from the prior period. This is more likely to affect esti-
mates using the shorter time increments (trimester and
Fig. 2 Prevalence (and 95 % CI) of MHT among women with SPD, aged 18–44, by pregnancy or postpartum status: annual averages, National
Surveys on Drug Use and Health, 2008–2012. Source 2008–2010 (revised 3/12) and 2011–2012 SAMHSA NSDUHs
Matern Child Health J
123
postpartum months) than the combined pregnant and
postpartum categories. In addition, measures of MHT
reflect any treatment in the past year, so a woman who
reported MHT may have received that treatment before,
during, or after pregnancy. A similar misclassification can
be seen with past year alcohol use disorders and illicit drug
use. Pregnant women who report past year drug use may be
reporting use prior to pregnancy, whereas postpartum
women reporting use are almost assuredly reporting use
during pregnancy or the postpartum period. Additional
misclassification may have arisen if women who put
newborns up for adoption were classified as being non-
pregnant/nonpostpartum. However, results from the
National Survey of Family Growth suggest that voluntary
placement of infants is rare [38]. Women who experienced
miscarriages, abortions, or infant deaths also may have
been misclassified as being nonpregnant/nonpostpartum
women.
In these analyses, response bias may have arisen if
women close to delivery were less likely to participate in
NSDUH. Evaluation of the unweighted frequency of
response for each month of pregnancy suggests that this
may have occurred: 13.2 % of pregnant women reported
being in their eighth month of pregnancy, whereas only
7.1 % of pregnant women were in their ninth month. If past
month SPD or past year MHT in pregnant or postpartum
women was associated with this potential nonresponse, the
direction and magnitude of this bias would be unknown.
Even if this potential response bias were not related to SPD
or MHT, it would still result in decreased statistical power.
Despite these limitations, the prevalence of past month
SPD in pregnant and postpartum women is not negligible.
An estimated 4.8 % of pregnant women and 5.4 % of
postpartum women had SPD; this equates to an estimated
111,000 pregnant and 234,000 postpartum women annu-
ally. Moreover, of the women with SPD, more than half did
not receive MHT in the past year. Pregnancy and the
postpartum period are times of increased contact with
medical professionals, providing opportunities for mental
health screening and referral to treatment. Some practitio-
ners have recommended [39, 40] and implemented [41, 42]
screening and intervention programs; however, the results
of this study suggest that there is room for improvement.
Acknowledgments The authors would like to acknowledge Chris-
tine Ulbricht for her contributions in the early design phase of this
project. The National Survey on Drug Use and Health (NSDUH) is
funded by the Substance Abuse and Mental Health Services Admin-
istration (SAMHSA), Center for Behavioral Health Statistics and
Quality (CBHSQ). This study was funded and approved under
SAMHSA Contract No. 284-2010-0003C, Project No. 0212800.002,
which was supported by funding from the National Institute of Mental
Health (NIMH). The views expressed in this manuscript do not
necessarily represent the views of the National Institutes of Health or
the Federal Government.
References
1. Henrichs, J., Schenk, J. J., Roza, S. J., van den Berg, M. P.,
Schmidt, H. G., Steegers, E. A. P., et al. (2010). Maternal psy-
chological distress and fetal growth trajectories: The generation R
study. Psychological Medicine: A Journal of Research in Psy-
chiatry and the Allied Sciences, 40(4), 633–643. doi:10.1017/
s0033291709990894.
2. Anhalt, K., Telzrow, C. F., & Brown, C. L. (2007). Maternal
stress and emotional status during the perinatal period and
childhood adjustment. School Psychology Quarterly, 22(1),
74–90. doi:10.1037/1045-3830.22.1.74.
3. Hedegaard, M., Henriksen, T. B., Sabroe, S., & Secher, N. J.
(1993). Psychological distress in pregnancy and preterm delivery.
BMJ, 307(6898), 234–239.
4. Seckl, J. R., & Holmes, M. C. (2007). Mechanisms of disease:
Glucocorticoids, their placental metabolism and fetal ‘‘program-
ming’’ of adult pathophysiology. Nature Clinical Practice
Endocrinology & Metabolism, 3(6), 479–488. doi:10.1038/
ncpendmet0515.
5. Singer, L. T., Fulton, S., Davillier, M., Koshy, D., Salvator, A., &
Baley, J. E. (2003). Effects of infant risk status and maternal
psychological distress on maternal-infant interactions during the
first year of life. Journal of Developmental and Behavioral
Pediatrics, 24(4), 233–241.
6. Furber, C. M., Garrod, D., Maloney, E., Lovell, K., & McGowan,
L. (2009). A qualitative study of mild to moderate psychological
distress during pregnancy. International Journal of Nursing
Studies, 46(5), 669–677. doi:10.1016/j.ijnurstu.2008.12.003.
7. Gameiro, S., Moura-Ramos, M., & Canavarro, M. C. (2009).
Maternal adjustment to the birth of a child: Primiparity versus
multiparity. Journal of Reproductive and Infant Psychology,
27(3), 269–286. doi:10.1080/02646830802350898.
8. Brennan, P. A., Hammen, C., Andersen, M. J., Bor, W., Najman,
J. M., & Williams, G. M. (2000). Chronicity, severity, and timing
of maternal depressive symptoms: Relationships with child out-
comes at age 5. Developmental Psychology, 36(6), 759.
9. Kurstjens, S., & Wolke, D. (2001). Effects of maternal depression
on cognitive development of children over the first 7 years of life.
Journal of Child Psychology and Psychiatry, 42(5), 623–636.
10. DiPietro, J. A., Costigan, K. A., & Sipsma, H. L. (2008). Con-
tinuity in self-report measures of maternal anxiety, stress, and
depressive symptoms from pregnancy through two years post-
partum. Journal of Psychosomatic Obstetrics & Gynecology,
29(2), 115–124. doi:10.1080/01674820701701546.
11. Kearns, R. A., Neuwelt, P. M., Hitchman, B., & Lennan, M.
(1997). Social support and psychological distress before and after
childbirth. Health and Social Care in the Community, 5(5),
296–308. doi:10.1111/j.1365-2524.1997.tb00126.x.
12. Romito, P., Saurel-Cubizolles, M. J., & Lelong, N. (1999). What
makes new mothers unhappy: Psychological distress one year
after birth in Italy and France. Social Science and Medicine,
49(12), 1651–1661. doi:10.1016/s0277-9536(99)00238-5.
13. Skari, H., Skreden, M., Malt, U. F., Dalholt, M., Ostensen, A. B.,
Egeland, T., et al. (2002). Comparative levels of psychological
distress, stress symptoms, depression and anxiety after child-
birth—A prospective population-based study of mothers and
fathers. BJOG: An International Journal of Obstetrics and
Gynaecology, 109(10), 1154–1163.
14. Stemp, P. S., Turner, R. J., & Noh, S. (1986). Psychological
distress in the postpartum period: The significance of social
support. Journal of Marriage & the Family, 48(2), 271–277.
doi:10.2307/352394.
15. DeMier, R. L., Hynan, M. T., Hatfield, R. F., Varner, M. W.,Harris, H. B., & Manniello, R. L. (2000). A measurement model
Matern Child Health J
123

of perinatal stressors: Identifying risk for postnatal emotional
distress in mothers of high-risk infants. Journal of Clinical Psy-
chology, 56(1), 89–100. doi:10.1002/(sici)1097-4679(200001)56:
1\89:aid-jclp8[3.0.co;2-6.
16. Romito, P., Pomicino, L., Lucchetta, C., Scrimin, F., & Turan, J.
M. (2009). The relationships between physical violence, verbal
abuse and women’s psychological distress during the postpartum
period. Journal of Psychosomatic Obstetrics and Gynaecology,
30(2), 115–121.
17. Fottrell, E., Kanhonou, L., Goufodji, S., Behague, D. P., Mar-
shall, T., Patel, V., et al. (2010). Risk of psychological distress
following severe obstetric complications in Benin: The role of
economics, physical health and spousal abuse. British Journal of
Psychiatry, 196(1), 18–25. doi:10.1192/bjp.bp.108.062489.
18. Saurel-Cubizolles, M.-J., Romito, P., Ancel, P.-Y., & Lelong, N.
(2000). Unemployment and psychological distress one year after
childbirth in France. Journal of Epidemiology and Community
Health, 54(3), 185–191. doi:10.1136/jech.54.3.185.
19. McCormick, M. C., Brooks-Gunn, J., Shorter, T., Holmes, J. H.,
Wallace, C. Y., & Heagarty, M. C. (1990). Factors associated
with smoking in low-income pregnant women: Relationship to
birth weight, stressful life events, social support, health behaviors
and mental distress. Journal of Clinical Epidemiology, 43(5),
441–448.
20. Ahluwalia, I. B., Mack, K. A., & Mokdad, A. (2004). Mental and
physical distress and high-risk behaviors among reproductive-age
women. Obstetrics and Gynecology, 104(3), 477–483.
21. Flynn, H. A., Marcus, S. M., Barry, K. L., & Blow, F. C. (2003).
Rates and correlates of alcohol use among pregnant women in
obstetrics clinics. Alcoholism, 27(1), 81–87. doi:10.1097/
00000374-200301000-00014.
22. des Rivieres-Pigeon, C., Saurel-Cubizolles, M.-J., & Lelong, N.
(2004). Considering a simple strategy for detection of women at
risk of psychological distress after childbirth. Birth, 31(1), 34–42.
doi:10.1111/j.0730-7659.2004.0272.x.
23. Vesga-Lopez, O., Blanco, C., Keyes, K., Olfson, M., Grant, B. F.,
& Hasin, D. S. (2008). Psychiatric disorders in pregnant and
postpartum women in the United States. Archives of General
Psychiatry, 65(7), 805–815. doi:10.1001/archpsyc.65.7.805.
24. Substance Abuse and Mental Health Services Administration.
(2013). Results from the 2012 National Survey on Drug Use and
Health: Summary of national findings. (NSDUH Series H-46,
HHS Publication No. (SMA) 13-4795). Rockville, MD: Sub-
stance Abuse and Mental Health Services Administration.
25. Kessler, R. C., Barker, P. R., Colpe, L. J., Epstein, J. F., Gfroerer,
J. C., Hiripi, E., et al. (2003). Screening for serious mental illness
in the general population. Archives of General Psychiatry, 60(2),
184–189.
26. Kessler, R. C., Green, J. G., Gruber, M. J., Sampson, N. A., Bromet,
E., Cuitan, M., et al. (2010). Screening for serious mental illness in
the general population with the K6 screening scale: Results from the
WHO World Mental Health (WMH) survey initiative. International
Journal of Methods in Psychiatric Research, 19(S1), 4–22.
27. Pratt, L. A. (2009). Serious psychological distress, as measured by
the K6, and mortality. Annals of Epidemiology, 19(3), 202–209.
28. Wittchen, H.-U. (2010). Screening for serious mental illness: Meth-
odological studies of the K6 screening scale. International Journal of
Methods in Psychiatric Research, 19(S1), 1–3. doi:10.1002/mpr.316.
29. US Department of Health and Human Services. (2000). Familyplanning. Healthy people 2010: Understanding and improving
health. (2nd ed., pp. 9-3–9-34). Washington, DC: US Govern-
ment Printing Office.
30. Substance Abuse and Mental Health Services Administration.
(2012, October 2013). 2011 National Survey on Drug Use and
Health Statistical Inference Report. Retrieved February 19, 2014,
from http://www.samhsa.gov/data/2k12/NSDUH2011MRB/
NSDUHmrbStatInference2011.pdf.
31. RTI International. (2008). SUDAAN�(Version Release 10.0).
Research Triangle Park, NC: RTI International.
32. Saurel-Cubizolles, M.-J., Romito, P., & Lelong, N. (2007).
Women’s psychological health according to their maternal status:
A study in France. Journal of Psychosomatic Obstetrics and
Gynaecology, 28(4), 243–249.
33. Wallace, C., Burns, L., Gilmour, S., & Hutchinson, D. (2007).
Substance use, psychological distress and violence among preg-
nant and breastfeeding Australian women. Australian and New
Zealand Journal of Public Health, 31(1), 51–56.
34. Glasheen, C., Richardson, G. A., Kim, K. H., Larkby, C. A.,
Swartz, H. A., & Day, N. L. (2013). Exposure to maternal pre-
and postnatal depression and anxiety symptoms: Risk for major
depression, anxiety disorders, and conduct disorder in adolescent
offspring. Development and Psychopathology, 25(4 Pt 1),
1045–1063. doi:10.1017/S0954579413000369.
35. Birndorf, C. A., Madden, A., Portera, L., & Leon, A. C. (2002).
Psychiatric symptoms, functional impairment, and receptivity
toward mental health treatment among obstetrical patients. The
International Journal of Psychiatry in Medicine, 31(4), 355–365.
36. Smith, M. V., Rosenheck, R. A., Cavaleri, M. A., Howell, H. B.,
Poschman, K., & Yonkers, K. A. (2004). Screening for and
detection of depression, panic disorder, and PTSD in public-
sector obstetric clinics. Psychiatric Services, 55(4), 407–414.
37. Kelly, R. H., Zatzick, D. F., & Anders, T. F. (2001). The
detection and treatment of psychiatric disorders and substance use
among pregnant women cared for in obstetrics. American Journal
of Psychiatry, 158(2), 213–219.
38. Children’s Bureau of the Administration for Children and Fam-
ilies. (2005). Voluntary relinquishment for adoption. Washington,
DC: US Department of Health and Human Services. Retrieved
from http://www.childwelfare.gov/pubs/s_place.pdf.
39. Austin, M. P. (2004). Antenatal screening and early intervention
for ‘‘perinatal’’ distress, depression and anxiety: Where to from
here? Archives of Women’s Mental Health, 7(1), 1–6. doi:10.
1007/s00737-003-0034-4.
40. Buist, A. (2002). Mental health in pregnancy: The sleeping giant.
Australasian Psychiatry, 10(3), 203–206. doi:10.1046/j.1440-
1665.2002.00448.x.
41. Chabrol, H., Teissedre, F., Saint-Jean, M., Teisseyre, N., Roge,
B., & Mullet, E. (2002). Prevention and treatment of post-partum
depression: A controlled randomized study on women at risk.
Psychological Medicine: A Journal of Research in Psychiatry
and the Allied Sciences, 32(6), 1039–1047.
42. Dennis, C. L. (2003). The effect of peer support on postpartum
depression: A pilot randomized controlled trial. Canadian Jour-
nal of Psychiatry, 48(2), 115–124.
Matern Child Health J
123


![The Incidence of Postpartum Hemorrhage in Pregnant … · between endometrial damage and uterine scarring and subsequent placenta previa [4]. Mean-while, the condition is frequently](https://img.pdfslide.us/doc/110x75/5ba8e78509d3f2f51d8b4ab9/the-incidence-of-postpartum-hemorrhage-in-pregnant-between-endometrial-damage.jpg)