Embed Size (px)
Citation preview
ORIGINAL RESEARCH
Prevalence of Lower Urinary Tract Symptomsin China, Taiwan, and South Korea: Resultsfrom a Cross-Sectional, Population-Based Study
Christopher Chapple . David Castro-Diaz . Yao-Chi Chuang .
Kyu-Sung Lee . Limin Liao . Shih-Ping Liu . Jianye Wang .
Tag Keun Yoo . Romeo Chu . Budiwan Sumarsono
Received: March 24, 2017 / Published online: July 7, 2017� The Author(s) 2017. This article is an open access publication
ABSTRACT
Introduction: Few population-based data areavailable evaluating the prevalence of lowerurinary tract symptoms (LUTS) in Asia. Theobjective of our study was to determine LUTSprevalence in China, Taiwan, and South Koreausing International Continence Society (ICS)2002 criteria.
Methods: An Internet-based self-administeredsurvey among individuals aged at least 40 yearswith the ability to use a computer and to readthe local language. Survey questions includedICS symptom definitions and the internationalprostate symptom score (IPSS). Data analysiswas based on descriptive statistics and post hocsignificance testing.Results: There were 8284 participants, ofwhom 51% were women and 34% were aged atleast 60 years. LUTS prevalence was slightlyhigher in men than women (62.8% vs. 59.6%;p = 0.004), increasing significantly with age(p = 0.001). All three ICS symptom groups(voiding, storage, and post-micturition) werepresent in 35% of individuals with LUTS.Symptoms with the highest overall prevalence
Enhanced content To view enhanced content for thisarticle go to http://www.medengine.com/Redeem/BD98F060172EF0B3.
Electronic supplementary material The onlineversion of this article (doi:10.1007/s12325-017-0577-9)contains supplementary material, which is available toauthorized users.
C. ChappleDepartment of Urology, Royal Hallamshire Hospital,Sheffield, UK
D. Castro-Diaz (&)Department of Urology, Hospital Universitario deCanarias, Universidad de La Laguna, Santa Cruz deTenerife, Canarias, Spaine-mail: [email protected]
Y.-C. ChuangDepartment of Urology, Kaohsiung Chang GungMemorial Hospital, Chang Gung University Collegeof Medicine, Kaohsiung, Taiwan
K.-S. LeeDepartment of Urology, Samsung Medical Center,Sungkyunkwan University School of Medicine,Seoul, Korea
L. LiaoDepartment of Urology, China RehabilitationResearch Center, Capital Medical University,Beijing, China
S.-P.LiuDepartment of Urology, National Taiwan UniversityHospital and College of Medicine, Taipei, Taiwan
J. WangUrology, Beijing Hospital, Beijing, China
T. K. YooDepartment of Urology, Nowon Eulji MedicalCenter, Eulji University School of Medicine, 68,Hangeulbiseok-ro, Nowon-gu, Seoul, Korea
Adv Ther (2017) 34:1953–1965
DOI 10.1007/s12325-017-0577-9
were nocturia, frequency, incomplete empty-ing, and terminal dribble. The most bothersomesymptoms were terminal dribble, nocturia, andurgency. According to IPSS scores, 87% of par-ticipants had at least mild symptoms; 43% ofthose aged over 60 years had moderate/severesymptoms. The percentage of participants withany LUTS who had visited healthcare profes-sionals because of urinary symptoms was 26%,rising to 45% amongst individuals with all threesymptom groups (p = 0.001 vs. other ICSsymptom groups).Conclusions: LUTS are highly prevalent in menand women aged at least 40 years who partici-pated in this study in China, Taiwan, and SouthKorea and increases with increasing age. Aminority of individuals with LUTS seek health-care and our results suggest an increased patientawareness of LUTS is required.Funding: Astellas Pharma Singapore Pte. Ltd.Trial registration: ClinicalTrials.gov identifier,NCT02618421.
Keywords: China; Lower urinary tractsymptoms; Prevalence; Republic of Korea;Taiwan; Urology
INTRODUCTION
Lower urinary tract symptoms (LUTS) include avariety of storage, voiding, and post-micturitionsymptoms [1, 2]. Both overactive bladder symp-tom complex (OAB; urinary urgency, with orwithout urgency incontinence, usually withincreased urinary frequency and nocturia) andstress incontinence comprise the main storagesymptoms; voiding symptoms include slow orinterrupted stream, terminal dribble, hesitancyand straining; while incomplete emptying andpost-micturition dribble are the key post-mic-turition symptoms. In men, symptoms may be
related to prostate dysfunction, bladder dysfunc-tion, other structural or functional abnormalitiesof the urinary tract and surrounding tissues, ornon-urological conditions (e.g.,nocturia) [3].Thismultifactorial etiology of LUTS inmen is reflectedin the different pharmacological agents used tomanage symptoms, which include alpha-adren-ergic blocking agents, 5-alpha reductase inhibi-tors, and phosphodiesterase 5 inhibitors [3]. OABtends to be viewed as the main cause of LUTS inwomen and is recognized as themost bothersomecomponent of male LUTS. In both sexes, OABgenerally responds to anticholinergic medica-tions or the b3-adrenergic agonist mirabegron [4].
LUTS affect a significant proportion of adultsand are associated with impaired quality of life(QoL) [5–7]. LUTSprevalence from large studies inEurope and North America exceeds 60%, with aslightly higher overall prevalence in women thanmen [8, 9]. However, prevalence is age-relatedand, over the age of 70 years, LUTS are morecommon in men than women although urinaryincontinence remains more prevalent in women[9]. Recognition of LUTS has increased in bothsexes in recent years, including underactivebladder among those aged over 60 years. TheEpiLUTS study showed that symptoms are oftenbothersome: at least half of participants withsymptoms occurring at least ‘‘sometimes’’ werebothered ‘‘somewhat’’ or more [8]. In Asia, fewsuch population-based studies have been per-formed [10, 11], symptomdefinitions have variedbetween studies [9], and no international studyhas been performed in both men and women inAsia using the symptom definitions recom-mended by the International Continence Society(ICS) in 2002 [1]. Consequently, our understand-ing of the true burden of LUTS in Asia is limited.
We performed this study to evaluate for thefirst time the overall prevalence of LUTS in adultsaged at least 40 years in China, Taiwan, andSouth Korea, using ICS symptom definitions [1].
METHODS
Study Design and Population
This was a cross-sectional, population-repre-sentative, Internet-based study conducted
R. Chu � B. SumarsonoAstellas Pharma Singapore Pte. Ltd, Singapore,Singapore
Present Address:R. Chu5 Pemimpin Drive, #19-03 Seasons View, Singapore576149, Singapore
1954 Adv Ther (2017) 34:1953–1965
among men and women aged at least 40 yearsin China, Taiwan, and South Korea betweenJune 2, 2015 and July 20, 2015. Ability to accessthe Internet, to use a computer (with help, ifrequired), and to read the local language wereinclusion criteria. Participants who were preg-nant at the time of the survey or who had aurinary tract infection within the precedingmonth were excluded.
As this study was based on a survey, it wasnot considered necessary to submit forinstitutional review board approval. However,principles of the Declaration of Helsinki werefollowed; the study was performed in compli-ance with Good Clinical Practice and marketresearch guidelines (Appendix 1 in the onlinesupplementary material). All participants pro-vided informed consent before participating inthe study.
Prior to use, quality checks and analysis wereundertaken during six cycles of survey testingusing a team of researchers with a healthcarebackground. Participants were selected viaconsumer survey panels (e-mail invitationsautomatically randomized to prevalidated indi-viduals) that were actively managed to repre-sent the target population, with respect to age,sex, and socioeconomic factors. Cohort man-agement accounted for sex, income, age group,and geography, with the last of these restrictedto urban areas. Participants received a securelink and log-in details to access the survey andhad to provide informed consent before theycould start to answer questions. Weekly remin-ders were sent during the survey timeframe tothose who had not completed the survey. Thequestionnaire was over a total of 111 screens,including the informed consent page. Selectionof one response was enforced for all questionsapart from the optional section concerningsexual health. While undertaking the surveyand before submission of the completed surveyrespondents were able to review and changetheir answers using a back button.
Proprietary algorithms and browser fin-ger-printing technology involving IP addressrecognition were used to block the same personfrom responding multiple times to the surveyby using different user credentials (avoiding theneed to analyze log file data) and for anyone
proceeding too fast through the survey (com-pletion time less than 30% of the median lengthof the survey). De-identification of data wasundertaken, with only a numerical identifica-tion available for analysis. Checking for con-tradictory answers was completed by healthcareanalysts’ post-data collection and all responseswere valid.
Endpoints
A sample of the survey is presented in theonline supplementary material (Appendix 2).Participants were asked eight screening andgeneral demographic questions, including sex,age, marital status, level of education, andemployment status. Nine questions were usedto evaluate general health and medical comor-bidities. For some personal questions, such asmarital status, respondents were given theoption not to answer. Instruments/topicsincluded the international prostate symptomscore (IPSS), other ICS symptoms questions (re-lated to splitting/spraying, hesitancy, terminaldribble, urgency), and the patient perception ofbladder condition (PPBC). All instruments werevalidated in the local language. Further detailsabout each scale are included in Appendix 3 inthe online supplementary material.
Presence of LUTS was defined as the presenceof voiding, storage, or post-micturition symp-tom(s) with a frequency of at least one in fivetimes. This was in accordance with ICS criteria,except that nocturia was defined as at least twoepisodes per night during the preceding month(the ICS definition of at least one episode pernight could lead to an artificially high LUTSprevalence in the general population) [1].Additional information was collected, such ascomorbidities, visits to healthcare professionals,and current medication.
The primary objective was to determineLUTS prevalence in the population aged at least40 years, in China, Taiwan, and South Korea,using ICS 2002 symptom definition (presence ofat least one of voiding, storage, or post-mic-turition symptoms) [1]. Secondary objectivesincluded assessment of the symptom-specificbother of LUTS and exploration of the
Adv Ther (2017) 34:1953–1965 1955
differences in prevalence of LUTS across menand women, age groups, different socioeco-nomic strata, and countries.
Statistical Analysis
To estimate the proportion of patients with agiven response to LUTS to a precision of fivepercentage points, it was calculated that at least384 respondents per group was needed. Foranalysis of five age groups, a minimum samplesize of 1920 per country (5760 in total) wasrequired. Assuming that approximately 28% ofdata would be non-evaluable due to missing orinconsistent information, total enrollment of8000 respondents was planned across the threecountries.
The initial data analyses were based ondescriptive statistics. Post-stratification weight-ing matched the population distribution (ageand sex) per country. Post hoc statistical com-parisons were based on the Chi square test, withthe exception of differences in LUTS prevalence(based on ICS criteria) according to work status,which were assessed using Fisher’s exact test.The Spearman method was used to investigatethe relationship between IPSS and PPBC.
RESULTS
Survey Sample
The survey sample and response rate are pro-vided in Table S1 in the online supplementarymaterial. Of the 8284 survey participants, 50.8%were women and 34.4% were aged at least60 years (Table 1). Most respondents (approxi-mately 90%) answered all of the questions.
Overall Prevalence
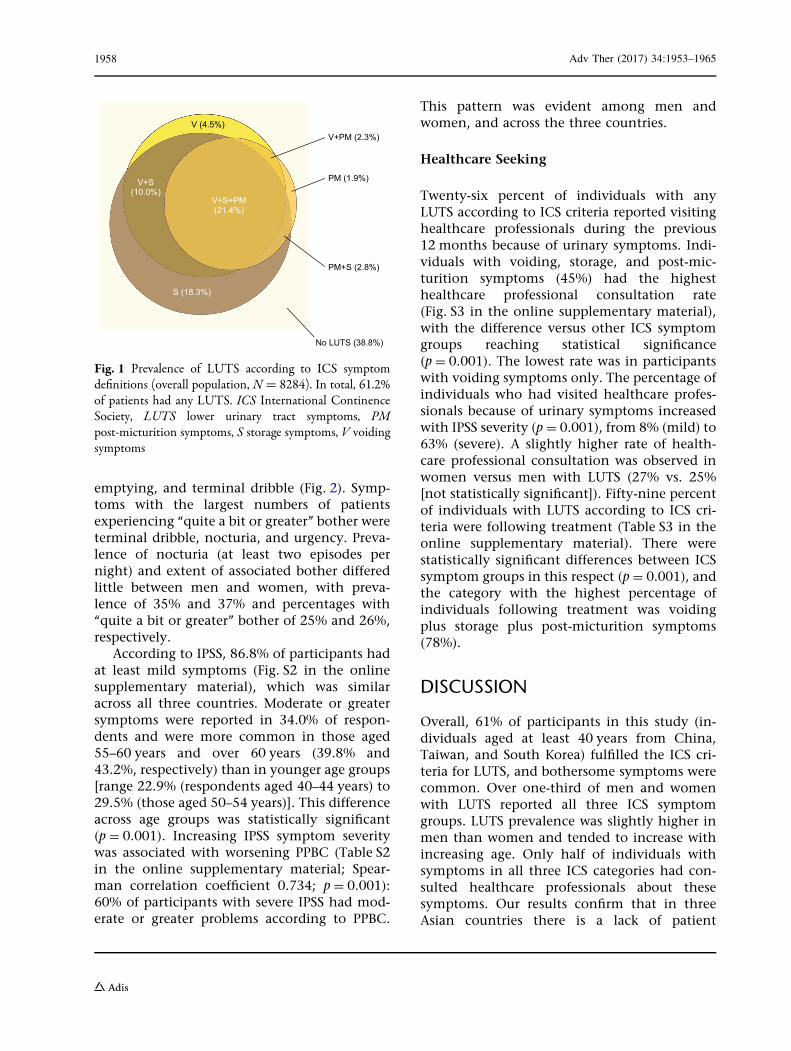
The overall prevalence of LUTS according to ICScriteria was 61.2% (Fig. 1). Prevalence in SouthKorea (68.2%) was higher than in China(59.0%) or Taiwan (58.5%) (p = 0.001). In par-ticipants with LUTS, the most common combi-nation of ICS symptom groups was all threegroups (35.0%); post-micturition symptoms
only or voiding symptoms only were experi-enced by 3.0% and 7.3%. Storage symptomscommonly occurred alone (29.9% of partici-pants with LUTS).
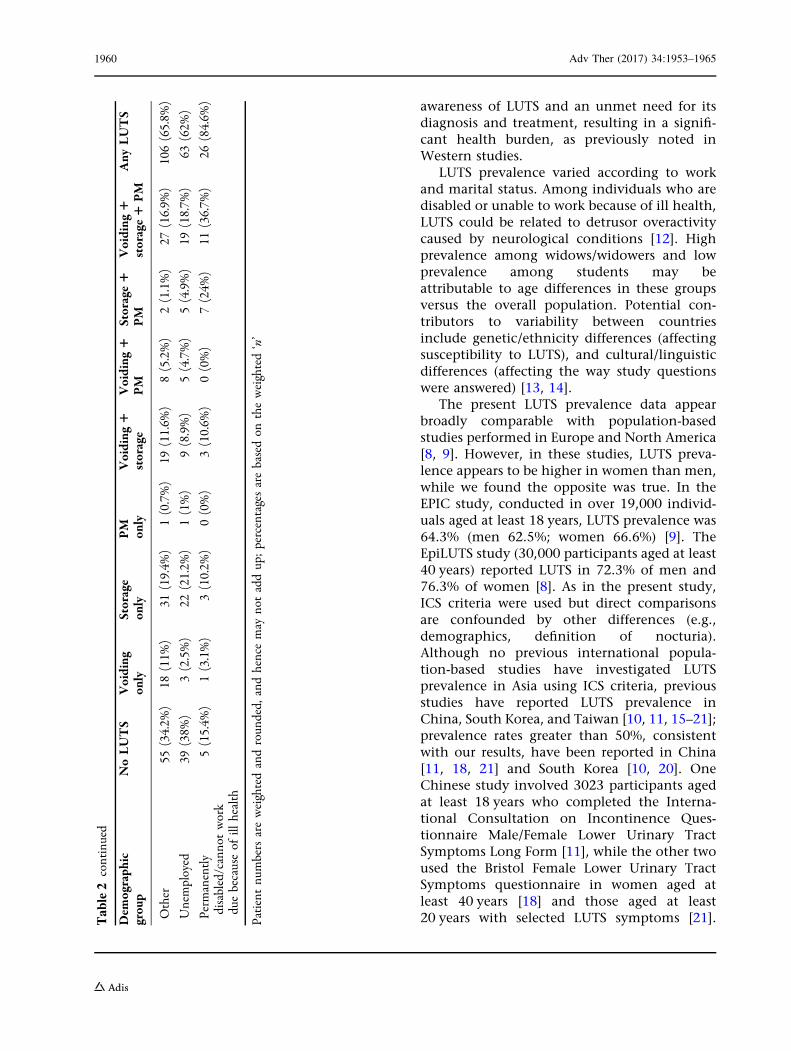
Prevalence by DemographicCharacteristics
LUTS were more prevalent among men (62.8%)than women (59.7%) (p = 0.004; Table 2).Prevalence of storage symptoms only washigher in women than men (23.8% versus12.6%, respectively). Conversely, more menhad voiding symptoms only (7.2%) orpost-micturition symptoms only (2.1%) thanwomen (1.8% and 1.6%, respectively). LUTSprevalence increased significantly with age from49.9% (age 40–44 years) to 69.7% (age over60 years) in the overall population (p = 0.001;Table 2); this trend was more marked amongwomen than men in China and Taiwan, but itwas not evident in South Korean participants.LUTS prevalence was affected by marital andwork status (p = 0.001 for both) but not educa-tion (Table 2). Marital status with the highestLUTS prevalence was being a widow or widower(66.8%) and that with the lowest prevalencewas being single (54.1%). Regarding work sta-tus, LUTS prevalence was highest among per-manently disabled individuals or those unableto work because of ill health (84.6%), and low-est among students (48.8%).
Prevalence by Comorbid Conditions
All comorbid conditions analyzed were associ-ated with statistically significantly increasedLUTS prevalence (p B 0.001; Fig. S1 in theonline supplementary material). Diabetes andneurological disease were associated with thegreatest increases in LUTS prevalence betweenindividuals with and without the comorbidity(differences of 26.5% and 26.1%, respectively).
Prevalence of Symptoms and AssociatedBother
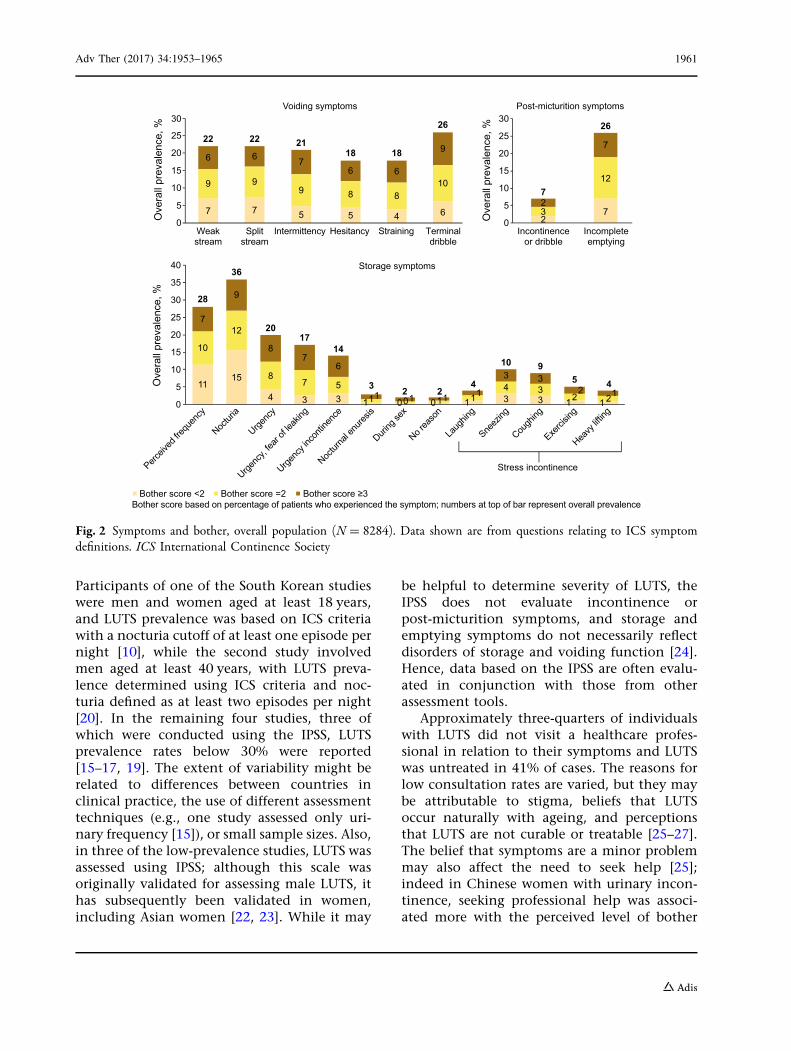
Symptoms with the highest overall prevalencewere nocturia, frequency, incomplete
1956 Adv Ther (2017) 34:1953–1965
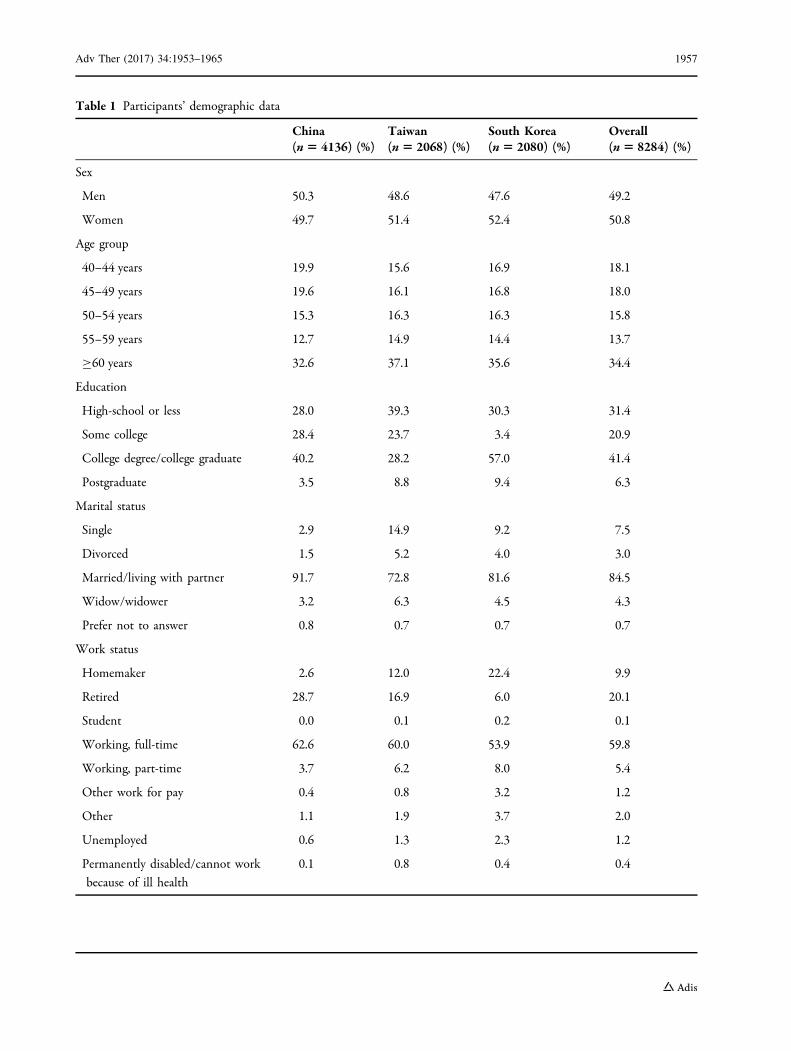
Table 1 Participants’ demographic data
China(n5 4136) (%)
Taiwan(n 5 2068) (%)
South Korea(n5 2080) (%)
Overall(n5 8284) (%)
Sex
Men 50.3 48.6 47.6 49.2
Women 49.7 51.4 52.4 50.8
Age group
40–44 years 19.9 15.6 16.9 18.1
45–49 years 19.6 16.1 16.8 18.0
50–54 years 15.3 16.3 16.3 15.8
55–59 years 12.7 14.9 14.4 13.7
C60 years 32.6 37.1 35.6 34.4
Education
High-school or less 28.0 39.3 30.3 31.4
Some college 28.4 23.7 3.4 20.9
College degree/college graduate 40.2 28.2 57.0 41.4
Postgraduate 3.5 8.8 9.4 6.3
Marital status
Single 2.9 14.9 9.2 7.5
Divorced 1.5 5.2 4.0 3.0
Married/living with partner 91.7 72.8 81.6 84.5
Widow/widower 3.2 6.3 4.5 4.3
Prefer not to answer 0.8 0.7 0.7 0.7
Work status
Homemaker 2.6 12.0 22.4 9.9
Retired 28.7 16.9 6.0 20.1
Student 0.0 0.1 0.2 0.1
Working, full-time 62.6 60.0 53.9 59.8
Working, part-time 3.7 6.2 8.0 5.4
Other work for pay 0.4 0.8 3.2 1.2
Other 1.1 1.9 3.7 2.0
Unemployed 0.6 1.3 2.3 1.2
Permanently disabled/cannot work
because of ill health
0.1 0.8 0.4 0.4
Adv Ther (2017) 34:1953–1965 1957
emptying, and terminal dribble (Fig. 2). Symp-toms with the largest numbers of patientsexperiencing ‘‘quite a bit or greater’’ bother wereterminal dribble, nocturia, and urgency. Preva-lence of nocturia (at least two episodes pernight) and extent of associated bother differedlittle between men and women, with preva-lence of 35% and 37% and percentages with‘‘quite a bit or greater’’ bother of 25% and 26%,respectively.
According to IPSS, 86.8% of participants hadat least mild symptoms (Fig. S2 in the onlinesupplementary material), which was similaracross all three countries. Moderate or greatersymptoms were reported in 34.0% of respon-dents and were more common in those aged55–60 years and over 60 years (39.8% and43.2%, respectively) than in younger age groups[range 22.9% (respondents aged 40–44 years) to29.5% (those aged 50–54 years)]. This differenceacross age groups was statistically significant(p = 0.001). Increasing IPSS symptom severitywas associated with worsening PPBC (Table S2in the online supplementary material; Spear-man correlation coefficient 0.734; p = 0.001):60% of participants with severe IPSS had mod-erate or greater problems according to PPBC.
This pattern was evident among men andwomen, and across the three countries.
Healthcare Seeking
Twenty-six percent of individuals with anyLUTS according to ICS criteria reported visitinghealthcare professionals during the previous12 months because of urinary symptoms. Indi-viduals with voiding, storage, and post-mic-turition symptoms (45%) had the highesthealthcare professional consultation rate(Fig. S3 in the online supplementary material),with the difference versus other ICS symptomgroups reaching statistical significance(p = 0.001). The lowest rate was in participantswith voiding symptoms only. The percentage ofindividuals who had visited healthcare profes-sionals because of urinary symptoms increasedwith IPSS severity (p = 0.001), from 8% (mild) to63% (severe). A slightly higher rate of health-care professional consultation was observed inwomen versus men with LUTS (27% vs. 25%[not statistically significant]). Fifty-nine percentof individuals with LUTS according to ICS cri-teria were following treatment (Table S3 in theonline supplementary material). There werestatistically significant differences between ICSsymptom groups in this respect (p = 0.001), andthe category with the highest percentage ofindividuals following treatment was voidingplus storage plus post-micturition symptoms(78%).
DISCUSSION
Overall, 61% of participants in this study (in-dividuals aged at least 40 years from China,Taiwan, and South Korea) fulfilled the ICS cri-teria for LUTS, and bothersome symptoms werecommon. Over one-third of men and womenwith LUTS reported all three ICS symptomgroups. LUTS prevalence was slightly higher inmen than women and tended to increase withincreasing age. Only half of individuals withsymptoms in all three ICS categories had con-sulted healthcare professionals about thesesymptoms. Our results confirm that in threeAsian countries there is a lack of patient
PM (1.9%)
PM+S (2.8%)
V (4.5%)V+PM (2.3%)
V+S+PM(21.4%)
V+S(10.0%)
S (18.3%)
No LUTS (38.8%)
Fig. 1 Prevalence of LUTS according to ICS symptomdefinitions (overall population, N = 8284). In total, 61.2%of patients had any LUTS. ICS International ContinenceSociety, LUTS lower urinary tract symptoms, PMpost-micturition symptoms, S storage symptoms, V voidingsymptoms
1958 Adv Ther (2017) 34:1953–1965
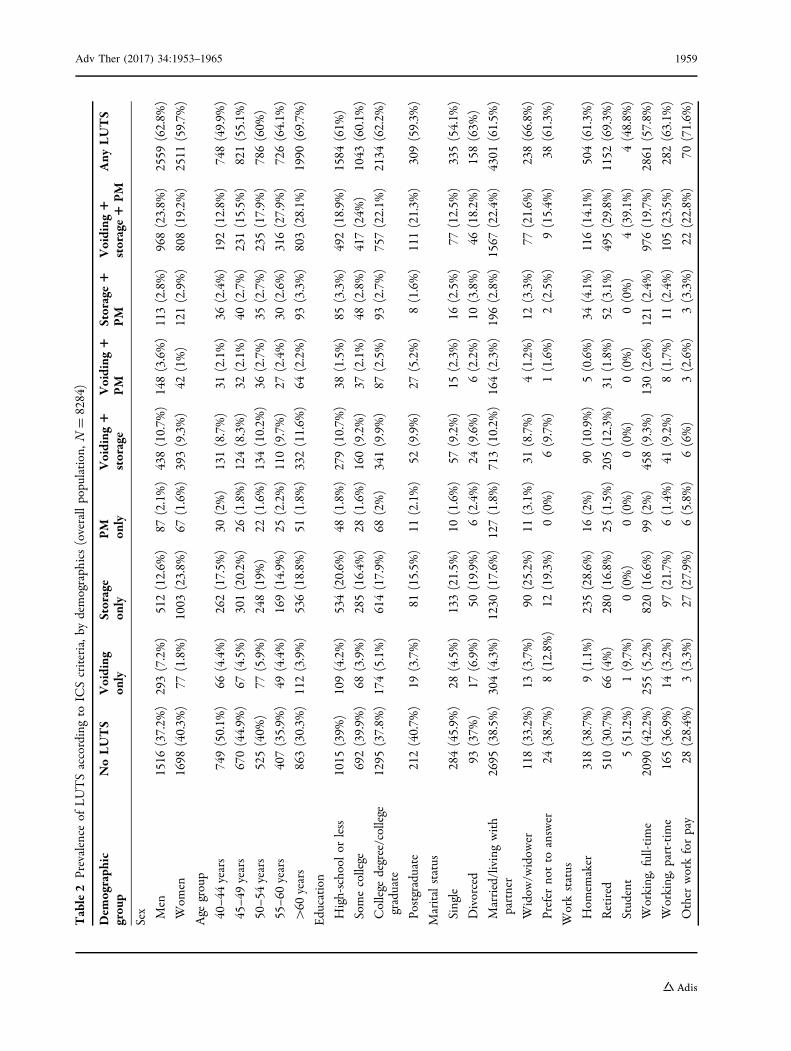
Table2
Prevalence
ofLUTSaccordingto
ICScriteria,b
ydemograph
ics(overallpopulation,N
=8284)
Dem
ograph
icgrou
pNoLUTS
Voiding
only
Storage
only
PM
only
Voiding
1storage
Voiding
1PM
Storage1
PM
Voiding
1storage1
PM
Any
LUTS
Sex Men
1516
(37.2%
)293(7.2%)
512(12.6%
)87
(2.1%)
438(10.7%
)148(3.6%)
113(2.8%)
968(23.8%
)2559
(62.8%
)
Wom
en1698
(40.3%
)77
(1.8%)
1003
(23.8%
)67
(1.6%)
393(9.3%)
42(1%)
121(2.9%)
808(19.2%
)2511
(59.7%
)
Age
group
40–4
4years
749(50.1%
)66
(4.4%)
262(17.5%
)30
(2%)
131(8.7%)
31(2.1%)
36(2.4%)
192(12.8%
)748(49.9%
)
45–4
9years
670(44.9%
)67
(4.5%)
301(20.2%
)26
(1.8%)
124(8.3%)
32(2.1%)
40(2.7%)
231(15.5%
)821(55.1%
)
50–5
4years
525(40%
)77
(5.9%)
248(19%
)22
(1.6%)
134(10.2%
)36
(2.7%)
35(2.7%)
235(17.9%
)786(60%
)
55–6
0years
407(35.9%
)49
(4.4%)
169(14.9%
)25
(2.2%)
110(9.7%)
27(2.4%)
30(2.6%)
316(27.9%
)726(64.1%
)
[60
years
863(30.3%
)112(3.9%)
536(18.8%
)51
(1.8%)
332(11.6%
)64
(2.2%)
93(3.3%)
803(28.1%
)1990
(69.7%
)
Education
High-school
orless
1015
(39%
)109(4.2%)
534(20.6%
)48
(1.8%)
279(10.7%
)38
(1.5%)
85(3.3%)
492(18.9%
)1584
(61%
)
Somecollege
692(39.9%
)68
(3.9%)
285(16.4%
)28
(1.6%)
160(9.2%)
37(2.1%)
48(2.8%)
417(24%
)1043
(60.1%
)
College
degree/college
graduate
1295
(37.8%
)174(5.1%)
614(17.9%
)68
(2%)
341(9.9%)
87(2.5%)
93(2.7%)
757(22.1%
)2134
(62.2%
)
Postgraduate
212(40.7%
)19
(3.7%)
81(15.5%
)11
(2.1%)
52(9.9%)
27(5.2%)
8(1.6%)
111(21.3%
)309(59.3%
)
Maritalstatus
Single
284(45.9%
)28
(4.5%)
133(21.5%
)10
(1.6%)
57(9.2%)
15(2.3%)
16(2.5%)
77(12.5%
)335(54.1%
)
Divorced
93(37%
)17
(6.9%)
50(19.9%
)6(2.4%)
24(9.6%)
6(2.2%)
10(3.8%)
46(18.2%
)158(63%
)
Married/livingwith
partner
2695
(38.5%
)304(4.3%)
1230
(17.6%
)127(1.8%)
713(10.2%
)164(2.3%)
196(2.8%)
1567
(22.4%
)4301
(61.5%
)
Widow
/widow
er118(33.2%
)13
(3.7%)
90(25.2%
)11
(3.1%)
31(8.7%)
4(1.2%)
12(3.3%)
77(21.6%
)238(66.8%
)
Prefer
notto
answer
24(38.7%
)8(12.8%
)12
(19.3%
)0(0%)
6(9.7%)
1(1.6%)
2(2.5%)
9(15.4%
)38
(61.3%
)
Workstatus
Hom
emaker
318(38.7%
)9(1.1%)
235(28.6%
)16
(2%)
90(10.9%
)5(0.6%)
34(4.1%)
116(14.1%
)504(61.3%
)
Retired
510(30.7%
)66
(4%)
280(16.8%
)25
(1.5%)
205(12.3%
)31
(1.8%)
52(3.1%)
495(29.8%
)1152
(69.3%
)
Student
5(51.2%
)1(9.7%)
0(0%)
0(0%)
0(0%)
0(0%)
0(0%)
4(39.1%
)4(48.8%
)
Working,full-tim
e2090
(42.2%
)255(5.2%)
820(16.6%
)99
(2%)
458(9.3%)
130(2.6%)
121(2.4%)
976(19.7%
)2861
(57.8%
)
Working,p
art-time
165(36.9%
)14
(3.2%)
97(21.7%
)6(1.4%)
41(9.2%)
8(1.7%)
11(2.4%)
105(23.5%
)282(63.1%
)
Other
workforpay
28(28.4%
)3(3.3%)
27(27.9%
)6(5.8%)
6(6%)
3(2.6%)
3(3.3%)
22(22.8%
)70
(71.6%
)
Adv Ther (2017) 34:1953–1965 1959
awareness of LUTS and an unmet need for itsdiagnosis and treatment, resulting in a signifi-cant health burden, as previously noted inWestern studies.
LUTS prevalence varied according to workand marital status. Among individuals who aredisabled or unable to work because of ill health,LUTS could be related to detrusor overactivitycaused by neurological conditions [12]. Highprevalence among widows/widowers and lowprevalence among students may beattributable to age differences in these groupsversus the overall population. Potential con-tributors to variability between countriesinclude genetic/ethnicity differences (affectingsusceptibility to LUTS), and cultural/linguisticdifferences (affecting the way study questionswere answered) [13, 14].
The present LUTS prevalence data appearbroadly comparable with population-basedstudies performed in Europe and North America[8, 9]. However, in these studies, LUTS preva-lence appears to be higher in women than men,while we found the opposite was true. In theEPIC study, conducted in over 19,000 individ-uals aged at least 18 years, LUTS prevalence was64.3% (men 62.5%; women 66.6%) [9]. TheEpiLUTS study (30,000 participants aged at least40 years) reported LUTS in 72.3% of men and76.3% of women [8]. As in the present study,ICS criteria were used but direct comparisonsare confounded by other differences (e.g.,demographics, definition of nocturia).Although no previous international popula-tion-based studies have investigated LUTSprevalence in Asia using ICS criteria, previousstudies have reported LUTS prevalence inChina, South Korea, and Taiwan [10, 11, 15–21];prevalence rates greater than 50%, consistentwith our results, have been reported in China[11, 18, 21] and South Korea [10, 20]. OneChinese study involved 3023 participants agedat least 18 years who completed the Interna-tional Consultation on Incontinence Ques-tionnaire Male/Female Lower Urinary TractSymptoms Long Form [11], while the other twoused the Bristol Female Lower Urinary TractSymptoms questionnaire in women aged atleast 40 years [18] and those aged at least20 years with selected LUTS symptoms [21].T
able2
continued
Dem
ograph
icgrou
pNoLUTS
Voiding
only
Storage
only
PM
only
Voiding
1storage
Voiding
1PM
Storage1
PM
Voiding
1storage1
PM
Any
LUTS
Other
55(34.2%
)18
(11%
)31
(19.4%
)1(0.7%)
19(11.6%
)8(5.2%)
2(1.1%)
27(16.9%
)106(65.8%
)
Unemployed
39(38%
)3(2.5%)
22(21.2%
)1(1%)
9(8.9%)
5(4.7%)
5(4.9%)
19(18.7%
)63
(62%
)
Perm
anently
disabled/cannotwork
duebecauseof
illhealth
5(15.4%
)1(3.1%)
3(10.2%
)0(0%)
3(10.6%
)0(0%)
7(24%
)11
(36.7%
)26
(84.6%
)
Patientnu
mbersareweightedandroun
ded,
andhencemay
notaddup;percentagesarebasedon
theweighted‘n’
1960 Adv Ther (2017) 34:1953–1965
Participants of one of the South Korean studieswere men and women aged at least 18 years,and LUTS prevalence was based on ICS criteriawith a nocturia cutoff of at least one episode pernight [10], while the second study involvedmen aged at least 40 years, with LUTS preva-lence determined using ICS criteria and noc-turia defined as at least two episodes per night[20]. In the remaining four studies, three ofwhich were conducted using the IPSS, LUTSprevalence rates below 30% were reported[15–17, 19]. The extent of variability might berelated to differences between countries inclinical practice, the use of different assessmenttechniques (e.g., one study assessed only uri-nary frequency [15]), or small sample sizes. Also,in three of the low-prevalence studies, LUTS wasassessed using IPSS; although this scale wasoriginally validated for assessing male LUTS, ithas subsequently been validated in women,including Asian women [22, 23]. While it may
be helpful to determine severity of LUTS, theIPSS does not evaluate incontinence orpost-micturition symptoms, and storage andemptying symptoms do not necessarily reflectdisorders of storage and voiding function [24].Hence, data based on the IPSS are often evalu-ated in conjunction with those from otherassessment tools.
Approximately three-quarters of individualswith LUTS did not visit a healthcare profes-sional in relation to their symptoms and LUTSwas untreated in 41% of cases. The reasons forlow consultation rates are varied, but they maybe attributable to stigma, beliefs that LUTSoccur naturally with ageing, and perceptionsthat LUTS are not curable or treatable [25–27].The belief that symptoms are a minor problemmay also affect the need to seek help [25];indeed in Chinese women with urinary incon-tinence, seeking professional help was associ-ated more with the perceived level of bother
273
12
2
7
0
5
10
15
20
25
30
Incontinenceor dribble
Incompleteemptying
Ove
rall
prev
alen
ce, %
Post-micturition symptoms
26
7
1115
4 3 3 1 0 0 1 3 3 1 1
10
12
87 5
1 0 1 14 3
2 2
7
9
87
6
1 1 1 1
3 32 1
0
5
10
15
20
25
30
35
40
Perceiv
ed fre
quen
cy
Noctur
ia
Urgenc
y
Urgenc
y, fea
r of le
aking
Urgenc
y inc
ontin
ence
Noctur
nal e
nures
is
During
sex
No rea
son
Laug
hing
Sneez
ing
Cough
ing
Exerci
sing
Heavy
liftin
g
Ove
rall
prev
alen
ce, %
Storage symptoms
Bother score <2 Bother score =2 Bother score ≥3
Stress incontinence
28
36
2017
14
3 2 24
10 95 4
Bother score based on percentage of patients who experienced the symptom; numbers at top of bar represent overall prevalence
0
5
10
15
20
25
30
22
7
9
6
Weakstream
22
7
9
6
Splitstream
21
5
9
7
Intermittency
18
5
8
6
Hesitancy
18
4
8
6
Straining
26
6
10
9
Terminaldribble
Ove
rall
prev
alen
ce, %
Voiding symptoms
Fig. 2 Symptoms and bother, overall population (N = 8284). Data shown are from questions relating to ICS symptomdefinitions. ICS International Continence Society
Adv Ther (2017) 34:1953–1965 1961
than with symptom severity [27]. Among indi-viduals with LUTS, a slightly higher percentageof women than men reported visiting health-care professionals because of urinary symptoms.This difference could be related to an increasedfrequency of visits to healthcare professionalsfor any reason among women. There is a needto encourage increased uptake of healthcare forLUTS, to reduce the impact on individuals’ QoL.Pharmacoeconomic analysis is beyond thescope of this study, but untreated LUTS havefinancial as well as QoL effects (e.g., decreasedworkplace productivity) [28].
Potential strengths of our study include thelarge sample size, well-balanced demographiccharacteristics (e.g., similar numbers of menand women), and a comparison between threecountries. The instruments used in our studyare well established and validated[22, 23, 29–31]. Conducting the study via theInternet was cost-efficient and suitable for ask-ing questions of a sensitive or personal nature.However, this approach may result in bias byonly including individuals with Internet access.We selected China, South Korea, and Taiwan onthe basis of the highest Internet penetrationrates within Asia in 2015 (50%, 92%, and 84%,respectively) [32]. National statistics suggestthat our study may be biased towards individ-uals of a higher socioeconomic class, particu-larly those with a higher educational level[33–36], although income was more aligned[37–39]. This is unsurprising given the differentpopulations and cutoff points between ourstudy and national statistics. Nevertheless, asurvey on Internet development in Chinareported that 22.1% of those using the Internetused online medical services, the most commonof which was seeking healthcare informationbefore seeing a doctor [40]. This suggests thatthe Internet may have a considerable impact ongeneral health and healthcare. Further potentialdisadvantages were the use of a consumer panel,which is prone to volunteer bias, restriction tourban areas, and the lack of background data toallow more detailed analysis of the results.Nevertheless, we feel that the data emphasizeimportant epidemiological messages that set
the scene for further work and more detailedpharmacoepidemiological research across theregion.
CONCLUSIONS
LUTS are present in the majority of men andwomen aged at least 40 years in China, Taiwan,and South Korea. Bothersome storage symp-toms (the OAB symptom complex) are com-mon, occurring in at least 50% of those withLUTS, and LUTS prevalence increases withincreasing age. Comorbid conditions, particu-larly diabetes and neurological disease, areassociated with increased risk of LUTS. Only26% of individuals with LUTS seek healthcareand our results suggest there is a need forincreased patient awareness of LUTS, its diag-nosis, and treatment.
ACKNOWLEDGEMENTS
The authorswould like to thank the participantsof the study for their time, Nanjangud ShankarNarasimhamurthy and Koni Raviprakash forstatistical analyses, and Dr Ming Liu for intel-lectual input into the manuscript. This studywas funded by Astellas Pharma Singapore Pte.Ltd. Editorial support, including writing assis-tance, was provided byKen Sutor, BSc and Jackievan Bueren, BSc of Envision Scientific Solutions.Astellas PharmaGlobal Development, Chertsey,UK funded editorial support, article processingcharges, and the open access fee. This study hasbeen published in part in abstract form as apodium presentation at the annual ICS meetingin Tokyo, Japan, 14 September 2016; Chapple Cet al. Cross-sectional, Internet-based survey toestimate prevalence of LUTS in China, Taiwanand South Korea (LUTS Asia). All named authorsmeet the International Committee of MedicalJournal Editors (ICMJE) criteria for authorshipfor this manuscript, take responsibility for theintegrity of the work as a whole, and have givenfinal approval for the version to be published.
1962 Adv Ther (2017) 34:1953–1965
Disclosures. Christopher Chapple has actedas a consultant for Astellas during a meeting todiscuss the publications from the study. DavidCastro-Diaz has acted as a consultant forAstellas during a meeting to discuss the publi-cations from the study. Yao- Chi Chuang hasacted as a consultant for Astellas during a meet-ing to discuss the publications from the study.Kyu-Sung Lee has acted as a consultant forAstellas during a meeting to discuss the publi-cations from the study. Limin Liao has acted as aconsultant for Astellas during a meeting to dis-cuss the publications from the study. Shih-PingLiu has acted as a consultant for Astellas during ameeting to discuss the publications from thestudy. Jianye Wang has acted as a consultant forAstellas during a meeting to discuss the publi-cations from the study. Tag Keun Yoo has actedas a consultant for Astellas during a meeting todiscuss the publications from the study. RomeoChu has acted as a consultant for Astellas duringa meeting to discuss the publications from thestudy. Budiwan Sumarsono has acted as a con-sultant for Astellas during a meeting to discussthe publications from the study. Tag Keun Yoohas received grants and personal fees fromAstellas to act as a consultant to Astellas. RomeoChu is a former employee of Astellas. BudiwanSumarsono is an employee of Astellas.
Compliance with Ethics Guidelines. As thisstudy was based on a survey, it was not con-sidered necessary to submit for institutionalreview board approval. The study was per-formed in compliance with Good ClinicalPractice and market research guidelines (Ap-pendix 1 in the online supplementary material).All procedures followed were in accordancewith the ethical standards of the responsiblecommittee on human experimentation (insti-tutional and national) and with the HelsinkiDeclaration of 1964, as revised in 2013.Informed consent was obtained from allpatients being included in the study.
Data Availability. All data generated oranalyzed during this study are included in thispublished article/as supplementary informationfiles.
Open Access. This article is distributedunder the terms of the Creative CommonsAttribution-NonCommercial 4.0 InternationalLicense (http://creativecommons.org/licenses/by-nc/4.0/), which permits any noncommer-cial use, distribution, and reproduction in anymedium, provided you give appropriate creditto the original author(s) and the source, providea link to the Creative Commons license, andindicate if changes were made.
REFERENCES
1. Abrams P, Cardozo L, Fall M, et al. The standardis-ation of terminology of lower urinary tract func-tion: report from the StandardisationSub-committee of the International ContinenceSociety. Neurourol Urodyn. 2002;21(2):167–78.
2. Roehrborn CG, McConnell JD, Saltzman B, et al.Storage (irritative) and voiding (obstructive) symp-toms as predictors of benign prostatic hyperplasiaprogression and related outcomes. Eur Urol.2002;42(1):1–6.
3. Gravas S, Bach T, Drake M, et al. Treatment ofnon-neurogenic male LUTS. http://uroweb.org/guideline/treatment-of-non-neurogenic-male-luts/.Accessed 9 May 2017.
4. Ju R, Garrett J, Wu JM. Anticholinergic medicationuse for female overactive bladder in the ambulatorysetting in the United States. Int Urogynecol J.2014;25(4):479–84.
5. Coyne KS, Sexton CC, Kopp ZS, Ebel-Bitoun C, Mil-som I, Chapple C. The impact of overactive bladderon mental health, work productivity and health-re-lated quality of life in the UK and Sweden: resultsfrom EpiLUTS. BJU Int. 2011;108(9):1459–71.
6. Kim TH, Han DH, Ryu DS, Lee KS. The impact oflower urinary tract symptoms on quality of life,work productivity, depressive symptoms, and sex-uality in Korean men aged 40 years and older: apopulation-based survey. Int Neurourol J.2015;19(2):120–9.
7. Stewart WF, Van Rooyen JB, Cundiff GW, et al.Prevalence and burden of overactive bladder in theUnited States. World J Urol. 2003;20(6):327–36.
8. Coyne KS, Sexton CC, Thompson CL, et al. Theprevalence of lower urinary tract symptoms (LUTS)in the USA, the UK and Sweden: results from the
Adv Ther (2017) 34:1953–1965 1963
Epidemiology of LUTS (EpiLUTS) study. BJU Int.2009;104(3):352–60.
9. Irwin DE, Milsom I, Hunskaar S, et al. Popula-tion-based survey of urinary incontinence, overac-tive bladder, and other lower urinary tractsymptoms in five countries: results of the EPICstudy. Eur Urol. 2006;50(6):1306–14.
10. Lee YS, Lee KS, Jung JH, et al. Prevalence of over-active bladder, urinary incontinence, and lowerurinary tract symptoms: results of Korean EPICstudy. World J Urol. 2011;29(2):185–90.
11. Wang Y, Hu H, Xu K, Wang X, Na Y, Kang X. Preva-lence, risk factors and the bother of lower urinarytract symptoms inChina: apopulation-based survey.Int Urogynecol J. 2015;26(6):911–9.
12. Torelli F, Terragni E, Blanco S, Di Bella N, Grasso M,Bonaiuti D. Lower urinary tract symptoms associ-ated with neurological conditions: observations ona clinical sample of outpatients neurorehabilitationservice. Arch Ital Urol Androl. 2015;87(2):154–7.
13. Hoke GP, McWilliams GW. Epidemiology of benignprostatic hyperplasia and comorbidities in racialand ethnic minority populations. Am J Med.2008;121(8 Suppl 2):S3–10.
14. Maserejian NN, Chen S, Chiu GR, et al. Incidence oflower urinary tract symptoms in a population-basedstudy of men and women. Urology.2013;82(3):560–4.
15. Hsieh CH, Chen HY, Hsu CS, Chang ST, Kuo TC,Chiang CD. Prevalence of urinary frequency inTaiwanese women aged 20-59 years. Taiwan JObstet Gynecol. 2006;45(3):244–6.
16. Lee E, Yoo KY, Kim Y, Shin Y, Lee C. Prevalence oflower urinary tract symptoms in Korean men in acommunity-based study. Eur Urol.1998;33(1):17–21.
17. Liang GQ, Zhang SJ, Wang B, et al. Lower urinarytract symptoms and prostatic growth patternamong old and middle-aged males in Shanghaicommunity. Zhonghua Nan Ke Xue.2012;18(10):886–90.
18. Zhang W, Song Y, He X, et al. Prevalence and riskfactors of lower urinary tract symptoms in FuzhouChinese women. Eur Urol. 2005;48(2):309–13.
19. Yu HJ, Chiang GJ, Chie WC, et al. Prevalence ofLUTS in men aged 40 to 79 years - a commu-nity-based study. J Urol ROC 1995;6:7–12.
20. Kim TH, Han DH, Lee KS. The prevalence of lowerurinary tract symptoms in Korean men aged
40 years or older: a population-based survey. IntNeurourol J. 2014;18(3):126–32.
21. Zhang L, Zhu L, Xu T, et al. A population-basedsurvey of the prevalence, potential risk factors, andsymptom-specific bother of lower urinary tractsymptoms in adult Chinese women. Eur Urol.2015;68(1):97–112.
22. Choi EP, Lam CL, Chin WY. Validation of theinternational prostate symptom score in Chinesemales and females with lower urinary tract symp-toms. Health Qual Life Outcomes. 2014;12:1.
23. Hsiao SM, Lin HH, Kuo HC. International prostatesymptom score for assessing lower urinary tractdysfunction in women. Int Urogynecol J.2013;24(2):263–7.
24. Madersbacher S, Pycha A, Klingler CH, Schatzl G,Marberger M. The international prostate symptomscore in both sexes: a urodynamics-based compari-son. Neurourol Urodyn. 1999;18(3):173–82.
25. Choi H, Park JY, Yeo JK, et al. Population-basedsurvey on disease insight, quality of life, andhealth-seeking behavior associated with femaleurinary incontinence. Int Neurourol J.2015;19(1):39–46.
26. Wang C, Li J, Wan X, Wang X, Kane RL, Wang K.Effects of stigma on Chinese women’s attitudestowards seeking treatment for urinary inconti-nence. J Clin Nurs. 2015;24(7–8):1112–21.
27. Xu D, Wang X, Li J, Wang K. The mediating effectof ‘bothersome’ urinary incontinence onhelp-seeking intentions among commu-nity-dwelling women. J Adv Nurs.2015;71(2):315–25.
28. Azam U, Castleden M, Turner D. Economics oflower urinary tract symptoms (LUTS) in older peo-ple. Drugs Aging. 2001;18(3):213–23.
29. Barry MJ, Fowler FJ Jr, O’Leary MP, et al. TheAmerican Urological Association symptom indexfor benign prostatic hyperplasia. The MeasurementCommittee of the American Urological Association.J Urol. 1992;148(5):1549–57.
30. Coyne KS, Matza LS, Kopp Z, Abrams P. The vali-dation of the patient perception of bladder condi-tion (PPBC): a single-item global measure forpatients with overactive bladder. Eur Urol.2006;49(6):1079–86.
31. Jeong SJ, Homma Y, Oh SJ. Korean version of theoveractive bladder symptom score questionnaire:translation and linguistic validation. Int NeurourolJ. 2011;15(3):135–42.
1964 Adv Ther (2017) 34:1953–1965
32. Internet World Stats. Internet usage in Asia.http://www.internetworldstats.com/. Accessed 1Feb 2016.
33. National Bureau of Statistics of China. China sta-tistical yearbook. http://www.stats.gov.cn/tjsj/ndsj/2015/indexeh.htm. Accessed 1 Feb 2017.
34. Organisation for Economic Co-operation andDevelopment. Country statistical profiles: Korea.http://stats.oecd.org/. Accessed 1 Feb 2017.
35. Taiwan Ministry of the Interior. Statistical datafrom The Taiwan Ministry of the Interior; Mar2012.
36. Taiwan Ministry of the Interior. Statistical datafrom The Taiwan Ministry of the Interior; 12 Mar2016.
37. McKinsey & Company. Mapping China’s middleclass. http://www.mckinsey.com/industries/retail/our-insights/mapping-chinas-middle-class. Acces-sed 1 Feb 2017.
38. Choi S-k, Lee J-h. Changes in the quality of life ofKorea’s middle class. http://www.koreafocus.or.kr/design2/layout/content_print.asp?group_id=105791. Accessed 1 Feb 2017.
39. Pew Research Center. World population by income.http://www.pewglobal.org/interactives/global-population-by-income/. Accessed 1 Feb 2017.
40. China Internet Network Information Center. The37th statistical report on Internet development inChina.https://cnnic.com.cn/IDR/ReportDownloads/201604/P020160419390562421055.pdf. Accessed 10May 2017.
Adv Ther (2017) 34:1953–1965 1965


![7 Catheter-associated Urinary Tract Infection (CAUTI) · UTI Urinary Tract Infection (Catheter-Associated Urinary Tract Infection [CAUTI] and Non-Catheter-Associated Urinary Tract](https://img.pdfslide.us/doc/110x75/5c40b88393f3c338af353b7f/7-catheter-associated-urinary-tract-infection-cauti-uti-urinary-tract-infection.jpg)