Embed Size (px)
Citation preview
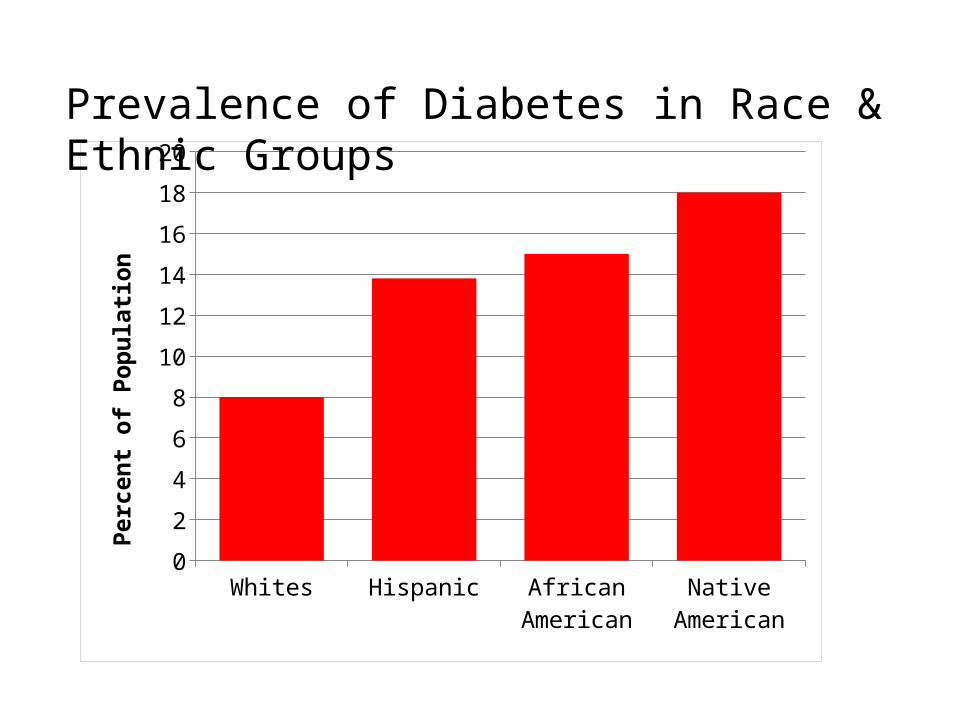
White
s
Hispan
ic
Africa
n American
Native
American
02468
101214161820
Perc
ent o
f Pop
ulati
onPrevalence of Diabetes in Race & Ethnic Groups
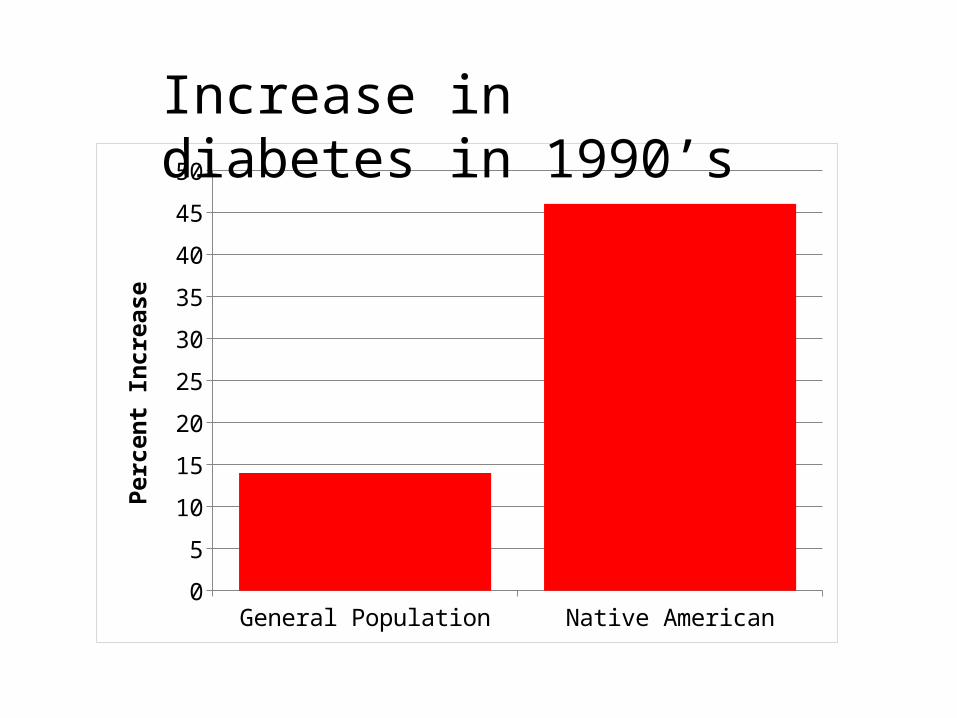
General Population Native American0
5
10
15
20
25
30
35
40
45
50Pe
rcen
t Inc
reas
eIncrease in diabetes in 1990’s
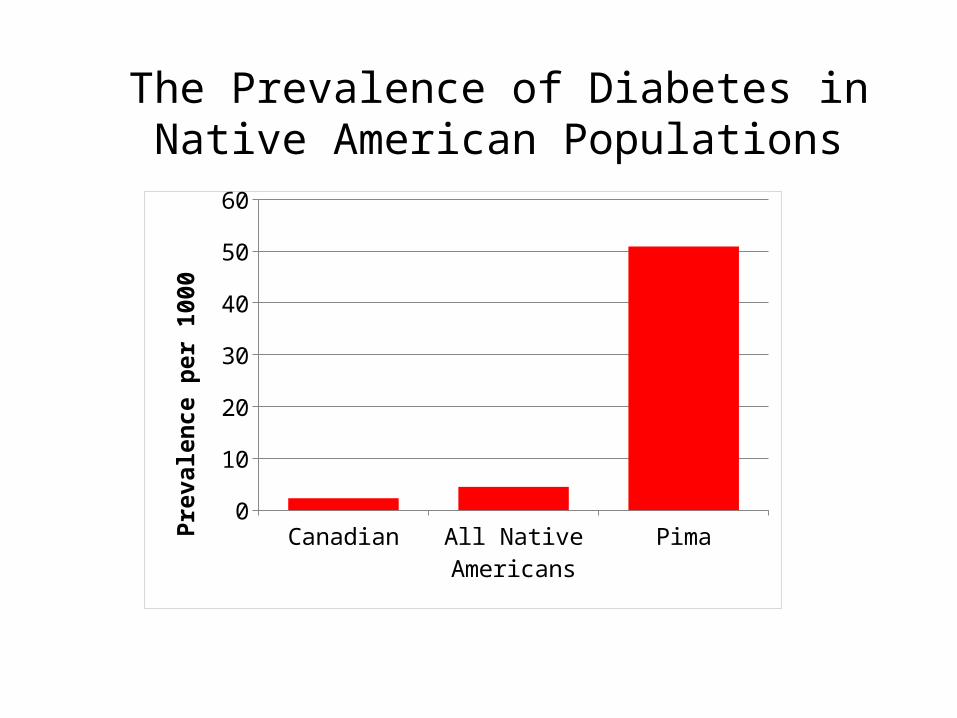
Canadian All Native Americans Pima0
10
20
30
40
50
60Pr
eval
ence
per
100
0
The Prevalence of Diabetes in Native American Populations
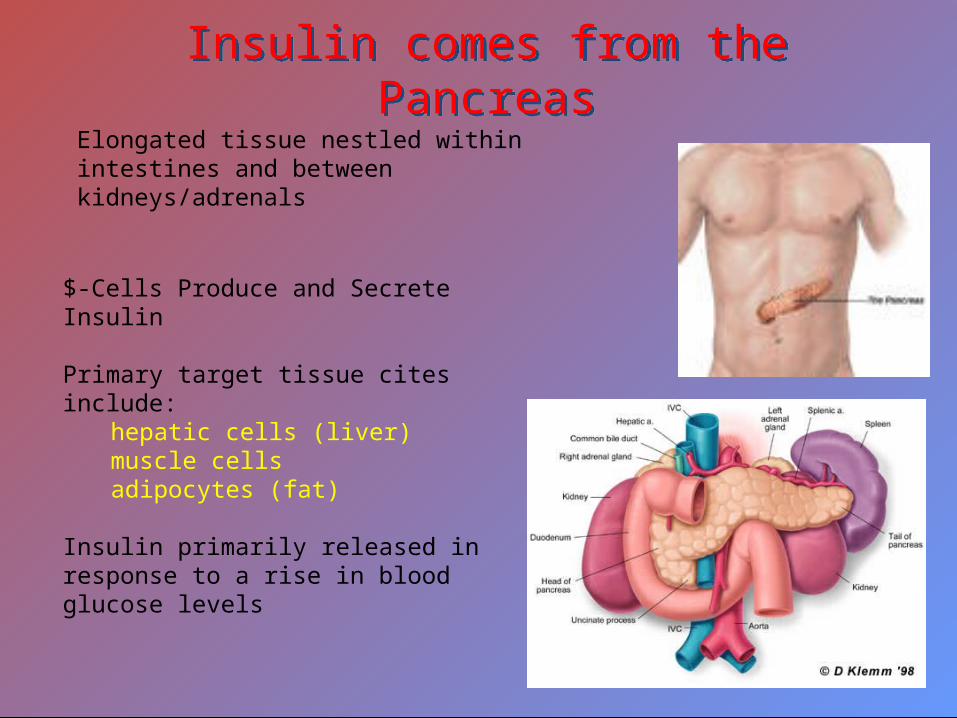
Insulin comes from the PancreasInsulin comes from the Pancreas
$-Cells Produce and Secrete Insulin
Primary target tissue cites include:hepatic cells (liver)muscle cellsadipocytes (fat)
Insulin primarily released in response to a rise in blood glucose levels
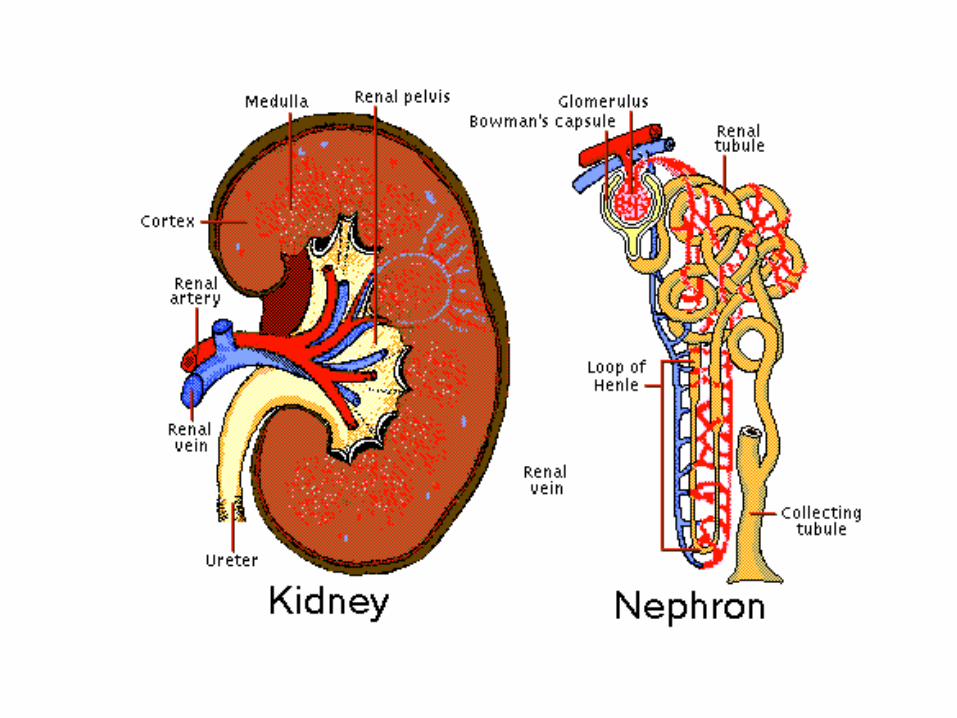
Elongated tissue nestled within intestines and between kidneys/adrenals
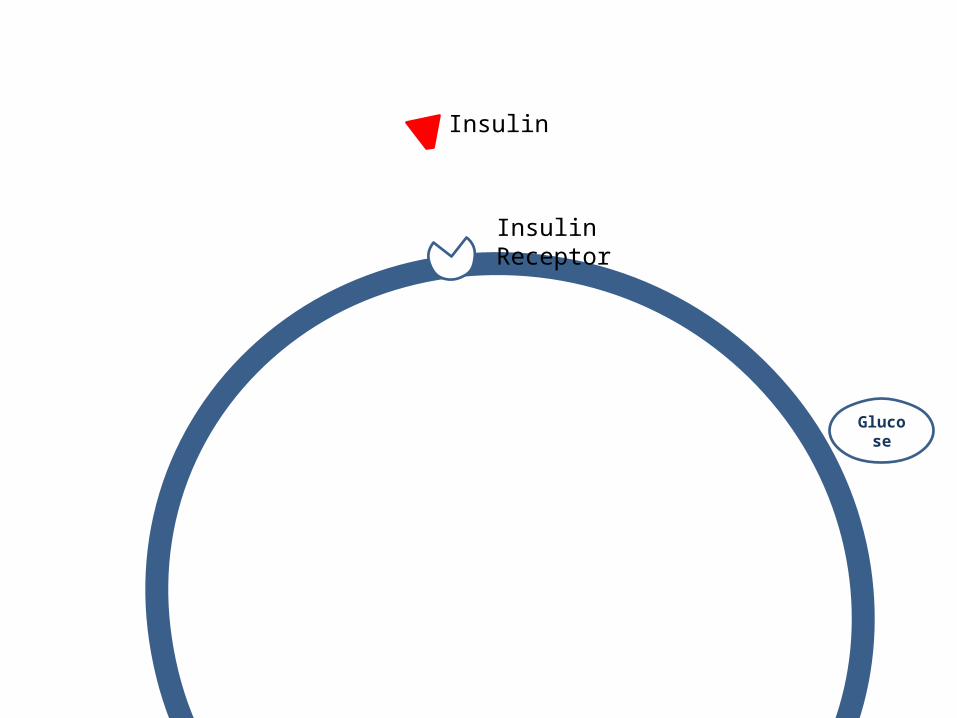
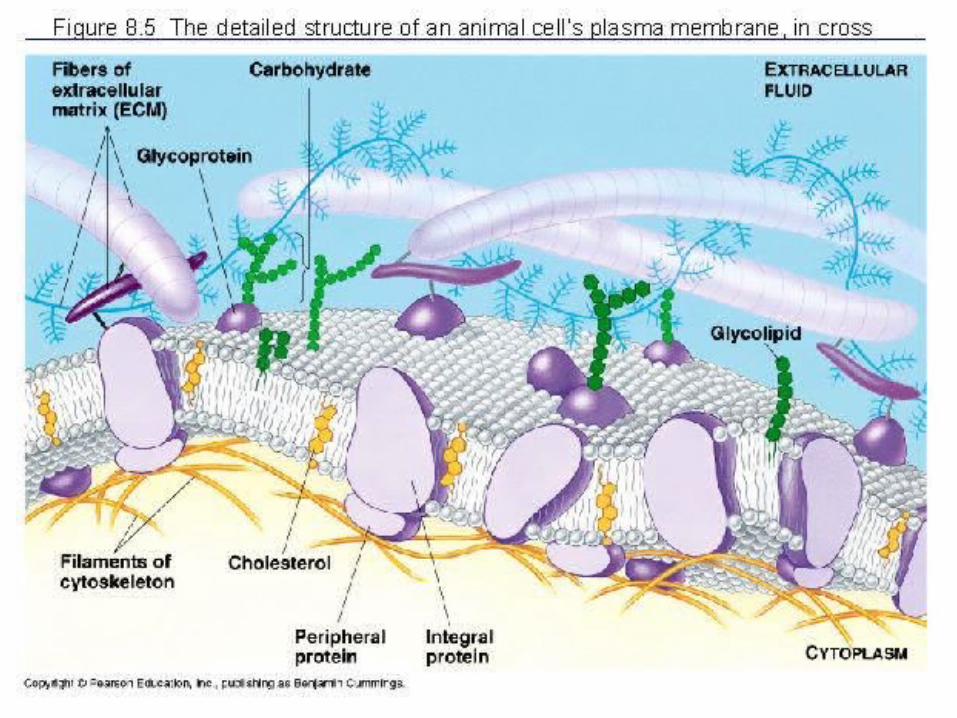
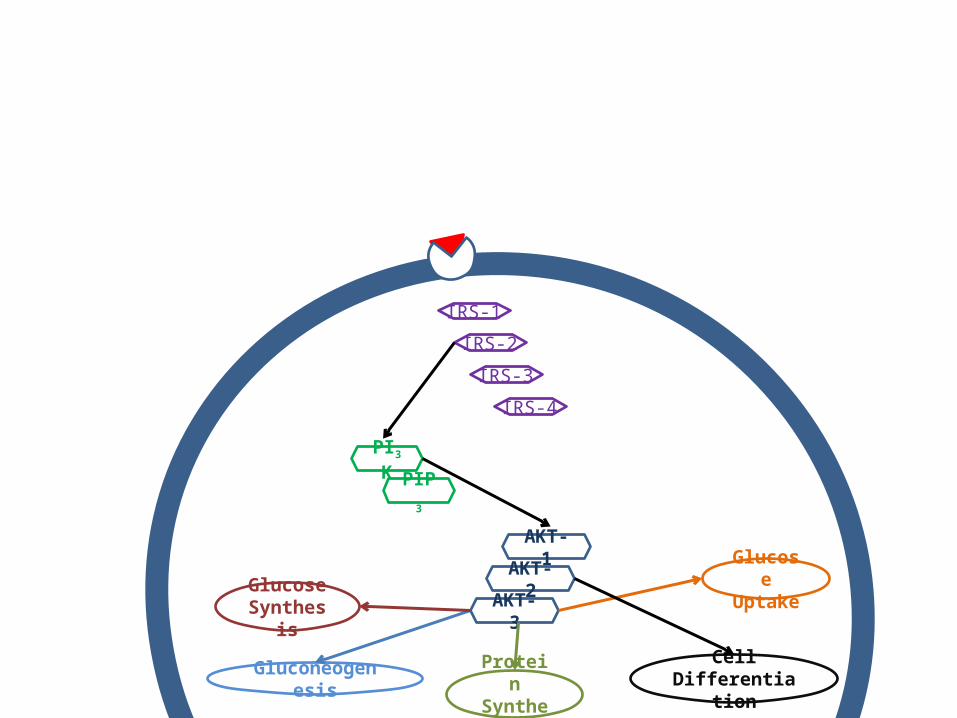
Insulin
Insulin Receptor
Glucose
Glucose
IRS-1
IRS-2
IRS-3
IRS-4
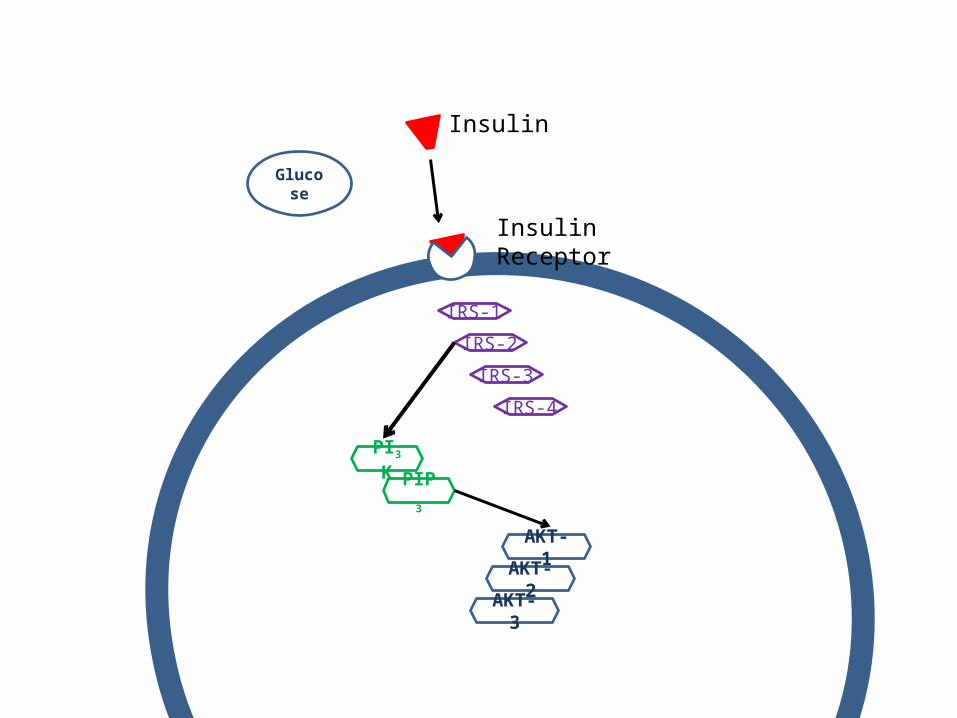
Glucose
Insulin
Insulin Receptor
PI3K
PIP3
AKT-1
AKT-2
AKT-3
IRS-1
IRS-2
IRS-3
IRS-4
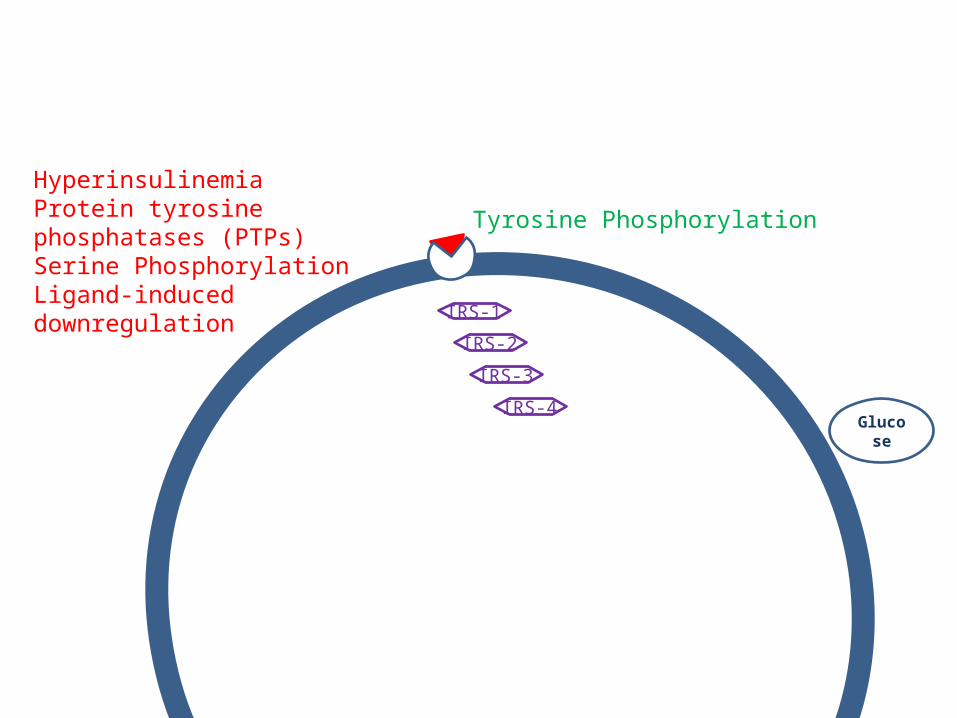
Tyrosine Phosphorylation
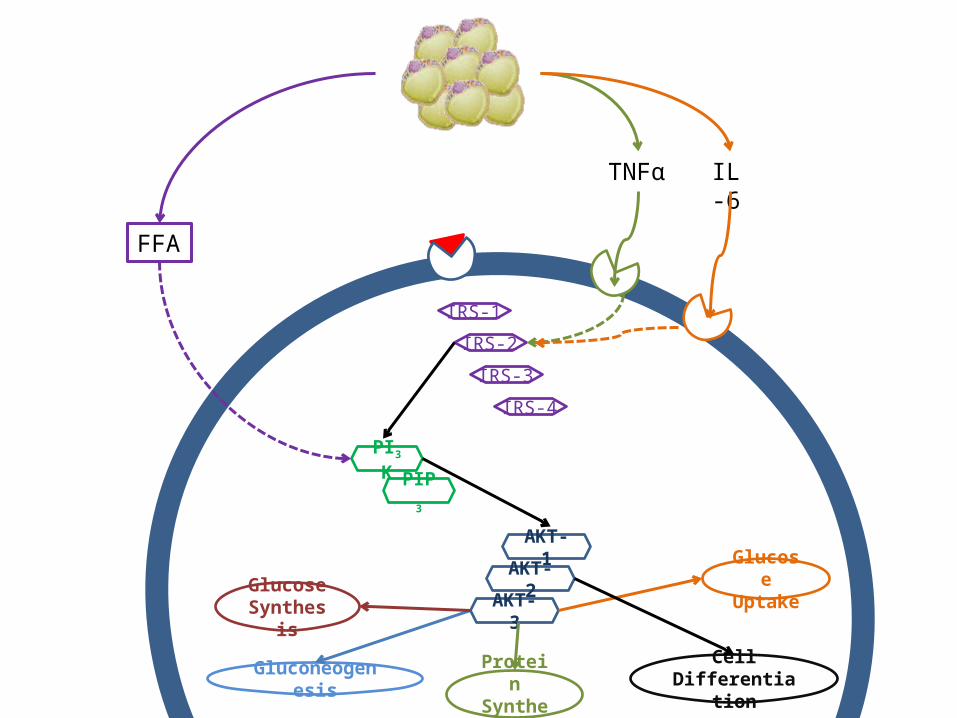
HyperinsulinemiaProtein tyrosine phosphatases (PTPs)Serine PhosphorylationLigand-induced downregulation
Glucose
IRS-1
IRS-2
IRS-3
IRS-4
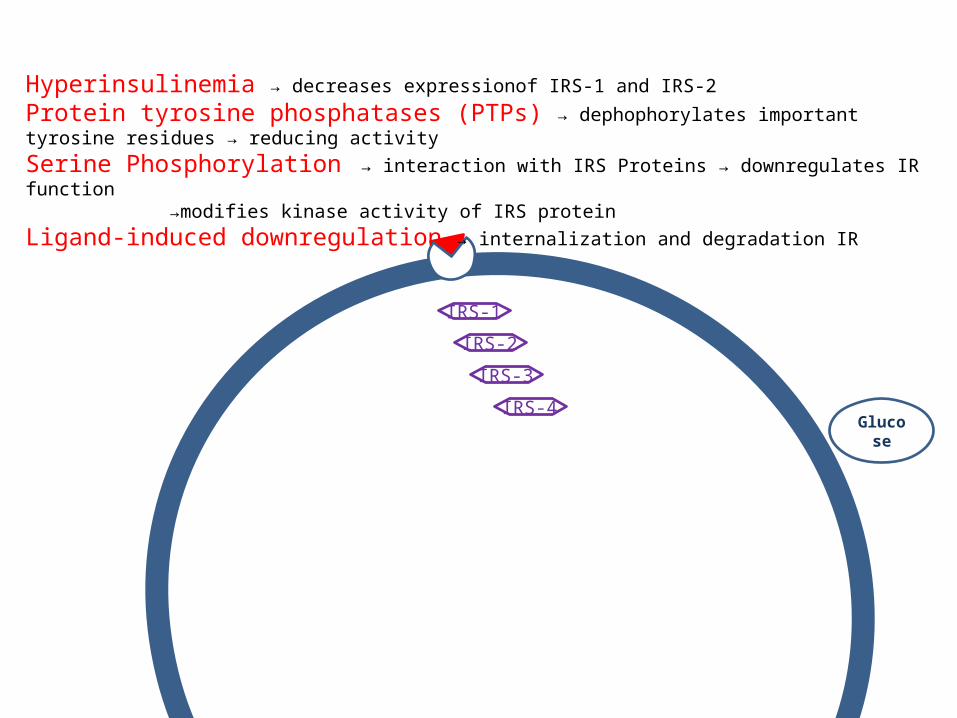
Hyperinsulinemia → decreases expressionof IRS-1 and IRS-2
Protein tyrosine phosphatases (PTPs) → dephophorylates important tyrosine residues → reducing activity
Serine Phosphorylation → interaction with IRS Proteins → downregulates IR function→modifies kinase activity of IRS protein
Ligand-induced downregulation → internalization and degradation IR
Glucose
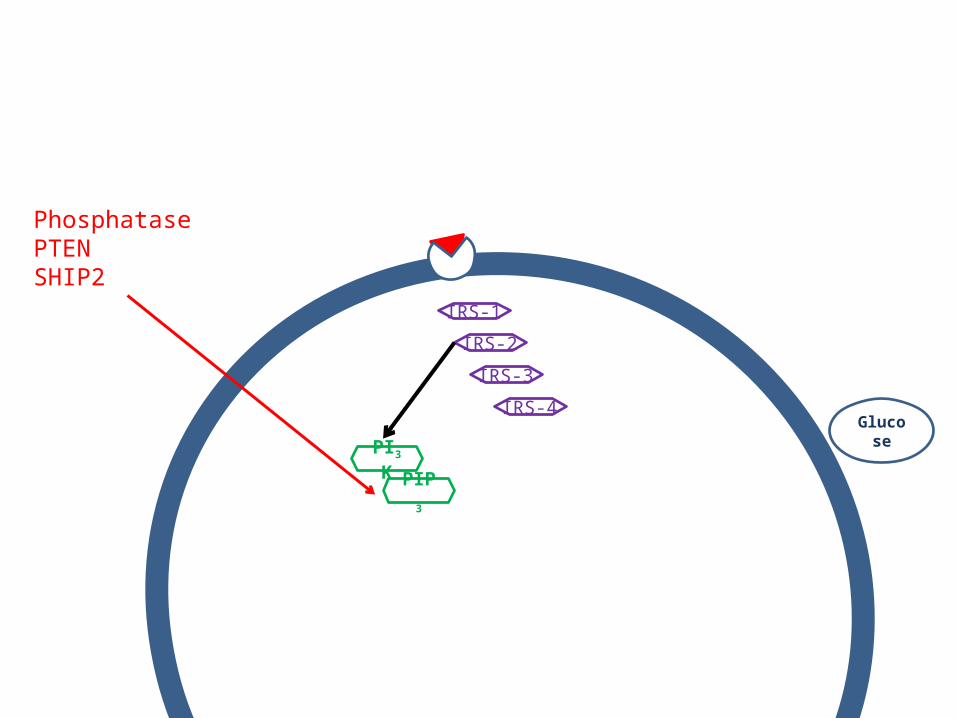
IRS-1
IRS-2
IRS-3
IRS-4
PI3K
PIP3
PhosphatasePTENSHIP2
Glucose
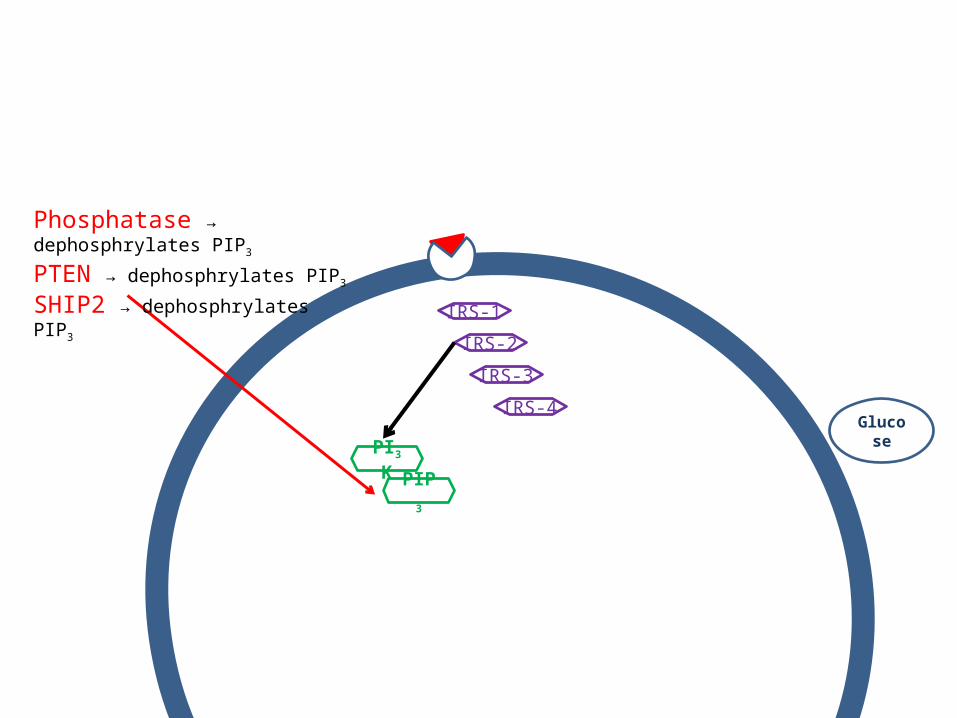
IRS-1
IRS-2
IRS-3
IRS-4
PI3K
PIP3
Phosphatase → dephosphrylates PIP3
PTEN → dephosphrylates PIP3
SHIP2 → dephosphrylates PIP3
Glucose
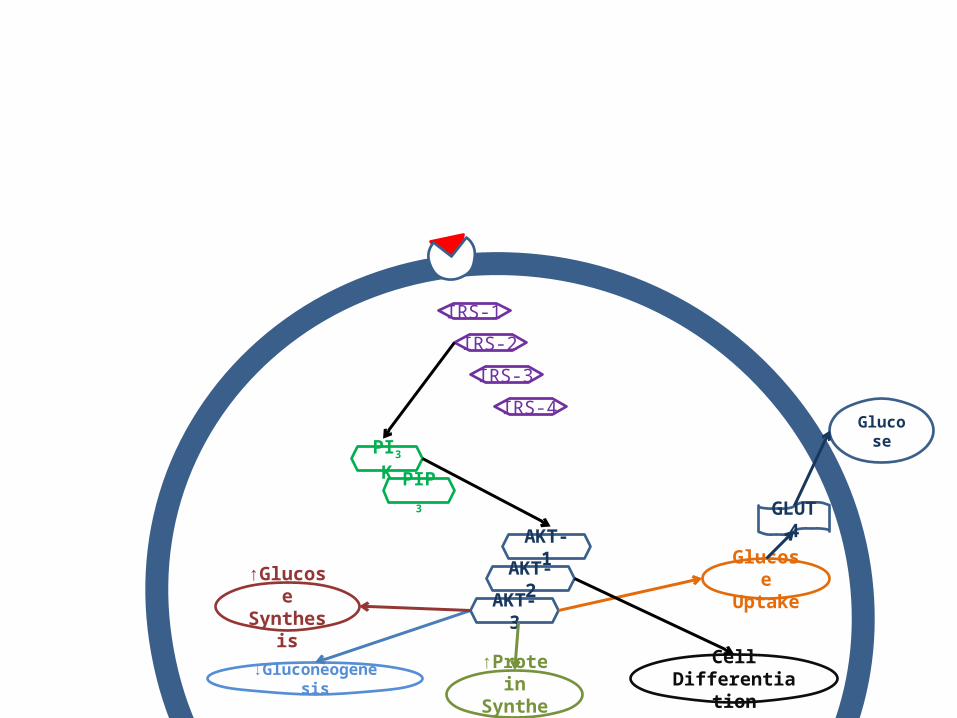
IRS-1
IRS-2
IRS-3
IRS-4
PI3K
PIP3
AKT-1
AKT-2
AKT-3
Glucose Uptake
Cell Differentiation↑Protein
Synthesis↓Gluconeogenesis
↑Glucose Synthesis
GLUT4
Glucose
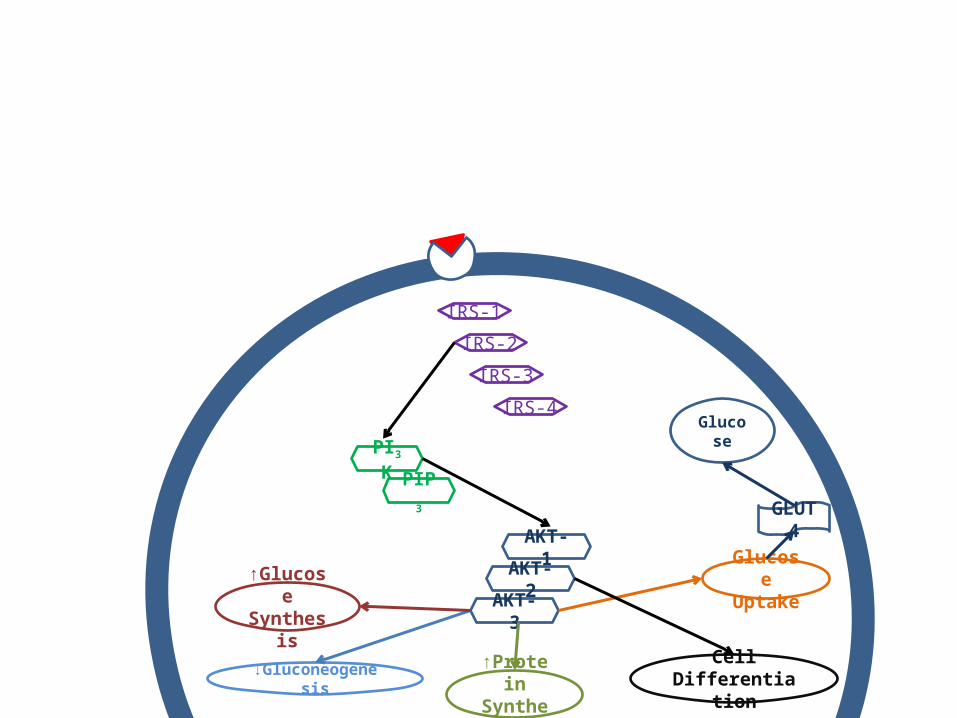
IRS-1
IRS-2
IRS-3
IRS-4
PI3K
PIP3
AKT-1
AKT-2
AKT-3
Glucose Uptake
Cell Differentiation↑Protein
Synthesis↓Gluconeogenesis
↑Glucose Synthesis
GLUT4
Glucose
IRS-1
IRS-2
IRS-3
IRS-4
PI3K
PIP3
AKT-1
AKT-2
AKT-3
Glucose Uptake
Cell DifferentiationProtein
SynthesisGluconeogenesis
Glucose Synthesis
IRS-1
IRS-2
IRS-3
IRS-4
PI3K
PIP3
AKT-1
AKT-2
AKT-3
Glucose Uptake
Cell DifferentiationProtein
SynthesisGluconeogenesis
Glucose Synthesis
TNFα IL-6
FFA
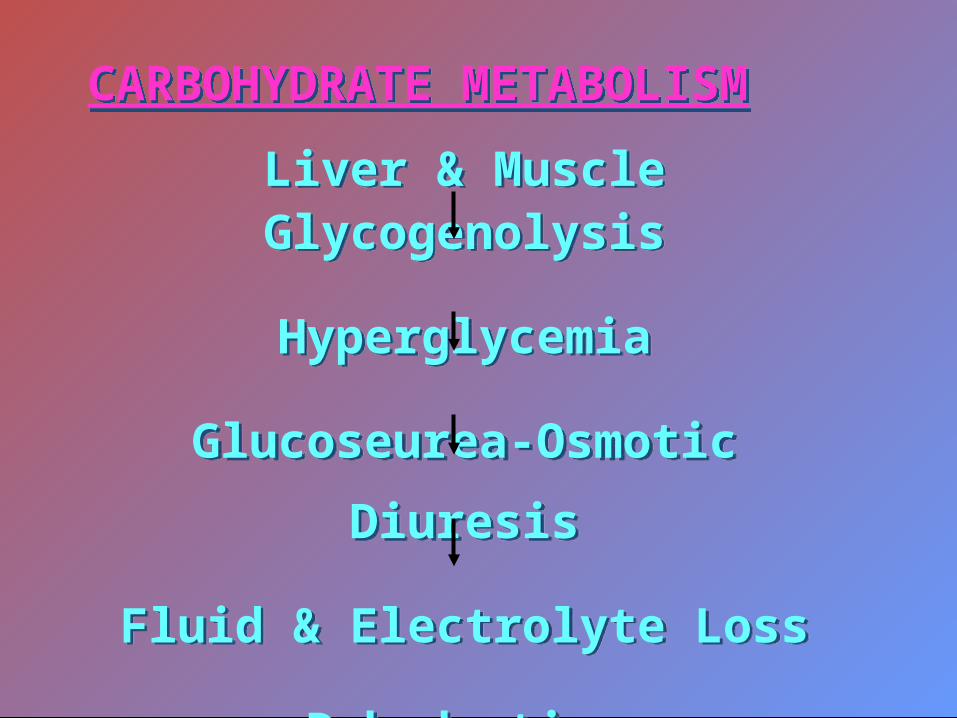
CARBOHYDRATE METABOLISMCARBOHYDRATE METABOLISM
Liver & Muscle Glycogenolysis
Hyperglycemia
Glucoseurea-Osmotic
Diuresis
Fluid & Electrolyte Loss
Dehydration
Liver & Muscle Glycogenolysis
Hyperglycemia
Glucoseurea-Osmotic
Diuresis
Fluid & Electrolyte Loss
Dehydration
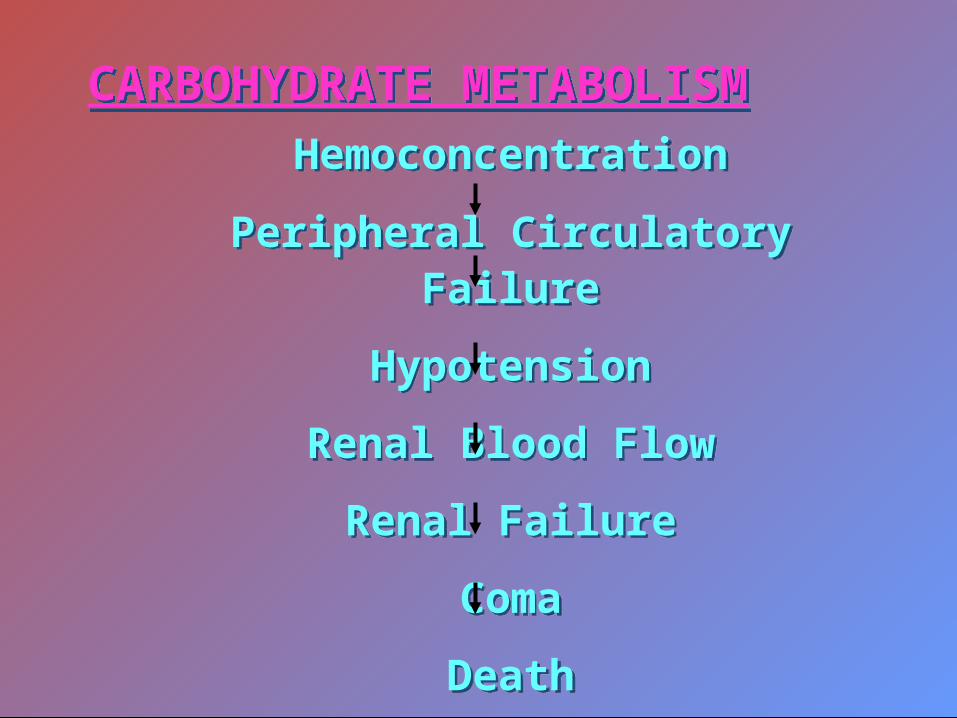
CARBOHYDRATE METABOLISMCARBOHYDRATE METABOLISM
Hemoconcentration
Peripheral Circulatory Failure
Hypotension
Renal Blood Flow
Renal Failure
Coma
Death
Hemoconcentration
Peripheral Circulatory Failure
Hypotension
Renal Blood Flow
Renal Failure
Coma
Death
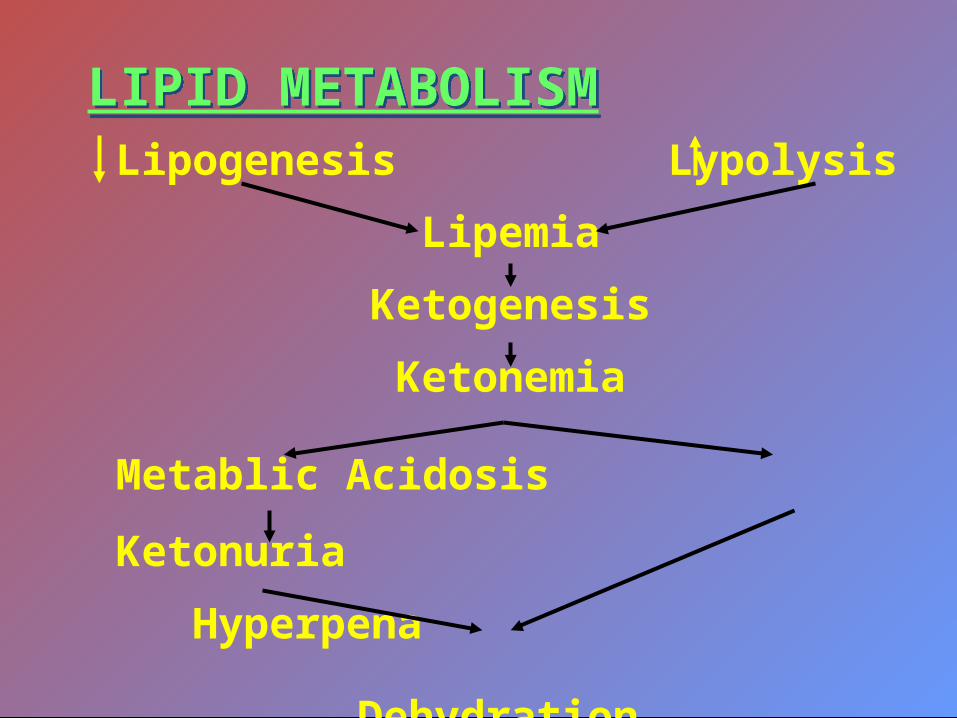
LIPID METABOLISMLIPID METABOLISMLipogenesis Lypolysis
Lipemia
Ketogenesis
Ketonemia
Metablic Acidosis
Ketonuria
Hyperpena
Dehydration
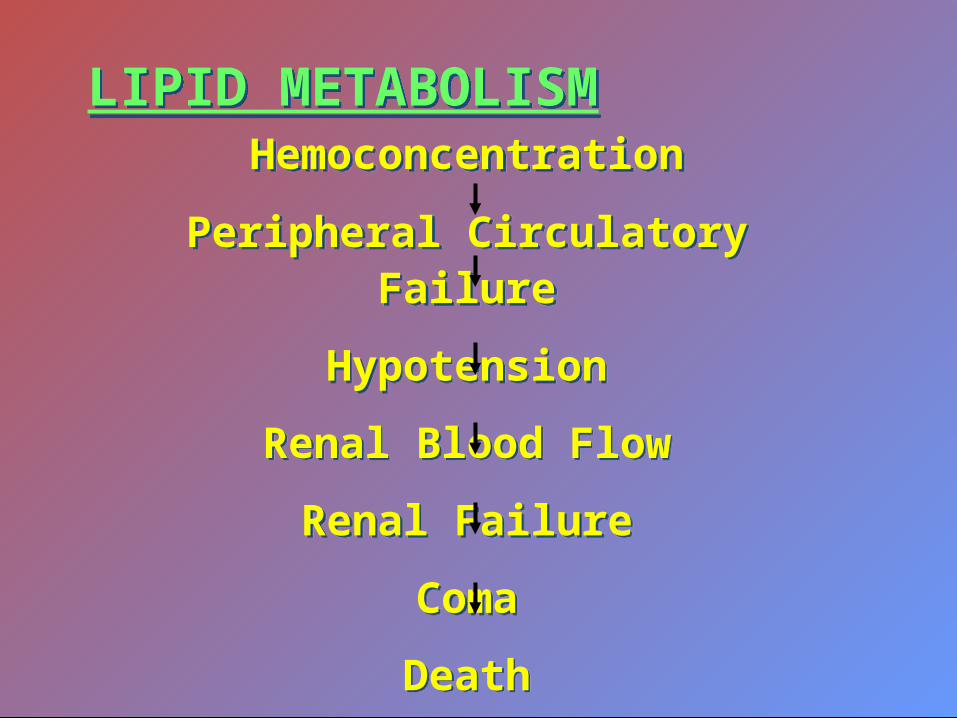
LIPID METABOLISMLIPID METABOLISMHemoconcentration
Peripheral Circulatory Failure
Hypotension
Renal Blood Flow
Renal Failure
Coma
Death
Hemoconcentration
Peripheral Circulatory Failure
Hypotension
Renal Blood Flow
Renal Failure
Coma
Death
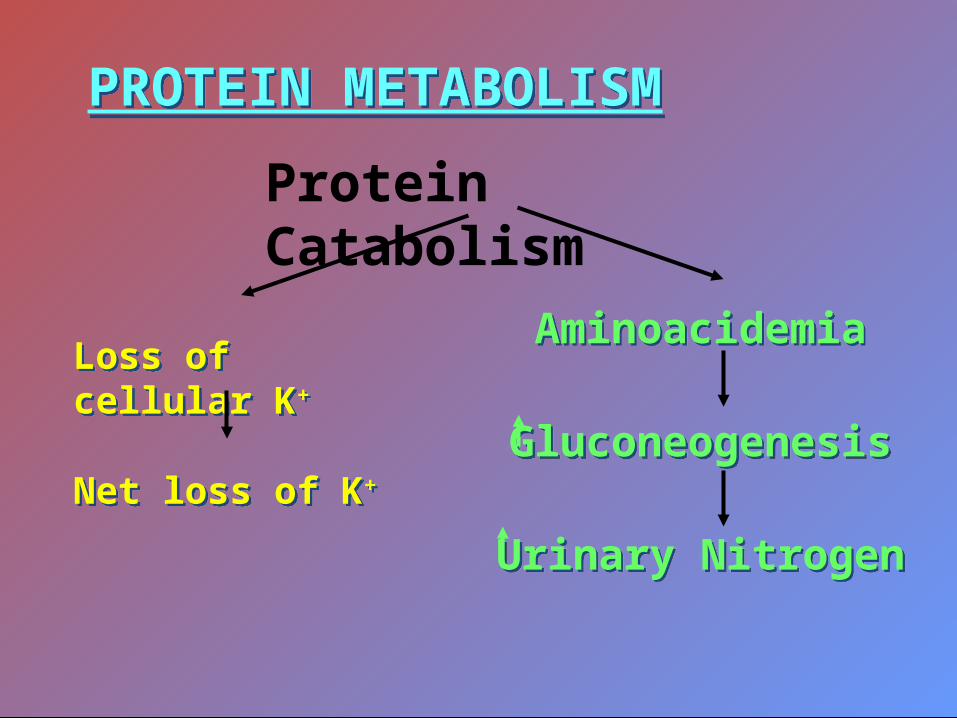
PROTEIN METABOLISMPROTEIN METABOLISM
Aminoacidemia
Gluconeogenesis
Urinary Nitrogen
Aminoacidemia
Gluconeogenesis
Urinary Nitrogen
Loss of cellular K+
Net loss of K+
Loss of cellular K+
Net loss of K+
Protein Catabolism
3 Years 5 years 10 years 15 years0
10
20
30
40
50
60
70
80
90
Prev
alen
ce (%
)
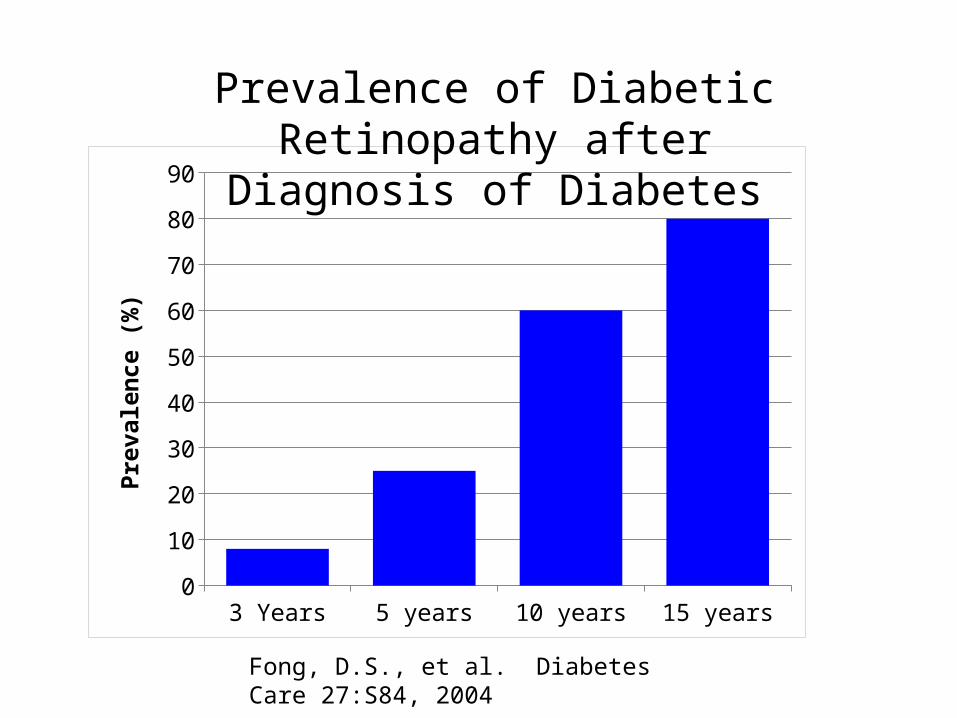
Fong, D.S., et al. Diabetes Care 27:S84, 2004
Prevalence of Diabetic Retinopathy after Diagnosis of Diabetes
• heart and blood vessels • digestive system • urinary tract • sex organs • sweat glands • eyes
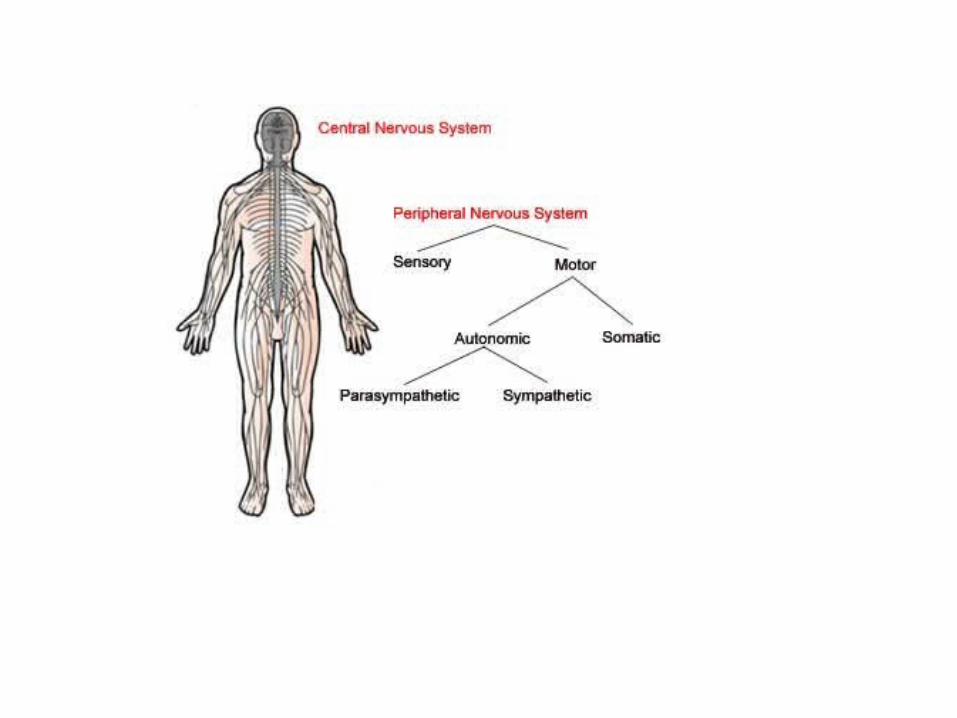
AUTONOMIC NEUROPATHY
• Unawareness of Hypoglycemia • Postural Hypotension • Unresponsive Heart Rate • Maldistribution of Blood Flow • Alternating Constipation and Uncontrolled diarrhea • Gastroparesis (stomach to empty too slowly)
• persistent nausea and vomiting, bloating, and loss of appetite.
• fluctuations in blood glucose levels • Swallowing difficulties • Incomplete bladder emptying
• bacteria to grow in the bladder and kidneys and causing urinary tract infections.
• Urinary incontinence • Decrease sexual response in men and women • Lack of or perfuse sweating • pupils less responsive to changes in light
AUTONOMIC NEUROPATHY
• toes • feet • legs • hands • arms
PERIPHERAL NEUROPATHY
• numbness or insensitivity to pain or temperature
• a tingling, burning, or prickling sensation
• sharp pains or cramps • extreme sensitivity to touch, even a
light touch • loss of balance and coordination
PERIPHERAL NEUROPATHY
• eyes • facial muscles • ears • pelvis and lower back • thighs • abdomen
FOCAL NEUROPATHY
• inability to focus the eye • double vision • aching behind one eye • paralysis on one side of the face (Bell's palsy) • severe pain in the lower back or pelvis • pain in the front of a thigh • pain in the chest, stomach, or flank • pain on the outside of the shin or inside the foot • chest or abdominal pain that is sometimes mistaken
for heart disease, heart attack, or appendicitis
FOCAL NEUROPATHY
• thighs • hips • buttocks
PROXIMAL NEUROPATHY
• pain in either the thighs, hips, buttocks, or legs, usually on one side of the body
• weakness in the legs, manifested by an inability to go from a sitting to a standing position without help
PROXIMAL NEUROPATHY
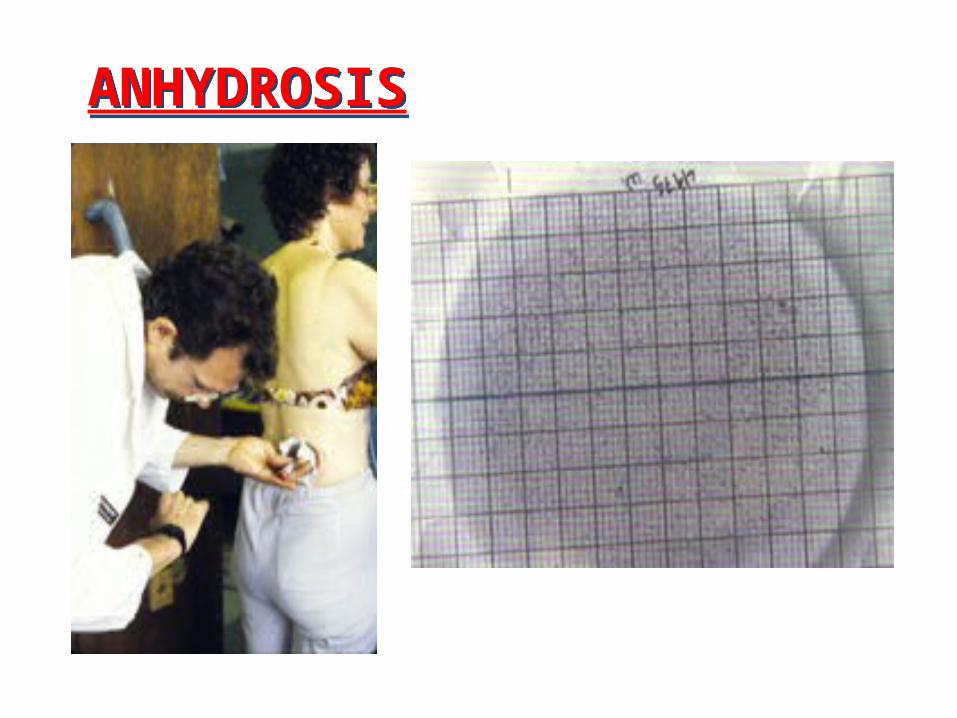
ANHYDROSISANHYDROSIS
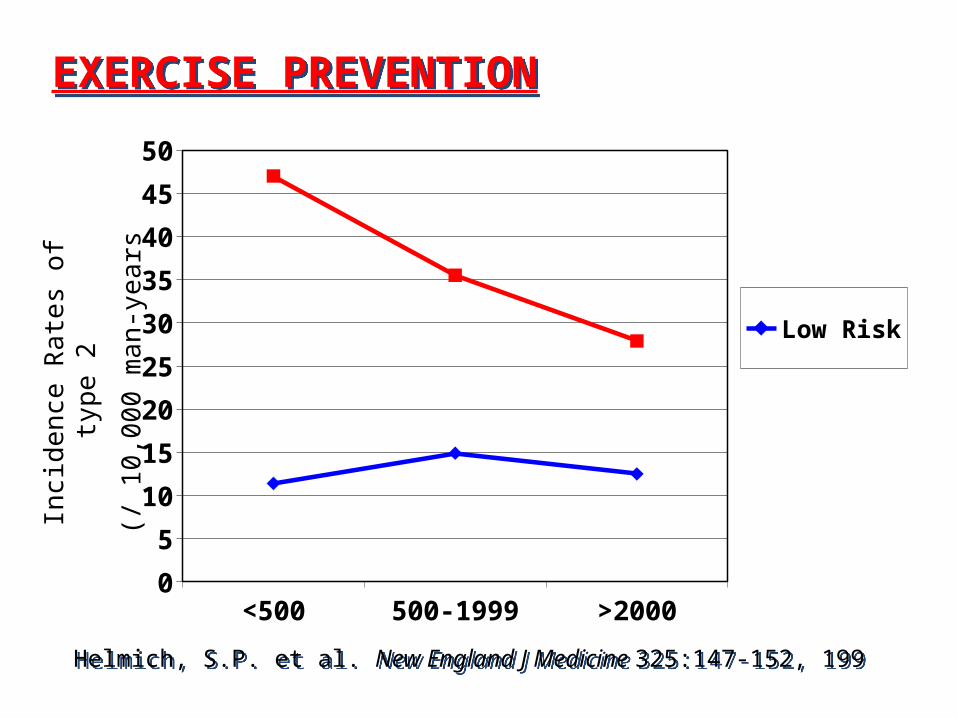
EXERCISE PREVENTIONEXERCISE PREVENTION
<500 500-1999 >20000
5
10
15
20
25
30
35
40
45
50
Low Risk
High Risk
Helmich, S.P. et al. New England J Medicine 325:147-152, 199Helmich, S.P. et al. New England J Medicine 325:147-152, 199
Inci
den
ce R
ate
s of
typ
e 2
(/ 1
0,0
00
ma
n-ye
ars
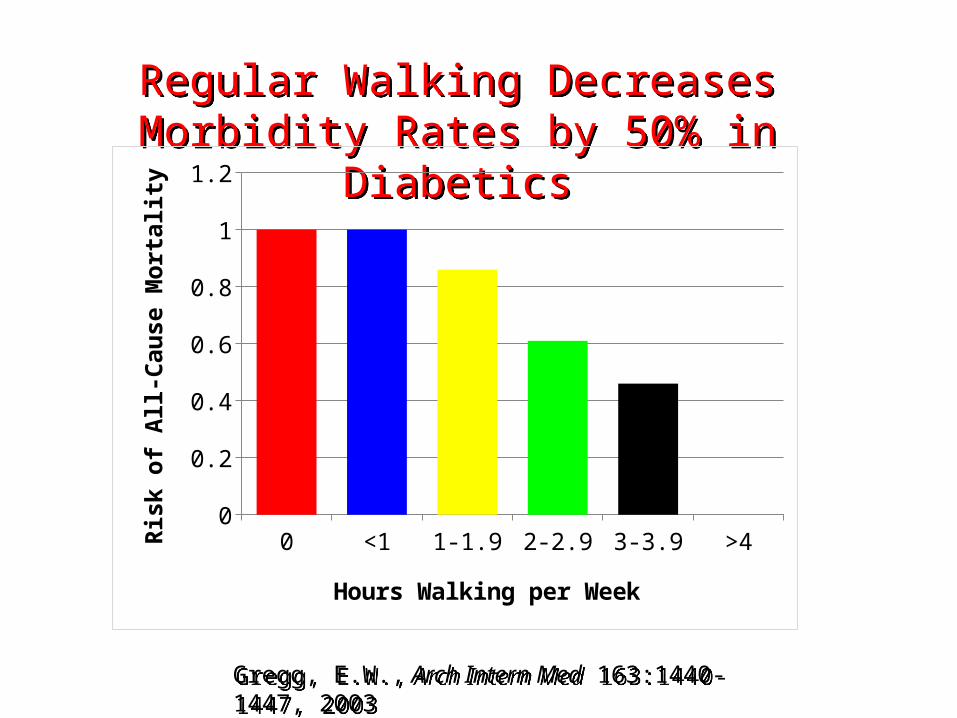
Regular Walking Decreases Morbidity Rates by 50% in Diabetics
Regular Walking Decreases Morbidity Rates by 50% in Diabetics
Gregg, E.W., Arch Intern Med 163:1440-1447, 2003Gregg, E.W., Arch Intern Med 163:1440-1447, 2003
0 <1 1-1.9 2-2.9 3-3.9 >40
0.2
0.4
0.6
0.8
1
1.2
Hours Walking per Week
Risk
of A
ll-Ca
use
Mor
talit
y
Pre Post5
6
7
8
9
10
11
12
13
Gly
cosy
late
d H
b (%
)
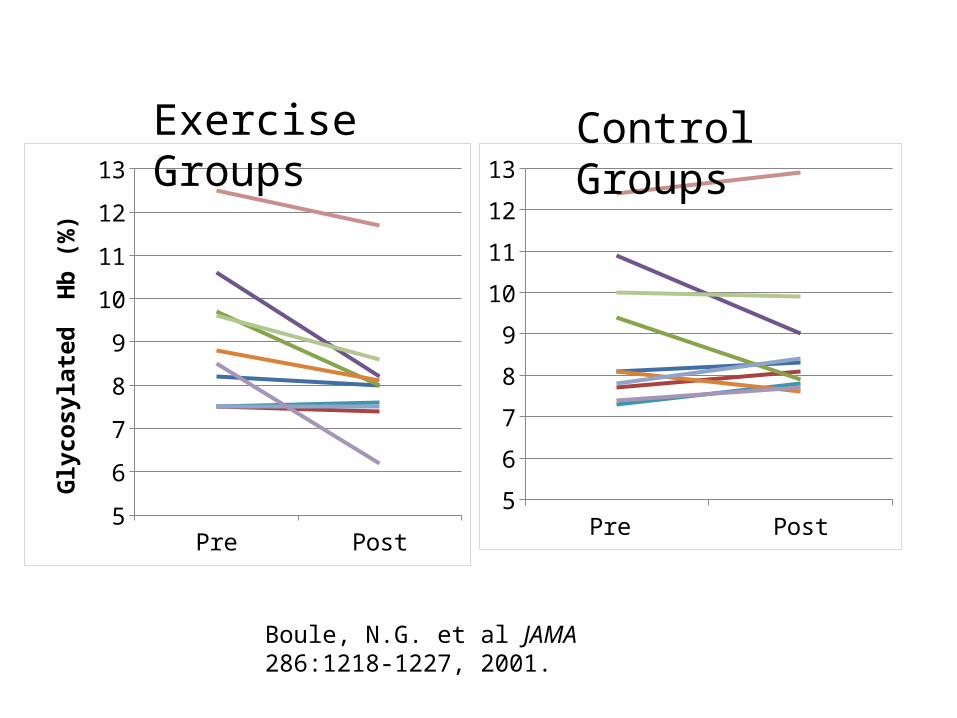
Boule, N.G. et al JAMA 286:1218-1227, 2001.
Pre Post5
6
7
8
9
10
11
12
13Exercise Groups Control Groups
Pre Post50
60
70
80
90
100
110
Body
Wei
ght (
kg)
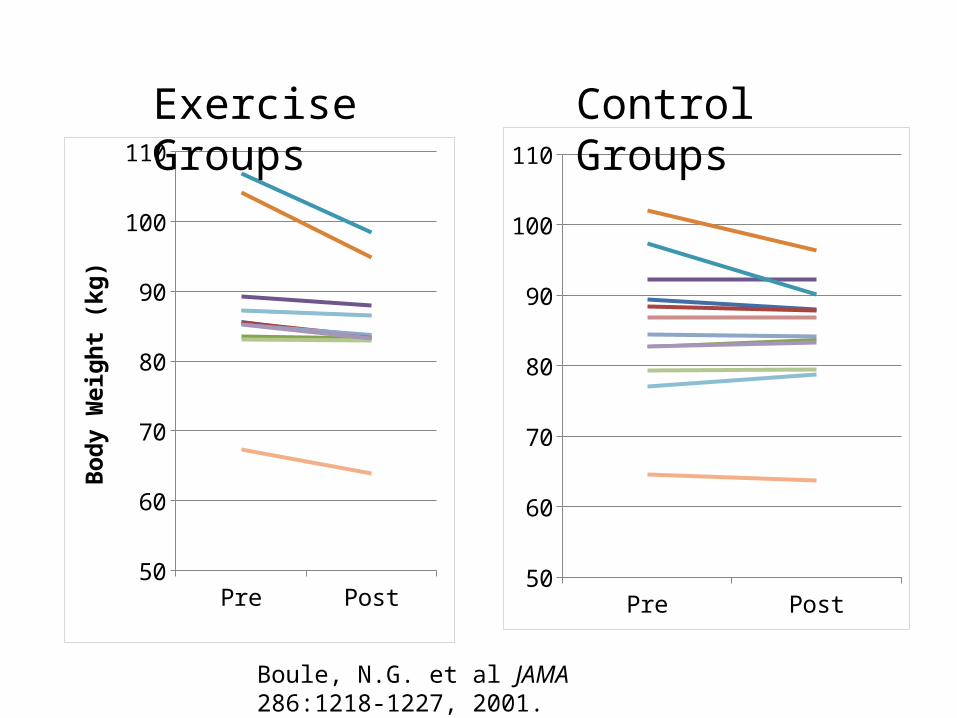
Boule, N.G. et al JAMA 286:1218-1227, 2001.
Pre Post50
60
70
80
90
100
110
Exercise Groups Control Groups
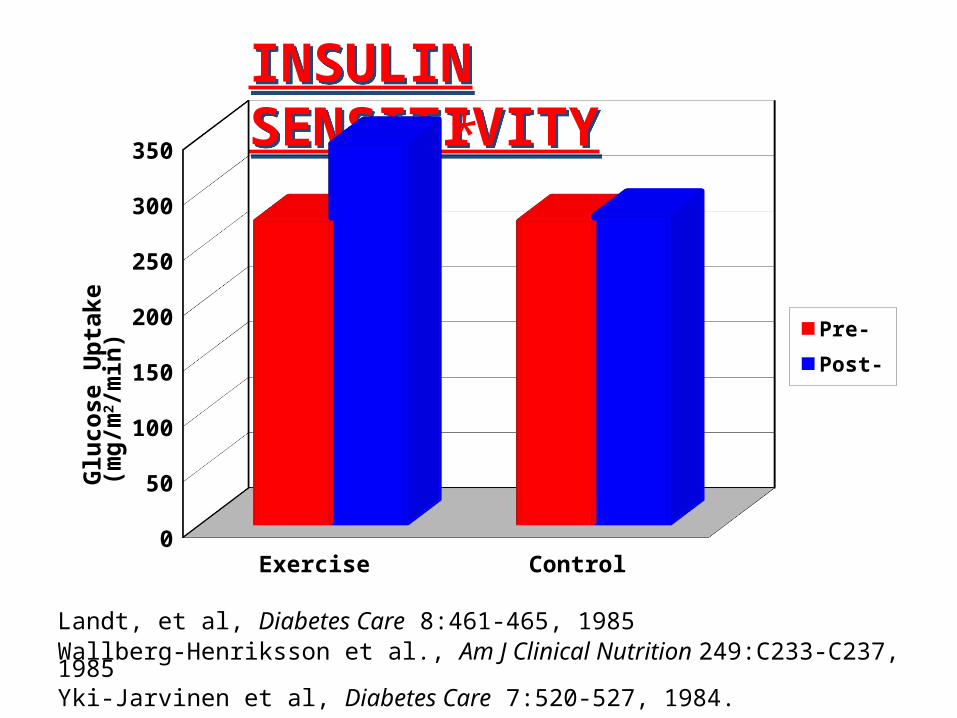
INSULIN SENSITIVITYINSULIN SENSITIVITY
Exercise Control0
50
100
150
200
250
300
350
Pre-
Post-
Glu
cose U
pta
ke
(mg
/m2/m
in)
*
Landt, et al, Diabetes Care 8:461-465, 1985Wallberg-Henriksson et al., Am J Clinical Nutrition 249:C233-C237, 1985Yki-Jarvinen et al, Diabetes Care 7:520-527, 1984.
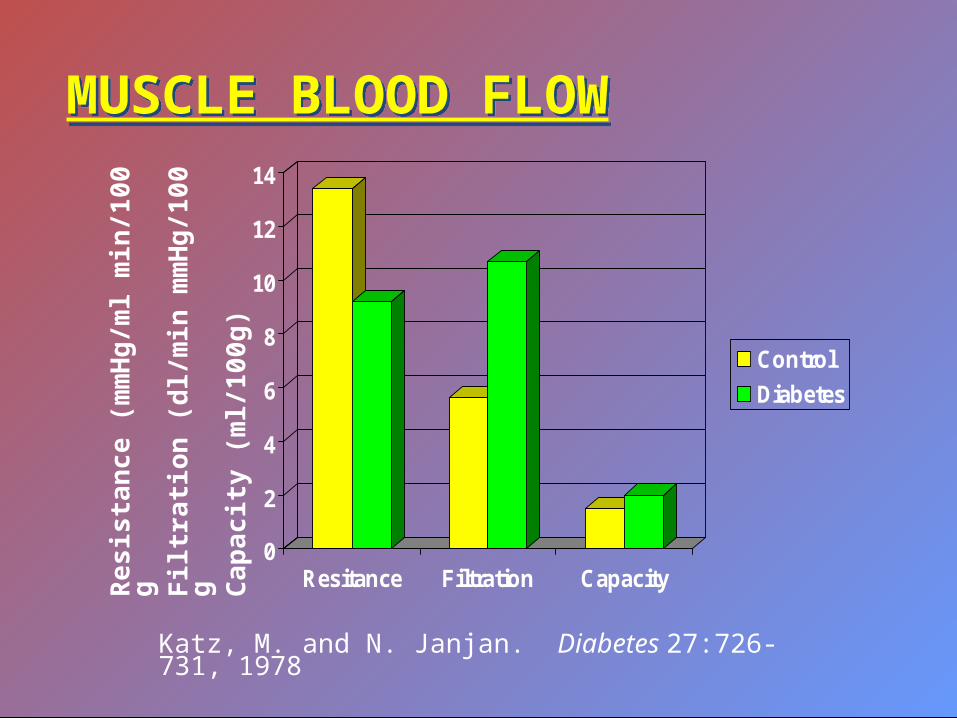
MUSCLE BLOOD FLOWMUSCLE BLOOD FLOW
Katz, M. and N. Janjan. Diabetes 27:726-731, 1978
0
2
4
6
8
10
12
14
Resitance Filtration Capacity
Control
Diabetes
Resis
tan
ce (
mm
Hg
/ml
min
/100 g
Filtr
ati
on
(d
l/m
in m
mH
g/1
00
g Cap
acit
y (
ml/
100
g)
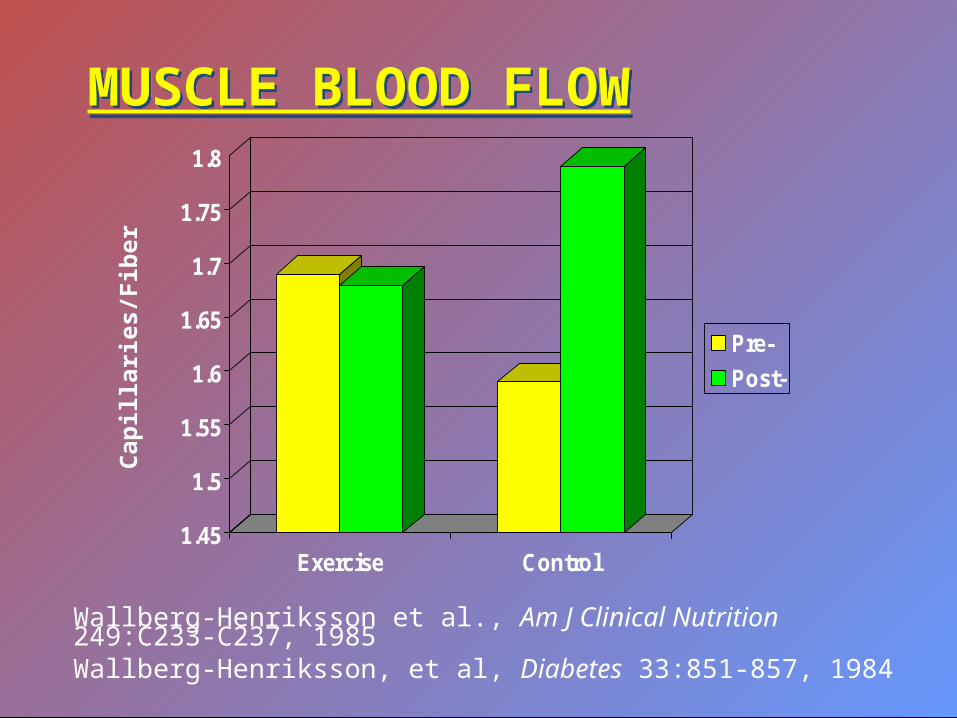
MUSCLE BLOOD FLOWMUSCLE BLOOD FLOW
Wallberg-Henriksson et al., Am J Clinical Nutrition 249:C233-C237, 1985Wallberg-Henriksson, et al, Diabetes 33:851-857, 1984
1.45
1.5
1.55
1.6
1.65
1.7
1.75
1.8
Exercise Control
Pre-
Post-
Cap
illa
ries/F
iber
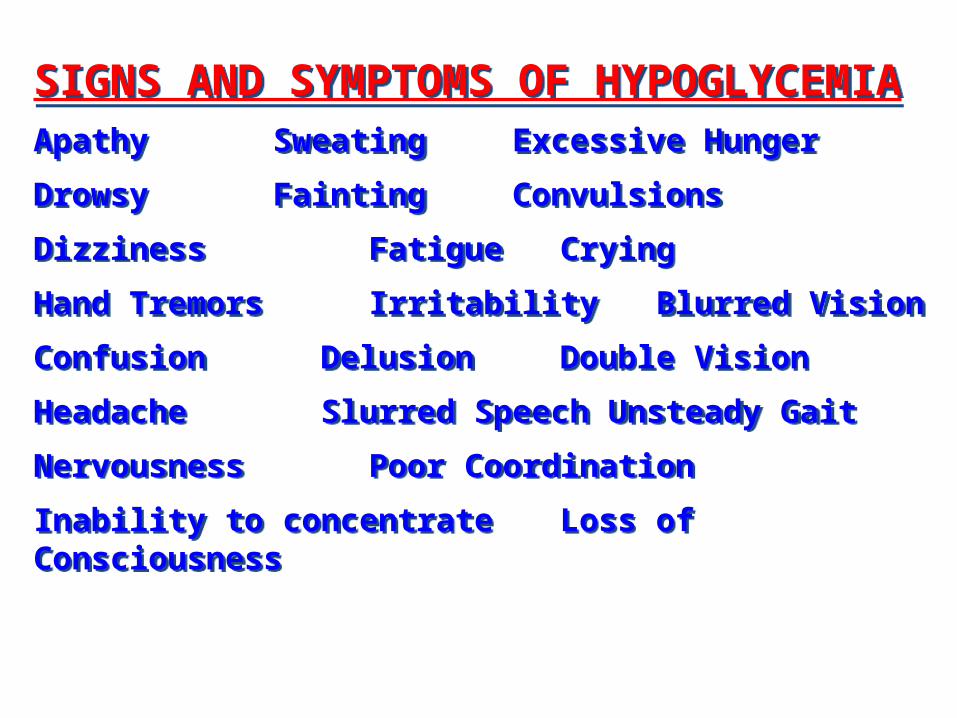
SIGNS AND SYMPTOMS OF HYPOGLYCEMIAApathy Sweating Excessive Hunger
Drowsy Fainting Convulsions
Dizziness Fatigue Crying
Hand Tremors Irritability Blurred Vision
Confusion Delusion Double Vision
Headache Slurred Speech Unsteady Gait
Nervousness Poor Coordination
Inability to concentrate Loss of Consciousness