Embed Size (px)
Citation preview

Chairperson: Prof. Y Veriava Chief Executive & Registrar: Dr M Gantsho
Block A, Eco Glades 2 Office Park, 420 Witch-Hazel Avenue, Eco Park, Centurion, 0157 Tel: 012 431 0500 Fax: 012 430 7644 Customer Care: 0861 123 267
[email protected] www.medicalschemes.com
Prevalence of chronic diseases in the
population covered by medical schemes in
South Africa Research and Monitoring Unit
January 2015
Chairperson: Prof. Y Veriava Chief Executive & Registrar: Dr M Gantsho
Block A, Eco Glades 2 Office Park, 420 Witch-Hazel Avenue, Eco Park, Centurion, 0157 Tel: 012 431 0500 Fax: 012 430 7644 Customer Care: 0861 123 267
[email protected] www.medicalschemes.com
Table of contents
Executive Summary ................................................................................................................................. 4
1 Introduction .................................................................................................................................... 10
2 Methodology .................................................................................................................................. 11
2.1 Data sources ......................................................................................................................... 11
2.2 Analytical approach ............................................................................................................... 11
2.3 Sampling ................................................................................................................................ 12
3 Results ........................................................................................................................................... 14
3.1 Scheme demographics .......................................................................................................... 14
3.2 CDL prevalence per scheme type .......................................................................................... 15
3.3 CDL prevalence by age and gender ...................................................................................... 16
3.3.1 Chronic respiratory conditions ........................................................................................... 16
3.3.2 Cardiovascular conditions .................................................................................................. 19
3.3.3 Chronic renal disease ........................................................................................................ 22
3.3.4 Gastrointestinal disorders .................................................................................................. 24
3.3.5 Diabetes mellitus ............................................................................................................... 26
3.3.6 Psychiatric conditions ........................................................................................................ 28
3.3.7 Neurological disorders ....................................................................................................... 30
3.3.8 Auto-immune Conditions ................................................................................................... 32
3.3.9 Addison’s disease .............................................................................................................. 34

ii
3.3.10 Diabetes Insipidus ......................................................................................................... 35
3.3.11 Glaucoma ...................................................................................................................... 36
3.3.12 Haemophilia ................................................................................................................... 37
3.3.13 Hyperlipidaemia ............................................................................................................. 38
3.3.14 Parkinson’s disease ....................................................................................................... 40
3.3.15 Hypothyroidism .............................................................................................................. 41
3.3.16 HIV/AIDS ....................................................................................................................... 43
3.4 Multiple CDL conditions: 2008 - 2013 .................................................................................... 44
4 Discussion ..................................................................................................................................... 46
5 References .................................................................................................................................... 47
1
List of figures
Figure 1 : Top 10 diagnosed and treated CDL conditions: 2008 - 2013 ................................................... 5
Figure 2: Growth in top 10 CDL conditions (2008 compared to 2013) ..................................................... 8
Figure 3: Annual average growth rate (per year) in top 10 CDL conditions (2008 to 2013) ..................... 9
Figure 4: Overall prevalence of chronic respiratory diseases by gender ............................................... 17
Figure 5: Overall prevalence of treated asthma (AST) by age and gender ............................................ 17
Figure 6: Overall prevalence of treated chronic obs. pulmonary disease (COPD) by age and gender .. 18
Figure 7: Overall prevalence of treated Bronchiectasis (BCE) by age and gender ................................ 18
Figure 8: Overall prevalence of cardiovascular conditions by gender .................................................... 19
Figure 9: Overall prevalence of treated cardiomyopathy (CMY) by age and gender. ............................ 20
Figure 10: Overall prevalence of treated coronary artery disease) IHD by age and gender .................. 21
Figure 11: Overall prevalence of treated dysrhythmias (DYS) by age and gender ................................ 21
Figure 12: Overall prevalence of treated hypertension (HYP) by age and gender ................................. 22
Figure 13: Overall prevalence of chronic renal disease by gender ........................................................ 23
Figure 14: Overall prevalence of treated chronic renal disease (CRF) by age and gender ................... 23
Figure 15: Overall prevalence of gastrointestinal disorders by gender .................................................. 24
Figure 16: Overall prevalence of treated Crohn’s disease (CSD) by age and gender ........................... 25
Figure 17: Overall prevalence of treated ulcerative colitis (IBD) by age and gender ............................. 25
Figure 18: Overall prevalence of diabetes mellitus by gender ............................................................... 26

2
Figure 19: Overall prevalence of treated diabetes mellitus type 1 (DM1) by age and gender ................ 27
Figure 20: Overall prevalence of treated diabetes mellitus type 2 (DM2) by age and gender ................ 27
Figure 21: Overall prevalence of psychiatric disorders by gender ......................................................... 28
Figure 22: Overall prevalence of treated bipolar mood disorder (BMD) by age and gender .................. 29
Figure 23: Overall prevalence of treated schizophrenia (SCZ) by age and gender ............................... 29
Figure 24: Overall prevalence of Neurological disorders by gender ...................................................... 30
Figure 25: Overall prevalence of treated epilepsy (EPL) by age and gender ......................................... 31
Figure 26: Overall prevalence of treated multiple sclerosis (MSS) by age and gender .......................... 31
Figure 27: Overall prevalence of Auto-immune conditions by gender .................................................... 32
Figure 28: Overall prevalence of treated rheumatoid arthritis (RHA) by age and gender ...................... 33
Figure 29: Overall prevalence of treated systemic lupus erythematosus (SLE) by age and gender ...... 33
Figure 30: Overall prevalence of Addison’s disease by gender ............................................................. 34
Figure 31: Overall prevalence of treated Addison’s disease (ADS) by age and gender ........................ 34
Figure 32: Overall prevalence of Diabetes Insipidus by gender ............................................................. 35
Figure 33: Overall prevalence of treated diabetes insipidus (DBI) by age and gender .......................... 36
Figure 34: Overall prevalence of Glaucoma by gender .......................................................................... 36
Figure 35: Overall prevalence of treated glaucoma (GLC) by age and gender ...................................... 37
Figure 36: Overall prevalence of Haemophilia by gender ...................................................................... 38
Figure 37: Overall prevalence of treated haemophilia (HAE) by age and gender .................................. 38
Figure 38: Figure 38: Overall prevalence of Hyperlipidaemia by gender ............................................... 39
3
Figure 39: Overall prevalence of treated hyperlipidaemia (HYL) by age and gender ............................. 40
Figure 40: Overall prevalence of Parkinson’s disease by gender .......................................................... 40
Figure 41: Overall prevalence of treated Parkinson’s disease (PAR) by age and gender ..................... 41
Figure 42: Overall prevalence of Hypothyroidism by gender ................................................................. 42
Figure 43: Overall prevalence of treated hypothyroidism (TDH) by age and gender ............................. 42
Figure 44: Overall prevalence of HIV/AIDS by gender ........................................................................... 43
Figure 45: Overall prevalence of treated HIV/AIDS by age and gender ................................................. 44
Figure 46: Multiple CDL conditions: 2008 - 2013 ................................................................................... 45
4
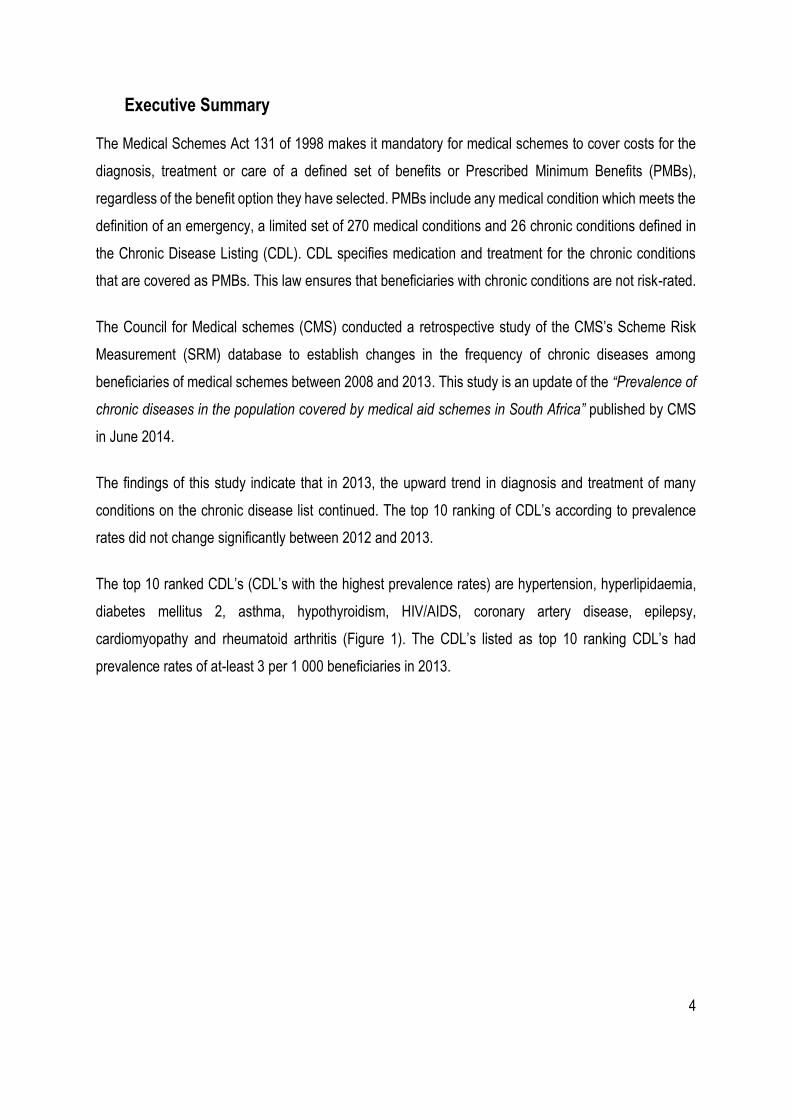
Executive Summary
The Medical Schemes Act 131 of 1998 makes it mandatory for medical schemes to cover costs for the
diagnosis, treatment or care of a defined set of benefits or Prescribed Minimum Benefits (PMBs),
regardless of the benefit option they have selected. PMBs include any medical condition which meets the
definition of an emergency, a limited set of 270 medical conditions and 26 chronic conditions defined in
the Chronic Disease Listing (CDL). CDL specifies medication and treatment for the chronic conditions
that are covered as PMBs. This law ensures that beneficiaries with chronic conditions are not risk-rated.
The Council for Medical schemes (CMS) conducted a retrospective study of the CMS’s Scheme Risk
Measurement (SRM) database to establish changes in the frequency of chronic diseases among
beneficiaries of medical schemes between 2008 and 2013. This study is an update of the “Prevalence of
chronic diseases in the population covered by medical aid schemes in South Africa” published by CMS
in June 2014.
The findings of this study indicate that in 2013, the upward trend in diagnosis and treatment of many
conditions on the chronic disease list continued. The top 10 ranking of CDL’s according to prevalence
rates did not change significantly between 2012 and 2013.
The top 10 ranked CDL’s (CDL’s with the highest prevalence rates) are hypertension, hyperlipidaemia,
diabetes mellitus 2, asthma, hypothyroidism, HIV/AIDS, coronary artery disease, epilepsy,
cardiomyopathy and rheumatoid arthritis (Figure 1). The CDL’s listed as top 10 ranking CDL’s had
prevalence rates of at-least 3 per 1 000 beneficiaries in 2013.

5
Figure 1 : Top 10 diagnosed and treated CDL conditions: 2008 - 2013
Hypertension, hyperlipidaemia and diabetes mellitus 2 continued to be the highest prevalent CDL’s in
medical schemes beneficiaries with the prevalence of more than 20 per 1 000 beneficiaries. Changes in
the prevalence rankings of CDL’s mainly occurred in HIV/AIDS which moved higher in the rankings from
6th to 4th in 2013. Asthma and hypothyroidism dropped one level lower to 5th and 6th respectively.
Rheumatoid arthritis moved one level higher to replace dysrhythmias in the top 10 prevalence ranking
CDL’s (Table 1). A detailed summary of the top 10 prevalence ranking CDL’s is given in table 1 below.

6
Table 1: Prevalence of chronic conditions (Cases/1 000 beneficiaries), 2012 and 2013
Rank (2012)
Condition Type Prevalence % Changes** Average growth rate (per year %)
2008 2012 2013 2012 vs 2013
2008 vs 2013
2008 to 2013
1 (1)
Hypertension (HYP)
Total 65.51 86.16 87.2 1.2 33.1 5.9
Open 61.92 86.92 87.62 0.8 41.5 7.2
Restricted 65.99 85.3 86.68 1.6 31.4 5.6
2 (2)
Hyperlipidaemia (HYL)
Total 27.71 35.58 34.78 -2.2 25.5 4.6
Open 33.54 40.5 39.64 -2.1 18.2 3.4
Restricted 27.20 30.03 28.87 -3.9 6.1 1.2
3 (3)
Diabetes mellitus type 2 (DM2)
Total 16.03 25.66 26.91 4.9 67.9 10.9
Open 14.75 23.01 24.14 4.9 63.7 10.4
Restricted 18.07 28.65 30.28 5.7 67.5 10.9
4 (6)
HIV/AIDS (Receiving ARVs)
Total 6.60 14.57 17.41 19.5 163.7 21.4
Open 6.07 8.53 10.24 20.0 68.6 11.0
Restricted 6.95 21.39 26.12 22.1 275.9 30.3
5 (4)
Asthma (AST) Total 13.00 15.77 15.79 0.1 21.5 4.0
Open 13.00 15.78 16.02 1.5 23.2 4.3
Restricted 13.75 15.77 15.51 -1.6 12.8 2.4
6 (5)
Hyperthyroidism (TDH)
Total 11.48 14.7 14.45 -1.7 25.9 4.7
Open 11.03 15.23 14.97 -1.7 35.7 6.3
Restricted 11.79 14.09 13.83 -1.8 17.3 3.2
7 (7)
Ischaemic heart disease (IHD)
Total 6.58 7.3 6.87 -5.9 4.4 0.9
Open 6.87 8.35 7.78 -6.8 13.2 2.5
Restricted 5.58 6.11 5.77 -5.6 3.5 0.7
8 (8)
Epilepsy (EPL) Total 3.49 4.24 4.26 0.5 22.1 4.1
Open 3.53 4.44 4.47 0.7 26.5 4.8
Restricted 3.35 4.01 3.99 -0.5 19.0 3.5
9 (9)
Cardiomyopathy (CMY & CHF)
Total 3.96 4.17 4.22 1.2 6.5 1.3
Open 3.95 4.03 4.07 1.0 3.1 0.6
Restricted 3.41 4.34 4.39 1.2 28.6 5.2
10 (11)
Rheumatoid Arthritis (RHA)
Total 2.09 2.93 2.96 1.0 41.7 7.2
Open 1.99 2.84 2.87 1.1 44.4 7.6
Restricted 2.05 3.03 3.08 1.7 50.4 8.5 ** Percentage changes may not add-up due to rounding

7
Table 1 and figure 2 depicts trends in the top 10 common conditions between 2008 and 2013.
Hypertension retained its rank as the highest prevalent CDL in medical schemes beneficiaries with an
overall prevalence rate of 87.2 per 1 000 beneficiaries in 2013. Hypertension prevalence increased by
1.2 % in 2013 as compared to 2012. Over the period between 2008 and 2013, hypertension prevalence
increased by 33.1% resulting in the average annual growth rate of 5.9% per year for the period. The
growth in hypertension prevalence has been consistent in open and restricted schemes for the period
under review.
Hyperlipidaemia continued to be the 2nd ranked CDL in terms of prevalence despite its prevalence rate
decreasing by 2.2% in 2013. The decrease in the prevalence of hyperlipidaemia occurred in both open
and restricted schemes. Between 2008 and 2013, the prevalence of hyperlipidaemia increased by 25.5%
resulting in an average growth rate of 4.6% per year for the period under review.
Diabetes mellitus 2 is still the 3rd ranked CDL in terms of prevalence. Between 2008 and 2013, prevalence
of diabetes mellitus 2 increased by 67.9% (from 16.03 to 26.91 per 1 000). This represents an average
growth rate of 10.9% per year for the period between 2008 and 2013.
HIV/AIDS moved two ranks higher to be ranked the 4th CDL in terms of prevalence. Between 2008 and
2013, HIV/AIDS prevalence increased by about 163.7%. This resulted in the average growth rate of about
21.4% per year for the period under review. In 2013, HIV/AIDS prevalence increased by 19.5% as
compared to 2012.

8
Figure 2: Growth in top 10 CDL conditions (2008 compared to 2013)
Other CDL conditions had prevalence rates that are below 16 per 1 000 beneficiaries (as shown in
table 1). The average growth rates per year for the top 10 CDL conditions (for the period 2008 and
2013) are as summarised in figure 3 below. According to figure 3, HIV/AIDS has been the fastest
increasing CDL followed by diabetes mellitus 2 with the average growth rate of these CDLs being
above 10% per year. Other conditions, though increasing, had annual average growth rates that were
below 10% per year.

9
Figure 3: Annual average growth rate (per year) in top 10 CDL conditions (2008 to 2013)
The number of medical scheme beneficiaries who were diagnosed and treated for multiple CDL
conditions increased by more than 25% in 2013 (2012 compared to 2013) while a number of beneficiaries
with four or more CDL conditions increased by about 78%. This will have a negative impact on the risk
profiles of medical schemes. The deterioration in risk profiles should be a concern for medical schemes
and schemes should ensure that value for money is attained from the managed care programs.
The upward trend in diagnosis and treatment of many chronic conditions on the CDL continued in 2013.
Whilst this study is not yet in a position to isolate specific reasons for this increase in chronic diseases,
the trend could still be generally attributed to improved data management systems of medical schemes
and administrators, the deteriorating disease profile and increased beneficiary awareness of entitlements
and changes in care-seeking behaviour.

10
1 Introduction
The Medical Schemes Act 131 of 1998 makes it mandatory for medical schemes to cover costs for the
diagnosis, treatment or care of a defined set of benefits or Prescribed Minimum Benefits (PMBs),
regardless of the benefit option they have selected. PMBs include any medical condition which meets the
definition of an emergency, a limited set of 270 medical conditions and 26 chronic conditions defined in
the Chronic Disease Listing (CDL). CDL specifies medication and treatment for the chronic conditions
that are covered as PMBs.
The recent study conducted by the CMS evaluated prevalence of CDL’s in medical schemes as reported
in the CMS Scheme Risk Measurement (SRM) database for the period 2007 to 2012 and was published
in June 2014. The study was a follow up to the 2013 study which evaluated CMS Scheme Risk
Measurement database for the period 2006 to 2011.
In 2014/15 the CMS conducted a retrospective study of the CMS Scheme Risk Measurement database
for the period 2008 to 2013. This report presents the results of the retrospective review of the trends in
the prevalence of chronic diseases in the medical schemes industry from 2008 to 2014. This is a follow-
up to the “Prevalence of chronic diseases in the population covered by medical aid schemes in South
Africa” published by CMS in June 2014 (Council for Medical Schemes, 2014).

11
2 Methodology
2.1 Data sources
This study relied on the data that was submitted by medical schemes for the purposes of the Scheme
Risk Measurement project (SRM). The SRM database contains aggregate prevalence data for more than
99% of all medical schemes beneficiaries. Medical schemes use the rules set out in the “Guidelines for
the Identification of Beneficiaries with Risk Factors in Accordance with the Entry and Verification Criteria”
(Council for Medical Schemes, 2014) to identify each chronic disease case.
2.2 Analytical approach
Prevalence in this report is calculated as an annual average prevalence based on the average annual
beneficiaries. This methodology is similar to the methodology used in the 2014 report (covering the period
2007 to 2012). In the 2013 study covering the period 2006 to 2011, prevalence rates were calculated
using prevalence for the month of June each year. The difference between these two approaches is not
significant, but caution should be exercised when comparing the findings of the different reports.
The “Guidelines for the Identification of Beneficiaries with Risk Factors in Accordance with the Entry and
Verification Criteria” (Council for Medical Schemes, 2014) was used as a guideline when analysing the
results. According to these guidelines, the age band “Under 1” is not populated with CDL or HIV
information, all beneficiaries under one with CDLs are included in the “NON” category. Hence, all CDL
and HIV prevalence for the “Under 1” age band is zero.
All prevalence statistics in the report was analysed at a two digit level. There are instances where the
reported percentage changes do not necessarily add up to the calculated prevalence movement. This
discrepancy is mainly caused by rounding off and do not affect the validity of the reported statistics.

12
2.3 Sampling
Only data that was deemed to be of acceptable quality through the SRM data quality evaluation process
was included in the analysis. The proportion of beneficiaries that was sampled was above 90% in 2013.
The chronic diseases that were analysed in this study are as given in table 2 below with the acronyms
used for each chronic disease.

13
Table 2: Chronic diseases in the Chronic Disease List
Chronic Disease Code Full Description
ADS Addison’s Disease
AST Asthma
BCE Bronchiectasis
BMD Bipolar Mood Disorder
CHF Cardiac failure1
CMY Cardiomyopathy
COPD Chronic Obs. Pulmonary Disease
CRF Chronic Renal Disease
CSD Crohn’s Disease
DBI Diabetes Insipidus
DM1 Diabetes Mellitus 1
DM2 Diabetes Mellitus 2
DYS Dysrhythmias
EPL Epilepsy
GLC Glaucoma
HAE Haemophilia
HYL Hyperlipidaemia
HYP Hypertension
IBD Ulcerative Colitis
IHD Coronary Artery Disease
MSS Multiple Sclerosis
PAR Parkinson’s Disease
RHA Rheumatoid Arthritis
SCZ Schizophrenia
SLE Systemic Lupus Erythematosus
TDH Hypothyroidism
HIV/AIDS HIV/AIDS
1 CHF was combined with CMY in the prevalence tables.

14
3 Results
3.1 Scheme demographics
Demographics of beneficiaries of all medical schemes are shown in Table 3. The number of beneficiaries
in all schemes increased by 1.1%, the average age decreased from 32.0 to 31.9 and the pensioner ratio
remained constant at 7.1% between 2012 and 2013 (CMS annual report 2013/14).
The number of beneficiaries in restricted schemes grew by 0.2% with the average age and pensioner
ratio increasing by 0.3% and 1.7%, respectively. The number of beneficiaries in open schemes grew by
1.8% with the average age increasing by 0.9% while the pensioner ratio remained constant between
2012 and 2013 (CMS annual report 2013/14).
Table 3: Medical schemes demographics (all beneficiaries, Statutory Returns)
Attribute
Restricted Open Total
2012 2013 % change
2012 2013 % change
2012 2013 % change
Lives 3 922 206 3 929 370 0.2 4 759 994 4 846 909 1.8 8 682 200 8 776 279 1.1
Average age 29.9 30.0 0.3 33.8 33.5 -0.9 32.0 31.9 -0.3
Pensioner ratio (%) 5.7 5.8 1.7 8.2 8.2 0.0 7.1 7.1 0.0
Table 4: Medical schemes demographics 2013 (sampled data, SRM database)
Attribute
Restricted Open Total
Total Sampled %
Proportion Total Sampled
% Proportion
Total Sampled %
Proportion
Lives 3 929 370 3 626 245 92 4 846 909 4 523 559 93.3 8 776 279 8 149 804 92.8
Average age 30 29.8 33.5 33.2 31.9 31.7
Pensioner ratio (%)
5.8 5.8 8.2 7.9 7.1 7

15
3.2 CDL prevalence per scheme type
The 2012 and 2013 average prevalence per 1 000 beneficiaries for the 26 CDL conditions in open and
restricted schemes are depicted in Table 5 below. Cardiomyopathy (CMY) and cardiac heart failure (CHF)
are reported together as per SRM Entry and Verification criteria.
Table 5: Average prevalence per 1 000 beneficiaries for the 26 CDL conditions**
Chronic Disease Code
2013 industry
rank (2012)
Restricted Open Total
2012 2013 % change
2012 2013 % change
2012 2013 % change
ADS 24 (24) 0.04 0.03 -25.5% 0.07 0.07 -1.0% 0.05 0.05 2.9%
AST 5 (4) 15.77 15.51 -1.6% 15.78 16.02 1.5% 15.77 15.79 0.1%
BCE 23 (23) 0.05 0.05 1.2% 0.06 0.06 5.3% 0.06 0.06 -4.2%
BMD 11 (13) 2.19 2.23 1.7% 3.27 3.55 8.5% 2.76 2.95 7.0%
CMY & CHF 9 (9) 4.34 4.39 1.2% 4.03 4.07 1.0% 4.17 4.22 1.1%
COP 15 (15) 0.89 0.86 -3.3% 1.63 1.55 -5.1% 1.29 1.24 -4.1%
CRF 17 (18) 0.31 0.35 11.8% 0.5 0.54 7.7% 0.41 0.45 10.2%
CSD 21 (21) 0.1 0.10 -4.7% 0.23 0.24 5.6% 0.17 0.18 3.7%
DBI 26 (25) 0.01 0.01 16.2% 0.02 0.02 -5.3% 0.02 0.02 -21.8%
DM1 14 (14) 2.22 2.10 -5.3% 2.77 2.65 -4.2% 2.51 2.41 -4.2%
DM2 3 (3) 28.65 30.28 5.7% 23.01 24.14 4.9% 25.66 26.91 4.9%
DYS 13 (10) 2.59 1.68 -35.2% 4.48 3.15 -29.8% 3.59 2.48 -30.8%
EPL 8 (8) 4.01 3.99 -0.4% 4.44 4.47 0.7% 4.24 4.26 0.4%
GLC 12 (12) 2.55 2.58 1.3% 3.22 3.23 0.2% 2.91 2.94 0.9%
HAE 25 (25) 0 0 0.0% 0.03 0.03 -14.0% 0.02 0.02 -21.7%
HYL 2 (2) 30.03 28.87 -3.9% 40.5 39.64 -2.1% 35.58 34.78 -2.3%
HYP 1 (1) 85.3 86.68 1.6% 86.92 87.62 0.8% 86.16 87.20 1.2%
IBD 19 (19) 0.23 0.20 -14.6% 0.42 0.42 -0.8% 0.33 0.32 -3.9%
IHD 7 (7) 6.11 5.77 -5.6% 8.35 7.78 -6.8% 7.3 6.87 -5.9%
MSS 22 (22) 0.07 0.08 19.7% 0.18 0.21 14.8% 0.13 0.15 16.3%
PAR 16 (16) 0.7 0.70 0.5% 0.9 0.86 -4.4% 0.81 0.79 -2.5%
RHA 10 (11) 3.03 3.08 1.7% 2.84 2.87 0.9% 2.93 2.96 1.1%
SCZ 18 (17) 0.42 0.43 2.4% 0.47 0.45 -3.5% 0.45 0.44 -1.5%
SLE 20 (20) 0.22 0.22 1.4% 0.3 0.31 3.1% 0.26 0.27 4.0%
TDH 6 (5) 14.09 13.83 -1.9% 15.23 14.97 -1.7% 14.7 14.45 -1.7%
HIV 4 (6) 21.39 26.12 22.1% 8.53 10.24 20.1% 14.57 17.41 19.5%
** Percentage changes may not add-up due to rounding

16
The prevalence rank of many CDL conditions has remained unchanged between 2012 and 2013. The
largest change in prevalence ranking was observed in dysrhythmias (DYS) and rheumatoid arthritis
(RHA). DYS was replaced by RHA in the top 10 ranked CDL conditions in 2013. The other top 10 CDL
conditions did not change significantly between 2012 and 2013.
Prevalence of CDL conditions is generally higher in open medical schemes as opposed to restricted
medical schemes. Cardiomyopathy (CMY), rheumatoid arthritis (RHA), diabetes mellitus 2 (DM2) and
HIV/AIDS were the only conditions out of the 26 CDL’s whose prevalence rates were higher in restricted
medical schemes. The prevalence rate for HIV/AIDS in restricted schemes is more than double the
corresponding prevalence in open medical schemes (Table 4). Detailed changes in CDL conditions are
discussed in more detail in the next section.
3.3 CDL prevalence by age and gender
3.3.1 Chronic respiratory conditions
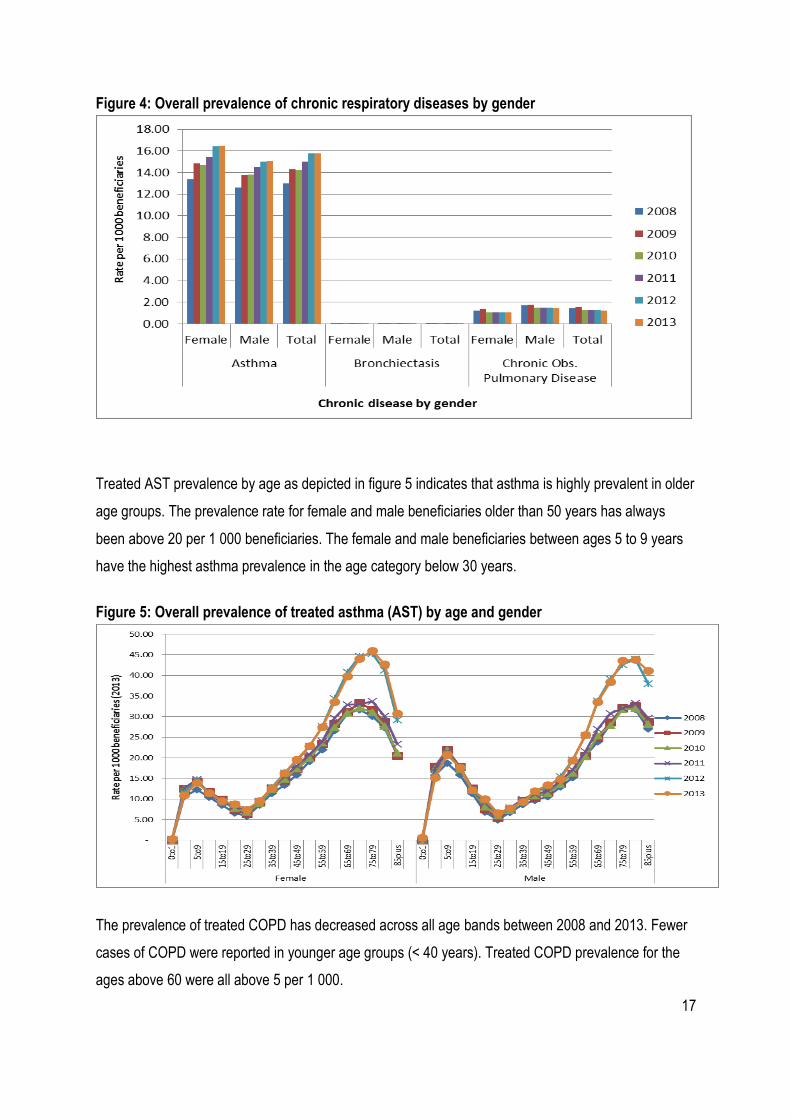
Figure 4 shows prevalence of treated chronic respiratory diseases in medical scheme beneficiaries by
gender. The overall prevalence of asthma (AST) increased from 13.0 per 1 000 in 2008 to 15.79 per
1 000 in 2013. This represents an increase of 21.5% for the period between 2008 and 2013. AST rates
were slightly higher in female beneficiaries as opposed to male beneficiaries.
The treated chronic obstructive pulmonary disease (COPD) prevalence rate decreased between 2008
and 2013. The overall prevalence for treated COPD decreased from 1.5 per 1 000 in 2008 to 1.2 per 1
000 in 2013. This represents a decrease of 15% for the period between 2008 and 2013. More male than
female beneficiaries were treated for COPD. In 2013, about 1.5 per 1 000 males received COPD
treatment while 1.0 per 1 000 females received treatment.
The overall prevalence of treated Bronchiectasis (BCE) has remained unchanged at about 0.1 per 1 000
between 2008 and 2013. There were no significant differences by gender.
17
Figure 4: Overall prevalence of chronic respiratory diseases by gender
Treated AST prevalence by age as depicted in figure 5 indicates that asthma is highly prevalent in older
age groups. The prevalence rate for female and male beneficiaries older than 50 years has always
been above 20 per 1 000 beneficiaries. The female and male beneficiaries between ages 5 to 9 years
have the highest asthma prevalence in the age category below 30 years.
Figure 5: Overall prevalence of treated asthma (AST) by age and gender
The prevalence of treated COPD has decreased across all age bands between 2008 and 2013. Fewer
cases of COPD were reported in younger age groups (< 40 years). Treated COPD prevalence for the
ages above 60 were all above 5 per 1 000.

18
Figure 6: Overall prevalence of treated chronic obs. pulmonary disease (COPD) by age and
gender
Prevalence of treated BCE has remained unchanged at levels below 0.7 per 1 000 beneficiaries
between 2008 and 2013 (Figure 7). BCE is a rare condition and resulted in volatile (not smoothed)
graphs throughout the period under review.
Figure 7: Overall prevalence of treated Bronchiectasis (BCE) by age and gender
19
3.3.2 Cardiovascular conditions
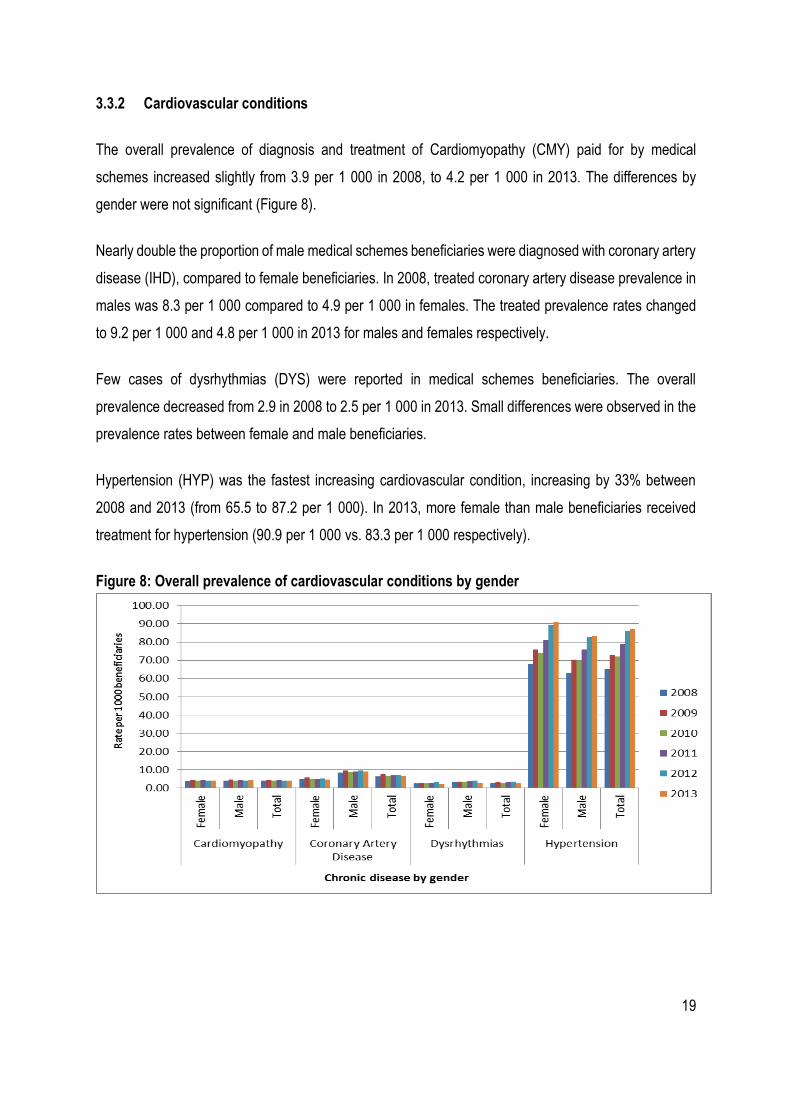
The overall prevalence of diagnosis and treatment of Cardiomyopathy (CMY) paid for by medical
schemes increased slightly from 3.9 per 1 000 in 2008, to 4.2 per 1 000 in 2013. The differences by
gender were not significant (Figure 8).
Nearly double the proportion of male medical schemes beneficiaries were diagnosed with coronary artery
disease (IHD), compared to female beneficiaries. In 2008, treated coronary artery disease prevalence in
males was 8.3 per 1 000 compared to 4.9 per 1 000 in females. The treated prevalence rates changed
to 9.2 per 1 000 and 4.8 per 1 000 in 2013 for males and females respectively.
Few cases of dysrhythmias (DYS) were reported in medical schemes beneficiaries. The overall
prevalence decreased from 2.9 in 2008 to 2.5 per 1 000 in 2013. Small differences were observed in the
prevalence rates between female and male beneficiaries.
Hypertension (HYP) was the fastest increasing cardiovascular condition, increasing by 33% between
2008 and 2013 (from 65.5 to 87.2 per 1 000). In 2013, more female than male beneficiaries received
treatment for hypertension (90.9 per 1 000 vs. 83.3 per 1 000 respectively).
Figure 8: Overall prevalence of cardiovascular conditions by gender

20
The prevalence of treated CMY has shown a slight increase across all age bands between 2008 and
2013. Very few cases of CMY were reported in younger age groups (<40 years). Similar increases were
observed in male and female beneficiaries
Figure 9: Overall prevalence of treated cardiomyopathy (CMY) by age and gender.
The prevalence of treated IHD has shown slight decreases across all age bands older than 55 years
between 2008 and 2013. Very few cases of IHD were reported in younger age groups (<50 years). Male
beneficiaries older than 50 years had higher IHD prevalence than female beneficiaries of the
corresponding age group for the period under review (Figure 10). IHD prevalence in male beneficiaries
in the age group 80 to 84 decreased by 5% from 107.7 per 1 000 in 2012 to 102.4 per 1 000 in 2013.

21
Figure 10: Overall prevalence of treated coronary artery disease) IHD by age and gender
DYS is highly prevalent in older age groups (>40 years). The overall prevalence of DYS for beneficiaries
over the age of 40 years increased from 2008 to 2013. The overall prevalence of DYS for beneficiaries
over the age of 40 years however decreased from 2012 to 2013. This resulted in DYS not being part of
the top 10 CDL conditions in 2013. The decrease occurred in all age groups (Figure 11).
Figure 11: Overall prevalence of treated dysrhythmias (DYS) by age and gender
The prevalence of treated HYP has shown a consistent increase across all age groups (Figure 12).
Female beneficiaries had a higher HYP prevalence rate. HYP prevalence was higher for the age groups

22
above 45 years. Beneficiaries above the age of 55 have HYP prevalence rate that was above 200 per 1
000 beneficiaries (for both males and females). Females above 75 years had HYP prevalence above
500 and the trend increased slightly in 2013 when compared to 2012. HYP retained its status as the CDL
with the highest prevalence rate in the medical schemes industry.
Figure 12: Overall prevalence of treated hypertension (HYP) by age and gender
3.3.3 Chronic renal disease
The overall prevalence of treated chronic renal disease (CRF) increased from 0.3 per 1 000 in 2008, to
0.5 per 1 000 in 2013. More male than female beneficiaries were treated for CRF. In 2013, the prevalence
of CRF was 0.6 per 1 000 in males and 0.3 per 1 000 in females.

23
Figure 13: Overall prevalence of chronic renal disease by gender
The prevalence of treated CRF has increased in most age groups in 2013. Very few cases of CRF were
observed in beneficiaries younger than the age of 20 years in the period under review. The prevalence
of treated CRF in the 20 to 39 years age group remained slightly constant for the period. A notable
increase was observed in the 40 years and older age group.
Figure 14: Overall prevalence of treated chronic renal disease (CRF) by age and gender
24
3.3.4 Gastrointestinal disorders
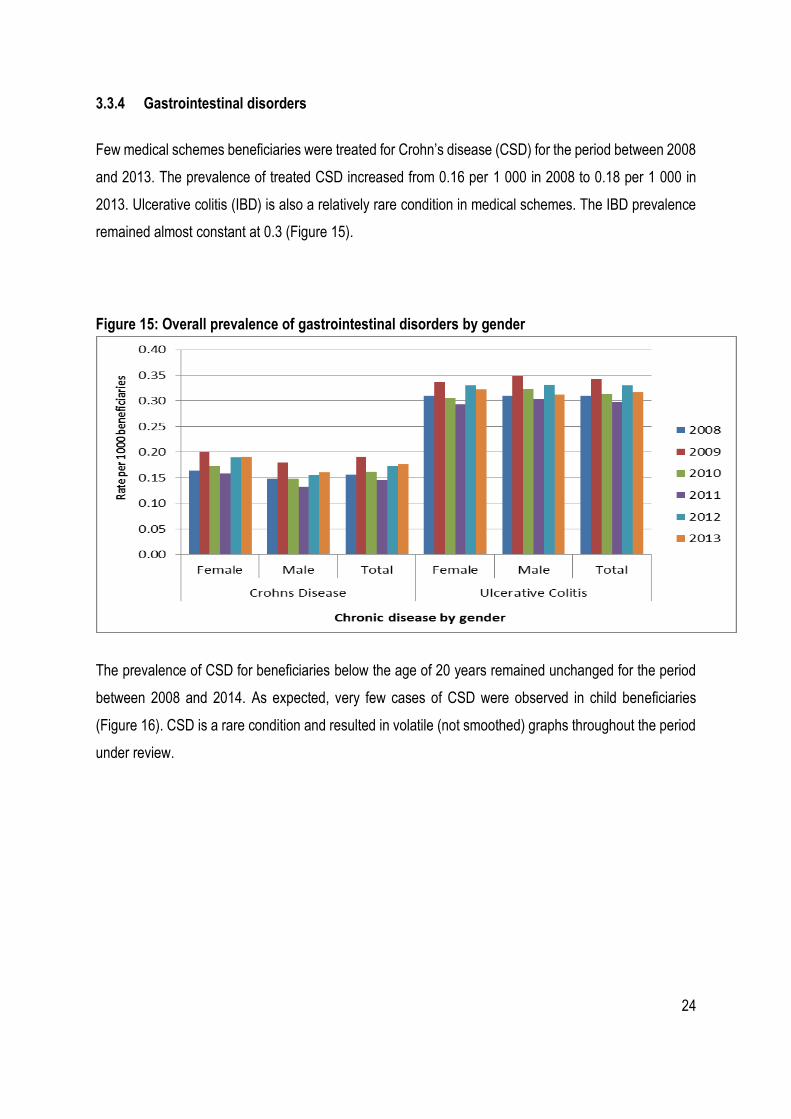
Few medical schemes beneficiaries were treated for Crohn’s disease (CSD) for the period between 2008
and 2013. The prevalence of treated CSD increased from 0.16 per 1 000 in 2008 to 0.18 per 1 000 in
2013. Ulcerative colitis (IBD) is also a relatively rare condition in medical schemes. The IBD prevalence
remained almost constant at 0.3 (Figure 15).
Figure 15: Overall prevalence of gastrointestinal disorders by gender
The prevalence of CSD for beneficiaries below the age of 20 years remained unchanged for the period
between 2008 and 2014. As expected, very few cases of CSD were observed in child beneficiaries
(Figure 16). CSD is a rare condition and resulted in volatile (not smoothed) graphs throughout the period
under review.

25
Figure 16: Overall prevalence of treated Crohn’s disease (CSD) by age and gender
The prevalence of IBD for beneficiaries over the age of 20 years remained slightly unchanged for the
period between 2008 and 2014. Very few cases of IBD were observed in child beneficiaries (Figure 17).
Figure 17: Overall prevalence of treated ulcerative colitis (IBD) by age and gender
26
3.3.5 Diabetes mellitus
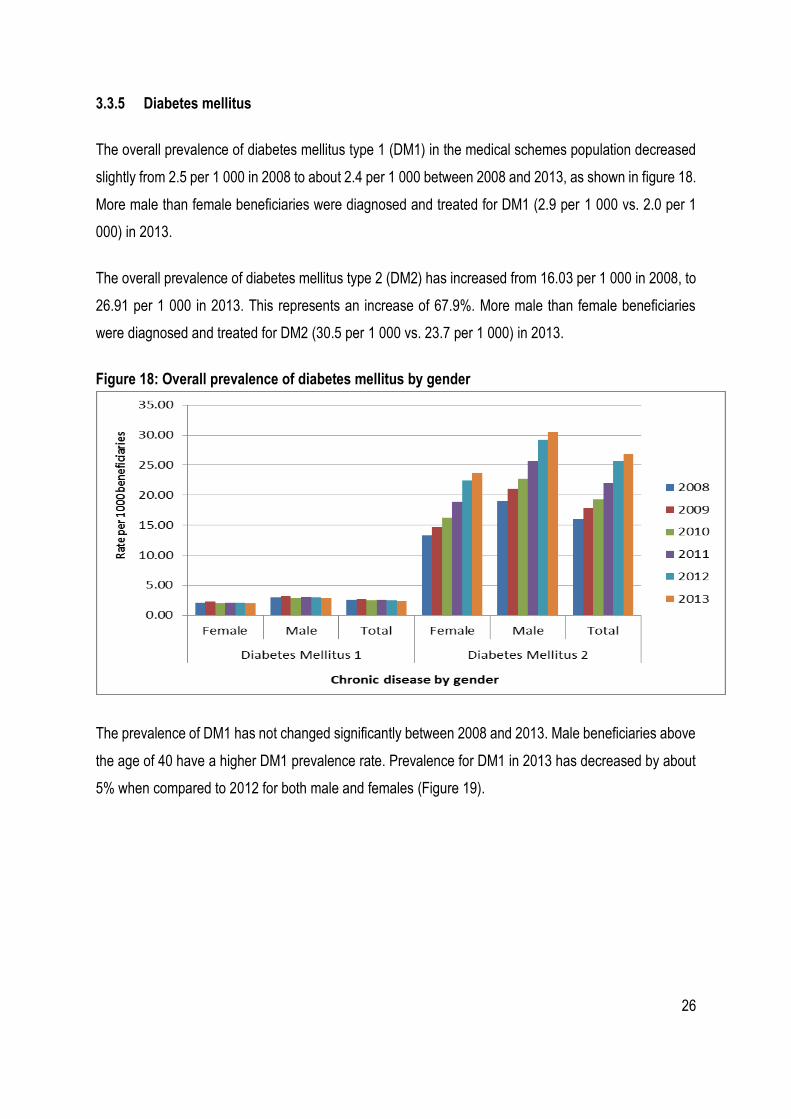
The overall prevalence of diabetes mellitus type 1 (DM1) in the medical schemes population decreased
slightly from 2.5 per 1 000 in 2008 to about 2.4 per 1 000 between 2008 and 2013, as shown in figure 18.
More male than female beneficiaries were diagnosed and treated for DM1 (2.9 per 1 000 vs. 2.0 per 1
000) in 2013.
The overall prevalence of diabetes mellitus type 2 (DM2) has increased from 16.03 per 1 000 in 2008, to
26.91 per 1 000 in 2013. This represents an increase of 67.9%. More male than female beneficiaries
were diagnosed and treated for DM2 (30.5 per 1 000 vs. 23.7 per 1 000) in 2013.
Figure 18: Overall prevalence of diabetes mellitus by gender
The prevalence of DM1 has not changed significantly between 2008 and 2013. Male beneficiaries above
the age of 40 have a higher DM1 prevalence rate. Prevalence for DM1 in 2013 has decreased by about
5% when compared to 2012 for both male and females (Figure 19).

27
Figure 19: Overall prevalence of treated diabetes mellitus type 1 (DM1) by age and gender
As expected, few cases of DM2 were observed in younger beneficiaries (< 30) as shown in figure 20.
DM2 prevalence increased by about 67.9% between 2008 and 2013. DM2 was highly prevalent in male
beneficiaries above 40 years old. The high increases in DM2 in male beneficiaries are mainly at the age
groups above 50 years. DM2 prevalence in female beneficiaries increased by about 78.7%. The high
increases in DM2 in female beneficiaries were mainly in the age groups above 50 years as well (Figure
20).
Figure 20: Overall prevalence of treated diabetes mellitus type 2 (DM2) by age and gender
28
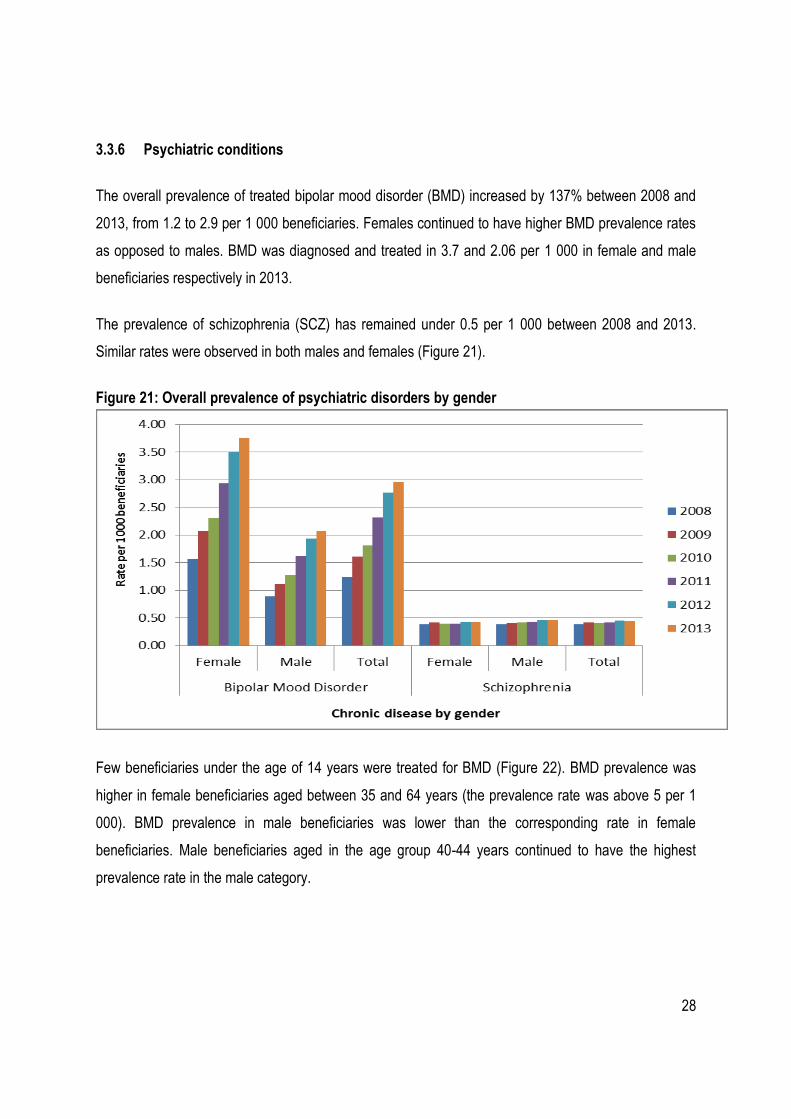
3.3.6 Psychiatric conditions
The overall prevalence of treated bipolar mood disorder (BMD) increased by 137% between 2008 and
2013, from 1.2 to 2.9 per 1 000 beneficiaries. Females continued to have higher BMD prevalence rates
as opposed to males. BMD was diagnosed and treated in 3.7 and 2.06 per 1 000 in female and male
beneficiaries respectively in 2013.
The prevalence of schizophrenia (SCZ) has remained under 0.5 per 1 000 between 2008 and 2013.
Similar rates were observed in both males and females (Figure 21).
Figure 21: Overall prevalence of psychiatric disorders by gender
Few beneficiaries under the age of 14 years were treated for BMD (Figure 22). BMD prevalence was
higher in female beneficiaries aged between 35 and 64 years (the prevalence rate was above 5 per 1
000). BMD prevalence in male beneficiaries was lower than the corresponding rate in female
beneficiaries. Male beneficiaries aged in the age group 40-44 years continued to have the highest
prevalence rate in the male category.

29
Figure 22: Overall prevalence of treated bipolar mood disorder (BMD) by age and gender
Figure 23: Overall prevalence of treated schizophrenia (SCZ) by age and gender
30
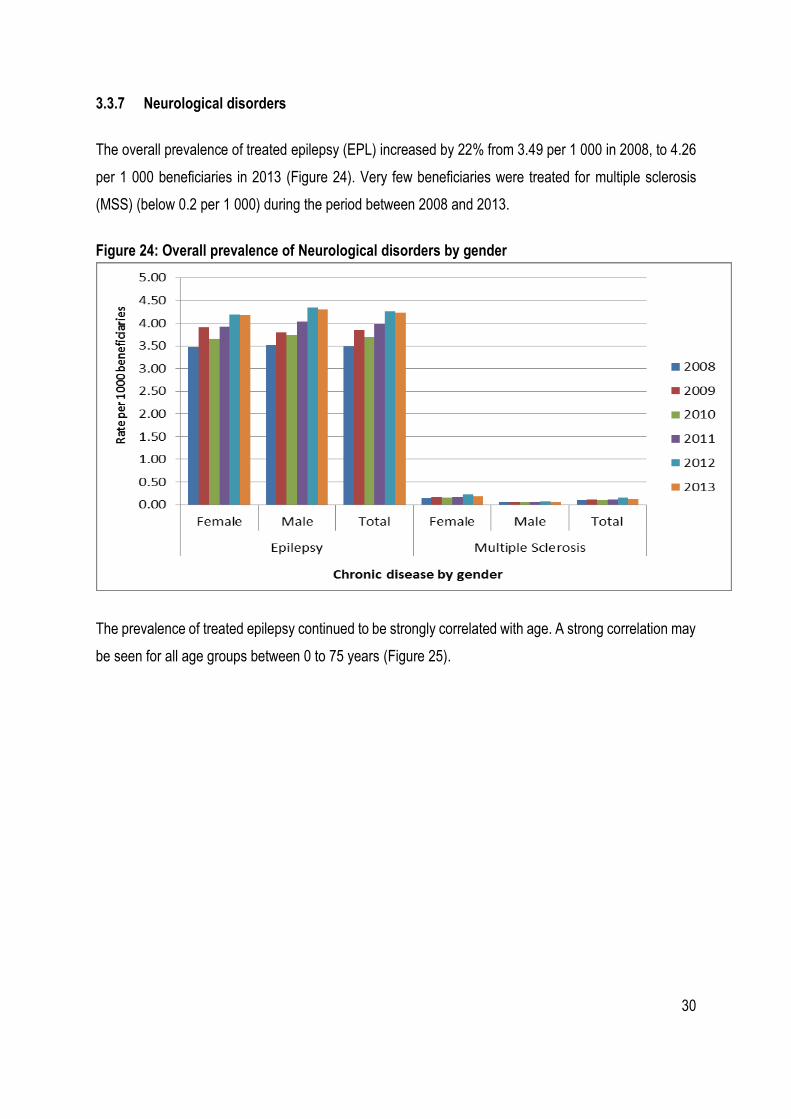
3.3.7 Neurological disorders
The overall prevalence of treated epilepsy (EPL) increased by 22% from 3.49 per 1 000 in 2008, to 4.26
per 1 000 beneficiaries in 2013 (Figure 24). Very few beneficiaries were treated for multiple sclerosis
(MSS) (below 0.2 per 1 000) during the period between 2008 and 2013.
Figure 24: Overall prevalence of Neurological disorders by gender
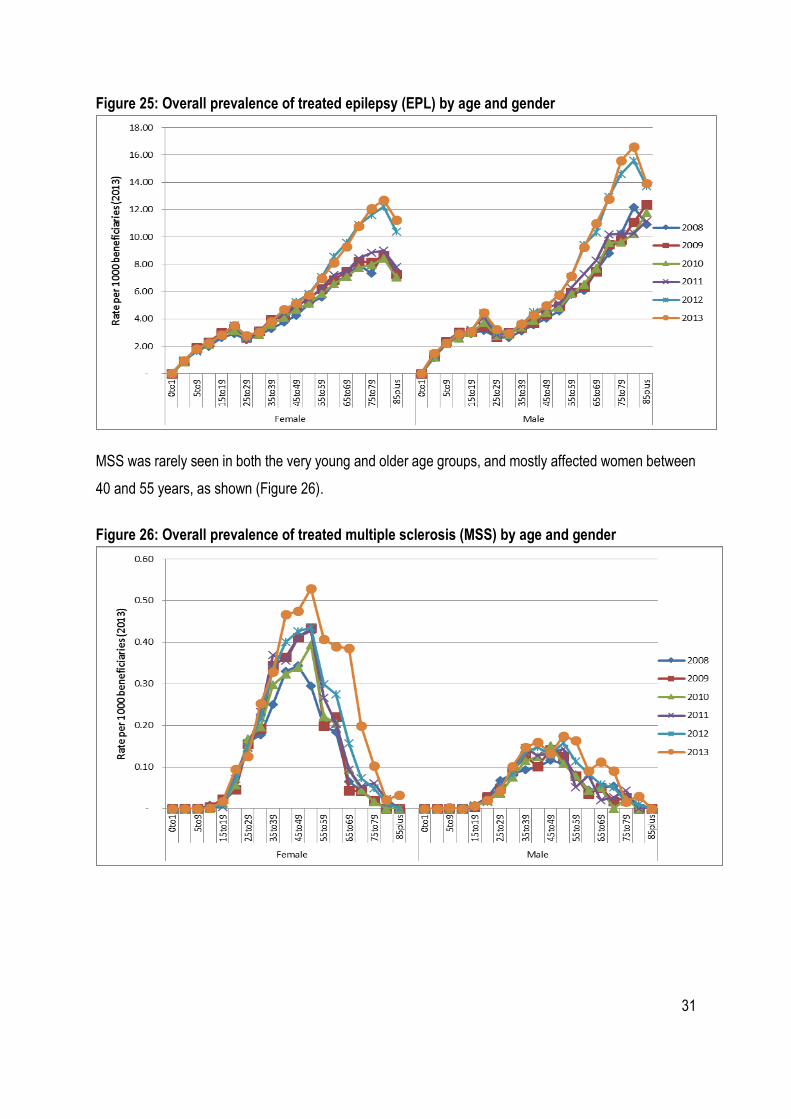
The prevalence of treated epilepsy continued to be strongly correlated with age. A strong correlation may
be seen for all age groups between 0 to 75 years (Figure 25).
31
Figure 25: Overall prevalence of treated epilepsy (EPL) by age and gender
MSS was rarely seen in both the very young and older age groups, and mostly affected women between
40 and 55 years, as shown (Figure 26).
Figure 26: Overall prevalence of treated multiple sclerosis (MSS) by age and gender

32
3.3.8 Auto-immune Conditions
The overall prevalence of treated rheumatoid arthritis (RHA) increased from 2.1 per 1 000 in 2008, to 2.9
per 1 000 in 2013. More female than male beneficiaries were treated for rheumatoid arthritis. RHA
prevalence in females increased from 2.9 to 4.3 per 1 000 compared to a change of 1.1 to 1.4 per 1 000
in males between 2008 and 2013 respectively (Figure 27).
The overall prevalence of treated systemic lupus erythematosus (SLE) increased from 0.18 to 0.27 per 1
000 for all the age groups between 2008 and 2013. In 2013, eight times more women than men were
diagnosed and treated for SLE.
Figure 27: Overall prevalence of Auto-immune conditions by gender
The prevalence of RHA was higher for females older than 40 years. A similar trend was seen in male
beneficiaries whose RHA prevalence was also higher in beneficiaries older than 40 years (Figure 28).

33
Figure 28: Overall prevalence of treated rheumatoid arthritis (RHA) by age and gender
As shown in figure 29, SLE prevalence was higher for females in the age groups between 50 and 74
years.
Figure 29: Overall prevalence of treated systemic lupus erythematosus (SLE) by age and gender
34
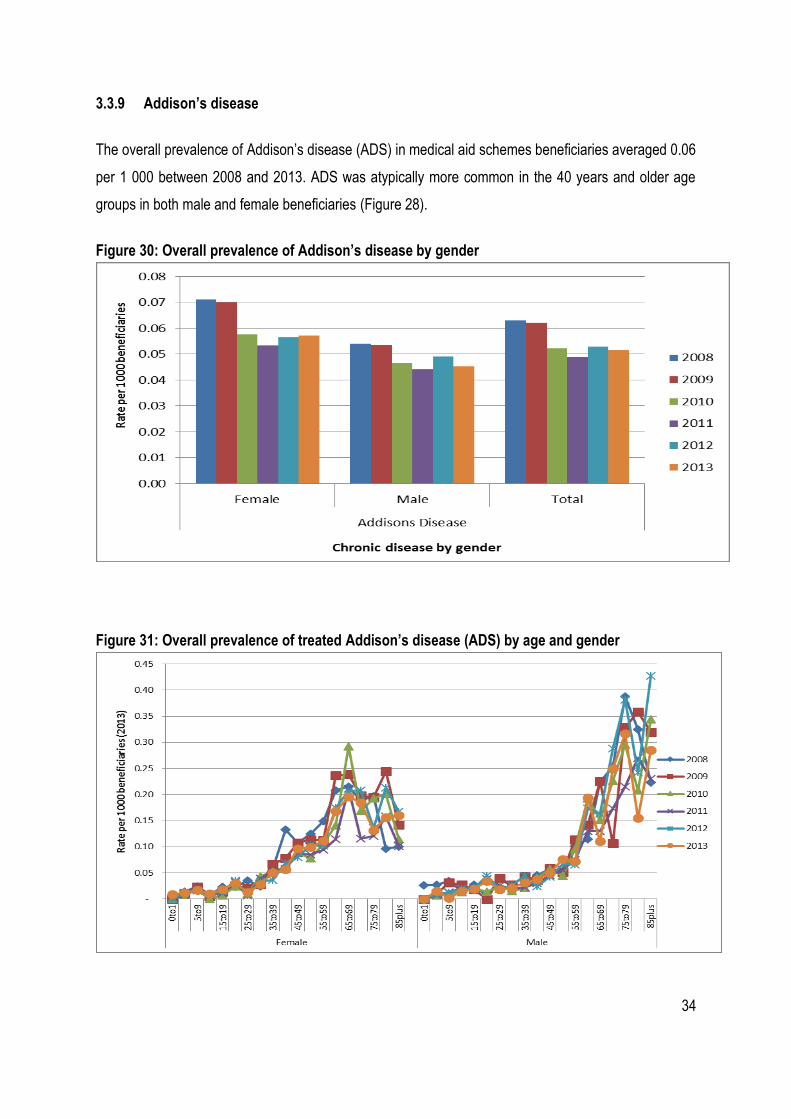
3.3.9 Addison’s disease
The overall prevalence of Addison’s disease (ADS) in medical aid schemes beneficiaries averaged 0.06
per 1 000 between 2008 and 2013. ADS was atypically more common in the 40 years and older age
groups in both male and female beneficiaries (Figure 28).
Figure 30: Overall prevalence of Addison’s disease by gender
Figure 31: Overall prevalence of treated Addison’s disease (ADS) by age and gender

35
3.3.10 Diabetes Insipidus
The overall prevalence of diabetes insipidus (DBI) in the medical aid schemes beneficiaries was 0.02 per
1 000 in 2013 (Figure 32). There was no significant age or gender-related differences (Figure 33) in the
prevalence of DBI. DBI is a rare condition and resulted in volatile (not smoothed) graphs throughout the
period under review.
Figure 32: Overall prevalence of Diabetes Insipidus by gender

36
Figure 33: Overall prevalence of treated diabetes insipidus (DBI) by age and gender
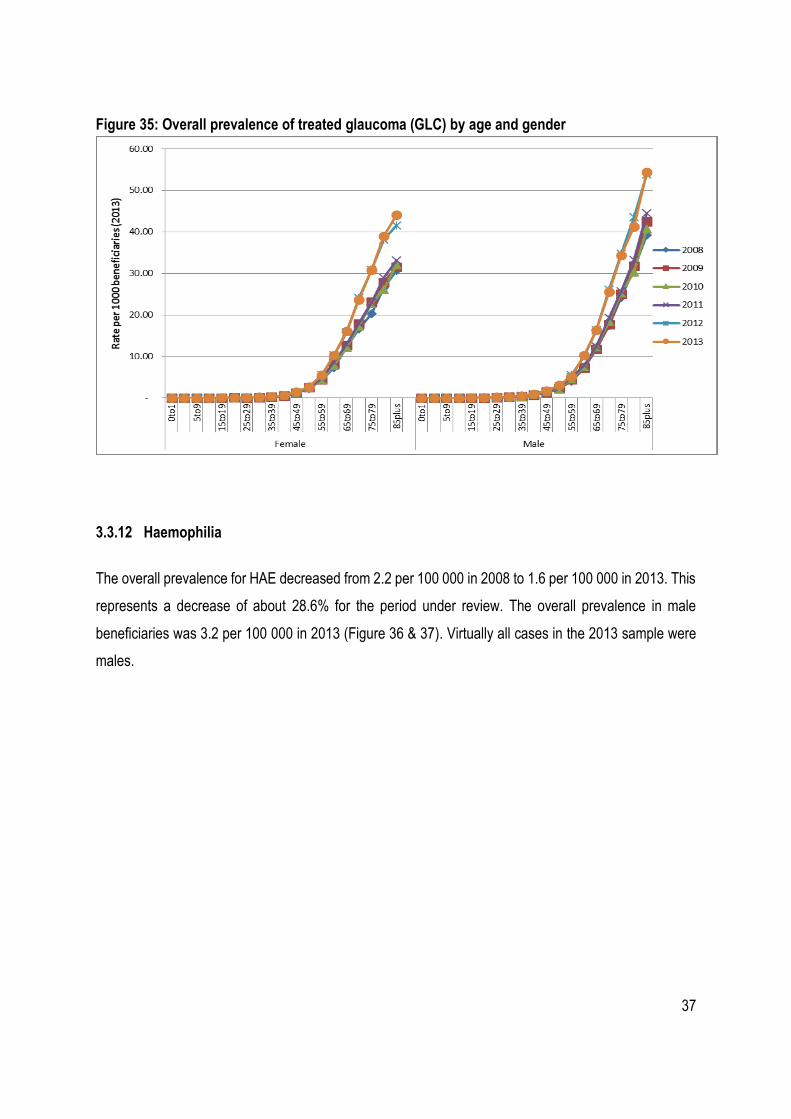
3.3.11 Glaucoma
The overall prevalence of glaucoma (GLC) increased from 2.1 per 1 000 in 2008, to 2.9 per 1 000 in
2013. There was no significant gender related difference (Figure 34). GLC in medical schemes
beneficiaries was more common in the 40 years and older age group.
Figure 34: Overall prevalence of Glaucoma by gender
37
Figure 35: Overall prevalence of treated glaucoma (GLC) by age and gender
3.3.12 Haemophilia
The overall prevalence for HAE decreased from 2.2 per 100 000 in 2008 to 1.6 per 100 000 in 2013. This
represents a decrease of about 28.6% for the period under review. The overall prevalence in male
beneficiaries was 3.2 per 100 000 in 2013 (Figure 36 & 37). Virtually all cases in the 2013 sample were
males.

38
Figure 36: Overall prevalence of Haemophilia by gender
Figure 37: Overall prevalence of treated haemophilia (HAE) by age and gender
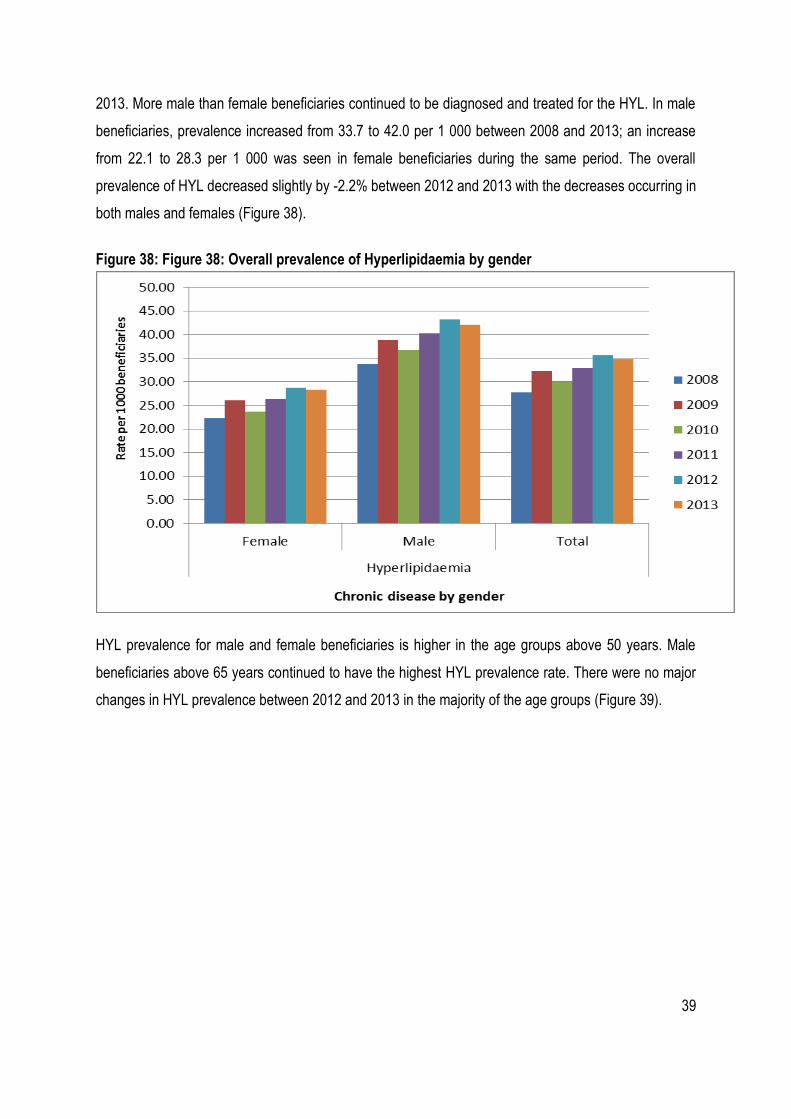
3.3.13 Hyperlipidaemia
A steady increase (about 25%) in the overall prevalence of treated hyperlipidaemia (HYL) was noted
between 2008 and 2013. HYL prevalence increased from 27.7 per 1 000 in 2008 to 34.7 per 1 000 in
39
2013. More male than female beneficiaries continued to be diagnosed and treated for the HYL. In male
beneficiaries, prevalence increased from 33.7 to 42.0 per 1 000 between 2008 and 2013; an increase
from 22.1 to 28.3 per 1 000 was seen in female beneficiaries during the same period. The overall
prevalence of HYL decreased slightly by -2.2% between 2012 and 2013 with the decreases occurring in
both males and females (Figure 38).
Figure 38: Figure 38: Overall prevalence of Hyperlipidaemia by gender
HYL prevalence for male and female beneficiaries is higher in the age groups above 50 years. Male
beneficiaries above 65 years continued to have the highest HYL prevalence rate. There were no major
changes in HYL prevalence between 2012 and 2013 in the majority of the age groups (Figure 39).

40
Figure 39: Overall prevalence of treated hyperlipidaemia (HYL) by age and gender
3.3.14 Parkinson’s disease
The overall prevalence of Parkinson’s disease (PAR) increased from 0.65 to 0.79 per 1 000 between
2008 and 2013 (Figure 40).
Figure 40: Overall prevalence of Parkinson’s disease by gender

41
PAR prevalence was higher among beneficiaries older than 65 years in both males and females. PAR
prevalence for beneficiaries younger than 50 years continued at levels below 5 per 1 000 beneficiaries.
Small changes in PAR prevalence were observed between 2008 and 2013 (Figure 41).
Figure 41: Overall prevalence of treated Parkinson’s disease (PAR) by age and gender
3.3.15 Hypothyroidism
Over five times more female than male beneficiaries were treated and diagnosed for hypothyroidism
(TDH) between 2008 and 2013. The overall TDH prevalence increased from 11.48 to 14.45 per 1 000
beneficiaries between 2008 and 2013. TDH prevalence increased by 23% in female beneficiaries, from
19.2 per 1 000 in 2008, to 23.6 per 1 000 in 2013. TDH prevalence increased by 37.2% in male
beneficiaries, from 3.0 per 1 000 in 2008, to 4.2 per 1 000 in 2013 (Figure 42).

42
Figure 42: Overall prevalence of Hypothyroidism by gender
TDH was mostly prevalent in female beneficiaries older than 40 years. Male TDH prevalence was lower
than that of females. TDH prevalence in males was higher in beneficiaries older than 50 years (Figure
43).
Figure 43: Overall prevalence of treated hypothyroidism (TDH) by age and gender
43
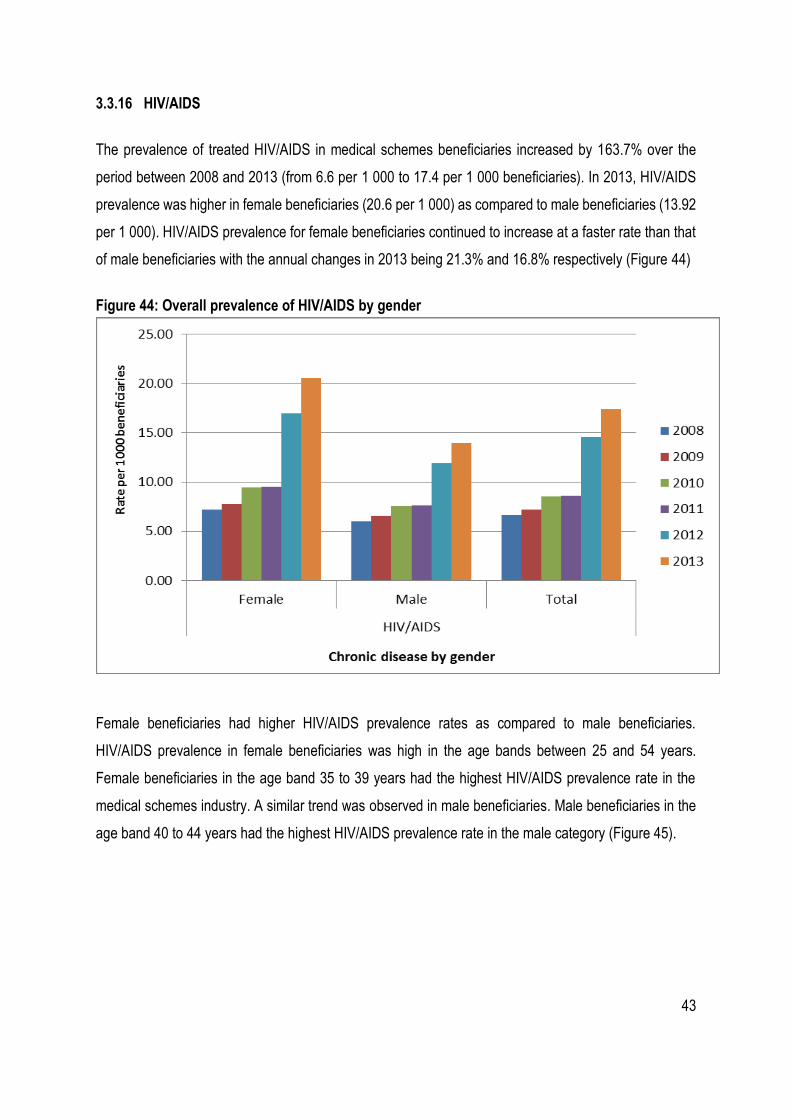
3.3.16 HIV/AIDS
The prevalence of treated HIV/AIDS in medical schemes beneficiaries increased by 163.7% over the
period between 2008 and 2013 (from 6.6 per 1 000 to 17.4 per 1 000 beneficiaries). In 2013, HIV/AIDS
prevalence was higher in female beneficiaries (20.6 per 1 000) as compared to male beneficiaries (13.92
per 1 000). HIV/AIDS prevalence for female beneficiaries continued to increase at a faster rate than that
of male beneficiaries with the annual changes in 2013 being 21.3% and 16.8% respectively (Figure 44)
Figure 44: Overall prevalence of HIV/AIDS by gender
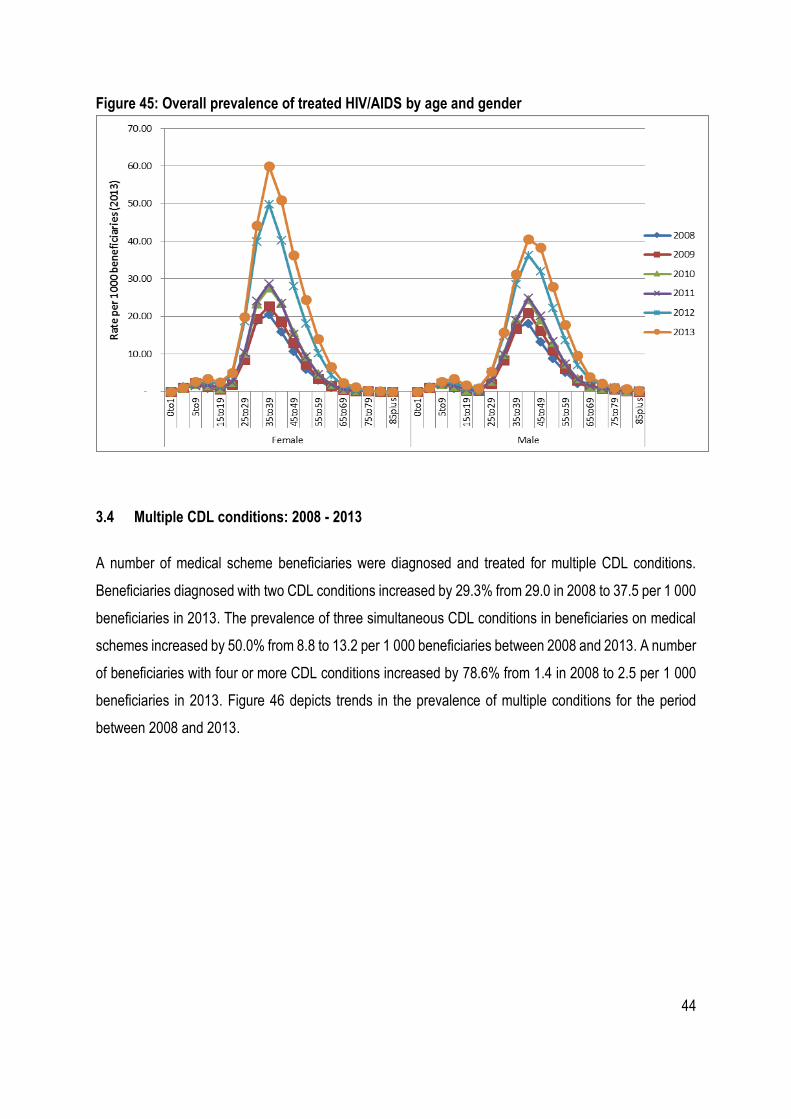
Female beneficiaries had higher HIV/AIDS prevalence rates as compared to male beneficiaries.
HIV/AIDS prevalence in female beneficiaries was high in the age bands between 25 and 54 years.
Female beneficiaries in the age band 35 to 39 years had the highest HIV/AIDS prevalence rate in the
medical schemes industry. A similar trend was observed in male beneficiaries. Male beneficiaries in the
age band 40 to 44 years had the highest HIV/AIDS prevalence rate in the male category (Figure 45).
44
Figure 45: Overall prevalence of treated HIV/AIDS by age and gender
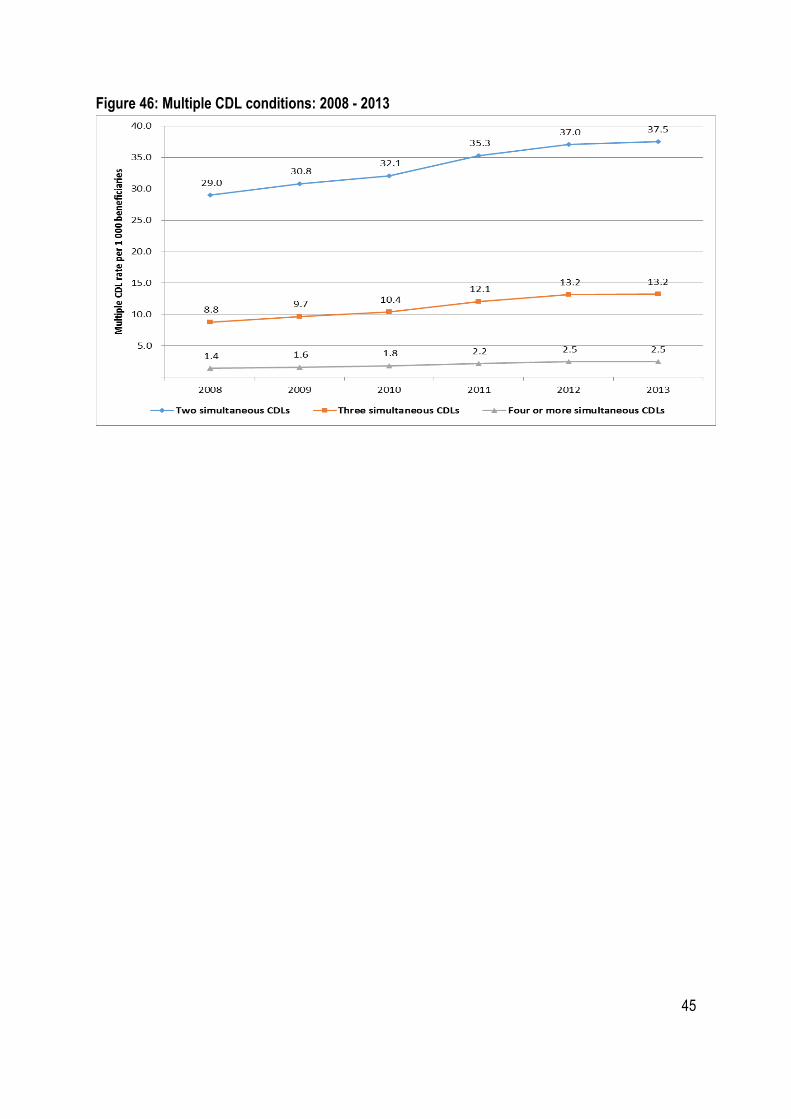
3.4 Multiple CDL conditions: 2008 - 2013
A number of medical scheme beneficiaries were diagnosed and treated for multiple CDL conditions.
Beneficiaries diagnosed with two CDL conditions increased by 29.3% from 29.0 in 2008 to 37.5 per 1 000
beneficiaries in 2013. The prevalence of three simultaneous CDL conditions in beneficiaries on medical
schemes increased by 50.0% from 8.8 to 13.2 per 1 000 beneficiaries between 2008 and 2013. A number
of beneficiaries with four or more CDL conditions increased by 78.6% from 1.4 in 2008 to 2.5 per 1 000
beneficiaries in 2013. Figure 46 depicts trends in the prevalence of multiple conditions for the period
between 2008 and 2013.
45
Figure 46: Multiple CDL conditions: 2008 - 2013

46
4 Discussion
The upward trend in diagnosis and treatment of many conditions on the chronic disease list continued in
2013. The top 10 rankings of prevalence of CDL’s according to prevalence rates did not change
significantly between 2012 and 2013.
The top 10 ranked CDL’s (CDL’s with the highest prevalent rates) are still hypertension, hyperlipidaemia,
diabetes mellitus 2, asthma, hypothyroidism, HIV/AIDS, coronary artery disease, epilepsy,
cardiomyopathy and rheumatoid arthritis. The CDL’s listed as top 10 ranking CDL’s had prevalence rates
of at-least 3 per 1 000 beneficiaries in 2013.
The number of medical scheme beneficiaries who were diagnosed and treated for multiple CDL
conditions increased by more than 25% in 2013 (2012 compared to 2013) with a number of beneficiaries
with four or more CDL conditions increased by about 78%. This will have a negative impact on the risk
profiles of medical schemes and requires schemes to maximise the benefits of using managed care
organisations.
Whilst the upward trend in diagnosis and treatment of many chronic conditions on the CDL continued in
2013, this study is not yet in a position to isolate specific reasons for this increase in chronic diseases,
the trend could still be generally attributed to improved data management systems of medical schemes
and administrators, the deteriorating disease profile, increased beneficiary awareness of entitlements
and changes in care-seeking behaviour. The deterioration in risk profiles should be a concern for medical
schemes and schemes should ensure that value for money is attained from the managed care programs.

47
5 References
Council for Medical Schemes (2014). Guidelines for the Identification of Beneficiaries with Risk Factors in Accordance with the Entry and Verification Criteria: Version 8.0. 2014 [cited 2014 25 November]; [Available from: www.medicalschemes.com/Publications.aspx.
Council for Medical Schemes (2013). Research Brief 3 of 2013: Trends in chronic disease prevalence in the S.A. medical aid schemes: 2006 – 2011 [cited 2014 25 November]; [Available from: www.medicalschemes.com/Publications.aspx.
Council for Medical Schemes (2014). Research Brief: Prevalence of chronic diseases in the population covered by medical aid schemes in South Africa: June 2014 [cited 2014 01 December]; [Available from: www.medicalschemes.com/Publications.aspx.
Council for Medical Schemes (2014). CMS Annual Report 2013-2014: [cited 2014 25 November]; [Available from: www.medicalschemes.com/Publications.aspx.