Embed Size (px)
Citation preview
HAL Id: hal-00733553https://hal.archives-ouvertes.fr/hal-00733553
Submitted on 1 Oct 2012
HAL is a multi-disciplinary open accessarchive for the deposit and dissemination of sci-entific research documents, whether they are pub-lished or not. The documents may come fromteaching and research institutions in France orabroad, or from public or private research centers.
L’archive ouverte pluridisciplinaire HAL, estdestinée au dépôt et à la diffusion de documentsscientifiques de niveau recherche, publiés ou non,émanant des établissements d’enseignement et derecherche français ou étrangers, des laboratoirespublics ou privés.
Prevalence and reliability of phonological, surface, andmixed profiles in dyslexia: A review of studies
conducted in languages varying in orthographic depthLiliane Sprenger-Charolles, Linda S Siegel, Juan E. Jimenez, Johannes Ziegler
To cite this version:Liliane Sprenger-Charolles, Linda S Siegel, Juan E. Jimenez, Johannes Ziegler. Prevalence and reliabil-ity of phonological, surface, and mixed profiles in dyslexia: A review of studies conducted in languagesvarying in orthographic depth. Scientific Study of Reading, 2011, 15 (6), pp.498-521. �hal-00733553�

1
Liliane Sprenger-Charolles*, Linda S. Siegel**, Juan E. Jiménez *** and Johannes C.
Ziegler****
Prevalence and Reliability of Phonological, Surface, and Mixed Profiles in Dyslexia: A
Review of Studies Conducted in Languages Varying in Orthographic Depth
Scientific Studies of Reading (SSSR)
2011, 6, 498-521
Accepted for publication (05-Sep-2010)
Liliane Sprenger-Charolles*, CNRS (LPP-UMR-8158) and Paris Descartes, France
Linda S. Siegel**, University of British Columbia, Vancouver, Canada
Juan E. Jiménez *** University of La Laguna, Spain
Johannes Ziegler**** CNRS (LPC-UMR-6146) and Aix-Marseille University, France
Address for correspondence: Liliane Sprenger-Charolles
Laboratoire de Psychologie de la Perception, CNRS et Université Paris Descartes.
UFR Biomédicale des Saints Pères, 45, rue des Sts Pères, 75270 Paris cedex 06
Tel: 331 42 86 43 25, e.mail: [email protected]

2
ABSTRACT
The influence of orthographic transparency on the prevalence of dyslexia subtypes was
examined in a review of multiple-case studies conducted in languages differing in
orthographic depth (English, French and Spanish). Cross-language differences are found in the
proportion of dissociated profiles as a function of the dependent variables (speed or accuracy),
the classification method (classical versus regression-based methods), and the control sample
(chronological age versus reading level controls). The classical method results in a majority of
mixed profiles, whereas the regression-based method results in a majority of dissociated
profiles. However, the regression-based method appears to result in less reliable subtypes
within and between languages. Finally, reading-level comparisons revealed that the
phonological subtype reflects a deviant developmental trajectory across all languages, whereas
the surface subtype corresponds to a delayed developmental trajectory. The results also
indicate that reading speed should be considered to correctly classify dyslexics into subtypes,
at least in transparent orthographies.
Key words: Developmental Dyslexia; Subtypes; Orthographic Depth; Phonological
Dyslexia; Surface Dyslexia; Mixed Profile; Vocal response latency;

3
One of the most influential models of reading is the dual-route model (Coltheart, Curtis,
Atkins, & Haller, 1993; Coltheart, Rastle, Perry, Langdon, & Ziegler, 2001). Although the
model was proposed to explain skilled reading and acquired dyslexia, it has had a significant
impact on the field of developmental dyslexia (e.g., Bergmann & Wimmer, 2008; Ziegler,
Castel, Pech-Georgel, George, Alario, & Perry, 2008), especially with regard to the question
of whether there are subtypes of dyslexia (e.g. Castles & Coltheart, 1993; Manis, Seidenberg,
Doi, McBride-Chang & Peterson; Sprenger-Charolles, Colé, Lacert, & Serniclaes, 2000;
Stanovich, Siegel & Gottardo,1997).
According to the dual-route model, written words can be processed either by a lexical
reading route (also called orthographic procedure) or a sublexical reading route (also called
phonological procedure). The lexical route is typically assessed with the reading of high-
frequency irregular word, whereas the sublexical route is typically assessed with the reading
of pseudowords. Dyslexics are assumed to be phonological dyslexics when pseudoword
reading is impaired but irregular word reading is spared; they are assumed to be surface
dyslexics when irregular word reading is impaired but pseudoword reading is spared. A mixed
profile is found when both pseudoword and irregular word reading are impaired.
The dual-route model has been developed in the context of the English language1. English
has one of the most inconsistent alphabetic writing systems, in which the same spelling can be
pronounced in many different ways, as in though, through, bough, tough and dough (e.g.,
Ziegler, Stone & Jacobs, 1997). In orthographies with a high number of inconsistencies, it
could be useful for a reading system to develop two independent routes, a lexical route for
dealing with the inconsistencies (i.e., irregular words) and a sublexical route for reading novel
and low-frequency words. Some researchers have questioned the extent to which these two
routes develop in more transparent orthographies. For example, Ziegler and Goswami (2005)
state: “Given that English seems to lie at the extreme end of the consistency continuum with
regard to orthography-phonology relationships, it might even be the case that some of the
most sophisticated processing architecture (e.g., two separate routes to pronunciation in the
skilled reading system) may in fact only develop for English” (p. 19). Similarly, Share (2008)
claimed that “the Coltheart/Baron dual-route model…arose largely in response to English
spelling-sound obtuseness. The model accounts for a range of English-language findings, but
is ill-equipped to serve the interests of a universal science of reading” (p. 584).
In addition, it is quite clear that these two routes do not develop independently. Indeed,
according to longitudinal data, the sublexical reading route provides a bootstrapping
mechanism for reading acquisition in all alphabetic writing systems (e.g. for reviews, Share,
1995; Sprenger-Charolles, Colé, & Serniclaes, 2006; Ziegler & Goswami, 2005). As a
consequence, and given that the dyslexics’ sublexical reading skills are generally impaired
(Rack, Snowling, & Olson, 1992; Siegel, 1993; Siegel, 1998; Siegel, 1999; Sprenger-
Charolles et al., 2006; Stanovich & Siegel, 1994; Ziegler, Perry, Ma-Wyatt, Ladner &
Schulte-Korne, 2003a), their lexical reading skills should be impaired as well. Therefore, the
percentage of mixed profiles (with impaired lexical and sublexical reading skills) is assumed
to be very high, and we should find only very little evidence for dissociated profiles (such as
surface or phonological profiles) in developmental dyslexia in any alphabetic writing system,
at least in the comparison with average readers of the same chronological age. This idea is
also at the core of the connectionist models of reading, in which very severe phonological
impairments should lead to a mixed profile (e.g., Harm & Seidenberg, 1999; see also: Plaut,
McClelland, Seidenberg, & Patterson, 1996; Seidenberg & McClelland, 1989). However, if
there are dissociated profiles, one might predict that they differ across languages, especially
phonological profiles because phonological decoding is easier to acquire in transparent than in
opaque writing systems (Ziegler et al., 2010).

4
Given the concerns about the universality of the dual-route architecture and its
developmental plausibility, this review was designed to assess the prevalence of phonological,
surface and mixed profiles in developmental dyslexia across three languages that lie on a
transparency continuum from English (very opaque) to French (intermediate) to Spanish
(transparent). Indeed, grapheme-phoneme mappings are less consistent in English than in
French and less consistent in French than in Spanish (for descriptive and/or quantitative
indicators of the consistency of these orthographies, see: Borgwaldt, Hellwig, & de Groot,
2005; Peereman & Content, 1998; Peereman, Lété, & Sprenger-Charolles, 2007; Sprenger-
Charolles, 2003; Ziegler, Jacobs, & Stone, 2006; Ziegler et al., 1997). Interestingly, the rate of
reading acquisition mirrors the transparency of the writing system with near-to-ceiling
performance of Spanish-speaking children after only one year of schooling, intermediate
performance for French-speaking children, and relatively poor performance for English-
speaking children (Goswami, Gombert, & Barrera, 1998; Seymour, Aro, & Erskine, 2003).
Similar results have been observed with adults for reading speed in a comparison among
English-, French- and Italian-speaking normal readers and dyslexics (Paulesu, Démonet,
Fazio, McCrory, Chanoine, Brunswick, Cappa, Cossu, Habib, Frith, & Frith, 2001). Thus, the
central question of the present review is to what extent the prevalence and nature of dyslexia
subtypes vary across these three languages varying in the consistency of grapheme-phoneme
correspondences.
Another issue in the subtyping literature concerns the nature of the control group. Dyslexic
performance is usually compared to that of chronological age (CA) controls. In that
comparison, the percentage of mixed profiles is expected to be very high, and we should find
only very little evidence for dissociated profiles (such as surface or phonological profiles).
However, the CA comparison should be supplemented by a comparison with average readers
of the same reading level (RL). This is necessary for three reasons. First, reading level has
been shown to have an impact on vocabulary size and phonemic awareness (Bryant & Impey,
1986). Therefore, differences in these skills between dyslexics and CA controls may be
merely a consequence of the lower reading level of the dyslexics. Second, there are processing
trade-offs in the use of the sublexical and the lexical procedures that depend on the overall
level of word recognition attained (e.g., for English-speaking children: Backman, Bruck,
Hebert, & Seidenberg, 1984; Manis, Custodio, & Szeszulski, 1993; Waters, Seidenberg, &
Bruck, 1984; for French-speaking children: Sprenger-Charolles et al., 2000; Sprenger-
Charolles, Siegel, Béchennec, & Serniclaes, 2003; Sprenger-Charolles, Siegel, & Bonnet,
1998). For instance, in two longitudinal studies (Sprenger-Charolles et al., 2000; 2003),
children read pseudowords more accurately than high-frequency irregular words when they
were 8 years old, whereas the reverse trend was observed two years later. Therefore, the
comparisons of dyslexics with either CA or RL controls are based on skills that differ not only
quantitatively but also qualitatively. Finally, dyslexics should be compared to RL controls to
investigate whether their developmental trajectory is deviant or delayed. The developmental
trajectory of the dyslexics is assumed to be delayed rather than deviant when their
phonological and orthographic reading skills are at the same level as those of RL controls. It is
assumed to be deviant when their phonological or orthographic reading skills are below the
level of RL controls. For these three reasons, the present review includes studies with RL
controls.
An additional issue concerns the nature of the reading outcome measure. As Share (2008)
has noted “it remains to be seen to what extent the classic dual-route distinction between
phonological and surface dyslexia… relates to accuracy/speed differences, particularly in the
case of more conventional (i.e. consistent) orthographies” (p.592). Some dyslexics may
perform like average readers on non-timed measures of pseudoword reading but might show

5
robust speed deficits in reading pseudowords. When only accuracy scores are considered,
these dyslexics are incorrectly considered as having unimpaired sublexical reading skills.
Thus, we have reviewed studies that focused on both latency and accuracy measures.
It should be noted that the present review covers only multiple-case studies, not single-case
studies. Multiple-case studies, unlike single-case studies, examine individual cases drawn
from a broad population assumed to be representative of the larger population of individuals
with dyslexia. Therefore, multiple-case studies are more relevant than single-case studies in
assessing the prevalence and the reliability of the different profiles.
Finally, we have only considered studies in which the efficiency of the lexical and the
sublexical reading routes have been assessed using the standard way of doing this, that is, with
the reading of irregular words versus pseudowords. Studies in which the classification has not
been based on pseudoword reading were excluded (e.g. McDougall, Borowsky, MacKinnon,
& Hymel, 2004). However, because in languages with a very transparent orthography it is not
possible to find a sufficiently large number of irregular words, we have included in our review
a Spanish study in which the efficiency of the lexical reading route has been assessed by high-
frequency regular word reading (the prefixe ‘ir’ in ‘irregular’ is thus put between ‘[]’ when the
Spanish results are presented with the English and French results).
In sum, the reviewed studies are multiple-case studies conducted in languages that vary in
orthographic depth. In all but one of the selected studies subtype classifications were based on
both CA and RL controls and in the French and Spanish studies both latency and accuracy
measures were used as outcome variables.
SYNTHESIS OF THE RESULTS OF THE REVIEWED STUDIES
The first multiple-case studies were conducted by Seymour (1986, 21 cases of 11- to 25-
year-old dyslexics) and Snowling, Stackhouse, and Rack (1986b: 7 cases of 8.5- to 40-year-
old dyslexics). More recently, there have been seven studies conducted with children that used
the same methods (classical and regression-based method: a description of these methods is
provided below) to assess the prevalence of the different subtypes in developmental dyslexia
(Castles & Coltheart, 1993; Génard, Mousty, Content, Alegria, Leybaert, & Morais, 1998;
Jiménez, Rodríguez, & Ramírez, 2009; Manis et al., 1996; Sprenger-Charolles et al., 2000;
Stanovich et al., 1997; Ziegler et al., 2008). For the sake of comparability, we have only
reviewed these studies. Studies that did not use both the classical and the regression methods
(e.g. Bowey & Rutherford, 2007; Castles, Datta, Gayan, & Olson, 1999; Sprenger-Charolles,
Colé, Kipffer-Piquard, Pinton, & Billard, 2009), as studies with adult participants (e.g. Milne,
Nicholson, & Corballis, 2003; Zabell & Everatt, 2002) were not taken into account in the core
of our review.
Six of the reviewed studies used irregular word and pseudoword reading skills as indicators
of the reliance on each of the two reading routes. Among these studies, five include a CA and
RL comparison and four used accuracy only: three with English-speaking children (Castles &
Coltheart, 1993; Manis et al., 1996; Stanovich et al., 1997)2; one with French-speaking
children (Génard et al., 1998). Another French study used both accuracy and latency
(Sprenger-Charolles et al., 2000). In the sixth study, which also involved French-speaking
children, there was no RL control group, but both accuracy and speed were examined (Ziegler
et al., 2008). We also included the results of a study with Spanish children in which the
subtypes have been defined with accuracy scores and processing times for pseudowords
versus high frequency regular words, instead of high frequency irregular words (Jiménez et
al., 2009). In the Spanish and the two French studies (Sprenger-Charolles et al., 2000; Ziegler
et al., 2008), the speed of each correct response was calculated using vocal response latency,
that is the delay between the appearance of the word on the screen of the computer and the

6
onset of the vocal response3.
In the reviewed studies, 337 dyslexics (172 Anglophones, 130 Francophones, and 35
Hispanophones) were compared to 472 CA controls (151 Anglophones, 274 Francophones,
and 47 Hispanophones) and 382 RL controls (67 Anglophones and 275 Francophones, and 40
Hispanophones). The large number of children involved in those studies should allow us to
reliably estimate the prevalence of the various dyslexic profiles in each of these languages.
The seven studies within the scope of the present review have used two methods to analyze
the results, the classical method and the regression method. In the classical method (according
to the authors of the studies that were reviewed, children were labeled as phonological
dyslexics when only their sublexical reading route (assessed with pseudoword reading) was
impaired, and surface dyslexics when only their lexical reading route (assessed with high-
frequency irregular-word reading) was impaired; when both routes were deficient, they were
said to have a mixed profile. In all the reviewed studies, the cut-off for defining a reading skill
as impaired was one standard deviation below the mean of the controls.
In contrast to the classical method, the regression method assesses a relative deficit, either
in orthographic skills relative to phonological reading skills, or in phonological reading skills
relative to orthographic skills. Stanovich et al. (1997) characterized the subtypes defined in
this manner as “soft”, as opposed to the “hard” subtypes defined using the classical method.
More precisely, soft subtypes are defined by plotting pseudoword performance against
irregular-word performance (and vice versa) and then examining the 90% (or 95%)
confidence intervals around the regression lines determined from the control group. A
phonological dyslexic is a child who is an outlier when pseudowords are plotted against
irregular words but who is in the normal range when irregular words are plotted against
pseudowords. Surface dyslexics are defined in the opposite way. Dyslexics whose scores are
outside the confidence intervals in both cases have a mixed profile.
PREVALENCE OF PHONOLOGICAL, SURFACE, AND MIXED PROFILES
Chronological Age Comparison
Hard subtypes (Classical method)
Table 1 (see also Appendix 2, part 2a) gives the number and the proportion of English-,
French-, and Spanish-speaking dyslexics whose reading scores were one standard deviation
below (for accuracy, that is less accurate) or above (for speed, that is less rapid) the mean of
the CA controls on pseudowords only (hard phonological profile), high-frequency [ir]regular
words only (hard surface profile), pseudowords and [ir]regular words (mixed profile), as well
as those with no deficit on either assessment.
In terms of accuracy, both pseudoword and [ir]regular-word reading skills were deficient in
most English, French, and Spanish dyslexics. Thus, as expected, mixed profiles were the most
common across all studies (on average, 65%: 71% in English, 63% in French, 43% in
Spanish) and the overall number of hard dissociated profiles (with either a phonological or a
surface profile) was rather small (on average, 26%: 24% in English, 28% in French and 31%
in Spanish). In terms of speed, the results of the French and Spanish samples were very
similar, with again more hard mixed profiles (48% and 54%, respectively) than hard
dissociated profiles (36% and 25%, respectively).
With regard to the issue of the prevalence of each dissociated profiles, the percentage of
hard phonological dyslexics was lower than the percentage of hard surface dyslexics in the
accuracy-based French and Spanish studies (6% versus 22% in French, 8% versus 23% in
Spanish), but not in the latency-based French and Spanish studies, in which similar
proportions were obtained for phonological and surface dyslexics (16% versus 20% in French;
7
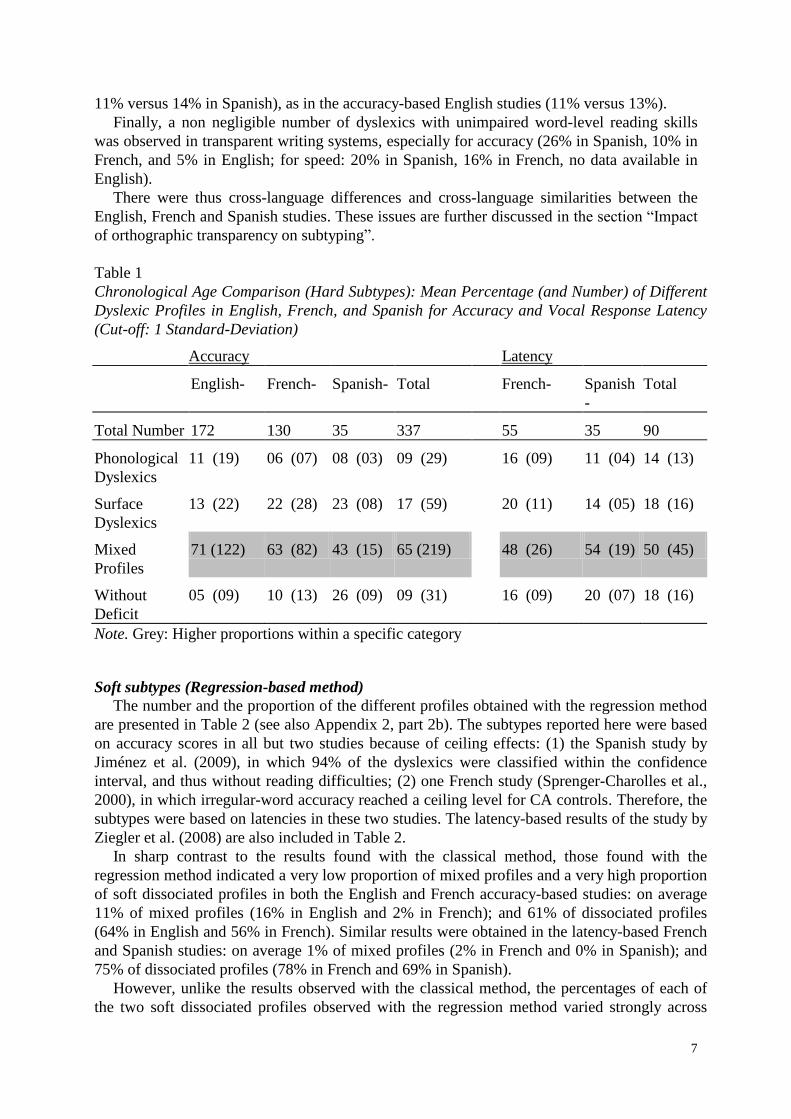
11% versus 14% in Spanish), as in the accuracy-based English studies (11% versus 13%).
Finally, a non negligible number of dyslexics with unimpaired word-level reading skills
was observed in transparent writing systems, especially for accuracy (26% in Spanish, 10% in
French, and 5% in English; for speed: 20% in Spanish, 16% in French, no data available in
English).
There were thus cross-language differences and cross-language similarities between the
English, French and Spanish studies. These issues are further discussed in the section “Impact
of orthographic transparency on subtyping”.
Table 1
Chronological Age Comparison (Hard Subtypes): Mean Percentage (and Number) of Different
Dyslexic Profiles in English, French, and Spanish for Accuracy and Vocal Response Latency
(Cut-off: 1 Standard-Deviation)
Accuracy Latency
English- French- Spanish- Total French- Spanish
-
Total
Total Number 172 130 35 337 55 35 90
Phonological
Dyslexics
11 (19) 06 (07) 08 (03) 09 (29) 16 (09) 11 (04) 14 (13)
Surface
Dyslexics
13 (22) 22 (28) 23 (08) 17 (59) 20 (11) 14 (05) 18 (16)
Mixed
Profiles
71 (122) 63 (82) 43 (15) 65 (219) 48 (26) 54 (19) 50 (45)
Without
Deficit
05 (09) 10 (13) 26 (09) 09 (31) 16 (09) 20 (07) 18 (16)
Note. Grey: Higher proportions within a specific category
Soft subtypes (Regression-based method)
The number and the proportion of the different profiles obtained with the regression method
are presented in Table 2 (see also Appendix 2, part 2b). The subtypes reported here were based
on accuracy scores in all but two studies because of ceiling effects: (1) the Spanish study by
Jiménez et al. (2009), in which 94% of the dyslexics were classified within the confidence
interval, and thus without reading difficulties; (2) one French study (Sprenger-Charolles et al.,
2000), in which irregular-word accuracy reached a ceiling level for CA controls. Therefore, the
subtypes were based on latencies in these two studies. The latency-based results of the study by
Ziegler et al. (2008) are also included in Table 2.
In sharp contrast to the results found with the classical method, those found with the
regression method indicated a very low proportion of mixed profiles and a very high proportion
of soft dissociated profiles in both the English and French accuracy-based studies: on average
11% of mixed profiles (16% in English and 2% in French); and 61% of dissociated profiles
(64% in English and 56% in French). Similar results were obtained in the latency-based French
and Spanish studies: on average 1% of mixed profiles (2% in French and 0% in Spanish); and
75% of dissociated profiles (78% in French and 69% in Spanish).
However, unlike the results observed with the classical method, the percentages of each of
the two soft dissociated profiles observed with the regression method varied strongly across
8
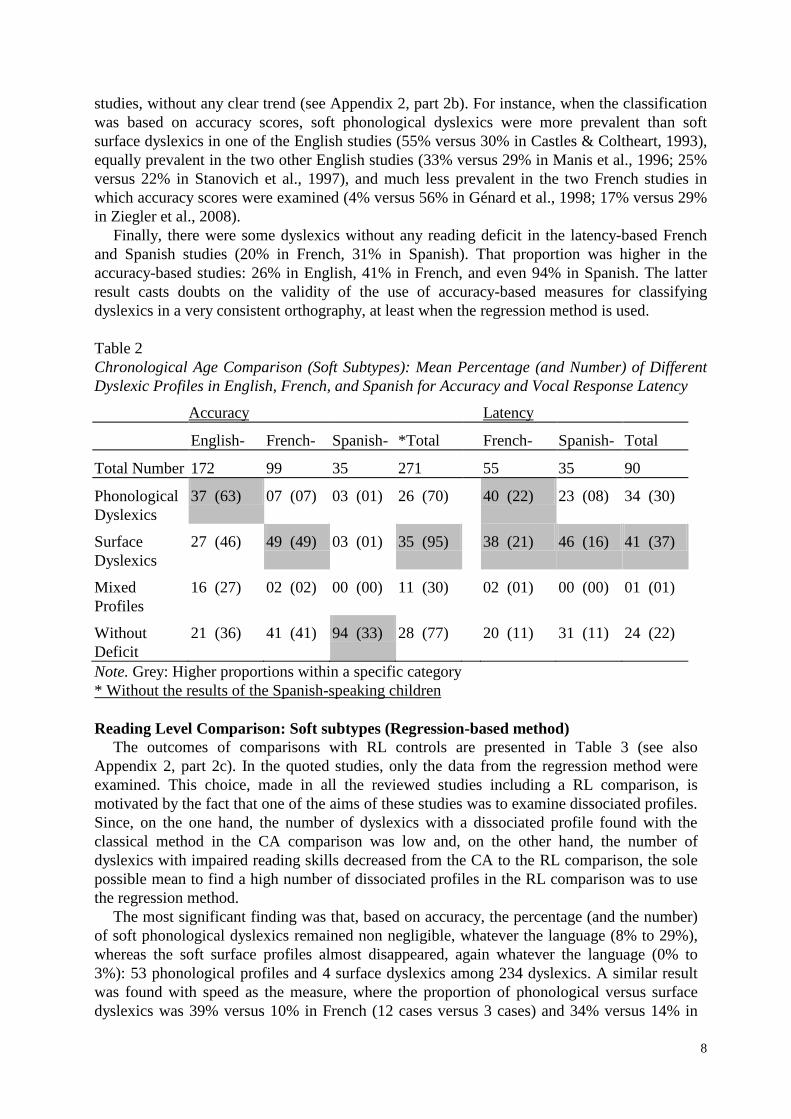
studies, without any clear trend (see Appendix 2, part 2b). For instance, when the classification
was based on accuracy scores, soft phonological dyslexics were more prevalent than soft
surface dyslexics in one of the English studies (55% versus 30% in Castles & Coltheart, 1993),
equally prevalent in the two other English studies (33% versus 29% in Manis et al., 1996; 25%
versus 22% in Stanovich et al., 1997), and much less prevalent in the two French studies in
which accuracy scores were examined (4% versus 56% in Génard et al., 1998; 17% versus 29%
in Ziegler et al., 2008).
Finally, there were some dyslexics without any reading deficit in the latency-based French
and Spanish studies (20% in French, 31% in Spanish). That proportion was higher in the
accuracy-based studies: 26% in English, 41% in French, and even 94% in Spanish. The latter
result casts doubts on the validity of the use of accuracy-based measures for classifying
dyslexics in a very consistent orthography, at least when the regression method is used.
Table 2
Chronological Age Comparison (Soft Subtypes): Mean Percentage (and Number) of Different
Dyslexic Profiles in English, French, and Spanish for Accuracy and Vocal Response Latency
Accuracy Latency
English- French- Spanish- *Total French- Spanish- Total
Total Number 172 99 35 271 55 35 90
Phonological
Dyslexics
37 (63) 07 (07) 03 (01) 26 (70) 40 (22) 23 (08) 34 (30)
Surface
Dyslexics
27 (46) 49 (49) 03 (01) 35 (95) 38 (21) 46 (16) 41 (37)
Mixed
Profiles
16 (27) 02 (02) 00 (00) 11 (30) 02 (01) 00 (00) 01 (01)
Without
Deficit
21 (36) 41 (41) 94 (33) 28 (77) 20 (11) 31 (11) 24 (22)
Note. Grey: Higher proportions within a specific category
* Without the results of the Spanish-speaking children
Reading Level Comparison: Soft subtypes (Regression-based method)
The outcomes of comparisons with RL controls are presented in Table 3 (see also
Appendix 2, part 2c). In the quoted studies, only the data from the regression method were
examined. This choice, made in all the reviewed studies including a RL comparison, is
motivated by the fact that one of the aims of these studies was to examine dissociated profiles.
Since, on the one hand, the number of dyslexics with a dissociated profile found with the
classical method in the CA comparison was low and, on the other hand, the number of
dyslexics with impaired reading skills decreased from the CA to the RL comparison, the sole
possible mean to find a high number of dissociated profiles in the RL comparison was to use
the regression method.
The most significant finding was that, based on accuracy, the percentage (and the number)
of soft phonological dyslexics remained non negligible, whatever the language (8% to 29%),
whereas the soft surface profiles almost disappeared, again whatever the language (0% to
3%): 53 phonological profiles and 4 surface dyslexics among 234 dyslexics. A similar result
was found with speed as the measure, where the proportion of phonological versus surface
dyslexics was 39% versus 10% in French (12 cases versus 3 cases) and 34% versus 14% in

9
Spanish (12 cases versus 5 cases). Another important finding was that the proportion of
dyslexics with no deficit in either pseudowords or [ir]regular words was very high in all
studies, either for accuracy (on average, 76%: 68% in English, and 92% in French) or for
speed (52% both in French and in Spanish). Thus, most of the dyslexics have a delayed
profile. These results will be discussed in the last section of the review. Next, we will address
another important issue in the neuropsychological literature: the reliability of the two
dissociated profiles.
Table 3
Reading Level Comparison (Soft Subtypes): Mean Percentage (and Number) of Different
Dyslexic Profiles in English, French, and Spanish for Accuracy and Vocal Response Latency
Accuracy Latency
English- French- *Spanish- Total French- Spanish- Total
Total Number 159 75 234 31 35 66
Phonological
Dyslexics
29 (47) 08 (06) -- 23 (53) 39 (12) 34 (12) 36 (24)
Surface
Dyslexics
03 (04) 00 (00) -- 02 (04) 10 (03) 14 (05) 12 (08)
Mixed
Profiles
00 (00) 00 (00) -- 00 (00) 00 (00) 00 (00) 00 (00)
Without
Deficit
68 (108) 92 (69) -- 76 (177) 52 (16) 52 (18) 52 (34)
Note. Grey: Higher proportions within a specific category
* Not examined because of the very high level of accuracy
ASSESSMENTS OF THE RELIABILITY OF PHONOLOGICAL AND SURFACE
PROFILES
One approach to test the reliability of a classification is to use ‘validation measures’ that
are related to the hypothesized reading deficits but independent of the tasks used to classify
the subjects. Such additional evaluations of dyslexics' reading and reading-related skills were
conducted in English (Manis et al., 1996; Stanovich et al., 1997), French (Sprenger-Charolles
et al., 2000; Ziegler et al., 2008), and Spanish (Jiménez et al., 2009). These analyses were
based on the data from the dyslexic children who exhibited a soft dissociated profiles
according to the regression method in the CA comparison (see Table 2 and Appendix 2, Part
b): 17 phonological dyslexics and 15 surface dyslexics in the accuracy-based study by Manis
et al. (1996) and by Stanovich et al. (1997); 4 phonological dyslexics and 7 surface dyslexics
in the accuracy-based study by Ziegler et al. (2008); 16 phonological dyslexics and 10 surface
dyslexics in the latency-based study by Sprenger-Charolles et al. (2000); 8 phonological
dyslexics and 16 surface dyslexics in the latency-based study by Jiménez et al. (2009).
Reading skills
The most significant findings came from the RL comparisons (not considered in the study
by Ziegler et al., 2008), in which the phonological reading skills of soft phonological
dyslexics were always found to be inferior, but the orthographic skills of soft surface dyslexics

10
were not, except in one study (Jiménez et al., 2009): in that study, surface dyslexics were
found to perform significantly more poorly than RL controls in a homophone choice task that
was designed to assess the efficiency of the lexical route. In all the other studies, the
orthographic skills of soft surface dyslexics were never below those of the RL controls,
whereas the phonological reading skills of soft phonological dyslexics were always below
them. For example, in the study with English-speaking children by Stanovich et al. (1997, see
Stanovich et al., 1997, Tables 4 and 5, p.122), the phonological reading skills of the soft
phonological dyslexics were lower than those of the RL controls, not only on the phonological
reading task used to define the profile, but also on another assessment of their phonological
reading skills (the Word Attack subtest of the Woodcock, 1987). In contrast, the orthographic
reading skills of the soft surface dyslexics were not lower than those of the RL controls, once
again not only on the orthographic task used to define the profile, but also on other
assessments of their orthographic reading skills (the Word Identification subtest of the
Woodcock, 1987, plus an experimental wordlikeness choice task). Similar results were
observed in English study by Manis et al. (1996).
In the French study by Sprenger-Charolles et al. (2000), the two groups of dyslexics with
soft dissociated profiles based on the comparison with CA controls were compared to RL
controls on the measure used to define their profiles (irregular word versus pseudoword
latencies) and on another measure (irregular word versus pseudoword accuracy scores). The
results indicated that the irregular-word scores of the soft surface dyslexics, but also those of
the soft phonological dyslexics, did not fall significantly below those of the RL controls,
whether on accuracy or on speed. In sharp contrast, both groups of dyslexics obtained lower
scores in pseudoword reading than the RL controls, in terms of speed for the soft phonological
dyslexics (the measure used to define their profiles), in terms of accuracy for the soft surface
dyslexics (a measure not used to define their profiles).
Reading-Related skills
The difficulties experienced by dyslexics in reading new words are generally explained in
terms of their poor phonological skills outside the reading domain, especially in phonemic
awareness. This deficit may hinder the acquisition of the sublexical reading procedure which
requires the ability to connect sublexical written units (graphemes) to their corresponding
sublexical spoken units (phonemes).
Phonemic awareness was assessed in five studies (Jiménez et al., 2009; Manis et al., 1996;
Sprenger-Charolles et al., 2000; Stanovich et al., 1997; Ziegler et al., 2008). A phonemic
awareness deficit that was specific to phonological dyslexics was observed only in the two
studies (Stanovich et al., 1997; Manis et al., 1996). For instance, in the study by Stanovich et
al. (1997), which involved a syllable and phoneme deletion task, the phonological awareness
scores of the phonological, but not the surface dyslexics’, lagged behind those of the RL
controls. As well, in the study by Manis et al. (1996) only phonological dyslexics performed
more poorly than RL controls in a phonemic awareness task. In contrast, in the Spanish study
by Jiménez et al. (2009) both phonological and surface dyslexics scored significantly lower
than CA and RL controls in phonemic awareness tasks. Similarly, in the French study by
Ziegler et al. (2008), surface dyslexics exhibited deficits in phonemic awareness tasks, and
this deficit was not significantly different from that of phonological dyslexics. Finally, in the
French longitudinal study by Sprenger-Charolles et al. (2000), future dyslexics (with either a
phonological or a surface profile) and future average readers were given a phonemic deletion
task at age 5. The scores of the future phonological dyslexics were not lower than those of the
future surface dyslexics, both groups performing less well than the future average readers. The
findings that sometimes surface dyslexics were found to have deficient phonemic skills is

11
examined more thoroughly below.
POSSIBLE EXPLANATIONS
The present review highlights six major findings concerning the prevalence and the
reliability of the subtypes. The first two, linked to the CA comparisons, are contradictory: the
classical method consistently revealed a high percentage of mixed profiles and a low
percentage of dissociated profiles, irrespective of the measure (accuracy or speed) and the
language; exactly the opposite pattern was observed with the regression method. Two other
findings are related to the soft dissociated profiles found in the RL comparisons: regardless of
language and measure, the percentage of soft phonological profiles remained quite high, and
the phonological reading skills of the soft phonological dyslexics were always lower than
those of the RL controls; in contrast, again regardless of language and measure, the soft
surface profiles almost disappeared and the orthographic skills of the soft surface dyslexics
were not lower than those of the RL controls, except in one study (Jiménez et al., 2009). The
fifth finding is linked to the fact that a deficiency in phonemic awareness has been reported
not only in the soft phonological profiles, but also in the soft surface profiles, at least in some
studies (e.g., Jiménez et al., 2009; Sprenger-Charolles et al., 2000; Ziegler et al., 2008).
Finally, cross-language differences were evident in the distribution of the dissociated profiles.
For instance, when the classification was based on accuracy scores, the percentages of hard
and soft phonological dyslexics was below those of hard and soft surface dyslexics in the
French and Spanish studies (Génard et al., 1998; Jiménez et al., 2009; Sprenger-Charolles et
al., 2000; Ziegler et al., 2008), but not in the English studies (Castles & Coltheart, 1993:
Manis et al., 1996; Stanovich et al., 1997).
Impact of the Method of Classification on Subtyping
One surprising finding concerns the fact that the regression method revealed a high
proportion of dyslexics with no reading difficulties. For instance, when the classification was
based on accuracy scores, this percentage was as high as 94% in the Spanish study (Jiménez et
al., 2009), as compared to 26% for the classical method in the same study and with the same
children and the same measure. Therefore, as noted by Jiménez et al. (2009, p.10) “accuracy
scores are not appropriate for classifying dyslexic subtypes in a consistent orthography”, at
least when the regression approach is used. This is because that method relies on correlations,
which are very sensitive to ceiling (and floor) effects4. This result could also be due to the fact
that, with the regression method, an individual whose scores for errors fell within the
confidence interval of the regression line, but on the very high part of that line, could be
considered as having unimpaired skills in the domains used for subtyping, as illustrated by the
cases Charlie and Fred (see Bates, Appelbaum, Salcedo, Saygin, and Pizzamiglio, 2003):
Charlie’s scores in skills X and Y used for the subtyping are more than 2 SDs above those of
the controls in the measure Y, and just 2 SDs above in the measure X; in contrast, Fred’s
scores are 1 SD above the mean of the same control group in the measure X, and within the
normal range in the measure Y. In spite of the fact that Charlie’s impairments are more severe
than Fred’s impairments, it is Fred who lies outsides the cloud of points that indicates the
degree of the correlation between scores on performance X and Y in the control group,
whereas Charlie falls within the same cloud of points (see Bates et al., 2003, Figure 3,
p.1133).
Another concern is that the regression method revealed a majority of dissociated profiles,
while the classical method revealed a majority of mixed profiles, as expected. One obvious
reason for this discrepancy is that the regression method is designed to search for dissociated
profiles, as noted by the researchers that have pioneered that method (Castles & Coltheart,

12
1993, see the beginning of the second paragraph, p.168), and explicitely stated by those who
have used and discussed it (e.g. Stanovich et al., 1997). For instance, Stanovich et al. (1997,
p.115) explained that “additional cases of subtypes could be identified, not on the basis of
abnormal performance on one measure and normal performance on the other, but on relative
imbalances on the two tasks among children who might well show depressed performance on
both”. This result is actually observed in all studies that were reviewed (see Table 2 compared
to Table 1).
Finally minor differences between studies may be attributable to differences between
samples, with more or less individuals with extreme discrepancies between lexical and
sublexical reading skills, as suggested by correlation analyses. For instance, correlations
between irregular word and pseudoword in the dyslexic samples of Castles and Coltheart
(1993), and Manis et al. (1996), were respectively .11 and .36, thus suggesting that there were
more individual with extreme discrepancies between lexical and sublexical reading skills in
the first study as compared to the second (see Manis et al., 1996, p.22).
Impact of Orthographic Transparency on Subtyping
The results obtained for accuracy indicated that, as the degree of the transparency of the
orthography increased so did the proportion of dyslexics without any apparent deficit at the
word level. Indeed, the Spanish study showed the highest proportion of dyslexics with
unimpaired reading skills. In addition to the explanation already provided, the Spanish results
could be due to the fact that the Spanish classification was based on high frequency regular
words and pseudowords. High frequency regular words could be read by both the lexical and
the sublexical reading route, and thus lead to a fewer number of errors than high frequency
irregular words. This result has been observed in studies with unimpaired readers (e.g. for
French-speaking children, Sprenger-Charolles et al., 2003), as well as in studies with dyslexic
children (e.g. for French-speaking dyslexic children, Sprenger-Charolles et al., 2009).
Furthermore, the Spanish orthography is highly regular. Therefore, the Spanish children could
also obtain a very high level of performance for pseudoword reading, at least for accuracy.
The fact that the French results were in between the Spanish and the English results is an
indicator of the impact of the degree of opacity of the orthography on the apparent severity of
the dyslexics’ reading difficulties.
Another major finding concerns the systematic differences in the proportion of soft
dissociated profiles across transparent and opaque writing systems. In the accuracy-based
studies conducted in transparent orthographies (Spanish and even French), surface dyslexics
were more frequent than phonological dyslexics. Alternatively, no such systematic differences
between the proportion of phonological and surface dyslexics were obtained in the accuracy-
based English studies, as in the latency based French and Spanish studies. We believe that
these findings reflect a measurement artefact due to the fact that pseudoword reading in
transparent orthographies (Spanish and French) is much easier than in opaque orthographies
(English); indeed, pseudoword accuracy for dyslexics in transparent languages is often at
ceiling (e.g. Jiménez et al., 2009; Sprenger-Charolles et al., 2000; Ziegler et al., 2003a). This
does not mean that phonological decoding deficits do not exist in transparent orthographies
but rather that reading speed has to be considered to detect such a deficit (e.g. Jiménez &
Hernández-Valle, 2000; Jiménez et al., 2009; Jiménez & Ramirez, 2002; Sprenger-Charolles
et al., 2000; Serrano, & Defior, 2008).
Reliability of Phonological and Surface profiles
In the RL comparison, the proportion of phonological dyslexics remained quite high,
whereas the surface profile almost disappeared. This finding suggests that the developmental

13
trajectory of most phonological dyslexics is deviant, whereas the one of most surface
dyslexics is delayed. This conclusion is also supported by the analyses of the deficits
associated with these two profiles. For instance, the orthographic skills of the surface
dyslexics were not different from those of RL controls, except in the study by Jiménez et al.
(2009), a result that could be due to poor home literacy experience (the parents of children
with a surface profile reported less home literacy experiences than the parents of the RL
controls).
In contrast, the phonological reading skills of soft phonological dyslexics systematically
fell below those of RL controls (e.g. Manis et al., 1996; Stanovich et al., 1997; Sprenger-
Charolles et al., 2000). In some studies, even the phonological reading skills of soft surface
dyslexics were inferior to those of RL controls (e.g. Sprenger-Charolles, 2000). In addition, in
the studies in which phonemic awareness was assessed (Jiménez et al., 2009; Manis et al.,
1996; Sprenger-Charolles et al., 2000; Stanovich et al., 1997; Ziegler et al., 2008) a
phonological deficit was found in phonological dyslexics, and even in surface dyslexics, at
least in three of these studies (Jiménez et al., 2009; Sprenger-Charolles et al., 2000; Ziegler et
al., 2008). Since phonological deficits were observed in surface profiles, these profiles appear
to be less reliable than the phonological profiles.
The claim that the developmental trajectory of the phonological dyslexics is deviant,
whereas that of the surface dyslexics is delayed is supported by results of studies not included
in our review: for instance, results from multi-case studies (e.g. Bowey & Rutherford, 2007;
Manis, & Bailey, 2008) and from single-case studies (e.g., Snowling, Goulandris, Bowlby, &
Howel, 1986a; Temple & Marshall, 1983, according to Bryant & Impey's re-analyses, 1986;
Valdois, Bosse, Ans, Carbonnel, Zorman, David, & Pellat, 2003). These studies also suggest
that the surface profile is less reliable than the phonological profile. Indeed, phonological
deficits have been reported in some single cases of surface dyslexia (e.g., Coltheart,
Masterson, Byng, Prior, & Riddoch, 1983, according to Bryant & Impey's re-analyses, 1986)
and in some multi-case studies (e.g. Zabell & Everatt, 2002; Bailey, Manis, Pedersen, &
Seidenberg, 2003). For instance, in the study with adult participants by Zabell and Everatt
(2002), surface dyslexics were found to behave in the same way as phonological dyslexics on
four tasks requiring phonological processing, especially in pseudoword reading and
phonological awareness. In the study by Bailey et al. (2003) surface dyslexics exhibited a
tendency to score lower than RL controls on pseudoword reading. Longitudinal data also
indicated that surface profiles were less stable than phonological profiles (e.g., Manis &
Bailey, 2008; Sprenger-Charolles et al., 2000), which led Manis and Bailey (2008) to suggest
that there is “a core subgroup with selective phonological deficits that is relatively stable and
easy to identify” (p.171), which is not the case for the surface profile.
One possible explanation of these results is that the surface profile may be due to both a
slight phonological impairment and aggravating environmental factors. As suggested by
Stanovich et al. (1997; see also Stanovich, 1999), children from a disadvantaged social
background may not only be less frequently exposed to written material but may also be given
less help in overcoming their reading deficiency than children from a social environment
likely to motivate them to learn to read despite their difficulties. Thus, as also noted by Harm
and Seidenberg (1999), the combination of mild phonological deficits and lack of reading
opportunity could lead to the surface profile. This account could explain why surface
dyslexics are often found to have impaired phonological reading skills, in addition to impaired
orthographic reading skills, the last impairment being explained by the fact that the acquisition
of well-defined orthographic representations needs frequent exposure to print.
As we have already noted, this explanation is supported by the fact that, in the study by
Jiménez et al. (2009), the orthographic deficit observed in surface dyslexics as compared to
14
RL control was found to be associated with poor home literacy experience. Additional support
for this interpretation is reported in the large scale twin study by Castles et al. (1999), in which
two subgroups of dyslexics with a dissociated profile (approximately 300 surface and 300
phonological dyslexics) were selected among a group of almost 1000 dyslexics. In the two
measures used to assess lexical reading skills as well as in a measure of print exposure, the
scores of the surface dyslexics were systematically lower than those of the phonological
dyslexics. The influence of environmental versus genetic factors was assessed by the exam of
the relations between the reading deficits of the monozygotic versus the dyzygotic twins. The
results indicated a small but significant part of the genetic component together with a large
influence of the environment in surface dyslexics, and the reverse pattern for the phonological
dyslexics. These results thus support accounts of surface dyslexia that emphasize a strong
environmental contribution.
Conclusion
The findings of the reviewed studies are not consistent with the idea that clear-cut subtypes
can be detected in developmental dyslexia. However, further progress should be made in order
to help not only researchers but also clinicians to correctly diagnose dissociated profiles.
Firstly, it is necessary to measure the reliability of each of the dissociated profiles. This
should be accomplished by the use of validation measures which are related to the
hypothesized deficits but independent of the tasks used to classify the subjects (e.g. Bates et
al., 2003). This precaution has been taken into account in most of the studies presented in our
review (e.g., Jiménez et al., 2009; Manis et al., 2006; Sprenger-Charolles et al., 2000;
Stanovich et al., 2007; Ziegler et al., 2008).
Secondly, it is necessary to more precisely assess the strength of the dissocation in each
dissociated profile, that is the magnitude of the difference between the scores obtained by each
dyslexic on tasks used to measure the dissociation between his/her lexical and phonological
reading skills. This methodological issue has been previously addressed in the context of
acquired disorders (Bates et al., 2003; Crawford & Garthwaite, 2005; Crawford, Garthwaite,
& Gray, 2003; Crawford, Garthwaite, & Howell, 2009)5. It is obvious that case studies of
developmental disorders need to consider that issue.
Finally, the fact that assessments solely based on accuracy could lead to misclassification
indicates that it is necessary to also consider speed to diagnose dyslexia. This is an important
issue since slow processing speed reflects poorly automated reading skills, which is perhaps
the unique long-term signature of developmental dyslexia (Shaywitz, & Shaywitz, 2005). Our
results also show that dissociated profiles can be obtained when speed is used as the
dependent variable, which argues against the claim that the classic dual-route distinction
between phonological and surface dyslexia is “a purely accuracy-based dichotomy” (Share,
2008, p.592).
15
NOTES
1. The dual-route model has also been applied to languages other than English (e.g.,
Ziegler, Perry & Coltheart, 2000; 2003b)
2. Processing speed can only be used when the number of correct responses is not too low
(less than 50%, see Olson, Forsberg, Wise, & Rack, 1994). This could explain why in most
studies with dyslexic children, especially ones in English, only accuracy is taken into account.
3. In a recent review, Share (2008, p.593) has noted that to assess reading speed, the use of
vocal response latency is a “standard practice … in the English language literature… whereas
in regular orthographies, a case could be made for using voice offset” (as in the study by
Landerl, Wimmer, & Frith, 1997). Furthermore, Share (2008) added that vocal response
latencies might be biased by “false starts, self corrections and hesitations” (p.593). However,
vocal response latency (and not voice offset) has been used in language with a transparent
orthography (French: e.g., Sprenger-Charolles et al., 2000 and 2003; Sprenger-Charolles,
Colé, Béchennec, & Kipffer-Piquard, 2005; Ziegler et al., 2008); German: e.g. Ziegler et al.,
2003a; Spanish: e.g., Jiménez et al., 2009). In addition, in all of the above cited studies,
latencies were computed off-line using the speech signal, which makes it possible to listen to
the recording and thus to detect false starts, self corrections and hesitations. Therefore, vocal
response latency might not be biased by “false starts, self corrections and hesitations” (the
latency of the vocal response being not taken into account in these cases).
4. See the method proposed by Crawford and Garthwaite (2005) to deal with negative
skew, that are common in control data because the tasks used often measure abilities that are
largely within the competence of unimpaired participants, and thus yield ceiling effects.
5. For instance, with the classical method, a dyslexic whose irregular and pseudoword
reading scores are respectively -0.80 SD versus -1.30 SD below the means of the control will
be considered has having a phonological profile just like a dyslexic with scores at -0.50 SD
and -4.50 SDs below the same means. Both are classified as phonological dyslexics although
the difference between pseudoword and irregular word reading is ten times greater in the
second case than in the first (for suggestions to deal with that issue, see, Crawford et al., 2003;
Crawford, & Garthwaite, 2005). Another important question is that of the correlations within
the normative sample. As explained by Bates et al. (2003) “the number of dissociations we are
able to detect is systematically related to the magnitude of the correlations between measures.
If the correlation is low (approaching zero) we are able to find a relatively large number of
dissociations. However, this is not necessary a good thing: low correlations may reflect a true
and meaningful form of independence between measures, but they may also reflect high
measurement unreliability. … By contrast, if the correlation between the measures is high,
then dissociations are much more difficult to detect” (p.1150), and some adjustments are
necessary (see Bates et al, 2003; Crawford et al., 2003; Crawford, & Garthwaite, 2005).

16
REFERENCES
Backman, J., Bruck, M., Hebert, M., & Seidenberg, M. S. (1984). Acquisition and use of
spelling sound correspondences in reading. Journal of Experimental Child Psychology, 38,
114-133.
Bailey, C. E., Manis, F. R., Pedersen, W. C., & Seidenberg, M. S. (2003). Variations among
developmental dyslexics: Evidence from a printed-word-learning task. Journal of
Experimental Child Psychology, 87, 125-154.
Bates, E., Appelbaum, M., Salcedo, J., Saygin, A.P., & Pizzamiglio, L. (2003). Quantifying
Dissociations in Neuropsychological Research. Journal of Clinical and Experimental
Neuropsychology, 25, 11281153.
Bergmann J., & Wimmer, H. (2008). A dual-route perspective on poor reading in a regular
orthography: evidence from phonological and orthographic lexical decisions. Cognitive
Neuropsychology, 25(5), 653-676.
Borgwaldt, S. R., Hellwig, F. M., & De Groot, A. M. B. (2005). Onset entropy matters –
letter-to-phoneme mappings in seven languages. Reading and Writing, 18, 211-229.
Bowey, J. A., & Rutherford, J. (2007). Imbalanced word-reading profiles in eighth-graders.
Journal of Experimental Child Psychology, 96(3), 169-196.
Bryant, P., & Impey, L. (1986). The similarities between normal readers and developmental
and acquired dyslexics. Cognition, 24, 121-137.
Castles, A., & Coltheart, M. (1993). Varieties of developmental dyslexia. Cognition, 47, 149-
180.
Castles, A., Datta, H., Gayan, J., & Olson, R. K. (1999). Varieties of reading disorder: Genetic
and environmental influences. Journal of Experimental Child Psychology, 72, 73-94.
Coltheart, M., Curtis, B., Atkins, P., & Haller, M. (1993). Models of reading aloud: Dual
route and parallel processing approaches. Psychological Review, 100, 589-608.
Coltheart, M., Masterson, J., Byng, S., Prior, M., & Riddoch, J. (1983). Surface dyslexia.
Quarterly Journal of Experimental Psychology, 35, 469-595.
Coltheart, M., Rastle, K., Perry, C., Langdon, R., & Ziegler, J. (2001). DRC: A dual route
cascaded model of visual word recognition and reading aloud. Psychological Review, 108,
204-256.
Crawford, J. R., & Garthwaite, P. H. (2005). Evaluation of criteria for classical dissociations
in single-case studies by Monte Carlo simulation. Neuropsychology, 19, 664-678.
Crawford, J. R., Garthwaite, P. H., & Gray, C. D. (2003). Wanted: Fully operational
definitions of dissociations in single-case studies. Cortex, 39, 357-370.
Crawford, J. R., Garthwaite, P. H., & Howel, D.C. (2009). On comparing a single case study
with a control sample: An alternative perspective. Neuropsychology, 47, 2690-2695.
Génard, N., Mousty, P., Content, A., Alegria, J., Leybaert, J., & Morais, J. (1998). Methods to
establish subtypes of developmental dyslexia. In P. Reitsma, & L. Verhoeven (Eds.),
Problems and interventions in literacy development (pp. 163-176). Dordrecht: Kluwer.
Goswami, U., Gombert, J. E., & Barrera, L. F. (1998). Children’s orthographic representations
and linguistic transparency: Nonsense word reading in English, French and Spanish.
Applied Psycholinguistics, 19, 19-52.
Harm, M. W., & Seidenberg, M. S. (1999). Phonology, reading acquisition, and dyslexia:
Insights from connectionist models. Psychological Review, 106, 491-528.
Jiménez, J. E., & Hernández-Valle, I. (2000). Word identification and reading disorders in the
Spanish language. Journal of Learning Disabilities, 32, 267-275.
Jiménez, J. E., & Ramírez, G. (2002). Identifying subtypes of reading disability in the Spanish
language. The Spanish Journal of Psychology, 5, 3-19.
Jiménez, J. E., Rodríguez, C., & Ramírez, G. (2009). Spanish developmental dyslexia:
17
Prevalence, cognitive profile and home literacy experiences. Journal of Experimental Child
Psychology. 103(2), 167-185.
Landerl, K., Wimmer, H., & Frith, U. (1997). The impact of orthography consistency on
dyslexia: A German-English comparison. Cognition, 63, 315-334.
Manis, F. R., & Bailey, C. E. (2008). Exploring heterogeneity in developmental dyslexia: A
longitudinal investigation. In G. Reid, A.J. Fawcett, L. S. Siegel, & F. Manis (Eds.), The
Sage Handbook of Dyslexia (pp. 149-173). London: Sage Publications Ltd.
Manis, F. R., Custodio, R., & Szeszulski, P. A. (1993). Development of phonologic and
orthographic skills: A 2-year longitudinal study of dyslexic children. Journal of
Experimental Child Psychology, 56, 64-86.
Manis, F. R., Seidenberg, M. S., Doi, L. M., McBride-Chang, C., & Peterson, A. (1996). On
the basis of two subtypes of developmental dyslexia. Cognition, 58, 157-195.
McDougall, P., Borowsky, R., MacKinnon, G. E., & Hymel, S. (2004). Process dissociation of
sight vocabulary and phonetic decoding in reading: A new perspective on surface and
phonological dyslexias. Brain and Language, 92, 185-203.
Milne, R. D., Nicholson, T., & Corballis, M. C. (2003). Lexical access and phonological
decoding in adult dyslexic subtypes. Neuropsychology, 17, 362-368.
Olson, R. K., Forsberg, H., Wise, B., & Rack, J. (1994). Mesurement of word recognition,
orthographic and phonological skills. In G. R. Lyon (Ed.), Frames of reference for the
assessment of learning desabilities: New views on measurement issues (pp. 243-275).
Baltimore/London: Paul H. Brookes.
Paulesu, E., Démonet, J.-F., Fazio, F., McCrory, E., Chanoine, V., Brunswick, N, Cappa, S.
F., Cossu, G., Habib, M., Frith, C. D., & Frith, U. (2001). Dyslexia, Cultural diversity and
Biological unity. Science, 291, 2165-2167.
Peereman, R., & Content, A. (1998). Quantitative analysis of orthography to phonology
mapping in English and French (on-line).
http://homepages.vub.ac.be/~acontent/OPMapping.html.
Peereman, R., Lété, B., & Sprenger-Charolles, L. (2007). Manulex-infra: Distributional
characteristics of infra-lexical and lexical units in child-directed written material. Behavior
Research Methods, Instruments and Computers, 39, 593-603.
Plaut, D. C., McClelland, J. L., Seidenberg, M. S., & Patterson, K. E. (1996). Understanding
normal and impaired word reading: Computational principles in quasi-regular domain.
Psychological Review, 103, 56-115.
Rack, J. P., Snowling, M. J., & Olson, R. K. (1992). The nonword reading deficit in
developmental dyslexia: A review. Reading Research Quarterly, 27, 29-53.
Seidenberg, M. S., & McClelland, J. L. (1989). A distributed developmental model of word
recognition and naming. Psychological Review, 96, 523-568.
Serrano, F.D., & Defior, S. (2008). Dyslexia speed problems in a transparent orthography.
Annals of Dyslexia, 58, 81-95.
Seymour, P. H. K. (1986). A cognitive analysis of dyslexia. London: Routledge and Kegan
Paul.
Seymour, P. H. K., Aro, M., & Erskine, J. M. (2003). Foundation literacy acquisition in
European orthographies. British Journal of Psychology, 94, 143-174.
Share, D. L. (1995). Phonological recoding and self-teaching: Sine qua non of reading
acquisition. Cognition, 55, 151-218.
Share, D. L. (2008). On the Anglocentrism of current reading research and practice: The perils
of overreliance on an “outlier orthography”. Psychological Bulletin, 134, 584-615.
Shaywitz, S.E., & Shaywitz, B.A. (2005). Dyslexia (Specific Reading Disability). Biological
Psychiatry, 57, 1301-1309.

18
Siegel, L. S. (1993). Phonological processing deficits in reading as the basis of a reading
disability. Developmental Review, 13, 246-257.
Siegel, L. S. (1998). Phonological processing deficits and reading disabilities. In J. L. Metsala,
& L. C. Ehri (Eds.), Word Recognition in Beginning Literacy (pp.141-160). Mahwah, NJ,
Lawrence Erlbaum Associates.
Siegel, L. S. (1999). Issues in the definition and diagnosis of learning disabilities. Journal of
Learning Disabilities, 22, 469-478.
Snowling, M. J., Goulandris, N., Bowlby, M., & Howel, P. (1986a). Segmentation and speech
processing in relation to reading skills: A developmental analysis. Journal of Experimental
Child Psychology, 41, 489-507.
Snowling, M. J., Stackhouse, J., & Rack, J. (1986b). Phonological dyslexia and dysgraphia: A
developmental analysis. Cognitive Neuropsychology, 3, 309-339.
Sprenger-Charolles, L. (2003). Reading acquisition: Cross linguistic data. In T.Nunes, &
P.Bryant (Eds.), Handbook of children’s literacy (pp. 43-66). Dordrecht: Kluwer.
Sprenger-Charolles, L., Colé, P., Béchennec, D., & Kipffer-Piquard, A. (2005). French
normative data on reading and related skills from EVALEC, a new computerized battery of
tests (end Grade 1, Grade 2, Grade 3, and Grade 4). European Review of Applied
Psychology, 55(3), 157-186.
Sprenger-Charolles, L., Colé, P., Kipffer-Piquard, A., Pinton, F., & Billard, C. (2009).
Reliability and prevalence of an atypical development of phonological skills in French-
speaking dyslexics. Reading and writing: An interdisciplinary journal, 22(7), 811-842.
Sprenger-Charolles, L., Colé, P., Lacert, P., & Serniclaes, W. (2000). On subtypes of
developmental dyslexia: Evidence from processing time and accuracy scores. Canadian
Journal of Experimental Psychology, 54, 88-104.
Sprenger-Charolles, L., Colé, P., & Serniclaes, W. (2006). Reading acquisition and
developemental dyslexia (Essays in developmental psychology). Psychology Press, Hove,
UK, and New-York, USA (Taylor & Francis)
Sprenger-Charolles, L., Siegel, L. S., Béchennec, D, & Serniclaes, W. (2003). Development of
phonological and orthographic processing in reading aloud, in silent reading and in
spelling: A four year longitudinal study. Journal of Experimental Child Psychology, 84,
194-217.
Sprenger-Charolles, L., Siegel, L. S., & Bonnet, P. (1998). Reading and spelling acquisition in
French: The role of phonological mediation and orthographic factors. Journal of
Experimental Child Psychology, 68, 134-165.
Stanovich, K. E (1999). The sociopsychometrics of learning disabilities. Journal of Learning
Disabilities, 32, 350-361.
Stanovich, K. E., & Siegel L. S. (1994). Phenotypic performance profile of children with
reading disabilities: A regression-based test of the phonological-core variable-difference
model. Journal of Educational Psychology, 86, 24-53.
Stanovich, K. E., Siegel, L. S., & Gottardo, A. (1997). Converging evidence for phonological
and surface subtypes of reading disability. Journal of Educational Psychology, 89, 114-
127.
Temple, C. M., & Marshall, J. C. (1983). A case study of developmental phonological
dyslexia. British Journal of Psychology, 74, 517-533.
Valdois, S., Bosse, M. L., Ans, B., Carbonnel, S., Zorman, M., David, D., & Pellat, J. (2003).
Phonological and visual processing deficits can dissociate in developmental dyslexia:
Evidence from two case studies. Reading and Writing: An Interdisciplinary Journal, 16,
541-572.
Waters, G. S., Seidenberg, M. S., & Bruck, M. (1984). Children’s and adults’ use of spelling
19
sound information in three reading tasks. Memory & Cognition, 12, 293-305.
Woodcock, R.W. (1987). Woodcock Rending Mastery Tests-- Revised. Circle Pines, MN:
American Guidance Service.
Zabell, C., & Everatt, J. (2002). Surface and phonological subtypes of adult developmental
dyslexia. Dyslexia, 8, 160-177.
Ziegler, J. C., Bertrand, D., Tóth, D., Csépe, V., Reis, A., Faísca, L., et al. (2010).
Orthographic depth and its impact on universal predictors of reading: A cross-language
investigation. Psychological Science, 21, 551–559.
Ziegler, J. C., Castel, C., Pech-Georgel, C., George, F., Alario, F.X., & Perry, C. (2008).
Developmental dyslexia and the Dual Route Model of reading: Simulating Individual
differences and subtypes. Cognition, 107, 151–178.
Ziegler, J., & Goswami, U. (2005). Reading acquisition, developmental dyslexia and skilled
reading across languages: A psycholinguistic grain size theory. Psychological Bulletin,
131, 3-29.
Ziegler, J. C., Jacobs, A. M., & Stone, G. O. (1996). Statistical analysis of the bidirectional
inconsistency of spelling and sound in French. Behavior Research Methods, Instruments &
Computers, 28, 504-515.
Ziegler, J. C., Perry, C., & Coltheart, M. (2000). The DRC model of visual word recognition
and reading aloud: An extension to German. European Journal of Cognitive Psychology,
12, 413-430.
Ziegler, J. C., Perry, C., Ma-Wyatt, A., Ladner, D., & Schulte-Korne, G. (2003a).
Developmental dyslexia in different languages: Language-specific or universal? Journal of
Experimental Child Psychology, 86, 169-193.
Ziegler, J. C., Perry, C., & Coltheart, M. (2003b). Speed of lexical and nonlexical processing
in French: The case of the regularity effect. Psychonomic Bulletin & Review, 10, 947–953.
Ziegler, J. C., Stone, G. O., & Jacobs, A. M. (1997). What is the pronunciation for -ough and
the spelling for /u/? A data base for computing feedforward and feedback consistency in
English. Behavior Research Methods Instruments and Computers, 29, 600-618.

20
APPENDICES
Appendix 1.
Sample Size, Sex Ratio, Chronological Age (CAC) and Reading Level (RLC) Controls
English French Spanish
Castles &
Coltheart
1993
Manis
et al.
1996
Stanovich et
al.
1997
Génard
et al.
1998
Sprenger-
Charolles et al.
2000
Ziegler
et al.
2008
Jiménez
et al.
2009
Number of Dyslexics
Sex Ratio (Male/Female)
Mean Chronological Age
Range (years or months)
53
53-0
11
8½ to 15 Y-O
51
37-14
12
9 to 15 Y-O
68
29-39
9
11 months
75
50-25
10
9 to 12 Y-O
31
20-11
10
11 months
24
15-9
10
8 to 12 Y-O
35
22-13
10
7½ to 11 Y-O
Number of CAC
Sex Ratio (Male/Female) 56
56-0
51
35-16
44
16-28
231
99-132
19
11-8
24
12-12
47
23-24
Number of RLC
Sex Ratio (Male/Female) 17*
17-0
27
18-9
23
13-10
256
109-147
19
11-8
No data 40
20-20
*Analyses reported in Stanovich et al. (1997) including 40 of the 53 dyslexics

21
Appendix 2. Mean Percentage (and Number) of Different Dyslexic Profiles in Each Study for the Chronological-Age Comparison according to the Classical Method (2a)
and to the Regression-Based Method (2b) and for the Reading Level Comparison (2c): Results based on Accuracy and Vocal Response Latency
English French Spanish
Castles & Col-
theart, 1993
Manis et
al., 1996
Stanovich
et al., 1997
Génard et
al., 1998
Sprenger-Charolles
et al., 2000
Ziegler
et al., 2008
Jiménez
et al., 2009
2a. Chronological-Age Comparison. Classical Method: Hard subtypes (Cut-off: 1 Standard-Deviation)
Accuracy
a Accuracy Accuracy
b Accuracy Accuracy Latency Accuracy
c Latency
c Accuracy
d Speed
d
Phono. DYS 15 (08) 10 (05) 9 (06) 3 (02) 10 (03) 16 (05) 8 (02) 17 (04) 8 (03) 11 (04)
Surface DYS 17 (09) 10 (05) 12 (08) 23 (17) 19 (06) 19 (06) 21 (05) 21 (05) 23 (08) 14 (05)
Mixed Profiles 60 (32) 76 (39) 75 (51) 67 (50) 68 (21) 52 (16) 46 (11) 42 (10) 43 (15) 54 (19)
Without Deficit 8 (04) 4 (02) 4 (03) 8 (06) 3 (01) 13 (04) 25 (06) 21 (05) 26 (09) 20 (07)
2b. Chronological-Age Comparison. Regression-based Method: Soft subtypes (Confidence Interval [CI]: 90 or 95)
Accuracy Accuracy Accuracy Accuracy Accuracye Latency Accuracy Latency
c Accuracy Speed
CI 90 95 90 95 95 95 95 90 90
Phono. DYS 55 (29) 33 (17) 25 (17) 4 (03) -- 52 (16) 17 (04) 25 (06) 3 (01) 23 (08)
Surface DYS 30 (16) 29 (15) 22 (15) 56 (42) -- 32 (10) 29 (07) 46 (11) 3 (01) 46 (16)
Mixed Profiles 6 (03) 10 (05) 28 (19) 3 (02) -- 3 (01) 0 (00) 0 (00) 0 (00) 0 (00)
Without Deficit 9 (05) 28 (14) 25 (17) 37 (28) -- 13 (04) 54 (13) 29 (07) 94 (33) 31 (11)
2c. Reading-Level Comparison. Regression-based Method: Soft subtypes (Confidence Interval [CI]: 90 or 95)
Accuracyf Accuracy Accuracy Accuracy Accuracy
e Latency Accuracy
g Latency
g Accuracy
g Speed
CI 90 95 90 95 95 90
Phono. DYS 37.5 (15) 29 (15) 25 (17) 8 (06) -- 39 (12) -- -- -- 34 (12)
Surface DYS 5 (02) 2 (01) 1.5 (01) 0 (00) -- 10 (03) -- -- -- 14 (05)
Mixed Profiles 0 (00) 0 (00) 0 (00) 0 (00) -- 0 (00) -- -- -- 0 (00)
Without Deficit 57.5 (23) 69 (35) 73.5 (50) 92 (69) -- 52 (16) -- -- -- 52 (12)
a. From Manis et al., 1996; b. Unpublished data provided by Stanovich; c. Unpublished data provided by Ziegler; d. Unpublished data provided by Jiménez
e. Results not reported because of ceiling effect in the CA controls for irregular words; f. From Stanovich et al. (1997); g. Data not available