Embed Size (px)
Citation preview
Pretreatment assessment of Chronic Hepatitis C and Compensated Cirrhosis and Indications for Therapy
Teerha Piratvisuth MD.Prince of Songkla University
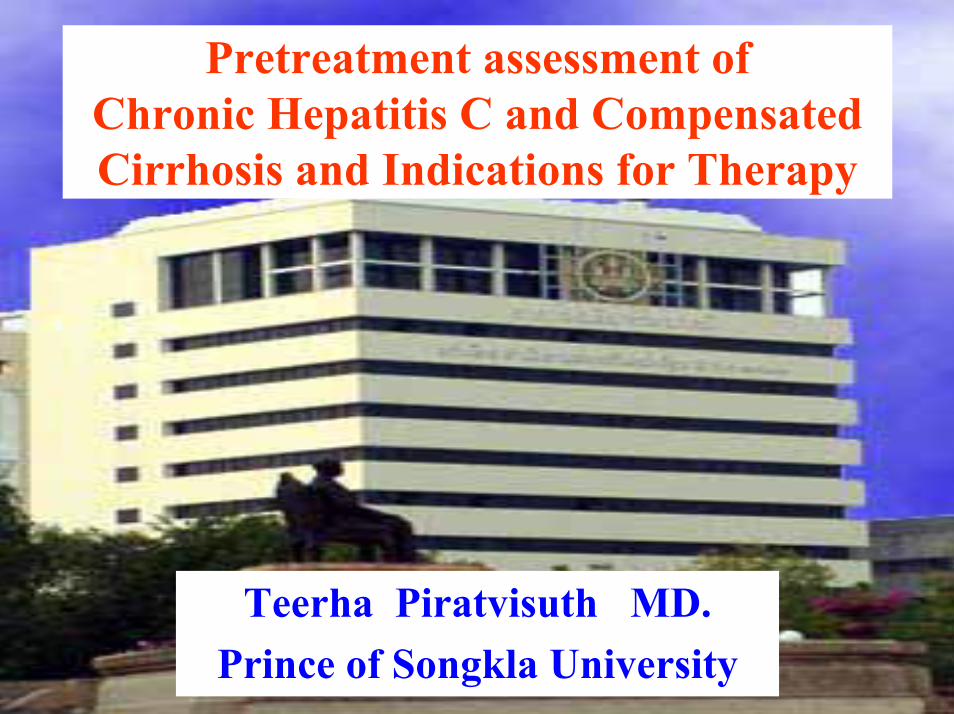
NGI <100 copies/ml
0
5
10
15
20
25
30
35
40
45
IFN-2b 24 wk IFN-2b 48 wk IFN-2b + Riba 24wk
IFN-2b + Riba 48wkSu
stai
ned
Vir
olog
ic R
espo
nse
6%
16%
33%
41%
McHutchison J. N Engl Med. 2000.
Treatment of chronic hepatitis C and response rates
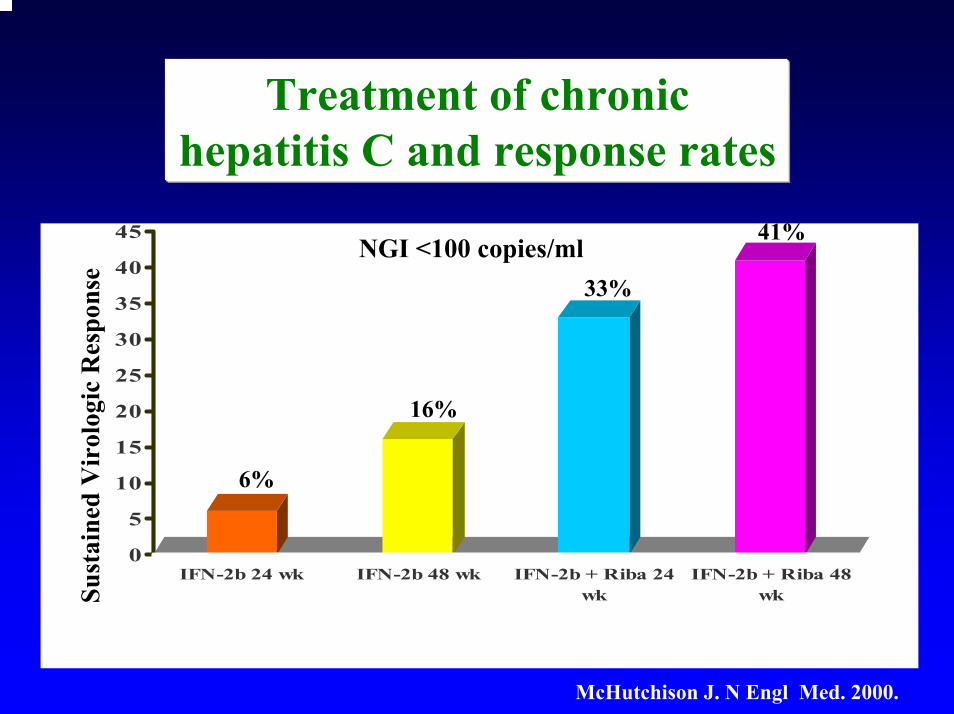
Although all patients with chronic hepatitis C are potential candidates for antiviral therapy, careful pretreatment assessment and selection are mandatory to optimize the risk / benefit and cost / benefit ratio of therapy
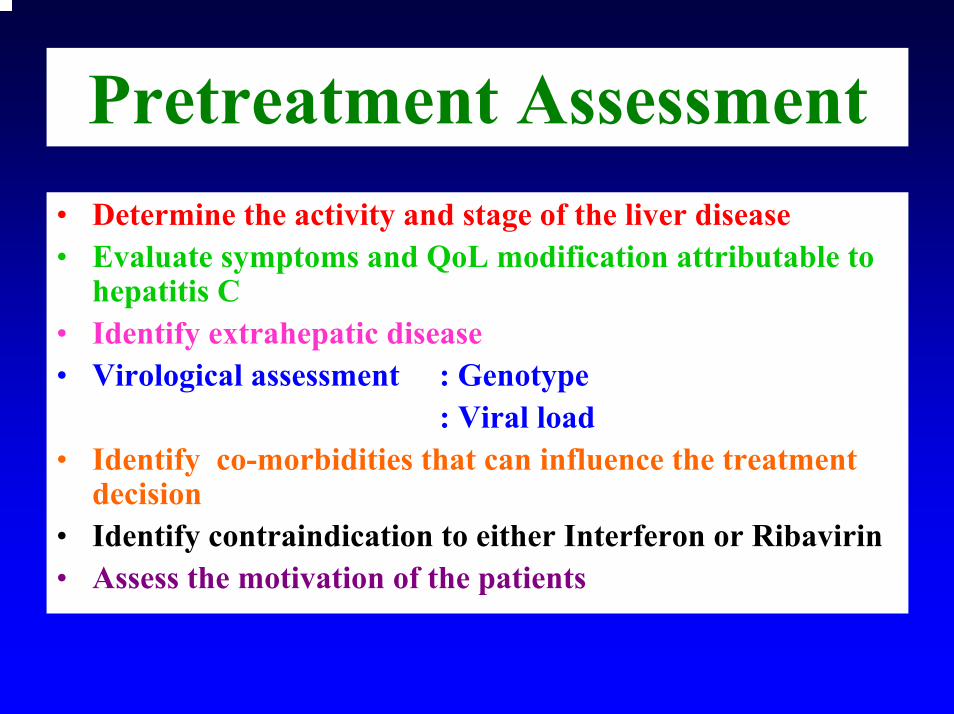
Pretreatment Assessment• Determine the activity and stage of the liver disease• Evaluate symptoms and QoL modification attributable to
hepatitis C• Identify extrahepatic disease• Virological assessment : Genotype
: Viral load• Identify co-morbidities that can influence the treatment
decision• Identify contraindication to either Interferon or Ribavirin• Assess the motivation of the patients
Determine Activity and Stage of the Liver Disease
• Invasive : Liver Biopsy• Non-invasive
Afdhal NH. et al. Am J Gastroenterol. 2004; 44: 1160-73.
Liver Biopsy remains the gold standard for assessing liver disease in patients with chronic hepatitis C
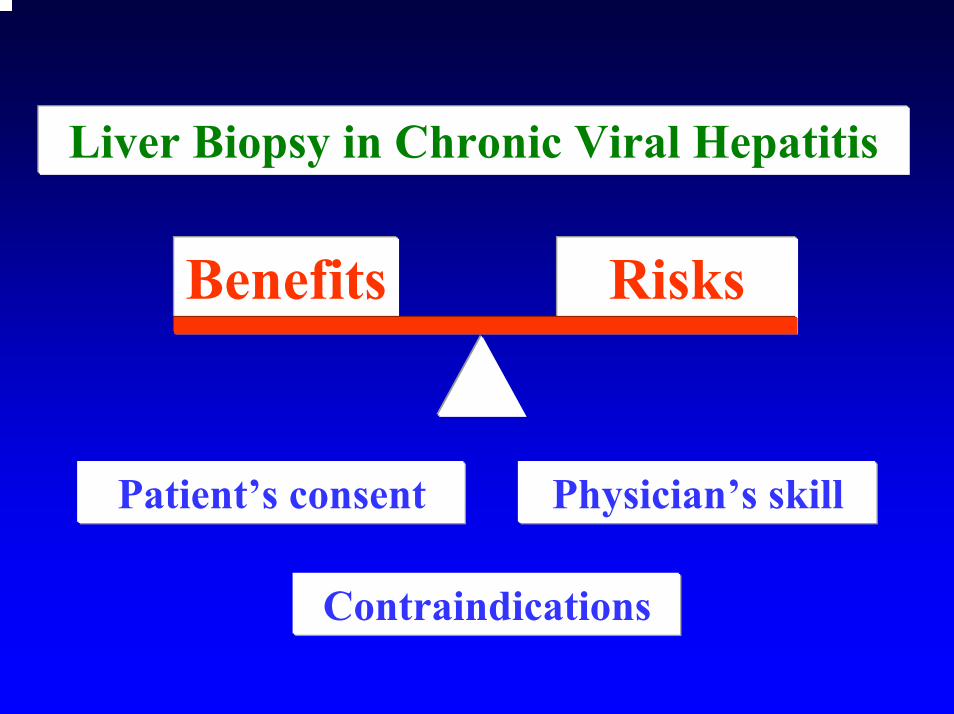
Benefits Risks
Liver Biopsy in Chronic Viral Hepatitis
Patient’s consent Physician’s skill
Contraindications
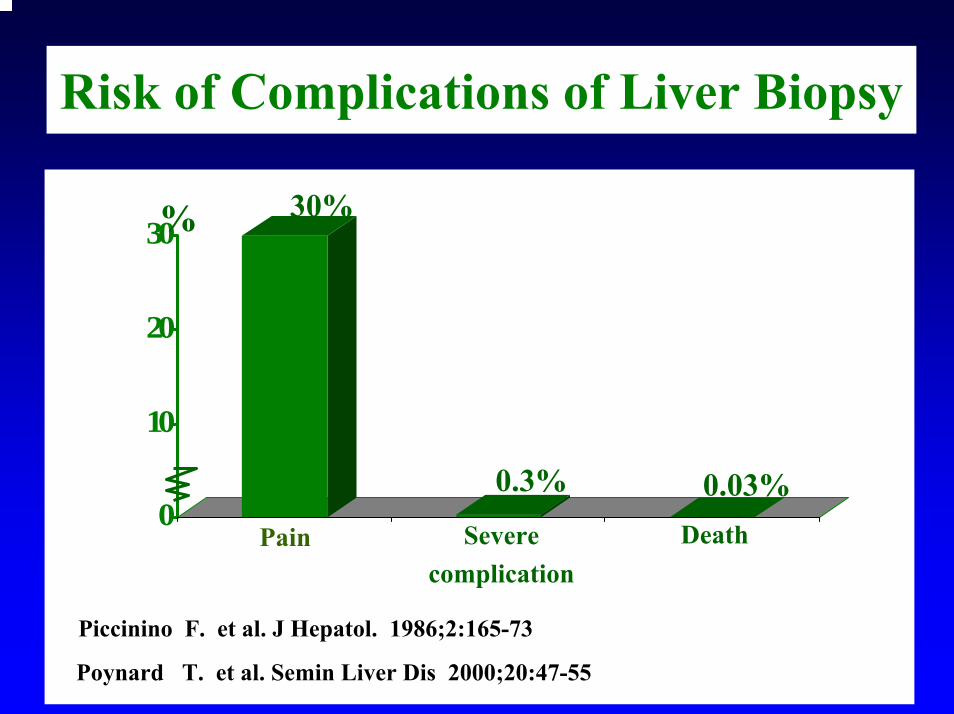
Risk of Complications of Liver Biopsy
Severecomplication
0
10
20
30
Death
% 30%
0.3% 0.03%
Piccinino F. et al. J Hepatol. 1986;2:165-73
Poynard T. et al. Semin Liver Dis 2000;20:47-55
Pain
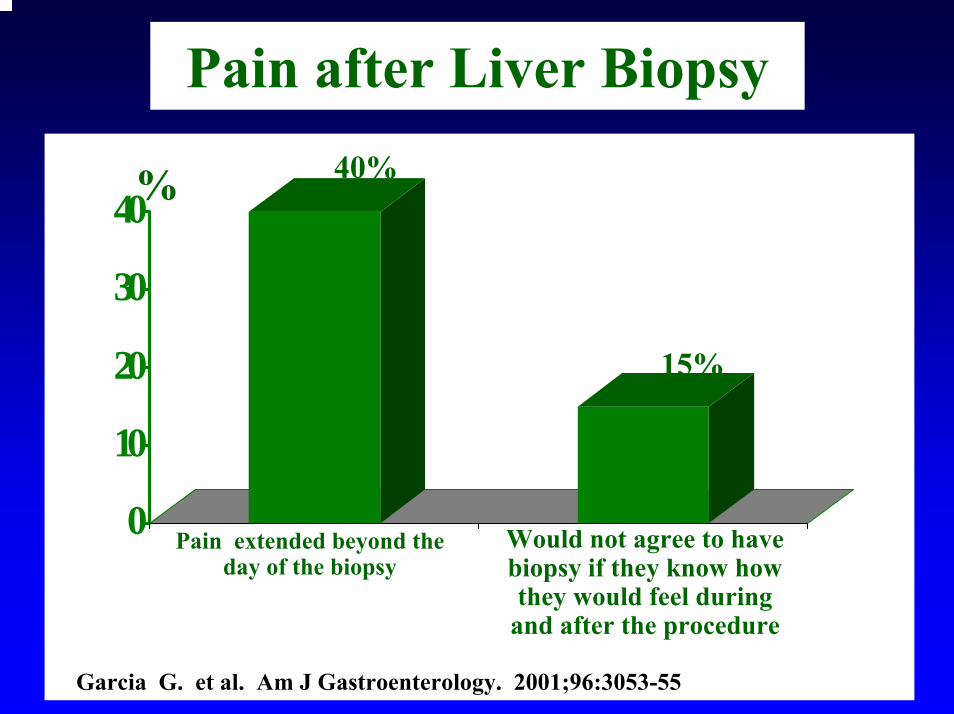
Pain after Liver Biopsy
0
10
20
30
40%40%
15%
Garcia G. et al. Am J Gastroenterology. 2001;96:3053-55
Would not agree to have biopsy if they know how they would feel during
and after the procedure
Pain extended beyond the day of the biopsy
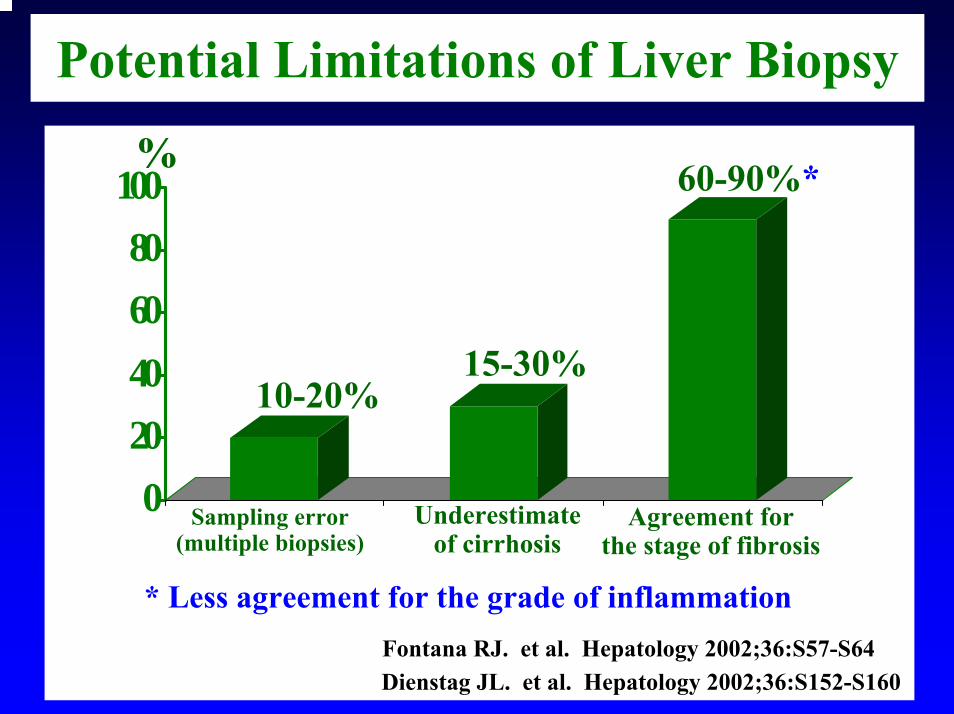
Potential Limitations of Liver Biopsy
020406080
100%
10-20%
60-90%*
Fontana RJ. et al. Hepatology 2002;36:S57-S64
Underestimate of cirrhosis
Sampling error (multiple biopsies)
15-30%
Agreement for the stage of fibrosis
Dienstag JL. et al. Hepatology 2002;36:S152-S160
* Less agreement for the grade of inflammation
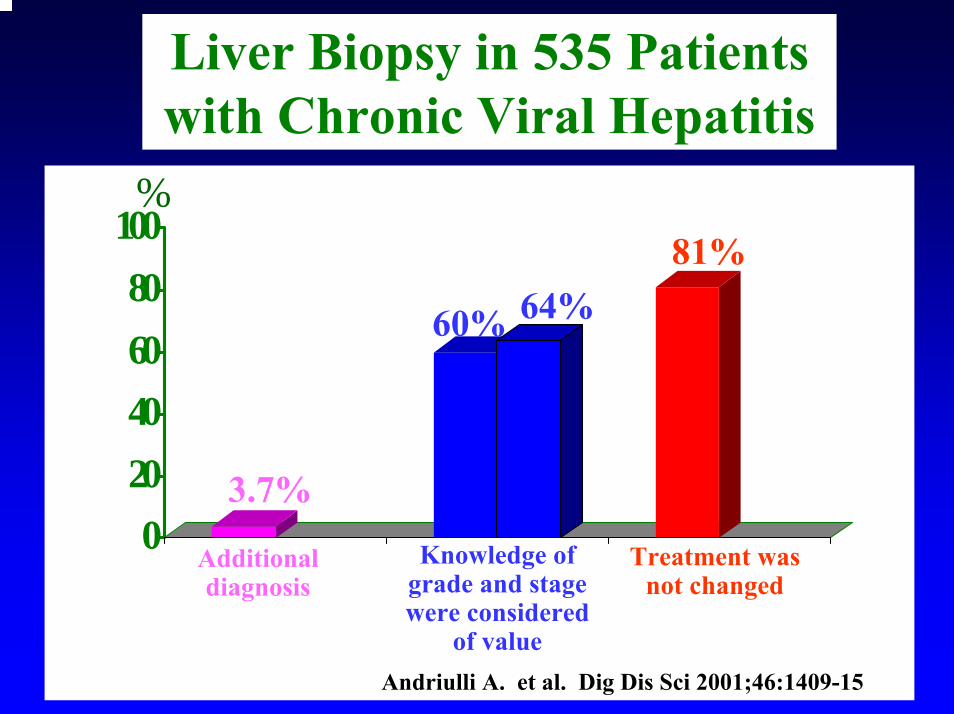
Liver Biopsy in 535 Patients with Chronic Viral Hepatitis
020406080
100%
3.7%
81%
Knowledge of grade and stage were considered
of value
Additional diagnosis
60%
Treatment was not changed
Andriulli A. et al. Dig Dis Sci 2001;46:1409-15
64%
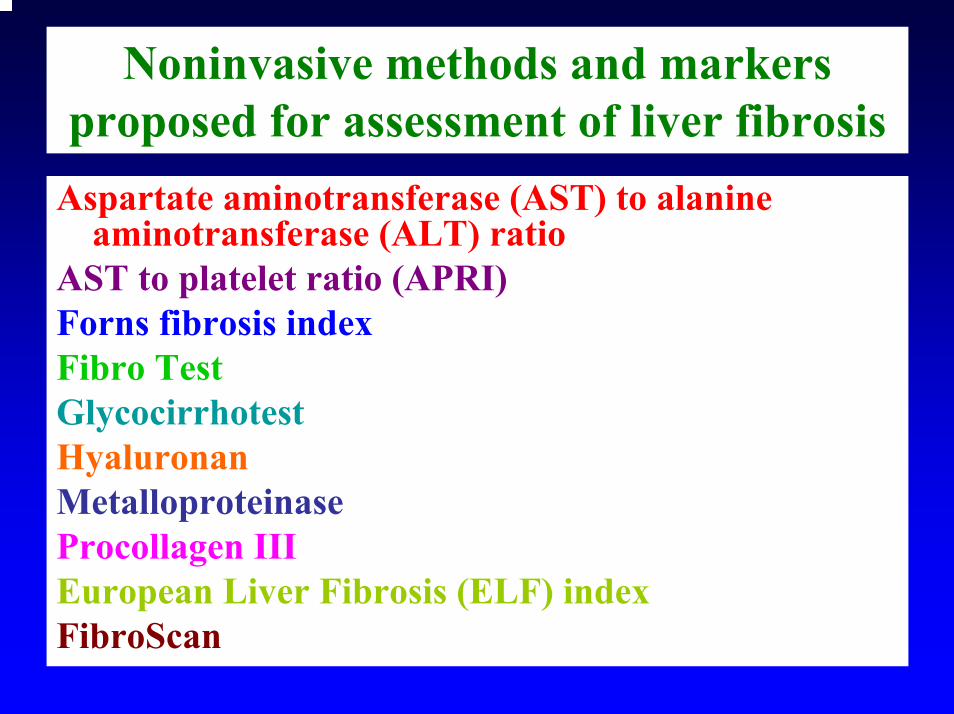
Noninvasive methods and markers proposed for assessment of liver fibrosis
Aspartate aminotransferase (AST) to alanine aminotransferase (ALT) ratio
AST to platelet ratio (APRI) Forns fibrosis index Fibro Test Glycocirrhotest Hyaluronan Metalloproteinase Procollagen III European Liver Fibrosis (ELF) index FibroScan
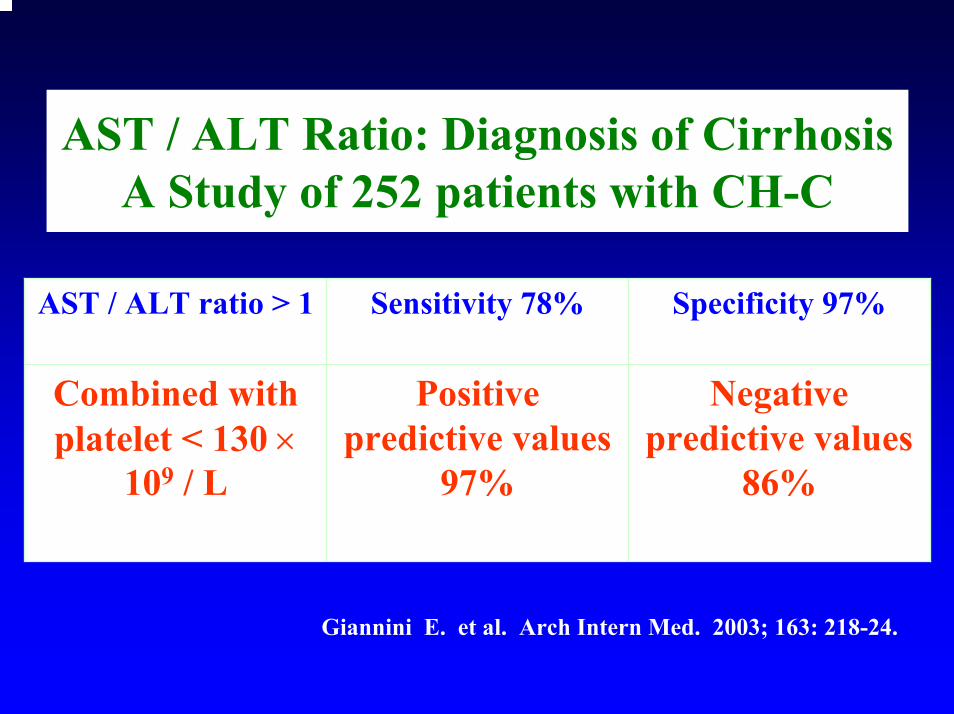
AST / ALT Ratio: Diagnosis of Cirrhosis A Study of 252 patients with CH-C
Negative predictive values
86%
Positive predictive values
97%
Combined with platelet < 130 ×
109 / L
Specificity 97%Sensitivity 78%AST / ALT ratio > 1
Giannini E. et al. Arch Intern Med. 2003; 163: 218-24.
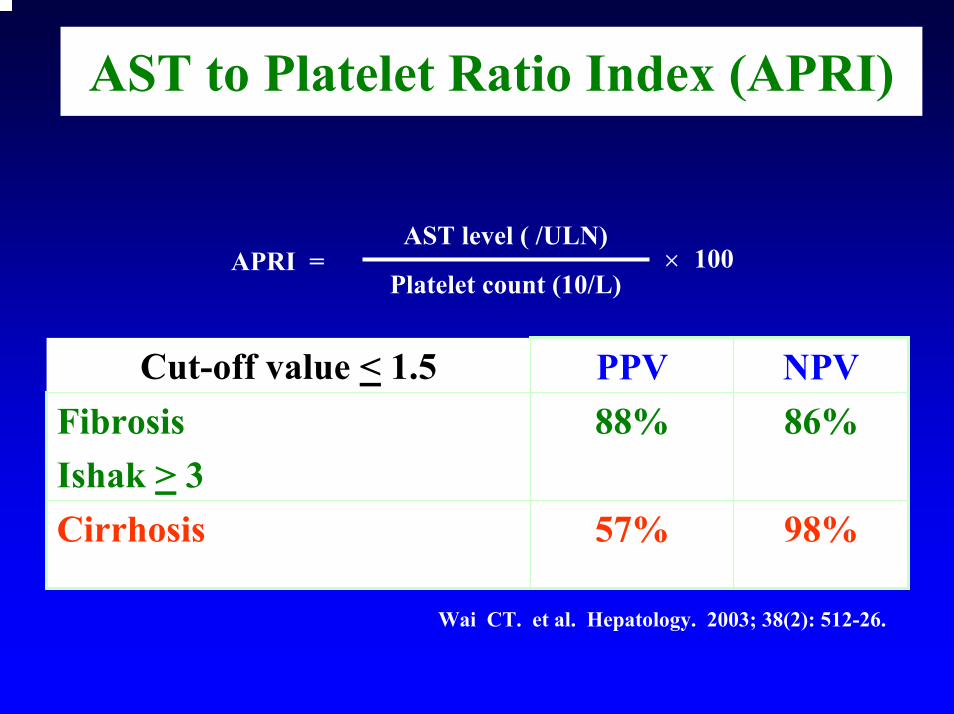
AST to Platelet Ratio Index (APRI)
57%
88%PPV
98%Cirrhosis
86%FibrosisIshak > 3
NPVCut-off value < 1.5
Wai CT. et al. Hepatology. 2003; 38(2): 512-26.
AST level ( /ULN)
Platelet count (10/L)× 100APRI =
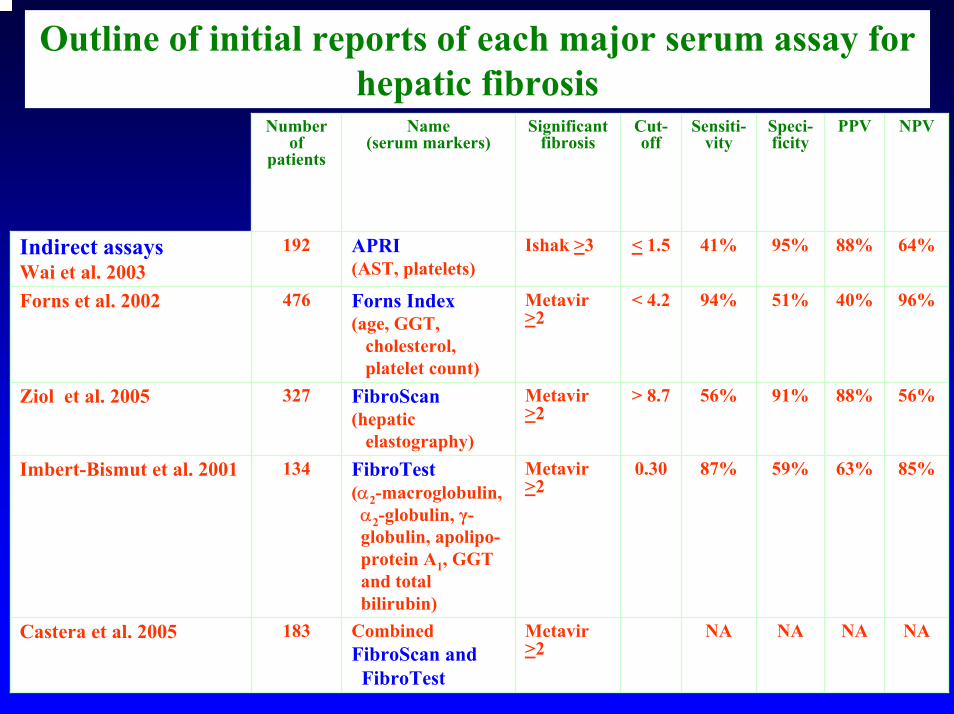
Outline of initial reports of each major serum assay for hepatic fibrosis
Number of
patients
Name (serum markers)
Significant fibrosis
Cut-off
Sensiti-vity
Speci-ficity
PPV NPV
Indirect assaysWai et al. 2003
192 APRI(AST, platelets)
Ishak >3 < 1.5 41% 95% 88% 64%
Forns et al. 2002 476 Forns Index(age, GGT,
cholesterol, platelet count)
Metavir >2
< 4.2 94% 51% 40% 96%
Ziol et al. 2005 327 FibroScan(hepatic
elastography)
Metavir >2
> 8.7 56% 91% 88% 56%
Imbert-Bismut et al. 2001 134 FibroTest(α2-macroglobulin,α2-globulin, γ-globulin, apolipo-protein A1, GGTand total bilirubin)
Metavir >2
0.30 87% 59% 63% 85%
Castera et al. 2005 183 CombinedFibroScan and FibroTest
Metavir >2
NA NA NA NA
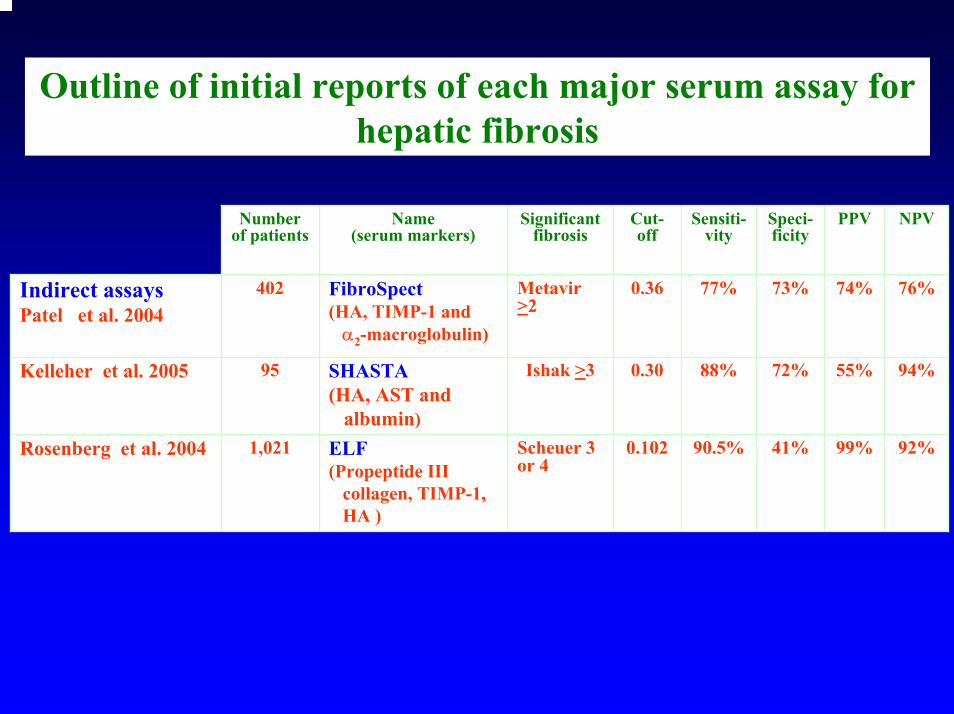
Outline of initial reports of each major serum assay for hepatic fibrosis
Number of patients
Name (serum markers)
Significant fibrosis
Cut-off
Sensiti-vity
Speci-ficity
PPV NPV
Indirect assaysPatel et al. 2004
402 FibroSpect(HA, TIMP-1 and α2-macroglobulin)
Metavir >2
0.36 77% 73% 74% 76%
Kelleher et al. 2005 95 SHASTA(HA, AST and
albumin)
Ishak >3 0.30 88% 72% 55% 94%
Rosenberg et al. 2004 1,021 ELF(Propeptide III
collagen, TIMP-1, HA )
Scheuer 3 or 4
0.102 90.5% 41% 99% 92%
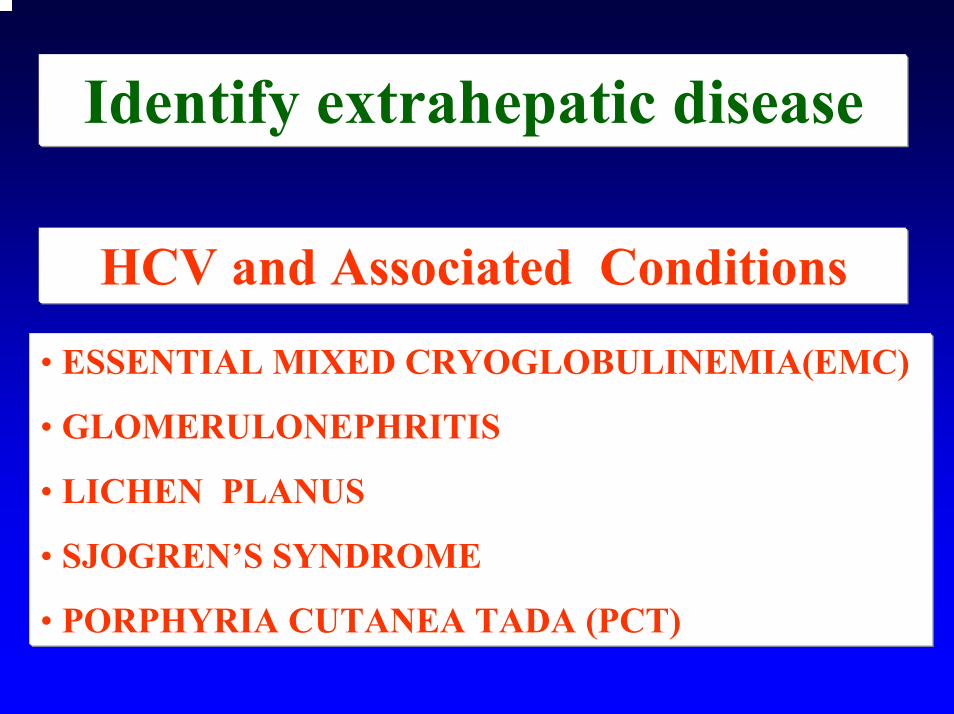
HCV and Associated Conditions
• ESSENTIAL MIXED CRYOGLOBULINEMIA(EMC)
• GLOMERULONEPHRITIS
• LICHEN PLANUS
• SJOGREN’S SYNDROME
• PORPHYRIA CUTANEA TADA (PCT)
Identify extrahepatic disease
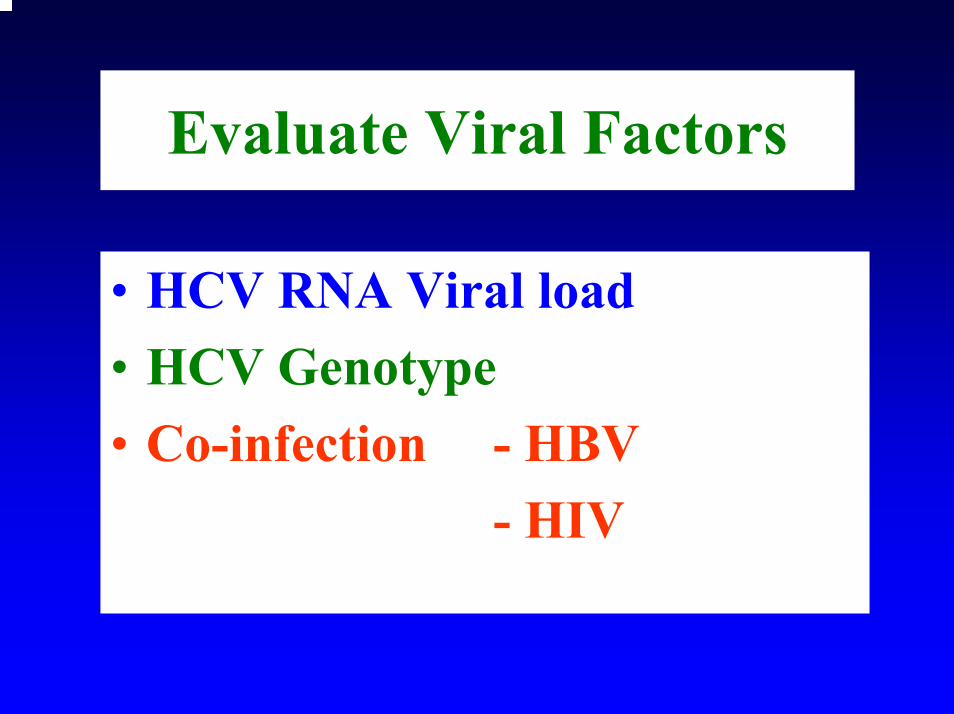
Evaluate Viral Factors
• HCV RNA Viral load• HCV Genotype• Co-infection - HBV
- HIV
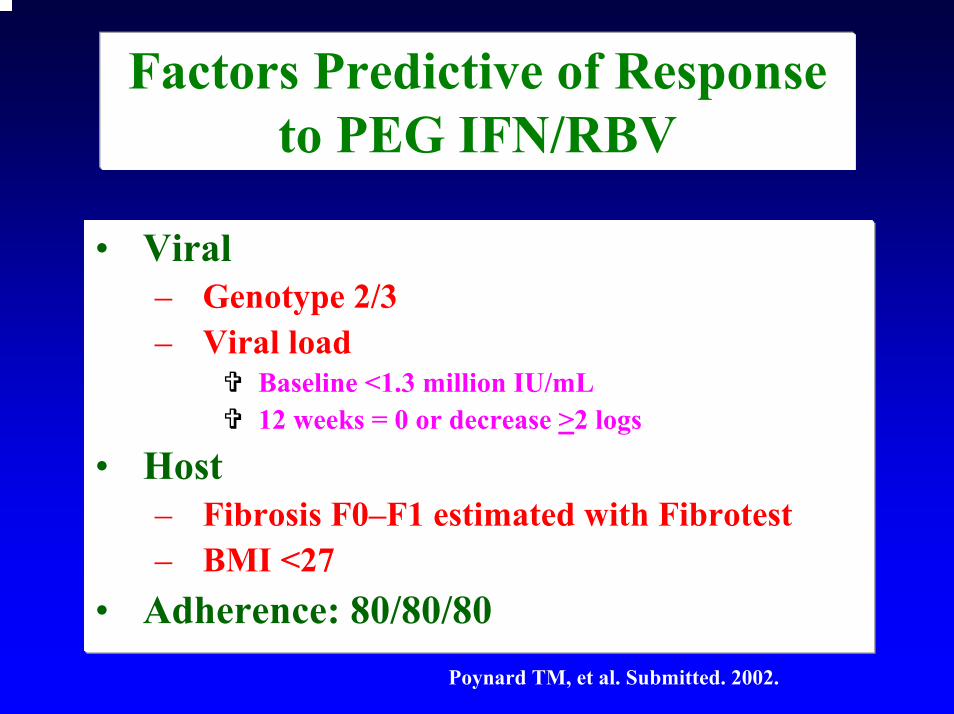
Factors Predictive of Response to PEG IFN/RBV
• Viral– Genotype 2/3 – Viral load
Baseline <1.3 million IU/mL12 weeks = 0 or decrease >2 logs
• Host – Fibrosis F0–F1 estimated with Fibrotest– BMI <27
• Adherence: 80/80/80Poynard TM, et al. Submitted. 2002.
05
101520253035404550
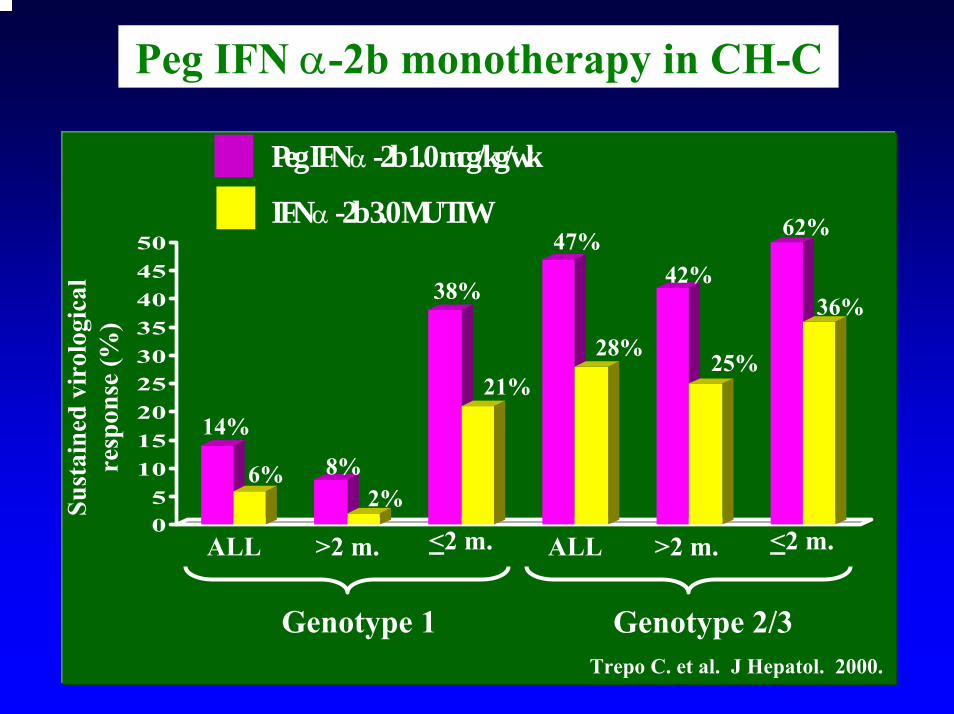
Peg IFN α-2b monotherapy in CH-CSu
stai
ned
viro
logi
cal
resp
onse
(%)
14%
8%2%
38%
21%
42%47%
25%
36%
Genotype 2/3
ALL >2 m. <2 m.
62%
28%
6%
Genotype 1
ALL >2 m. <2 m.
Peg IFN α -2b 1.0 mcg/kg/wkIFN α -2b 3.0 MU TIW
Trepo C. et al. J Hepatol. 2000.

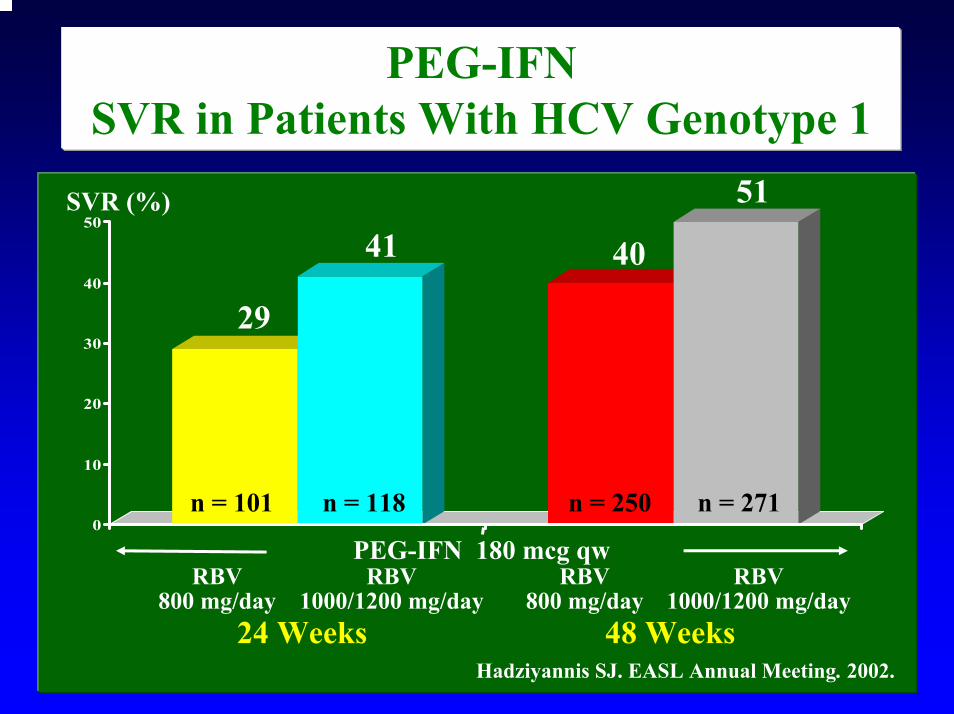
PEG-IFN SVR in Patients With HCV Genotype 1
0
10
20
30
40
50SVR (%)
29
51
4041
24 Weeks 48 Weeks
n = 101 n = 118 n = 250 n = 271
RBV800 mg/day
RBV1000/1200 mg/day
RBV800 mg/day
RBV1000/1200 mg/day
PEG-IFN 180 mcg qw
Hadziyannis SJ. EASL Annual Meeting. 2002.
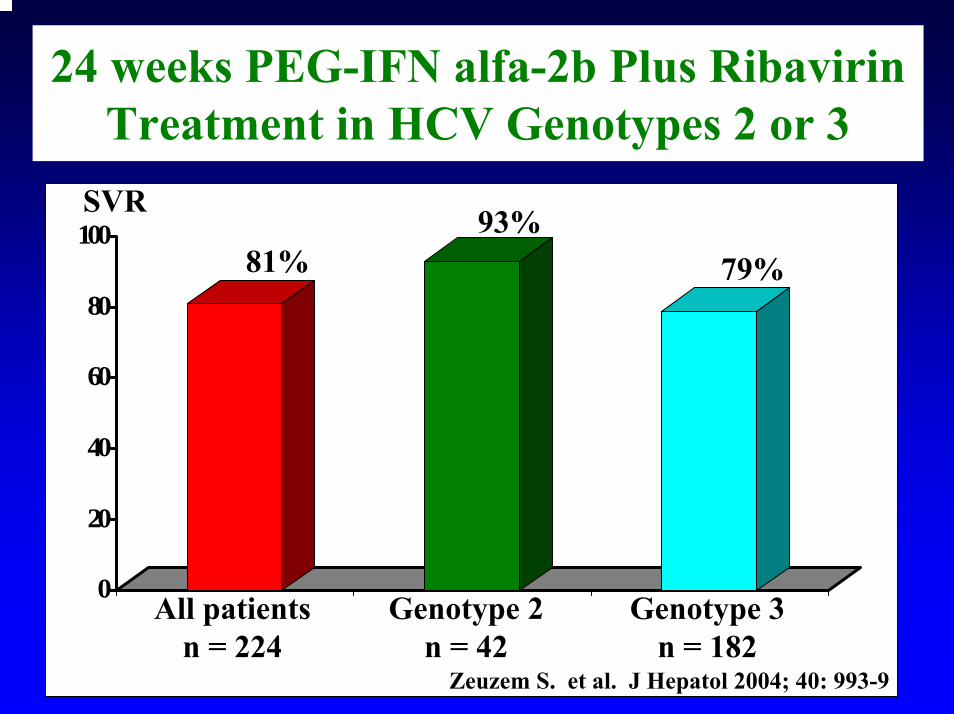
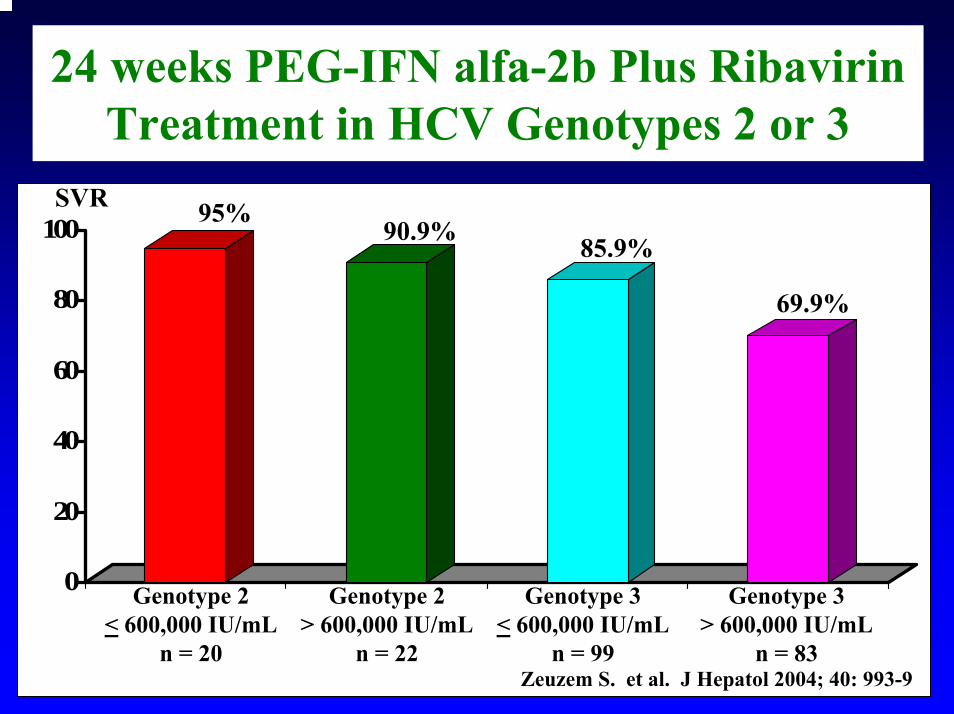
24 weeks PEG-IFN alfa-2b Plus Ribavirin Treatment in HCV Genotypes 2 or 3
0
20
40
60
80
100
All patients n = 224
Genotype 2 n = 42
Genotype 3 n = 182
SVR
81%93%
79%
Zeuzem S. et al. J Hepatol 2004; 40: 993-9

24 weeks PEG-IFN alfa-2b Plus Ribavirin Treatment in HCV Genotypes 2 or 3
0
20
40
60
80
100
Genotype 2 < 600,000 IU/mL
n = 20
SVR 95%90.9%
69.9%
Zeuzem S. et al. J Hepatol 2004; 40: 993-9
85.9%
Genotype 2 > 600,000 IU/mL
n = 22
Genotype 3 < 600,000 IU/mL
n = 99
Genotype 3 > 600,000 IU/mL
n = 83
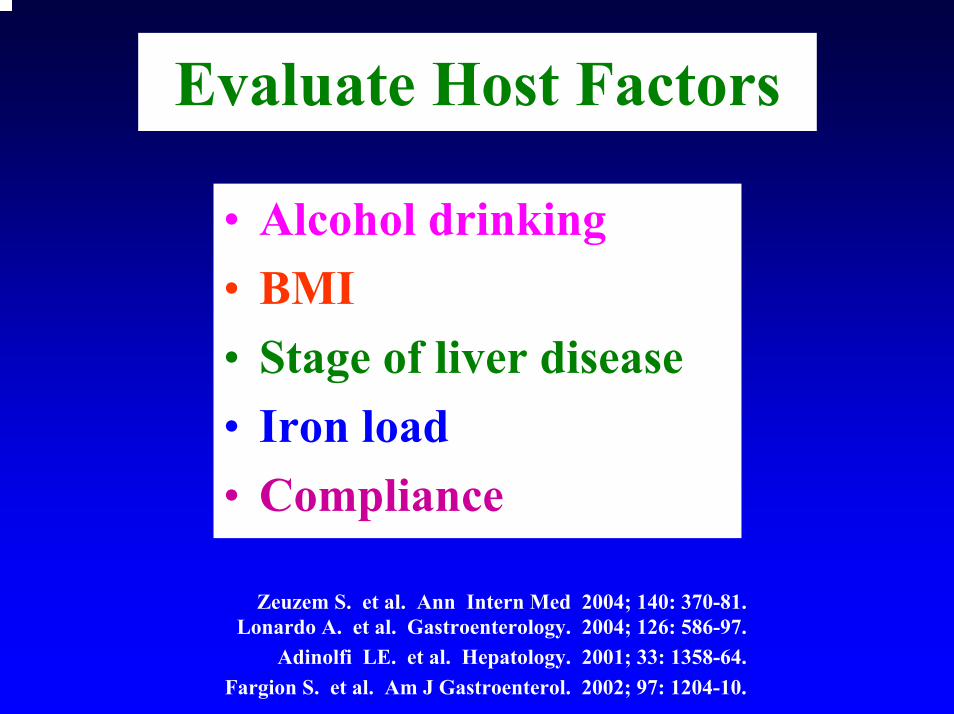
Evaluate Host Factors
• Alcohol drinking• BMI• Stage of liver disease• Iron load• Compliance
Zeuzem S. et al. Ann Intern Med 2004; 140: 370-81.Lonardo A. et al. Gastroenterology. 2004; 126: 586-97.
Adinolfi LE. et al. Hepatology. 2001; 33: 1358-64.Fargion S. et al. Am J Gastroenterol. 2002; 97: 1204-10.
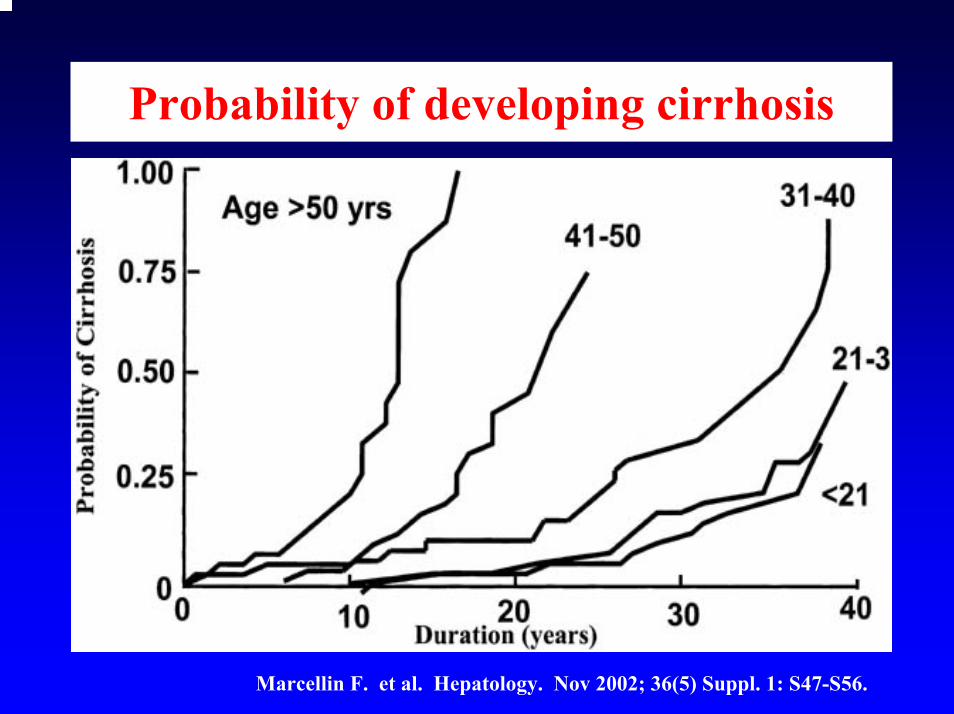
Probability of developing cirrhosis
Marcellin F. et al. Hepatology. Nov 2002; 36(5) Suppl. 1: S47-S56.
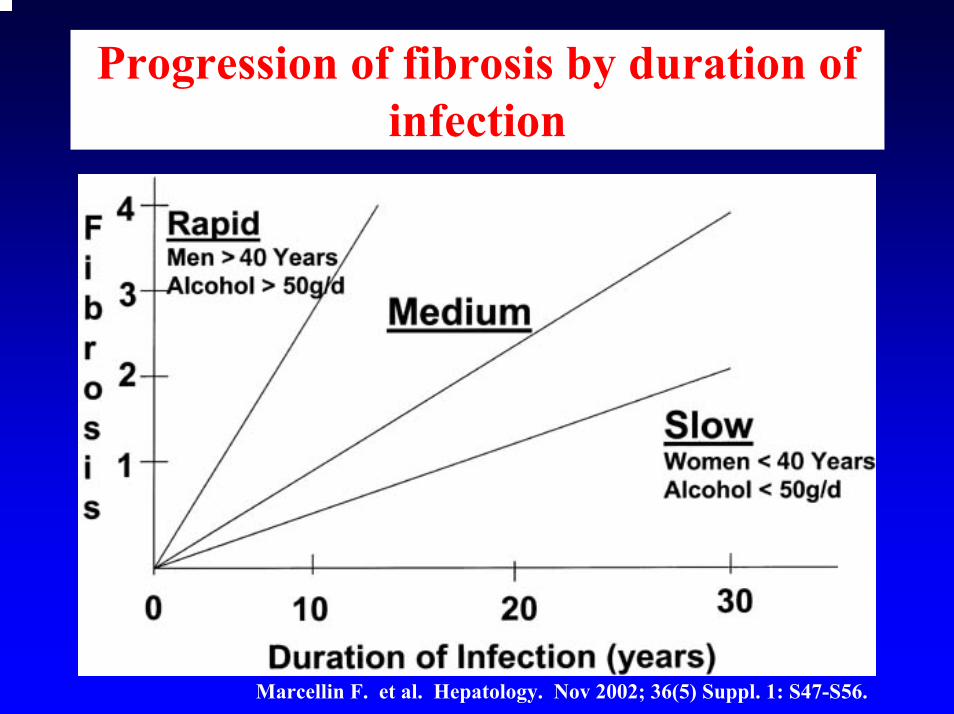
Progression of fibrosis by duration of infection
Marcellin F. et al. Hepatology. Nov 2002; 36(5) Suppl. 1: S47-S56.
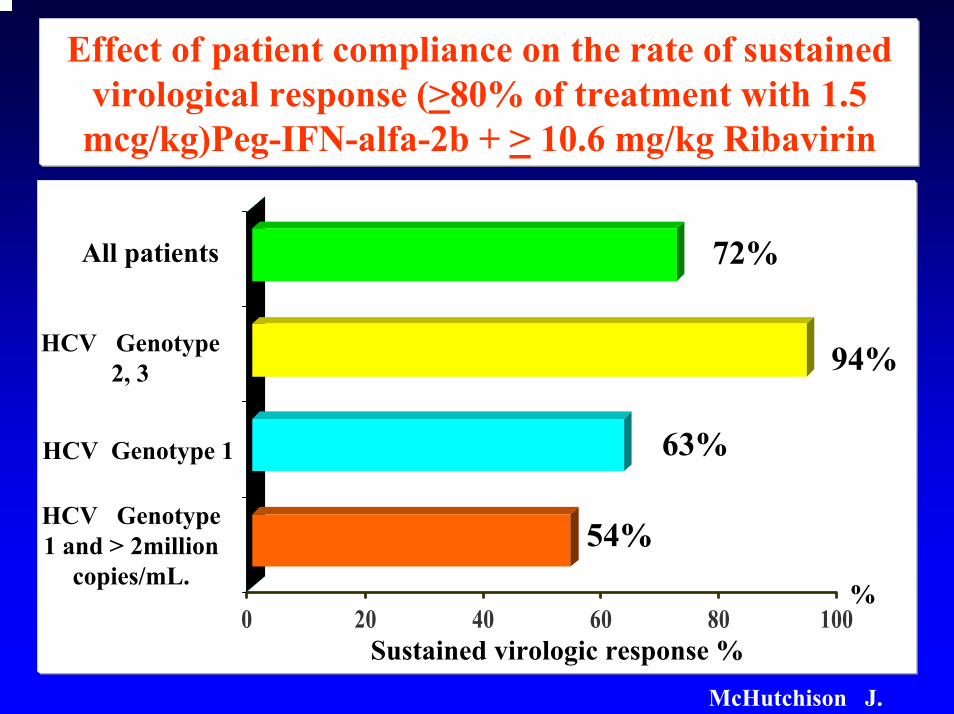
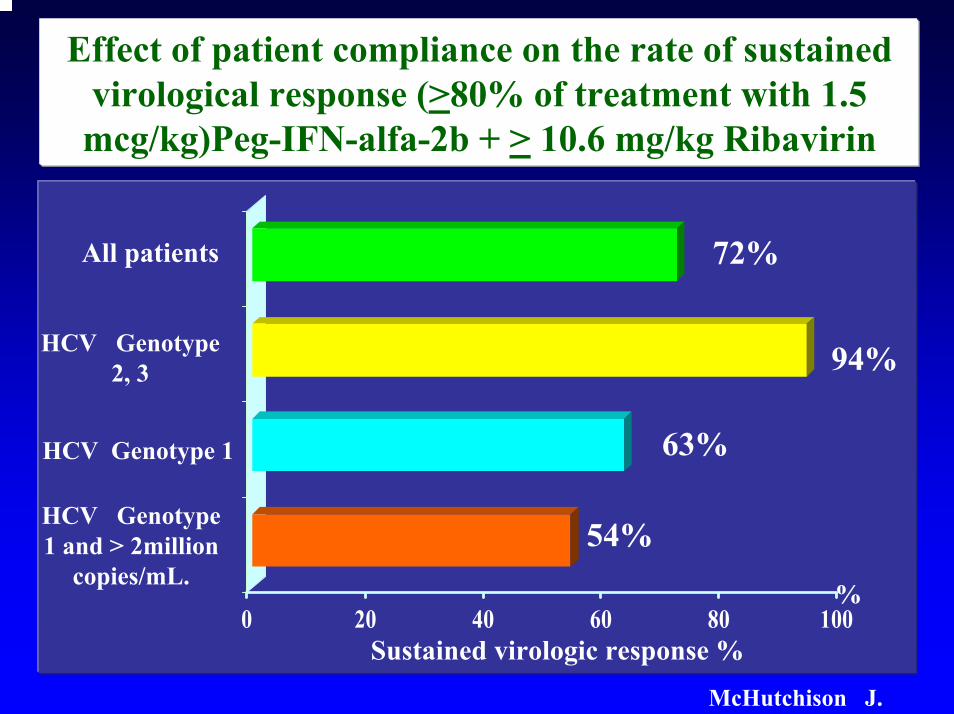
Effect of patient compliance on the rate of sustained virological response (>80% of treatment with 1.5
mcg/kg)Peg-IFN-alfa-2b + > 10.6 mg/kg Ribavirin
0 20 40 60 80 100
All patients
HCV Genotype 2, 3
Sustained virologic response %
63%
94%
72%
%
McHutchison J.
54%
HCV Genotype 1
HCV Genotype 1 and > 2million
copies/mL.
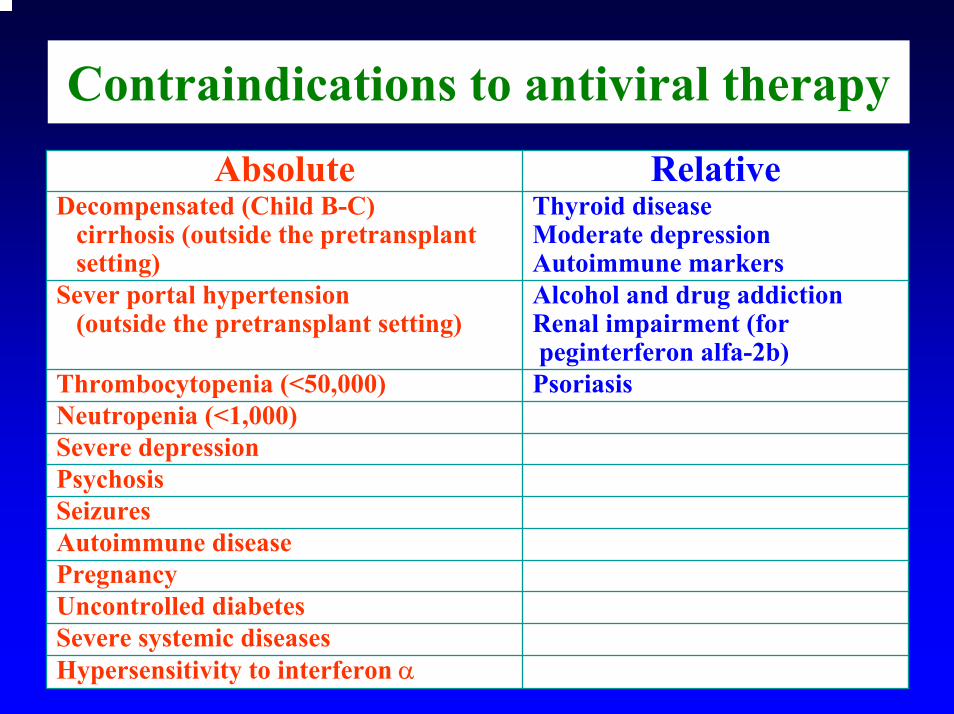
Contraindications to antiviral therapyAbsolute Relative
Decompensated (Child B-C) cirrhosis (outside the pretransplant setting)
Thyroid diseaseModerate depression Autoimmune markers
Sever portal hypertension (outside the pretransplant setting)
Alcohol and drug addiction Renal impairment (forpeginterferon alfa-2b)
Thrombocytopenia (<50,000) PsoriasisNeutropenia (<1,000)Severe depressionPsychosisSeizuresAutoimmune diseasePregnancyUncontrolled diabetesSevere systemic diseasesHypersensitivity to interferon α
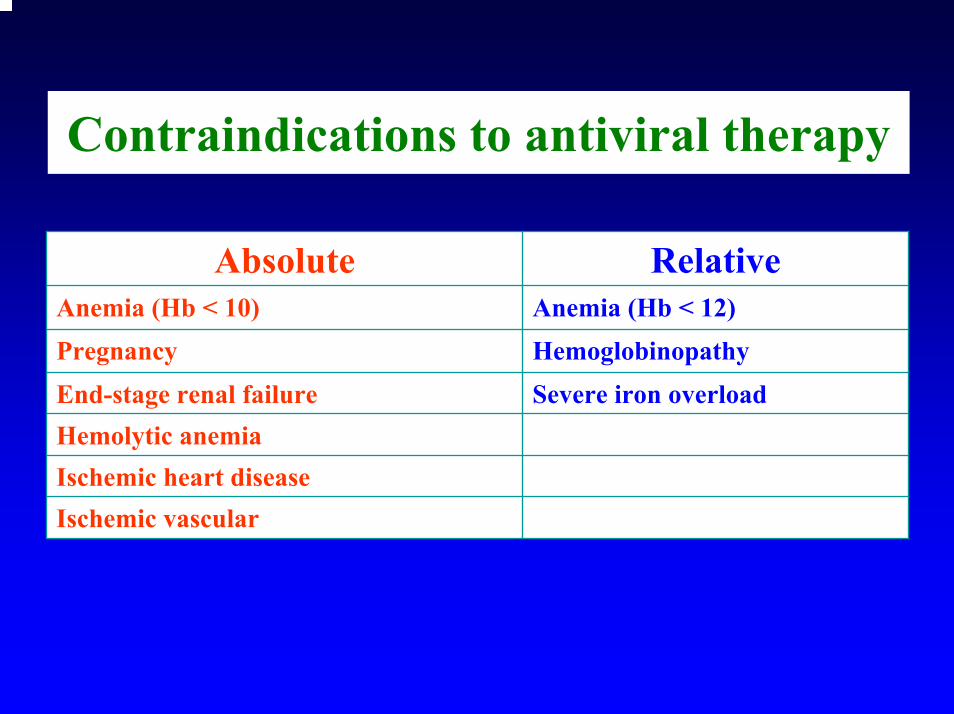
Contraindications to antiviral therapy
Absolute RelativeAnemia (Hb < 10) Anemia (Hb < 12)Pregnancy HemoglobinopathyEnd-stage renal failure Severe iron overloadHemolytic anemiaIschemic heart diseaseIschemic vascular
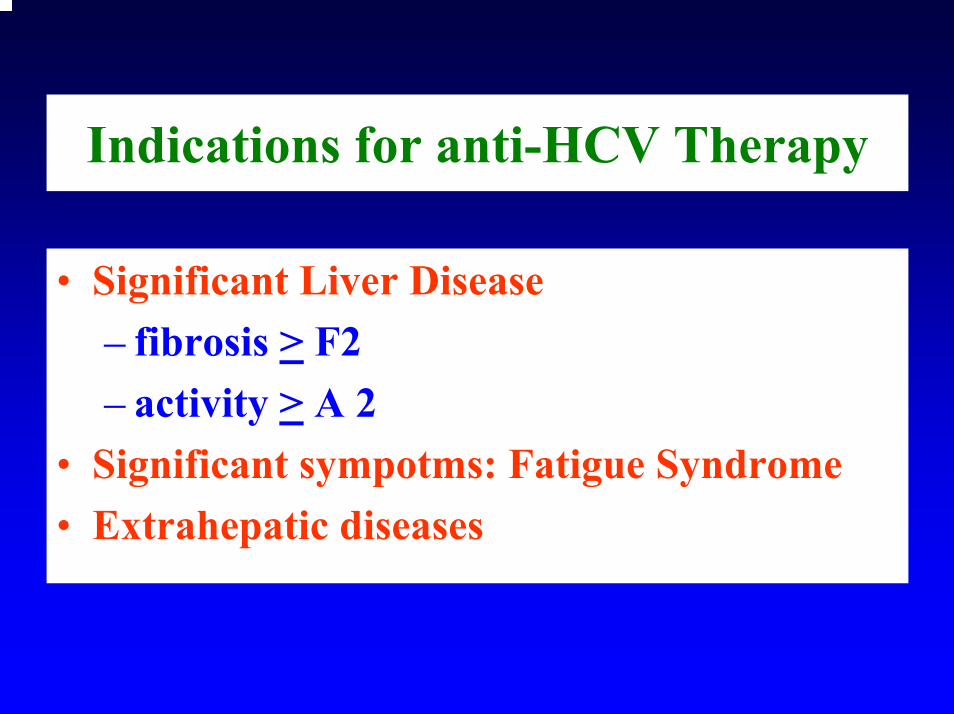
Indications for anti-HCV Therapy
• Significant Liver Disease– fibrosis > F2– activity > A 2
• Significant sympotms: Fatigue Syndrome• Extrahepatic diseases
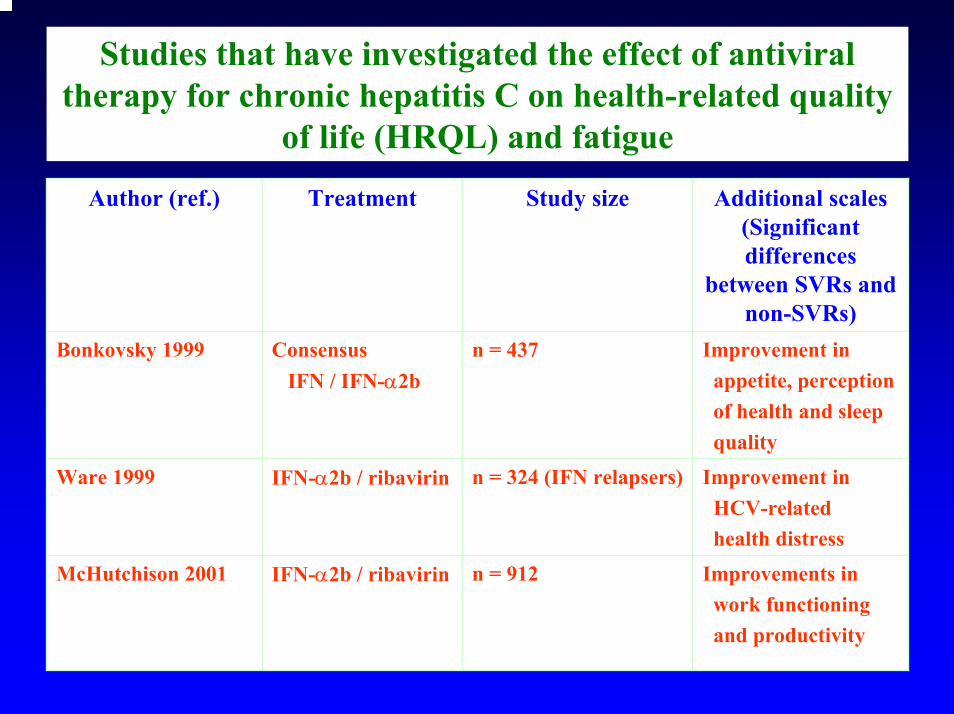
Studies that have investigated the effect of antiviral therapy for chronic hepatitis C on health-related quality
of life (HRQL) and fatigue
Author (ref.) Treatment Study size Additional scales (Significant differences
between SVRs and non-SVRs)
Bonkovsky 1999 ConsensusIFN / IFN-α2b
n = 437 Improvement in appetite, perception of health and sleep quality
Ware 1999 IFN-α2b / ribavirin n = 324 (IFN relapsers) Improvement in HCV-related health distress
McHutchison 2001 IFN-α2b / ribavirin n = 912 Improvements in work functioning and productivity
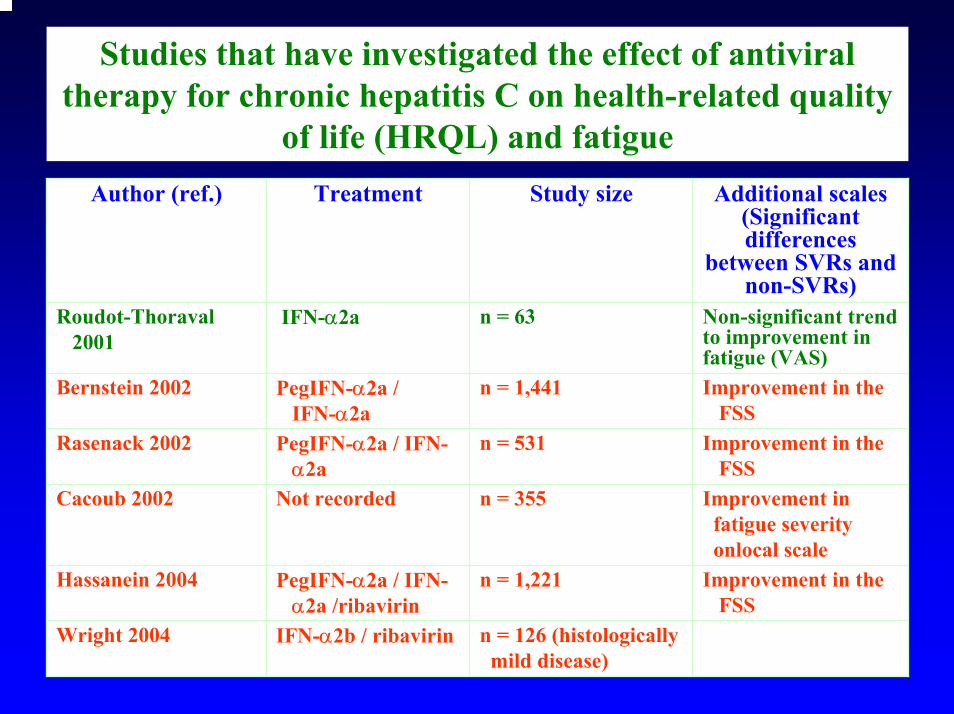
Studies that have investigated the effect of antiviral therapy for chronic hepatitis C on health-related quality
of life (HRQL) and fatigueAuthor (ref.) Treatment Study size Additional scales
(Significant differences
between SVRs and non-SVRs)
Roudot-Thoraval 2001
IFN-α2a n = 63 Non-significant trend to improvement in fatigue (VAS)
Bernstein 2002 PegIFN-α2a / IFN-α2a
n = 1,441 Improvement in the FSS
Rasenack 2002 PegIFN-α2a / IFN-α2a
n = 531 Improvement in the FSS
Cacoub 2002 Not recorded n = 355 Improvement in fatigue severity onlocal scale
Hassanein 2004 PegIFN-α2a / IFN-α2a /ribavirin
n = 1,221 Improvement in the FSS
Wright 2004 IFN-α2b / ribavirin n = 126 (histologically mild disease)

Rational for individualized care with Peg-Intron and Rebetol
Teerha Piratvisuth MD.Prince of Songkla University
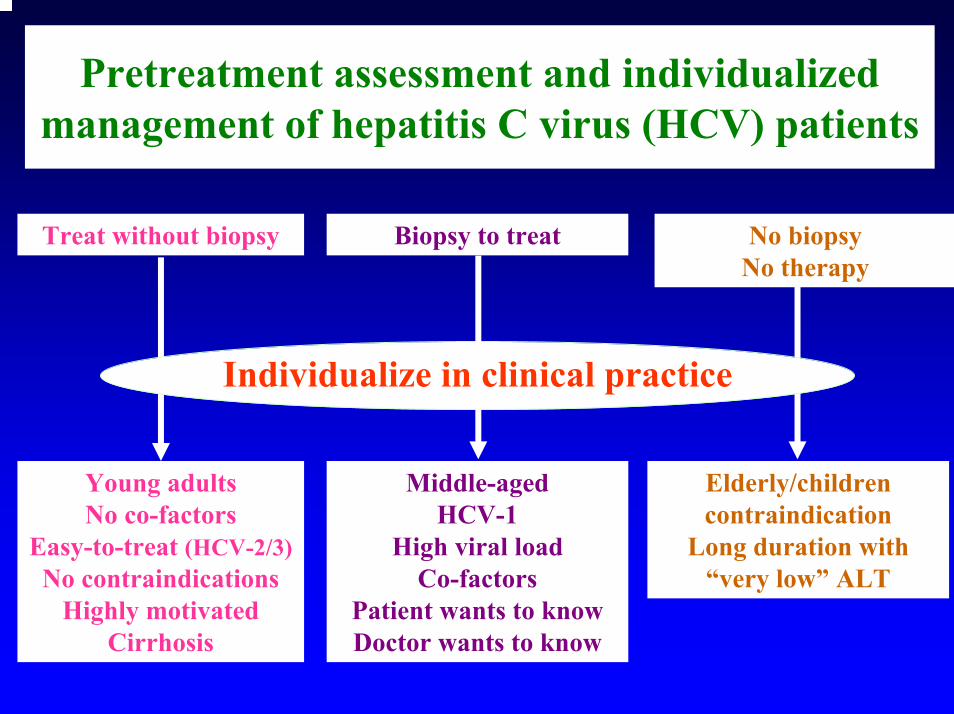
Pretreatment assessment and individualized management of hepatitis C virus (HCV) patients
Treat without biopsy Biopsy to treat No biopsy No therapy
Young adults No co-factors
Easy-to-treat (HCV-2/3)No contraindications
Highly motivated Cirrhosis
Middle-aged HCV-1
High viral load Co-factors
Patient wants to know Doctor wants to know
Elderly/children contraindication
Long duration with “very low” ALT
Individualize in clinical practice
PEG-IFN SVR in Patients With HCV Genotype 1
0
10
20
30
40
50SVR (%)
29
51
4041
24 Weeks 48 Weeks
n = 101 n = 118 n = 250 n = 271
RBV800 mg/day
RBV1000/1200 mg/day
RBV800 mg/day
RBV1000/1200 mg/day
PEG-IFN 180 mcg qw
Hadziyannis SJ. EASL Annual Meeting. 2002.
24 weeks PEG-IFN alfa-2b Plus Ribavirin Treatment in HCV Genotypes 2 or 3
0
20
40
60
80
100
Genotype 2 < 600,000 IU/mL
n = 20
SVR 95%90.9%
69.9%
Zeuzem S. et al. J Hepatol 2004; 40: 993-9
85.9%
Genotype 2 > 600,000 IU/mL
n = 22
Genotype 3 < 600,000 IU/mL
n = 99
Genotype 3 > 600,000 IU/mL
n = 83
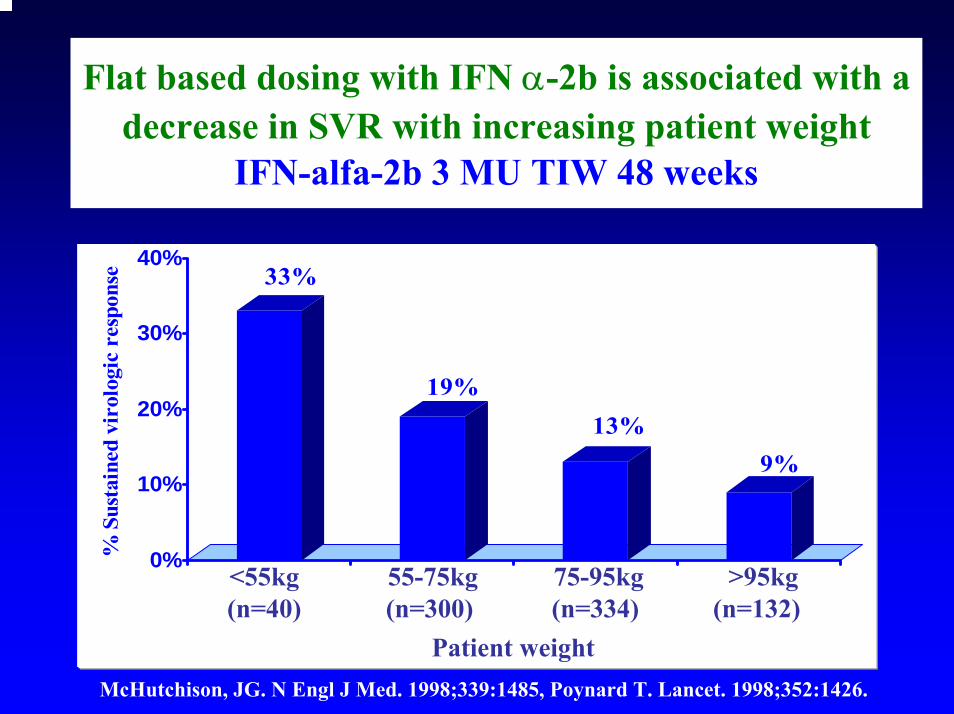
Flat based dosing with IFN α-2b is associated with a decrease in SVR with increasing patient weight
IFN-alfa-2b 3 MU TIW 48 weeks
33%
19%13%
9%
0%
10%
20%
30%
40%
% S
usta
ined
vir
olog
ic r
espo
nse
McHutchison, JG. N Engl J Med. 1998;339:1485, Poynard T. Lancet. 1998;352:1426.
<55kg(n=40)
55-75kg (n=300)
75-95kg (n=334)
>95kg (n=132)
Patient weight
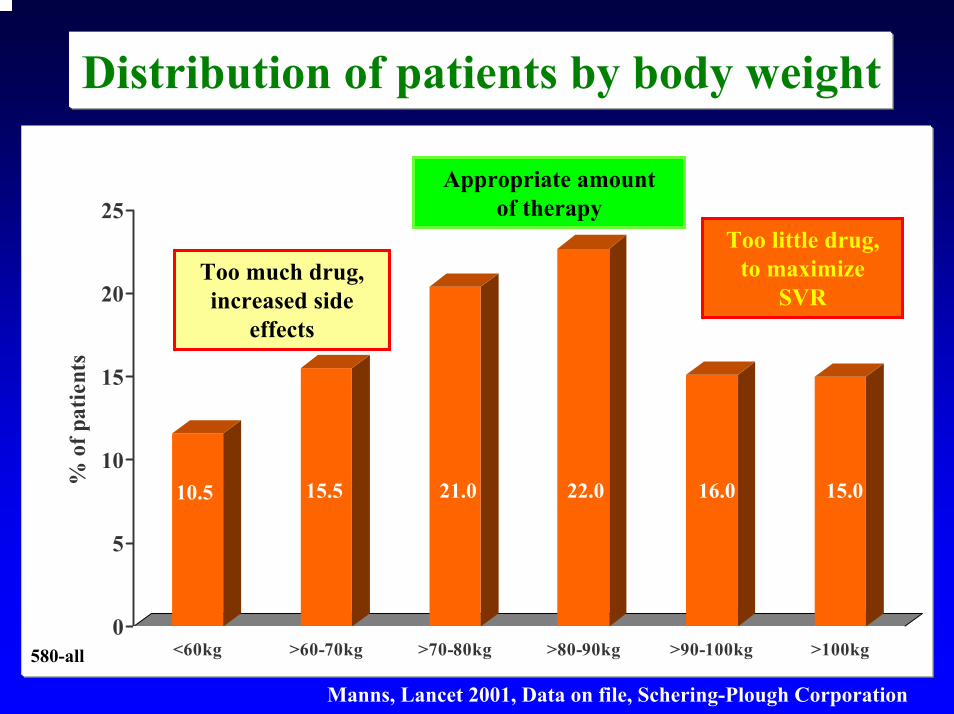
Distribution of patients by body weight
0
5
10
15
20
25
% o
f pat
ient
s
<60kg >60-70kg >70-80kg >80-90kg >90-100kg >100kg580-all
10.5 15.5 21.0 22.0 16.0 15.0
Manns, Lancet 2001, Data on file, Schering-Plough Corporation
Too little drug, to maximize
SVRToo much drug, increased side
effects
Appropriate amount of therapy
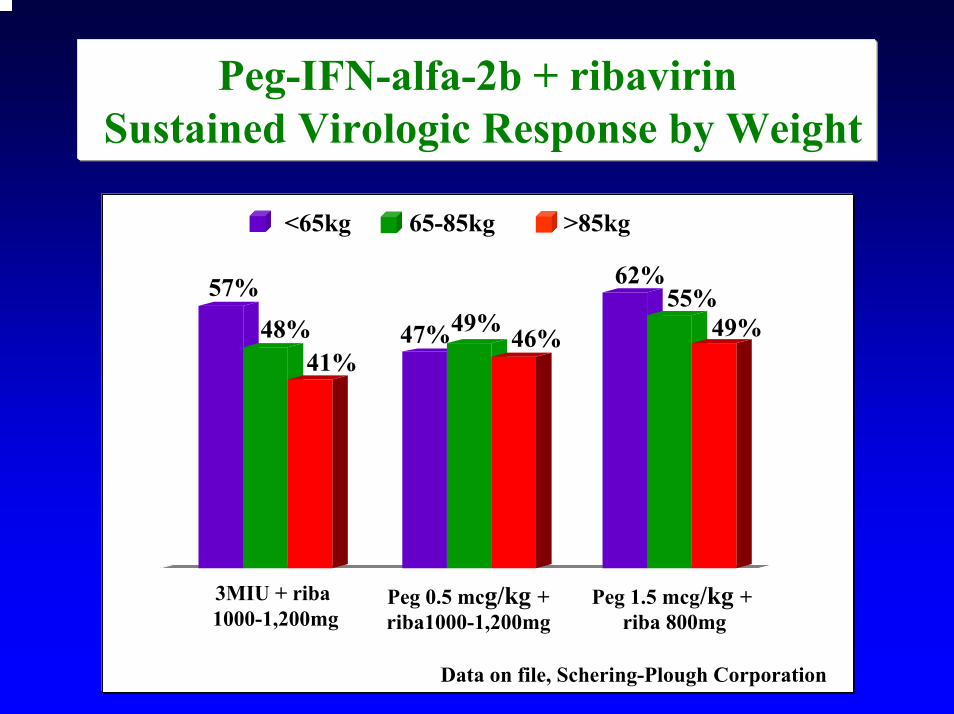
Peg-IFN-alfa-2b + ribavirinSustained Virologic Response by Weight
57%
48%41%
3MIU + riba1000-1,200mg
47%49% 46%
Peg 0.5 mcg/kg +riba1000-1,200mg
62%55%
49%
Peg 1.5 mcg/kg +riba 800mg
<65kg 65-85kg >85kg
Data on file, Schering-Plough Corporation
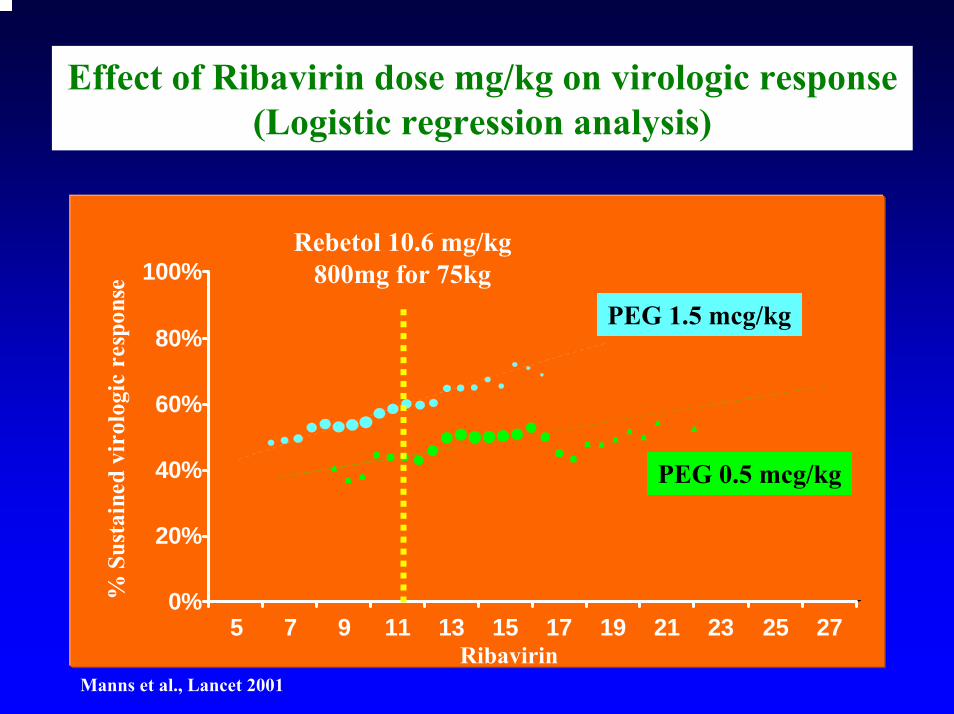
Effect of Ribavirin dose mg/kg on virologic response(Logistic regression analysis)
0%
20%
40%
60%
80%
100%
% S
usta
ined
vir
olog
ic r
espo
nse
5 7 9 11 13 15 17 19 21 23 25 27Ribavirin
PEG 0.5 mcg/kg
PEG 1.5 mcg/kg
Manns et al., Lancet 2001
Rebetol 10.6 mg/kg800mg for 75kg
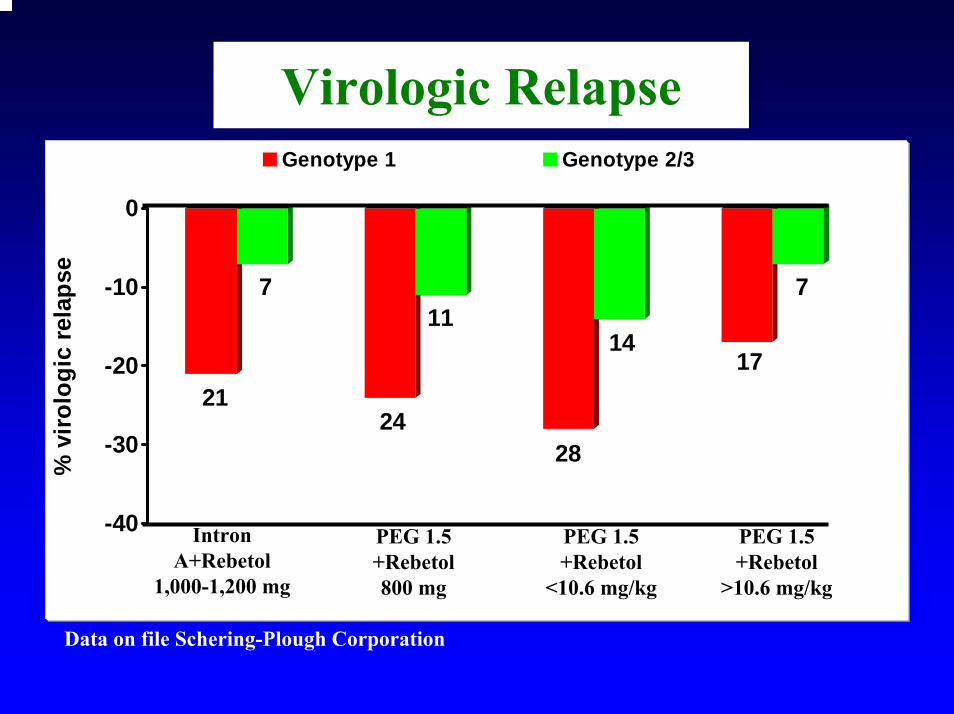
Virologic Relapse
21
7
24
11
28
1417
7
-40
-30
-20
-10
0
% v
irolo
gic
rela
pse
Genotype 1 Genotype 2/3
Data on file Schering-Plough Corporation
Intron A+Rebetol
1,000-1,200 mg
PEG 1.5 +Rebetol800 mg
PEG 1.5 +Rebetol
<10.6 mg/kg
PEG 1.5 +Rebetol
>10.6 mg/kg
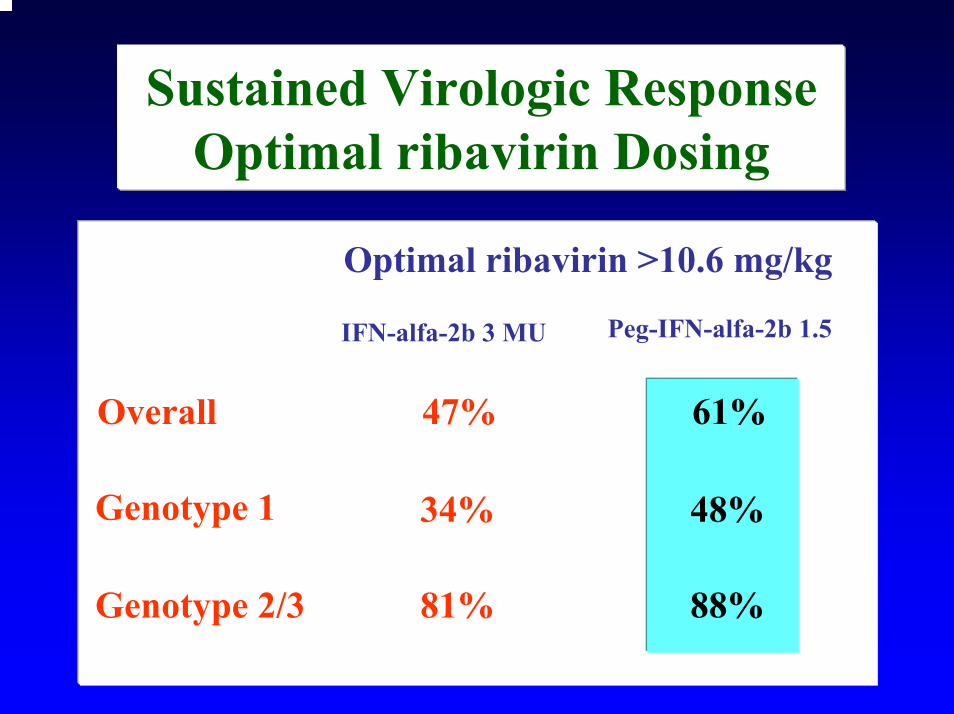
Sustained Virologic ResponseOptimal ribavirin Dosing
88%81%Genotype 2/3
48%34%Genotype 1
IFN-alfa-2b 3 MU Peg-IFN-alfa-2b 1.5
61%47%Overall
Optimal ribavirin >10.6 mg/kg
Effect of patient compliance on the rate of sustained virological response (>80% of treatment with 1.5
mcg/kg)Peg-IFN-alfa-2b + > 10.6 mg/kg Ribavirin
0 20 40 60 80 100
All patients
HCV Genotype 2, 3
Sustained virologic response %
63%
94%
72%
%
McHutchison J.
54%
HCV Genotype 1
HCV Genotype 1 and > 2million
copies/mL.
Rationale for Using Early Viral Response Endpoint
Drawbacks of Antiviral Therapy• Only half respond• Difficult to tolerate• Requires close monitoring • Expensive
Thus, identifying those with the greatest chance of benefiting (or not) from therapy is desirable
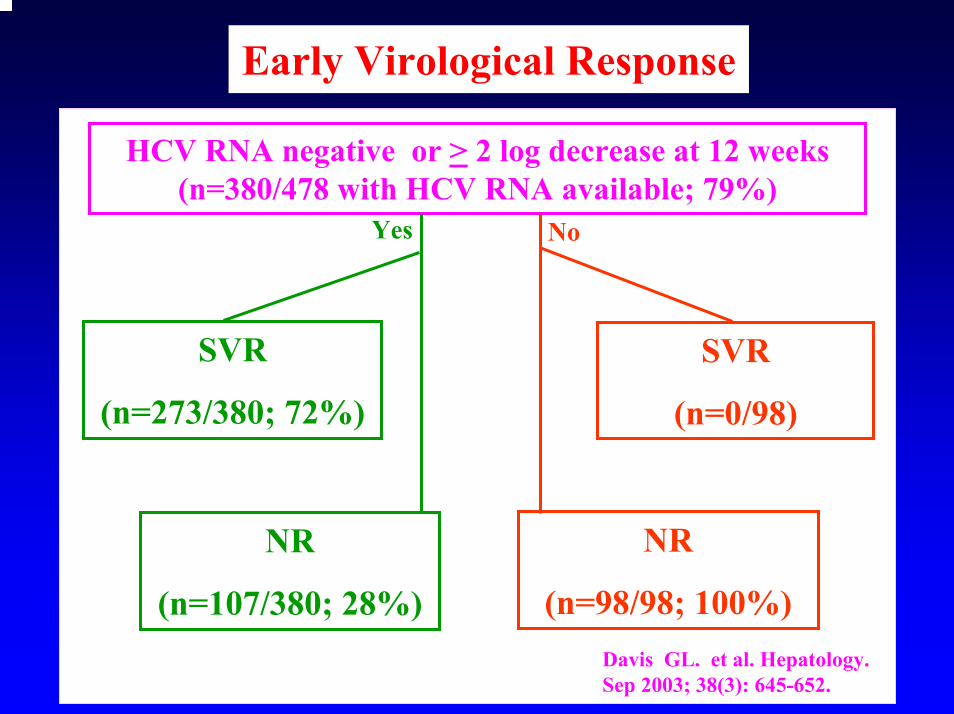
HCV RNA negative or > 2 log decrease at 12 weeks (n=380/478 with HCV RNA available; 79%)
SVR
(n=273/380; 72%)
SVR
(n=0/98)
NR
(n=107/380; 28%)
NR
(n=98/98; 100%)Davis GL. et al. Hepatology. Sep 2003; 38(3): 645-652.
Yes No
Early Virological Response
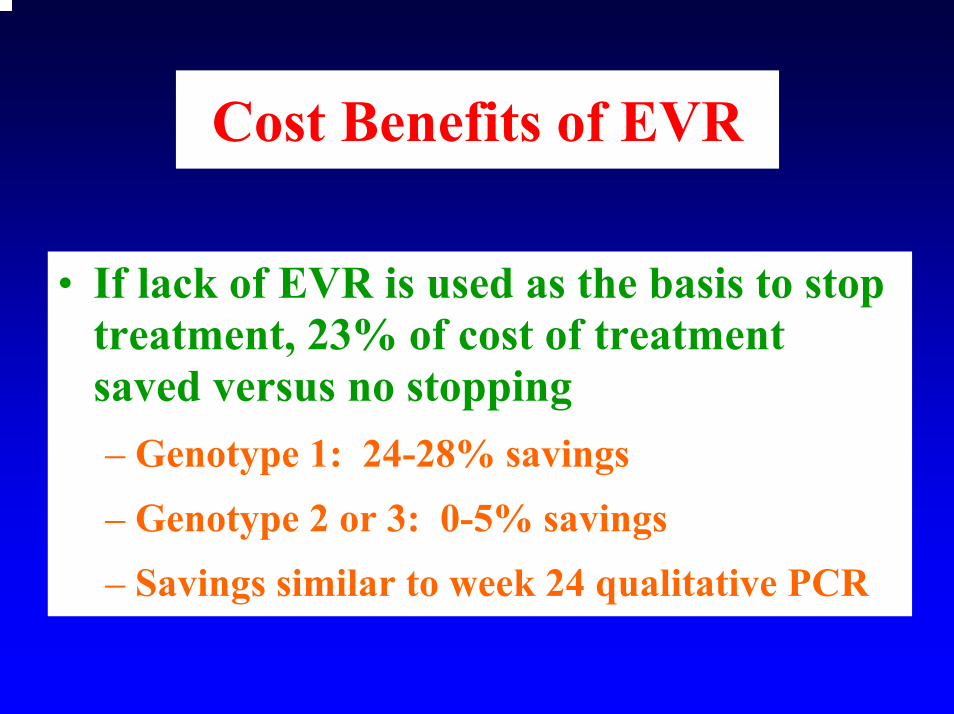
Cost Benefits of EVR
• If lack of EVR is used as the basis to stop treatment, 23% of cost of treatment saved versus no stopping– Genotype 1: 24-28% savings – Genotype 2 or 3: 0-5% savings – Savings similar to week 24 qualitative PCR
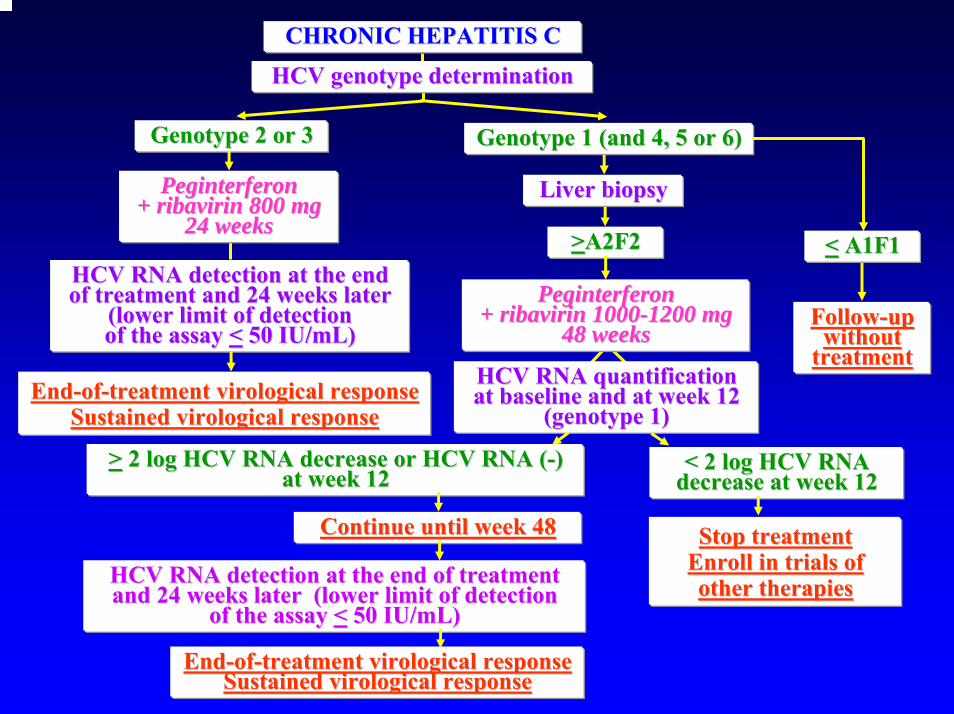
Genotype 2 or 3Genotype 2 or 3 Genotype 1 (and 4, 5 or 6)Genotype 1 (and 4, 5 or 6)
Liver biopsyLiver biopsy
HCV RNA detection at the end HCV RNA detection at the end of treatment and 24 weeks later of treatment and 24 weeks later
(lower limit of detection (lower limit of detection of the assay of the assay << 50 IU/50 IU/mLmL))
>>A2F2A2F2
EndEnd--ofof--treatment treatment virologicalvirological response response Sustained Sustained virologicalvirological responseresponse
HCV RNA quantification HCV RNA quantification at baseline and at week 12 at baseline and at week 12
(genotype 1)(genotype 1)
>> 2 log HCV RNA decrease or HCV RNA (2 log HCV RNA decrease or HCV RNA (--) ) at week 12at week 12
< 2 log HCV RNA < 2 log HCV RNA decrease at week 12decrease at week 12
Continue until week 48Continue until week 48 Stop treatment Stop treatment Enroll in trials of Enroll in trials of other therapiesother therapies
EndEnd--ofof--treatment treatment virologicalvirological response response Sustained Sustained virologicalvirological responseresponse
FollowFollow--up up without without
treatmenttreatment
<< A1F1A1F1
Peginterferon Peginterferon + ribavirin 800 mg + ribavirin 800 mg
24 weeks24 weeks
Peginterferon Peginterferon + ribavirin 1000+ ribavirin 1000--1200 mg 1200 mg
48 weeks48 weeks
HCV RNA detection at the end of treatment HCV RNA detection at the end of treatment and 24 weeks later (lower limit of detection and 24 weeks later (lower limit of detection
of the assay of the assay << 50 IU/50 IU/mLmL))
CHRONIC HEPATITIS CCHRONIC HEPATITIS C
HCV genotype determinationHCV genotype determination
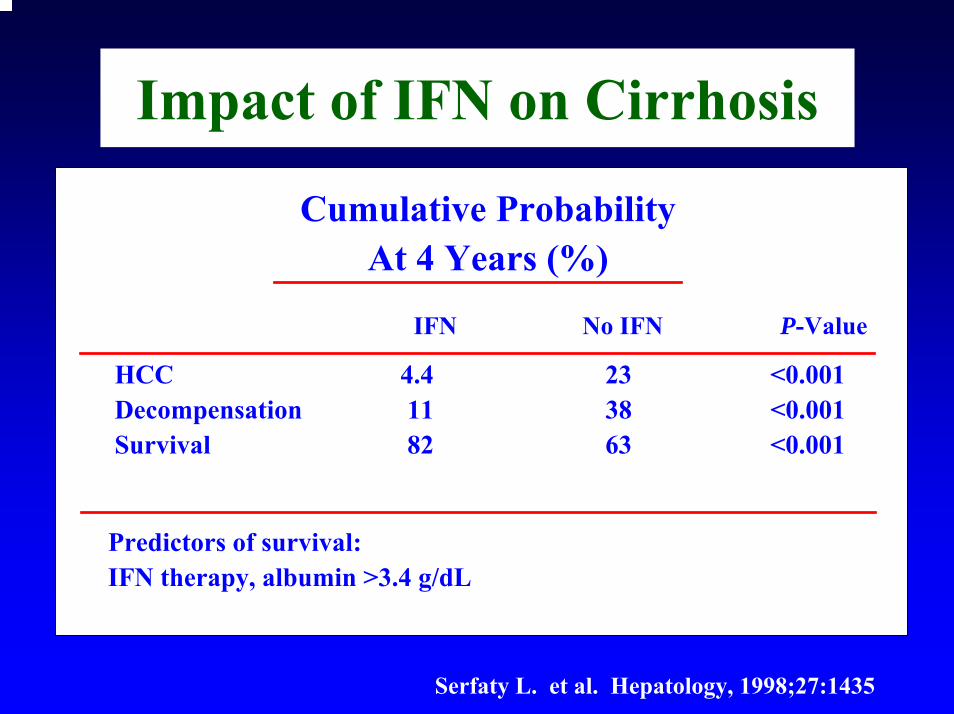
Impact of IFN on Cirrhosis
Serfaty L. et al. Hepatology, 1998;27:1435
Cumulative ProbabilityAt 4 Years (%)
IFN No IFN P-Value
HCC 4.4 23 <0.001Decompensation 11 38 <0.001Survival 82 63 <0.001
Predictors of survival:IFN therapy, albumin >3.4 g/dL
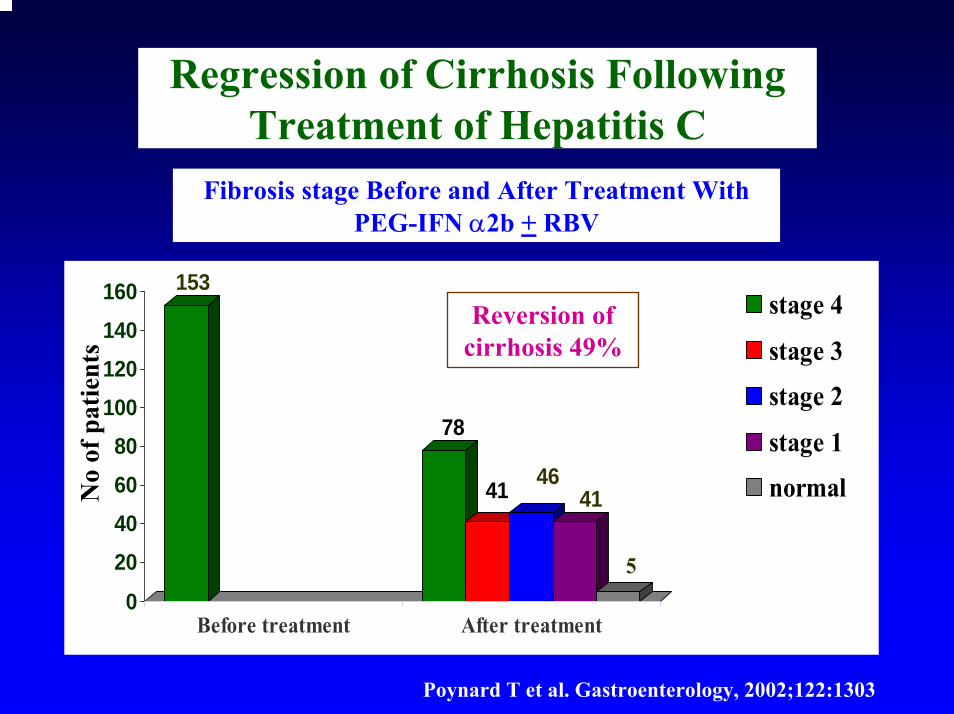
Regression of Cirrhosis Following Treatment of Hepatitis C
Poynard T et al. Gastroenterology, 2002;122:1303
153
78
41 4641
50
20406080
100120140160
Before treatment After treatment
stage 4
stage 3
stage 2
stage 1
normal
Fibrosis stage Before and After Treatment With PEG-IFN α2b + RBV
No
of p
atie
nts
Reversion of cirrhosis 49%
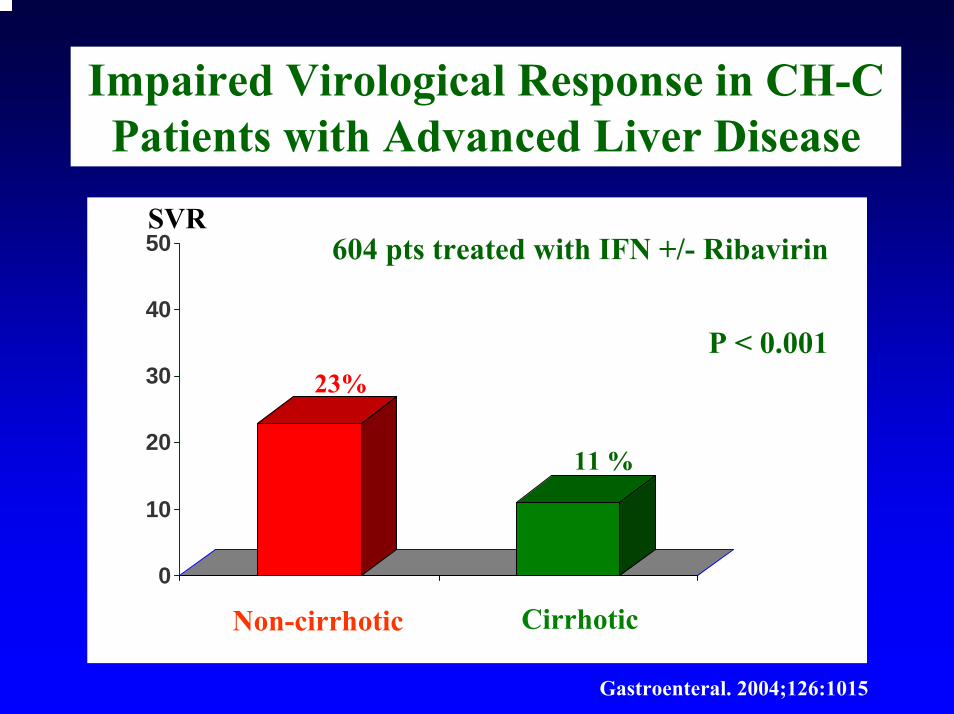
Impaired Virological Response in CH-C Patients with Advanced Liver Disease
Gastroenteral. 2004;126:1015
0
10
20
30
40
50
Non-cirrhotic
23%
11 %
604 pts treated with IFN +/- Ribavirin
P < 0.001
Cirrhotic
SVR
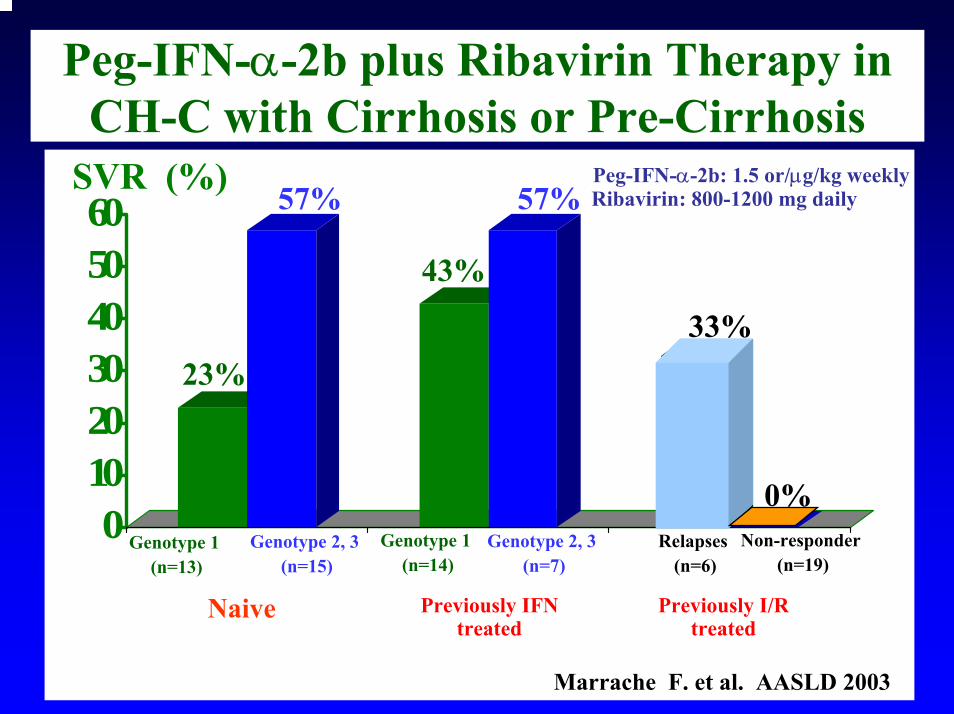
Peg-IFN-α-2b plus Ribavirin Therapy in CH-C with Cirrhosis or Pre-Cirrhosis
0102030405060
SVR (%)
23%
Genotype 1(n=13)
Marrache F. et al. AASLD 2003
57%
43%
57%
33%
0%Genotype 2, 3
(n=15)Genotype 1
(n=14)Genotype 2, 3
(n=7)Relapses
(n=6)Non-responder
(n=19)
Peg-IFN-α-2b: 1.5 or/µg/kg weeklyRibavirin: 800-1200 mg daily
Previously IFN treated
Previously I/R treated
Naive
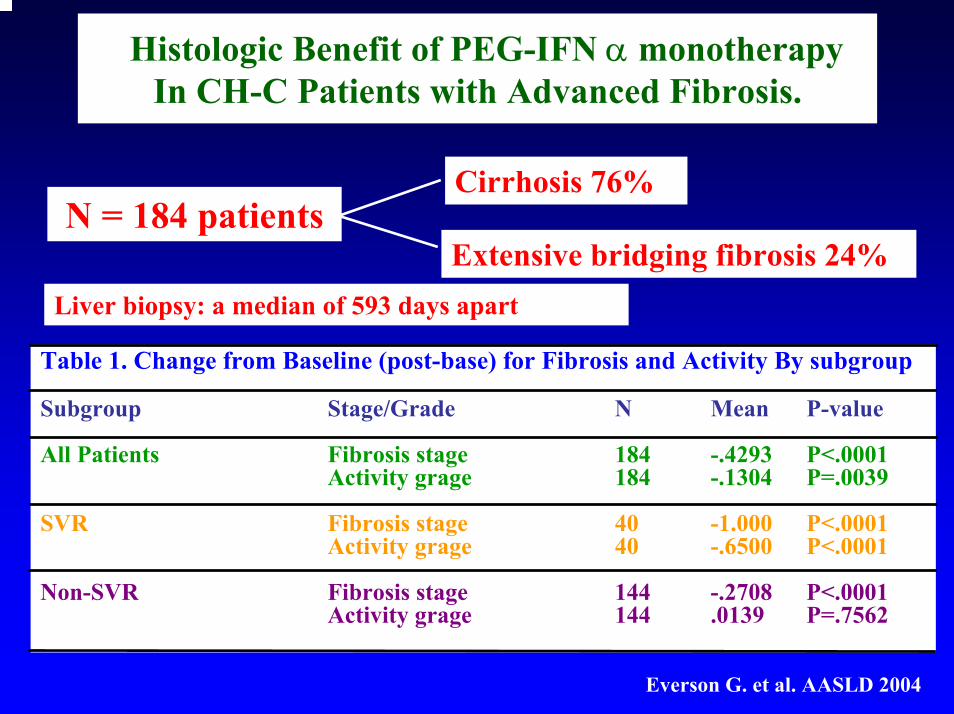
Histologic Benefit of PEG-IFN α monotherapyIn CH-C Patients with Advanced Fibrosis.
Everson G. et al. AASLD 2004
N = 184 patientsCirrhosis 76%
Extensive bridging fibrosis 24%
Table 1. Change from Baseline (post-base) for Fibrosis and Activity By subgroup
Subgroup Stage/Grade N Mean P-value
All Patients Fibrosis stage 184 -.4293 P<.0001Activity grage 184 -.1304 P=.0039
SVR Fibrosis stage 40 -1.000 P<.0001Activity grage 40 -.6500 P<.0001
Non-SVR Fibrosis stage 144 -.2708 P<.0001Activity grage 144 .0139 P=.7562
Liver biopsy: a median of 593 days apart
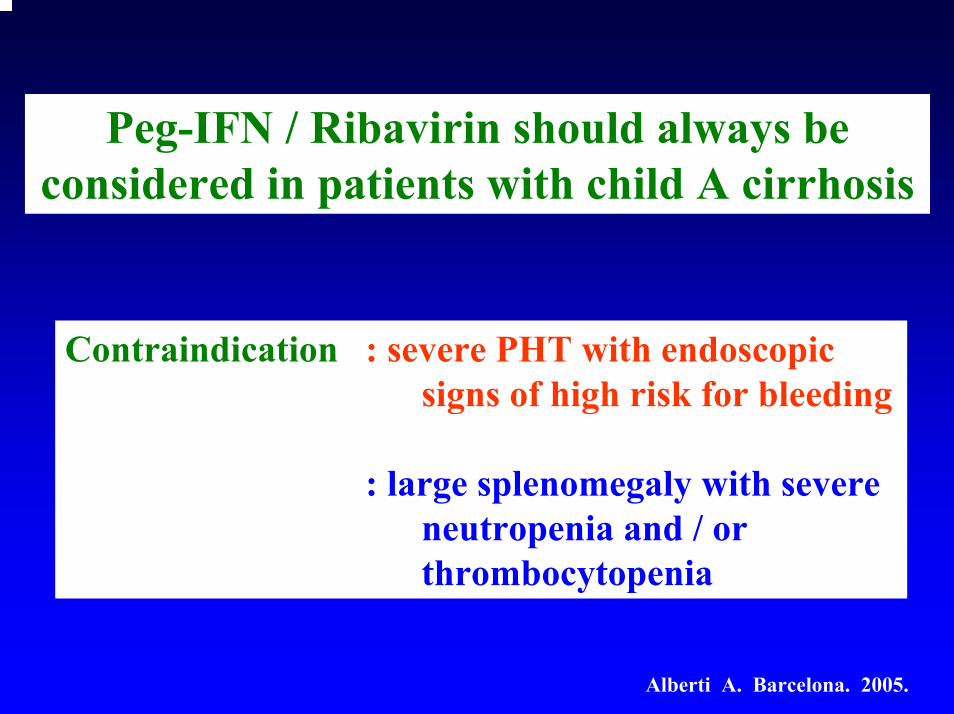
Peg-IFN / Ribavirin should always be considered in patients with child A cirrhosis
Contraindication : severe PHT with endoscopic signs of high risk for bleeding
: large splenomegaly with severe neutropenia and / or thrombocytopenia
Alberti A. Barcelona. 2005.