Embed Size (px)
Citation preview
The Andorra Glaciated Valley
Setting
The Principality of Andorra is a little county (465km2) located between France and Spain (42°30’N,1°30’E), at the foothills of the SE Pyrenees. The trib-utary valley system has an “Y” shape and at the Up-per Pleistocene different glaciers came together(Turu et al. 2007) to the main valley, where actuallyis locate the biggest city (Andorra la Vella) of An-dorra. Understanding the stratigraphy of the glacialloaded sediments of Andorra is particularly impor-tant for civil engineers (Turu 2000). Glacial sedi-ments produced during Quaternary glacial periodsare widespread in both mountainous and lowlandzones and influence many construction projects.One of the characteristics of such sediments is thegreat variability and unpredictability of the consoli-dation state and accurately geotechnical and geo-physical surveys are needed.
Geomechanical data, pressuremeter tests
Intensive investigations of the architecture andcharacter of valley floor sediments have been under-taken in the main Valley, in association with site in-vestigations for major constructions until 1995 (seeTuru et al. 2007) with up to 900 geotechnical surveysin the country.
The conclusion of all those surveying years is thatthe best geotechnical data to obtain the stress/strain
behaviour of glaciated sediments are pressuremetertests data.
The theoretical basis for this test was provided byMénard and Baguelin et al. (1978) who also createda commercial design. Interpretation procedures aredescribed by AFNOR (1999, 2000). In this test,a pneumatic cell, with flexible walls in a metallic slot-ted-tube is pushed into a pre-existing bore-hole. Thispush-in technique (Reid et al. 1982; Fiffle et al. 1985)reduces possible soil disturbances. A hydro-pneu-matic system controls cell pressure, and expandingcell walls exert a horizontal stress on the bore-holewalls, whose deformation is concurrently measuredby the expansion of the cell wall. Once the test isended the pneumatic cell and the slotted-tube are ex-tracted, cleaned, eventually repaired and calibrated.
Basically, when a certain pressure threshold is ex-ceeded, volume expansion of the pneumatic cell in-creases rapidly, marking the change from elastic toplastic soil behaviour.
Rheological interpretation is based on the as-sumption of radial expansion of a cylindrical form inan isotopic elasto-plastic medium (Cassan 1982),and the test also yields the Young’s modulus of thesoil for a given value of Poisson ratio.
Stress/Strain analysis, the pressuremeter data
The most relevant data obtained will be synthe-sised in this paper without taking into account theirgeological setting, specifically data obtained frompressuremeter tests.
89
Landform Analysis, Vol. 5: 89–94 (2007)
Pressuremeter test in glaciated valley sediments(Andorra, Southern Pyrenees)
Part one: An improved approach to their geomechanicalbehaviour
Valenti Turu*
Igeotest SL, Marcel Chevalier Foundation Project, Andorra la Vella, Principality of Andorra
* e-mail: [email protected]
As previously stated, this test has been performedin bore-holes, introducing the cell at depths between5 and 25 meters which, in the best case scenario, im-plies ground pressures acquired according to a gravi-tational gradient between 0.1 to 0.5 MPa. However,with pressuremeter tests, overconsolidation pres-sures up to ten times greater than these have beenobtained, implying that glacial sediments may bestrongly consolidated.
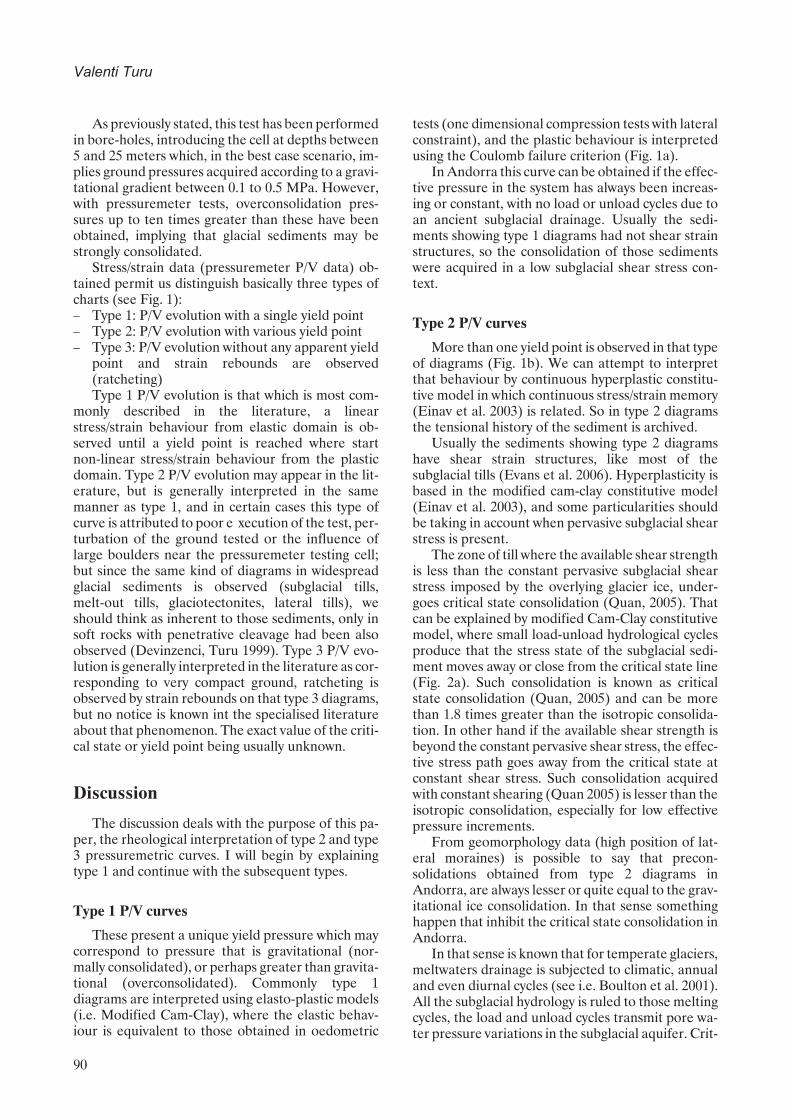
Stress/strain data (pressuremeter P/V data) ob-tained permit us distinguish basically three types ofcharts (see Fig. 1):– Type 1: P/V evolution with a single yield point– Type 2: P/V evolution with various yield point– Type 3: P/V evolution without any apparent yield
point and strain rebounds are observed(ratcheting)Type 1 P/V evolution is that which is most com-
monly described in the literature, a linearstress/strain behaviour from elastic domain is ob-served until a yield point is reached where startnon-linear stress/strain behaviour from the plasticdomain. Type 2 P/V evolution may appear in the lit-erature, but is generally interpreted in the samemanner as type 1, and in certain cases this type ofcurve is attributed to poor e xecution of the test, per-turbation of the ground tested or the influence oflarge boulders near the pressuremeter testing cell;but since the same kind of diagrams in widespreadglacial sediments is observed (subglacial tills,melt-out tills, glaciotectonites, lateral tills), weshould think as inherent to those sediments, only insoft rocks with penetrative cleavage had been alsoobserved (Devinzenci, Turu 1999). Type 3 P/V evo-lution is generally interpreted in the literature as cor-responding to very compact ground, ratcheting isobserved by strain rebounds on that type 3 diagrams,but no notice is known int the specialised literatureabout that phenomenon. The exact value of the criti-cal state or yield point being usually unknown.
Discussion
The discussion deals with the purpose of this pa-per, the rheological interpretation of type 2 and type3 pressuremetric curves. I will begin by explainingtype 1 and continue with the subsequent types.
Type 1 P/V curves
These present a unique yield pressure which maycorrespond to pressure that is gravitational (nor-mally consolidated), or perhaps greater than gravita-tional (overconsolidated). Commonly type 1diagrams are interpreted using elasto-plastic models(i.e. Modified Cam-Clay), where the elastic behav-iour is equivalent to those obtained in oedometric
tests (one dimensional compression tests with lateralconstraint), and the plastic behaviour is interpretedusing the Coulomb failure criterion (Fig. 1a).
In Andorra this curve can be obtained if the effec-tive pressure in the system has always been increas-ing or constant, with no load or unload cycles due toan ancient subglacial drainage. Usually the sedi-ments showing type 1 diagrams had not shear strainstructures, so the consolidation of those sedimentswere acquired in a low subglacial shear stress con-text.
Type 2 P/V curves
More than one yield point is observed in that typeof diagrams (Fig. 1b). We can attempt to interpretthat behaviour by continuous hyperplastic constitu-tive model in which continuous stress/strain memory(Einav et al. 2003) is related. So in type 2 diagramsthe tensional history of the sediment is archived.
Usually the sediments showing type 2 diagramshave shear strain structures, like most of thesubglacial tills (Evans et al. 2006). Hyperplasticity isbased in the modified cam-clay constitutive model(Einav et al. 2003), and some particularities shouldbe taking in account when pervasive subglacial shearstress is present.
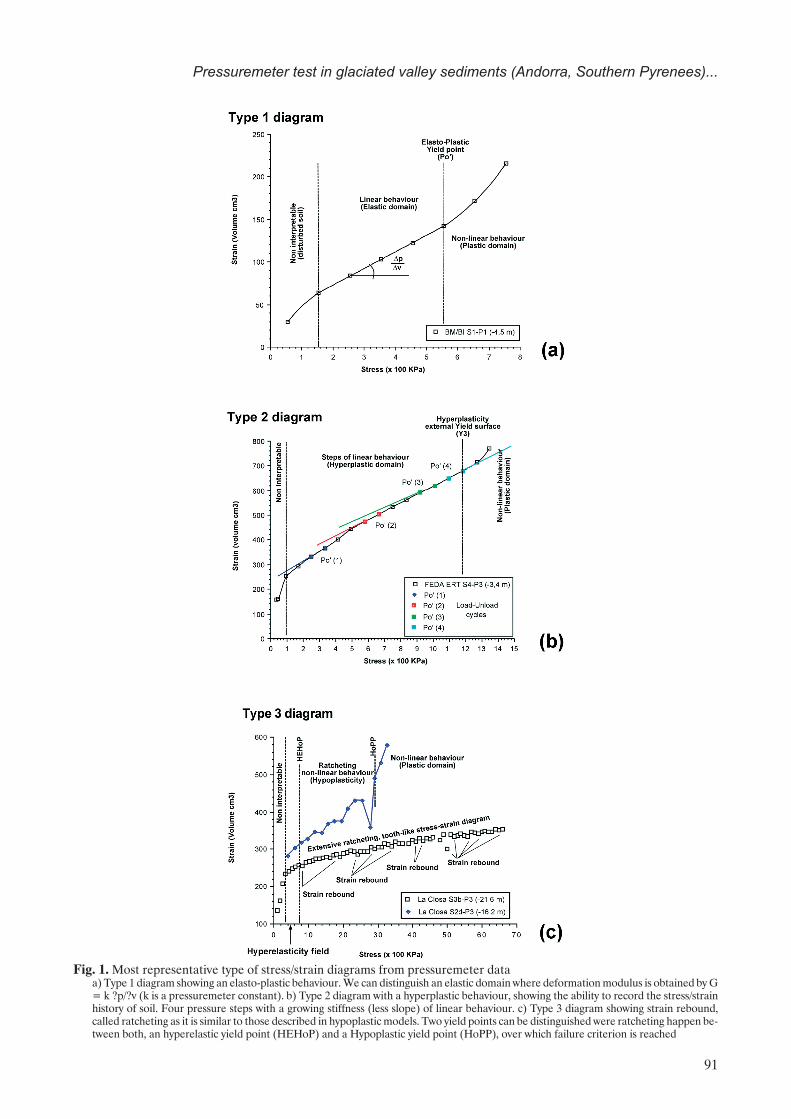
The zone of till where the available shear strengthis less than the constant pervasive subglacial shearstress imposed by the overlying glacier ice, under-goes critical state consolidation (Quan, 2005). Thatcan be explained by modified Cam-Clay constitutivemodel, where small load-unload hydrological cyclesproduce that the stress state of the subglacial sedi-ment moves away or close from the critical state line(Fig. 2a). Such consolidation is known as criticalstate consolidation (Quan, 2005) and can be morethan 1.8 times greater than the isotropic consolida-tion. In other hand if the available shear strength isbeyond the constant pervasive shear stress, the effec-tive stress path goes away from the critical state atconstant shear stress. Such consolidation acquiredwith constant shearing (Quan 2005) is lesser than theisotropic consolidation, especially for low effectivepressure increments.
From geomorphology data (high position of lat-eral moraines) is possible to say that precon-solidations obtained from type 2 diagrams inAndorra, are always lesser or quite equal to the grav-itational ice consolidation. In that sense somethinghappen that inhibit the critical state consolidation inAndorra.
In that sense is known that for temperate glaciers,meltwaters drainage is subjected to climatic, annualand even diurnal cycles (see i.e. Boulton et al. 2001).All the subglacial hydrology is ruled to those meltingcycles, the load and unload cycles transmit pore wa-ter pressure variations in the subglacial aquifer. Crit-
90
Valenti Turu
91
Pressuremeter test in glaciated valley sediments (Andorra, Southern Pyrenees)...
Fig. 1. Most representative type of stress/strain diagrams from pressuremeter dataa) Type 1 diagram showing an elasto-plastic behaviour. We can distinguish an elastic domain where deformation modulus is obtained by G= k ?p/?v (k is a pressuremeter constant). b) Type 2 diagram with a hyperplastic behaviour, showing the ability to record the stress/strainhistory of soil. Four pressure steps with a growing stiffness (less slope) of linear behaviour. c) Type 3 diagram showing strain rebound,called ratcheting as it is similar to those described in hypoplastic models. Two yield points can be distinguished were ratcheting happen be-tween both, an hyperelastic yield point (HEHoP) and a Hypoplastic yield point (HoPP), over which failure criterion is reached
92
Valenti Turu
Fig. 2. Idealised behaviour of the glaciated sedimentsa) Using a Modified Cam-Clay diagram of increasing or decreasing load-unload (L-UL) cycles. In a increasing strain/stress evolution,load and unload cycles with a constant pervasive shear stress can produce a critical state of consolidation. b) Using a MCC diagram ina decreasing stress/strain evolution the soil can show more than one preconsolidat,ions. c) Behaviour evolution from the pressuremetersdiagrams in depth. Stiffening diminishes the slope of the stress/strain diagram and kinematic hardening produce the migration of the lo-cus yield
ical state consolidation can be inhibit after a loadevent with pervasive constant shear stress if the un-load event is associated with a pervasive shear stressdrop; or in other words, if the unload event is associ-ated with a very bad drainage of the subglacialhydrologic system and the glacier lost contact(décollement) with its sole by flotation uplift.
If the net evolution of subglacial effective pres-sure over different cycles has been decreasing (Fig.2b), it is known from constitutive models(elasto-plastic, hyperplastic, hypoplastic, hyper-elastic, ...) that load and unload cycles stiffen consoli-dated sediments; and is manifested in the elasticfield of the pressuremetric curve by a decrease in itsslope (greater stiffness) by steps (Fig. 1b), with eachstep corresponding to a range of effective pressuresof the load-unload cycles. The greater consolidationstate can be rheologically assimilated to the expan-sion of the yield curve due to plastic hardening. If wefollow the continuous hyperplasticity model (Einavet al. 2003) the outer most yield surface should be theY3 hyperplastic yield surface (Fig. 2b). In the otherhand, if the net evolution of subglacial effective pres-sure over different cycles has been increasing, thepervasive shear stress field consolidation can un-dergo the soil to critical state consolidation (Quan2005). If pervasive shear stress is not negligible, in-creasing evolution of subglacial effective pressureover the different cycles will show preconsolidationsgreater than the decreasing evolution.
In hyperplasticity constitutive models three yieldsurfaces are used, a inner yield surface (Y1) werestress-strain answer is purely elastic, an outer surface(Y2) representing the outer boundary of non-linearbehaviour, and both yield surfaces inside of a thirdone from modified cam-clay large-scale yield surface(Y3) that is the outer boundary of plastic behaviour.Type 2 diagrams multiple yield zone should be inter-preted as a multiple elastic soil behaviour below theY3 yield point (Fig. 1b).
Type 3 P/V curves
These curves have lost their tensional history andI think that those diagrams correspond to an evolu-tion toward the hyperelasticity and hypoplasticity oftype 2 curves, let me explain:
The consolidation of the subglacial sediments sit-uated near hydraulically singular points (subglacialtunnel drainage), is subject to an intense flow of wa-ter due to being situated near the place of drainagewhere there is a high hydraulic drop, and thereforealso subject to greater high pervasive shear stress. Ifhigh water flow through porous media produce finegrain cleaning (supported by soil analysis and geo-physical data in Andorra), subglacial shear stress canrearranges the sediment grains. The soil will appearto be undergoing consolidation when its stress state
is close to critical state (Quan 2005), reflecting a con-solidation pressure greater than the isotropic one(Fig. 2a).
The different load-unload cycles of subglacialdrainage not only lend greater stiffness to the sedi-ment in the elastic stage, but the progressive finegrain cleaning, together with the rearrangement ofthe grains, also provides denser packing leading thesoil to reduce its void ratio to such a degree thatgranular contact does not permit it to consolidatefurther.
Dense packing of glaciated sediment grains wasdetected by Turu (2000) in Andorra comparing seis-mic shear modulus with the pressuremeter shearmodulus.
Hyperelasticity can explain easily the behaviourof dense packing soils for small strains (see Niemunis1996; Niemunis, Cudny 1998), where the stress istransferred through the porous media and smallintergranular strain occurs without new rearrange-ment of grains, so the strain can be considered as re-versible. Nevertheless different behaviour isexpected for large deformations.
For extreme stress ubiquitous ratcheting effectsmay be possible (Niemunis com. pers. 2007) and hasbeen observed in type 3 stress/strain diagrams (Fig.1c). Typical saw-tooth-like stress-strain diagrams areobtained in the vicinity of yield stress predicted bythe hypopasticity models, but since now not observedexperimentally because the performance of themodel in comparison to experiment were evidentlypoor (Niemunis, Triantafyllidis 2003).
So in type 3 diagrams different stress/strain be-haviours can be observed. Hyperelasticity behaviourfor intergranular small-strains (Niemunis 1996;Niemunis, Cudny 1998), while for larger strains ex-tensive accumulation of deformation by load cyclesleads toward an hypoplasticity behaviour (seeNiemunis, Triantafyllidis 2003). Upon the hypo-plastic yield stress more larger strains are obtainedfor small stress increments, leading towards a failurecriterion behaviour.
Separation between hyperelastic and hypoplasticbehaviours should corresponds to a inner yield sur-face (like Y1 hyperplastic yield surface) that we willcall HEHoP; while an external yield surface (like Y3hyperplastic yield surface), formed near the criticalstate, should corresponding to the separation be-tween hypoplastic and failure behaviours that we willcall HoPP (Fig. 1c).
Conclusions
The hyperelastic and hypoplastic behaviour oftype 3 curves derive from previous hyperplastic be-haviour from type 2 curves, while hyperplasticity oftype 2 in turn derive from the elastic behaviour of
93
Pressuremeter test in glaciated valley sediments (Andorra, Southern Pyrenees)...
type 1 curves. The principal mechanism to that evo-lution is due to load-unload (L-UL) cycles, produc-ing stiffening and kinematic hardening of thesubglacial sediment (Fig. 2c).
The evolution from type 2 to type 3 soil behaviourshould start with a critical state consolidation (HoPPyield), wile the HEHoP yield point appear when thesoil is led to a dense packing by further fine graincleaning and rearrangement of grains. Betweenboth, type 2 expansion of the yield curve due to plas-tic hardening by load-unload cycles derive toratcheting in type 3 diagrams by extensive accumula-tion of deformation by those cycles.
Literature
AFNOR, 1999. Essai pressiométrique Ménard,Parie 2: Essai avec cycle. NormeFrançaise NF P94–110-2.
AFNOR, 2000. Essai pressiométrique Ménard,Partie 1: Essai sans cycle. Norme Française NF P94–110-1.
Baguelin, F.; Jezequel J.F., Shields, D.H., 1978. Thepressurometer and foundation engineering. In:Trans Tech Publications, Aedermannsdorf (Ed.),Switzerland, 410 pp.
Boulton, G.S., Dobbie, K., Zatsepin, S., 2001. Sedi-ment deformation beneath glaciers and its cou-pling to the subglacial hydraulic system.Quaternary International, 86: 3–28.
Cassan, M., 1982. Los ensayos in situ en la mecanicadel suelo, su ejecución e interpretación. ETA(Ed.), Barcelona, 492 pp.
Devincenzi, M., Turu, V., 1999. Estimació deparàmetres geomecànics i avaluació detractaments d’injecció mitjançant assaigsgeotècnics in situ en sediments d’alta muntanya(Principat d’Andorra, Pirineus Orientals. L’Art deviure a Andorra, 15: 33–42.
Eniav, I; Purzin, A.M., Houlsby, G.T., 2003. Contin-uous hyperplastic models for overconsolidatedclays. Mathematical and Computer Modelling, 37:515–523.
Evans, D.J.A.; Phillips, E.R.; Hiemstra, J.F., Auton,C.A., 2006. Subglacial till: formation, sedimentary
characteristics and classification. Earth-ScienceReviews, 78: 115–176.
Fyffe, S.; Reid, W.M., Summers, J.B., 1985. ThePush-In Pressuremeter: 5 Years of Offshore Expe-rience. In: The Pressuremeter and its Marine Ap-plications (2nd Int. Symp.); ASTM STP 950 (Ed.),22–37.
Niemunis, A., 1996. Hypoplasticity vss. Elasto-Plas-ticity. In: Mechanics of cohesive-frictional materi-als, W. Wu, A. Niemunis (Eds.), Vol 1: 145–163.
Niemunis, A., Cudny, M., 1998. On hyperelasticityfor clays. Computers and Geotechnics, 23:221–236.
Niemunis, A., Triantafyllidis, T., 2003. Liapunov in-stability of the hypoplastic model for soils. Soil Dy-namics and Earthquake Engineering, 24: 35–48.
Quan, B., 2005. Effect of subglacial shear ongeomechanical properties of glaciated soils. Mas-ter of Science degree Dpt. Civil & Geological En-gineering, University of Saskatchewan, Canada,134 pp.
Reid, W.M.; St. John, H.D.; Fyffe, S., Rigden, W.J.,1982. The Push-In Pressuremeter. In: Proceedingsof the Symposium on the Pressuremeter and itsMarine Applications; Editions Techniques (Ed.),Paris.
Turu, V., 2000. Aplicación de diferentes técnicasgeofísicas y geomecánicas para el diseńo de unaprospección hidrogeológica de la cubeta de An-dorra, (Pirineo Oriental): implicaciones paleo-hidrogeológicas en el contexto glacial andorrano.In: Actualidad de las técnicas geofísicas aplicadasen hidrogeologia, ITGE-IGME (Ed.), Madrid,203–210. Online: http://aguas.igme.es/igme/publica/pdfactu_tec_geofi/14a_comunicacion.pdf.
Turu, V., Boulton, G.S; Ros, X.; Peńa-Monné, J.Ll.;Martí-Bono C.; Bordonau, J.; Serrano-Cańadas,E.; Sancho-Marcén, C.; Constante-Orrios, C.;Pous, J.; González-Trueba, J.J.; Palomar, J.;Herrero, R., García-Ruíz, J.M., 2007. Structuredes grands bassins glaciaires dans le nord de lapéninsule ibérique: comparaison entre les valléesd’Andorre (Pyrénées Orientales), du Gállego(Pyrénées Centrales) et du Trueba (ChaîneCantabrique). Quaternaire, 3–4, in press.
94
Valenti Turu