Embed Size (px)
Citation preview

IP 140 \f \ho
Pressure-Volume-Temperature
Correlations for Crude Oils from the
inois Basin
Steve Soo Khoon Sim
ILLINOIS STATE GEOLOGICAL SURVEYDepartment of Energy and Natural Resources
linois Petroleum 140
1993

Digitized by the Internet Archive
in 2012 with funding from
University of Illinois Urbana-Champaign
http://archive.org/details/pressurevolumete140sims

Pressure-Volume-Temperature
Correlations for Crude Oils from the
Illinois Basin
Steve Soo Khoon Sim
1993
Illinois Petroleum 140
ILLINOIS STATE GEOLOGICAL SURVEYMorris W. Leighton, Chief
Natural Resources Building
615 East Peabody Drive
Champaign, Illinois 61820-6964

Disclaimer
This report was prepared by the Illinois State Geological Survey (ISGS) for a project
sponsored by the State of Illinois and the U.S. Department of Energy (USDOE). It
presents reasonable interpretations of available data. Any opinions, findings, con-
clusions, or recommendations expressed herein are those of the author and do not
necessarily reflect the views of the USDOE. Neither the ISGS, any member of the
ISGS staff, the Illinois Department of Energy and Natural Resources (ENR), nor the
USDOE assumes any liability with respect to the use, or for any damages resulting
from the use, of any information contained in this report. Use of trademarks andbrand names in this report does not constitute endorsement of any product by the
ISGS, ENR, or USDOE.
Printed by authority of the State of Illinois/1993/1000
)printed on recycled paper

CONTENTS
ABSTRACT 1
INTRODUCTION 1
PRESSURE-VOLUME-TEMPERATURE ANALYSES 2
EXISTING PRESSURE-VOLUME-TEMPERATURE CORRELATIONS:BUBBLE-POINT PRESSURES 4
VALIDATION OF AN EQUATION OF STATE COMPUTER PROGRAMWITH EXPERIMENTAL DATA 6
Simulation of Pressure-Volume-Temperature Analysis 6
Simulation of Carbon Dioxide Swelling Tests 8
NEW CORRELATIONS 8
Bubble-Point Pressure Correlation 9
Calculation of Oil Formation Volume Factors of Saturated Oil 1
1
Calculation of Isothermal Compressibility of Undersaturated Oil 1
1
Viscosity Relationships 12
Correlation of Saturated Oil Densities 13
SUMMARY 15
ACKNOWLEDGMENTS 15
REFERENCES 16
APPENDIXES 17
A Two Equations of State 17
B Input Data and Results of EOS Matching 18
C PVT Analysis of Reservoir Fluid, Alex Lease,
Zeigler Field, Franklin County 20D PVT Analysis of Reservoir Fluid (Sample 1), McCullum Unit,
Dale Consolidated Field, Franklin County 25E PVT Analysis of Reservoir Fluid (Sample 2), McCullum Unit,
Dale Consolidated Field, Franklin County 29
F PVT Analysis of Reservoir Fluid, Energy Field, Williamson County 34
G Sample Calculation Using Equation 1 41
FIGURES1 Oil and gas sampling locations 3
2 Comparison between bubble-point pressures 5
3 Bubble-point pressure matching with EOS 7
4 Oil swelling test with CO2 9
5 Bubble-point pressure relative to critical temperature of gas 9
F-1 Saturation pressure relative to B 35
F-2 Saturation pressure relative to GOR 35
TABLES1 Ranges of data used to develop PVT relationships 4
2 Comparison between calculated and measured bubble-point pressures 5
3 Comparison between measured and calculated PVT parameters
for oil samples from three Illinois Basin Fields 7
4 Comparison between measured and calculated PVT parameters for a
CO2 swelling test of oil from Dale Consolidated Field 8
5 Calculation of bubble-point pressures 10
6 Prediction of bubble-point pressures at 1 50°F 1
1
7 Calculation of oil formation volume factor 12

8 Comparison between values for undersaturated oil compressibility
calculated by the method of Vasquez and Beggs (1980)
and equation 4 13
9 Calculation of saturated oil viscosity 141 Calculation of saturated oil density by method of Katz (1 942) 1
4
B-1 Composition of reservoir fluid samples 18
B-2 Thermodynamic properties of oil fractions used in EOS simulation 18
B-3 Gas composition matching 19
C-1 Field data 21
C-2 PVT summary 21
C-3 Pressure to volume relationship 22C-4 Flash separator test 22C-5 Differential vaporization at 95°F 23C-6 Gas composition 23C-7 Solution gas composition from flash separation 24C-8 Oil viscosity at 95°F 24D-1 Field data 26D-2 PVT summary 26D-3 Pressure to volume relationship 27D-4 Flash separator test 27D-5 Differential vaporization at 98°F 28D-6 Gas composition 28D-7 Oil viscosity 28E-1 Field data 30E-2 PVT summary 30E-3 Pressure to volume relationship 31
E-4 Flash separator test 31
E-5 Differential vaporization at 98°F 32E-6 Gas composition 32E-7 Gas composition from differential vaporization tests 33E-8 Oil viscosity 33F-1 Field data 37F-2 PVT summary 37F-3 Pressure to volume relationship of sample 1 at reservoir
temperature of 84°F 38F-4 Pressure to volume relationship of sample 2 at reservoir
temperature of 84°F 38F-5 Pressure to volume relationship of sample 3 at reservoir
temperature of 84°F 39F-6 Flash separator test 39F-7 Differential vaporization of reservoir fluid (sample 3) at 84°F 40F-8 Gas composition 40F-9 Viscosity of reservoir fluid (sample 3) at 84°F 40

ABSTRACT
Several pressure-volume-temperature (PVT) analyses were performed using crude
oil and gases from three different Illinois reservoirs. The results were used to
evaluate the applicability of the commonly used correlation methods for PVTproperties and to validate an equation of state (EOS) computer program that can
be used to calculate PVT properties under other pressure and temperature condi-
tions.
Knowledge of the bubble-point pressure and oil compressibility of the reservoir
crude is crucial in the implementation of a successful secondary recovery program.
Timely initiation of water injection can avoid poor oil recovery due to (1) excessive
loss of reservoir energy and (2) creation of gas channels through excessive gas
production below bubble-point pressure.
Crude oil samples from Illinois Basin reservoirs commonly contain solution gas with
a composition outside the range of applicability of the methods generally used for
bubble-point pressure calculations. A simple and more generally applicable equa-
tion has been derived for this purpose. This equation, which uses the pseudo critical
temperature to represent the physical properties of solution gases, was found to be
superior to the commonly used correlation methods for the calculation of bubble-
point pressure.
The method of Vasquez and Beggs (1980) commonly used for the estimation of
isothermal oil compressibility was found to be inadequate for the samples analyzed.
An equation that shows better agreement with experimental values was developed.
It adequately reflects the effect of pressure, temperature, and the amount of solution
gas on the oil compressibilities.
Estimation of the oil formation volume factor by the method of Vasquez and Beggs
(1980) and calculation of saturated oil density using the method of Katz (1942) werefound to be adequate for practical purposes.
As a result of this study, Illinois Basin operators now have an improved methodology
to calculate more applicable PVT properties for use in reservoir management. Asmore PVT data become available in the future, the full extent of the applicability of
the correlations developed in this study can be established.
INTRODUCTION
Petroleum engineers require knowledge of the physical properties of petroleum
fluids for various calculations relating to both reservoir and production systems.
These properties must be determined at the reservoir temperature and various
pressures for reservoir performance studies, and at conditions of both changing
pressure and temperature for well-bore hydraulics, surface separation, and flow-line
calculation. The physical properties of a representative reservoir fluid sample which
is obtained either by subsurface sampling techniques or recombination of separator
oil and gas, are measured with equipment for determining the pressure, volume,
and temperature of the sample (PVT). The results of these analyses are used to
• estimate the volume of original oil and gas in place,
• calculate flow properties of the reservoir fluid under reservoir or pipeline condi-
tions,
• design separator conditions for optimization of liquid recovery,
• provide information on solution gas drive energy and timing of pressure main-
tenance

A program of well-conditioning activities has to be undertaken to obtain the required
representative sample. These activities ensure that no nonassociated free gas is
being produced together with the crude oil during sampling. The program generally
requires gradually reducing the production rate of a well until the ratio of produced
gas to produced oil stabilizes. Shutting in the well for 1 to 2 days may be required
if bottom-hole samples are needed. Most importantly, the samples must be obtained
as early as possible in the production life of the reservoir to avoid changes in the
overall composition of the sample.
In addition to the expense of carrying out a well-conditioning program is the $5,000
to $10,000 cost of a complete PVT analysis conducted by a petroleum service
laboratory. Most independent operators have been reluctant to incur the additional
expense at an early stage of reservoir development because of cash flow consid-
erations. As an alternative, many of them rely on published PVT correlation charts
to obtain the needed PVT properties for their engineering calculations. Several PVTcorrelation methods (Standing 1952, Lasater 1958, Vasquez and Beggs 1980)
provide sufficiently accurate data for making engineering decisions in most cases.
Care should be taken, however, to make sure that the oil and gas compositions of
interest fall within the limits of these correlation charts or equations.
As discussed in detail later, many of these published PVT correlations are not
directly applicable to reservoirs with solution gas containing a substantial amount(more than 10%) of nonhydrocarbon gas or with a gas gravity higher than 1 .2. Theoil composition used to construct these correlations can be quite different from that
of Illinois crude oils.
To assist the independent oil and gas operators of the Illinois Basin in improving
their oil recovery, the Illinois State Geological Survey (ISGS) has established a
geological and engineering database from which they can draw essential informa-
tion. Reservoir characterization and engineering studies of selected reservoirs are
being undertaken to better understand the reservoir architecture and drive mecha-nism of the reservoir, and to evaluate the technologies for improved oil recovery.
When an initial attempt to obtain PVT data from the independent operators in the
basin yielded only one partial PVT report from Zeigler Field and some isolated PVTdata from other fields, the ISGS began a series of investigations with these
objectives: (1) to provide needed PVT property data input for reservoir engineering
studies, (2) to accumulate a PVT database for the Illinois Basin, (3) to evaluate the
adequacy of existing PVT property correlation charts and equations for Illinois
reservoir crude oils, and (4) to provide independent oil and gas producers with a
more accurate method for estimating PVT relationships in cases where other
published methods are found to be inadequate.
Several PVT analyses were performed using crude oil and gases from three different
Illinois reservoirs. In addition, one oil swelling test with carbon dioxide was per-
formed to evaluate the potential for CO2 flood enhanced oil recovery from the AuxVases Formation of the Illinois Basin.
PRESSURE-VOLUME-TEMPERATURE ANALYSES
Surface oil and gas samples collected from well sites in the fields (fig. 1) were
recombined according to the known solution gas to oil ratios or saturation
pressures. Whenever uncertainties existed in the actual ratio of solution gas to oil,
several samples were recombined with varying gas to oil ratios. The PVTproperties of these samples were then measured with the ISGS integrated PVT and
capillary viscometer system. Details of the experimental procedures and calculation
are described in an open file report on PVT standard operating procedures at the

Zeigler Field
Energy Field
Dale
Consolidated
Field
Figure 1 Oil and gassampling locations.
ISGS (Sim, in preparation). Results of the analyses of the samples are included as
appendixes C, D, E and F of this report.
Nomenclature
Pb = bubble-point pressure (psi)
Tr = reservoir temperature (°F)
Rs = solution gas to oil ratio (scf/stb)
API = oil degree API
Yg = mole fraction of gas
Yg = gas gravity
Tcm = pseudo critical temperature of gas mixture
yi = mole fraction of individual gas components
TC i= critical temperature (°F) of individual gas components
P = pressure (psi)
T = temperature (°F)
Co = oil compressibility
Yo = oil density (gm/cm3)
Uos = saturated oil viscosity (Cp)
Uod = gas free or dead oil viscosity (Cp)
EXISTING PRESSURE-VOLUME-TEMPERATURECORRELATIONS: BUBBLE-POINT PRESSURES
The three most popular correlations used by the petroleum industry to calulate
bubble-point pressures are those of Standing (1952), Lasater (1958), and Vasquezand Beggs (1980). The ranges of the data used to develop these PVT correlations
(Beggs 1987) are summarized in table 1.
The adequacy of using these relationships for estimating the PVT properties of
Illinois Basin crude oils was evaluated. Bubble-point pressures, as calculated from
the PVT correlations, were compared with measured data for crude samples from
the Aux Vases sandstone reservoir in three Illinois fields. Table 2 and figure 2 showthe calculated results related to the measured data for wells producing from the AuxVases Sandstone at Energy Field in Williamson County, McCullum Unit at Dale
Consolidated Field in Franklin County, and Zeigler Field in Franklin County, Illinois.
Table 2 and figure 2 indicate that deviations of the calculated from the measuredresults are most extreme for samples from the Energy and McCullum fields. Solu-
tion gas from Energy Field contains 15% nitrogen, whereas gas from the McCullumfield has a gas gravity of 1 .3 because of the high content of propane and butane.
They both exceed the limits of applicability of the published correlation charts.
The PVT correlations of Standing (1 952) and Lasater (1 958) were based on systems
essentially free of nonhydrocarbon components. The presence of large amounts of
nitrogen, carbon dioxide, and hydrogen sulfide result in estimated bubble points that
are unrealistically low. Bubble-point pressures calculated from the Lasater correla-
tion were adjusted upward based on anticipated errors due to the presence of
nonhydrocarbon gases in the solution gases (Smith et al. 1992). As shown in table
2, however, the corrected bubble-point pressure for the Energy Field sample, which
contains 15% nitrogen, is still 142 to 444 psi below the measured values. Although
no information was given regarding the composition of the gas samples upon which
the Vasquez and Beggs (1980) PVT correlation was based, the fact that all three
PVT correlations used gas gravity to represent the properties of the solution gaslimits their applicability to mixtures containing nonhydrocarbon gases.
Review of the compositions of gases produced from Illinois reservoirs, as reported
by Meents (1981), reveals that a substantial number of the gases have either
nitrogen contents higher than 10% or gas gravities higher than 1.2. Therefore, an
Table 1 Ranges of data used to develop PVT relationships (from published
correlation charts)
Standing Lasater Vasquez and Beggs
Pb (psi) 130-7000 48 - 5780 50 - 5250
Tr (°F) 100-258 82-272 70 - 295
R8 20-1425 3-2905 20-2070
oil (API) 16.5-63.8 17.9-51.1 16-58
gas gravity 0.59 - .95 0.57-1.22 0.56-1.18
Pb = bubble-point pressure of the reservoir fluid (psi)
T, = reservoir temperature (°F)
Rs = solution gas to oil ratio in standard cubic feet of gas per stock tank barrel of oil (scf/stb)
oil (API) = API gravity of stock tank oil
gas gravity = density of solution gas / density of air

Table 2 Comparison between calculated and measured bubble-point pressures
Measured Standing Lasater(1) Lasater(2) Vasquez and Beggs
Ppsig
Ppsig
(AP)
psig
Ppsig
(AP)
psig
Ppsig
(AP)
psig
Ppsig
(AP)
psig
Energy
Field
1600.0
910.0
1077.4
622.4
(-522)
(-288)
1013.4
674.0
(-587)
(-236)
1155.3
768.4
(-444)
(-142)
1185.5
736.0
(-414)
H74)
McCullumUnit
350.0
150.0
728.1
558.0(378)
(408)
622.6
483.6
(272)
(333)
628.8
488.4(278)
(338)
800.5
611.6(450)
(461)
Zeigler
Field
707.0
180.0
557.5
257.5
(-150)
(78)
585.0
376.9
(-122)
(197)
643.5
403.3
(-€4)
(223)
609.9
347.9
(-97)
(168)
AP = Pb (calc) - Pb (measured)
Standing = calculated with Standing's correlation
Lasater (1) = calculated with Lasater's correlation without correction for nonhydrocarbon gas
Lasater(2) = calculated with Lasater's correlation with correction for nonhydrocarbon gas
Vasquez and Beggs = calculated with the method of Vasquez and Beggs (1980)
1000
500
g>wo.
(0
-Q0-
o
O--500-
-1000
McCullum Zeigler Energy
Unit Field Field
-A^5X
calculation method fexStanding V^
I i
• Lasater
A Vasquez & Beggs
150 350 180 707
Pb(data) psig
Figure 2 Comparison between bubble-point pressures
910 1600
improved PVT correlation equation is needed to accurately estimate the PVTproperties of Illinois reservoirs.
The equation of state (EOS) used by the petroleum industry for simulation of phasebehavior and PVT properties has been discussed in several papers (e.g. Whitson
1982). Although the most important application of EOS is in the field of gas-miscible
flood enhanced oil recovery, it can also be used to check the consistency of PVTand phase behavior results.
There are very limited experimental PVT data from Illinois reservoirs available for
the derivation of a reliable equation for the calculation of physical properties such
as bubble-point pressures, oil and gas formation volume factors, and compressibili-
ties. Consequently, an EOS computer program was used to check the consistency

of new correlation equations and to extend the PVT relationships beyond the limits
of the available data.
VALIDATION OF AN EQUATION OF STATECOMPUTER PROGRAM WITH EXPERIMENTAL DATA
The phase behavior simulator used in this work was the Western Atlas Integrated
Technologies EOS-PAK™ licensed to the ISGS and installed on a Silicon-
Graphics™ IRIS 4D/310GTX work station. The program includes two of the mostwidely used EOS: the Peng-Robinson (Peng and Robinson 1976) and the Redlich-
Kwong (Redlich and Kwong 1949). Brief descriptions of them are included in
appendix A.
The program contains the thermodynamic properties of the most common compo-nents in oil and gas mixtures. Thus, with the composition of the reservoir fluid as
input, the program defines the relationship between the pressure, volume andtemperature for a given fluid. If two of the three variables (e.g. pressure andtemperature) are known, the third variable (e.g. volume) can be calculated.
Before an EOS can be used for the prediction of phase behavior, certain parameters
in the equation, namely the critical properties of the oil fractions and certain
interaction parameters (6ij) between the gas and the oil components, have to be
determined. A common practice in the oil industry is to adjust the values of these
parameters until the PVT values obtained from the EOS match a set of experi-
mental PVT data. This process is commonly called EOS tuning.
Three sets of PVT data and one CO2 swelling test obtained from laboratory
experiments were used for the tuning process. The following summarizes the steps
taken to tune the EOS program.
1) The molecular distribution of the crude oil was simulated using a computerprogram. Then a comparison was made between the calculated oil composi-
tion and that obtained by gas chromatographic analysis of the stock tank oil.
This procedure ensures the proper distribution of hydrocarbon components.
A three-fraction mixture representing the crude oil mixture was used to
facilitate calculation.
2) The overall composition of the mixtures was calculated from the composi-
tion of separator gas, stock tank oil, and gas to oil ratio. The final composition
was used as input for the calculation of PVT properties at specified tempera-
tures and pressures.
3) A regression subroutine was then employed to match the experimental
bubble points. In this adjustment, the interaction parameters between methaneand the three oil fractions were allowed to vary 20%.
4) These calculations were followed by matching the oil formation volumefactor and the oil densities. This was accomplished by adjusting the three
variables, Qa, Qb and the acentric factors (co), of the three oil fractions. (Refer
to appendix A for details.)
5) Final matching of the oil viscosities was accomplished by adjusting the
critical compressibility factors (Zc) of the oil fraction.
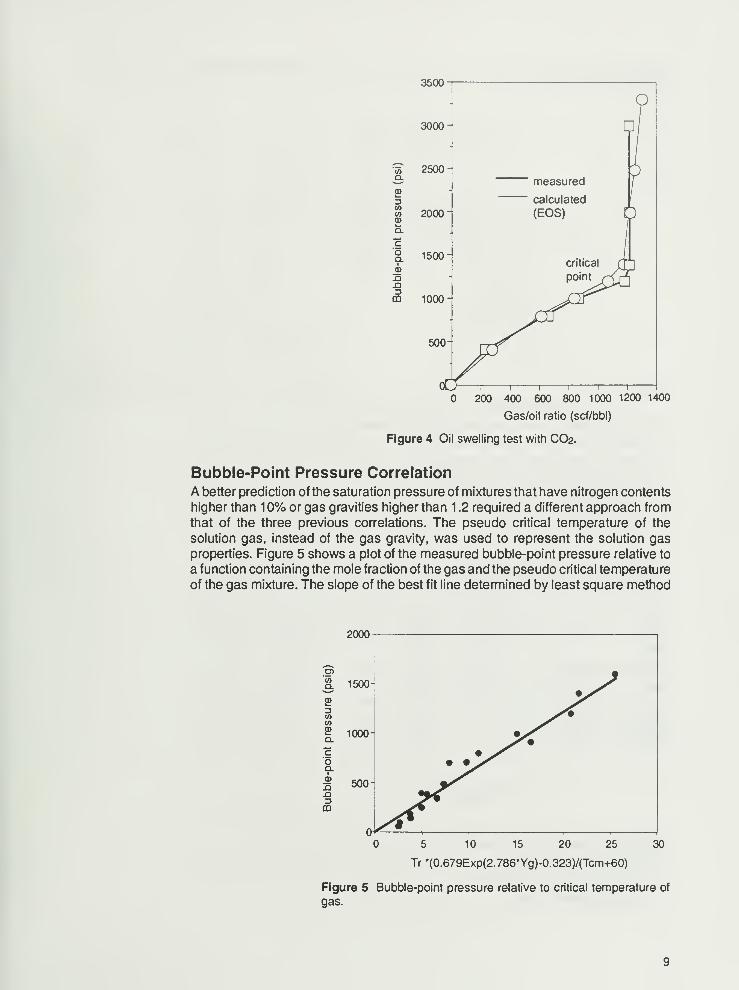
Simulation of Pressure -Volume -Temperature AnalysesTable 3 and figure 3 compare the EOS-calculated PVT properties with the experi-
mental data. Deviation between the calculated bubble-point pressures and the

Table 3 Comparison between measured and calculated PVT parameters for oil samples from three Illinois Basin fields
Rsscf/stb
Pbpsig
Borb/stb
Pogm/cc
data calc data calc % dev data calc % dev data calc % dev
McCullum 319.4 312.3 350.0 342.0 0.1 1.213 1.217 -3 0.763 0.782 -5
Unit 245.0 222.0 150.0 150.0 -10 1.130 1.135 -10 0.784 0.809 -14
0.0 0.0 0.0 0.0 1.017 1.010 0.822 0.831
Energy 419.4 381.0 1600.0 1600.0 -10 1.187 1.163 -8 0.781
Field 210.1 208.0 910.0 900.0 0.1 1.124 1.123 -1 0.783 0.781 -1
65.1 60.0 100.0 100.0 -8 1.039 1.040 -8 0.795 0.811 -10
0.0 0.0 0.0 0.0 0.017 0.010 0.821
Zeigler 195.1 214.0 707.0 707.0 9 1.138 1.121 10 0.787 0.799 7
Field 114.6 112.0 180.0 200.0 -13 1.065 1.070 -3 0.794 0.815 -5
0.0 0.0 0.0
Pb (data)
0.0
Pb (calc)
1.017 1.010 0.815 0.831
%devofPb =Rs (data) Rs (calc)
Pb (data)
Rs (data)
B (data) B (calc)
%devofB =Rs (data) Rs (calc)
B (data)
Rs (data)
data = experimental data measured with the ISGS PVT equipment
calc = EOS (equation of state) calculated results
2000
i* 1500Q.
cl 1000 -
coQ.
&-Q
3CO
500 -
Zeigler
Field
measuredA EOSO equation
Standing
^ Lasater
• Vasquez & Beggs
210 419 245114 195
Gas/oil ratio (scf/stb)
Figure 3 Bubble-point matching with EOS (calculated versus measured)
319
experimental bubble-point values ranges from 1%to 13%, with an average deviation
of 4.8%. Deviation between calculated oil formation volume factors and experimen-
tal values ranges from 0.1% to 10%, with an average deviation of 3.2%.
The overall composition of the four reservoir samples used for tuning and the
thermodynamic properties of the three pseudo fractions used to represent the crude
oils are tabulated in appendix B. Detailed results of the simulation, such as the
comparison of calculated and measured gas compositions, are also included in
appendix B.
Simulation of Carbon Dioxide Swelling Tests
Once the EOS program was adjusted to mimic the PVT experimental data, the phasebehavior of these reservoir crude oils in the presence of CO2 was calculated. In apredictive mode, the calculation is performed without altering the values of the
thermodynamic parameters of the oil and gas components.
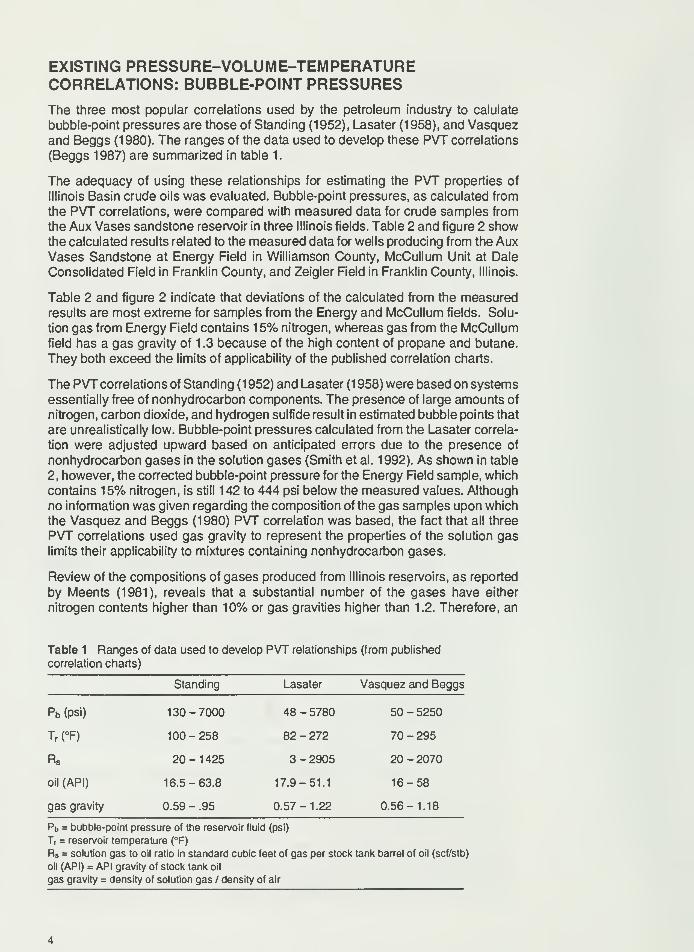
The results presented in table 4 and figure 4 show the ability of the tuned EOS to
simulate the results of a CO2 swelling test performed on the crude oil from
McCullum Unit at Dale Consolidated Field in Franklin County. In the plot of
saturation pressure relative to gas to oil ratio (GOR) (fig.4), the experimental data
show a critical point at about 1200 psig, where a further increase in pressure doesnot result in further CO2 dissolution. Because this critical point of the mixture is
highly dependent upon the oil composition, the ability of the EOS to accurately
estimate the critical point suggests that the real oil mixtures are reasonably well
simulated by the three pseudo fractions.
NEW CORRELATIONS
One of the objectives of this study was to provide Illinois Basin producers with a
means of calculating essential PVT properties from more readily measurable
physical properties such as oil API, gas composition, and gas to oil ratios. Although
a tuned EOS program is a good vehicle for performing these tasks, not manyindependent operators have access to these types of computer programs. Thus,
several correlation equations, based both on experimental data and on properties
calculated from the tuned EOS program, have been derived for use in the basin.
Table 4 Comparison between measured and calculated PVT parameters for
a CO2 swelling test of oil from Dale Consolidated Field
Gas/oil Oil formation
Saturation ratio volume factor Oil density
pressure (scf/stb) (rb/stb) (gm/cc)
(psig) calc data calc data calc data
3300 1321
3000 1280 1214
2500 1250 1214
2000 1210 12141400 1175 1214 1.388 1.478 0.879 0.847
1200 1066 1180 1.366 1.477 0.862 0.847
1000 828 860 1.318 1.370 0.858 0.838
800 608 642 1.240 1.268 0.854 0.824
400 272 233 1.121 1.116 0.844 0.813
1.0 1.0 0.843 0.820
data = experimental results obtained with ISGS PVT equipment
calc = results calculated with EOS
3500
3000-
a.2500
CD
3
0)
Q-
2000
oQ. 1500
CD 1000
500-
measured
calculated
(EOS)
—
i
1
—
400 600 800 1000 1200 1400
Gas/oil ratio (scf/bbl)
Figure 4 Oil swelling test with CO2.
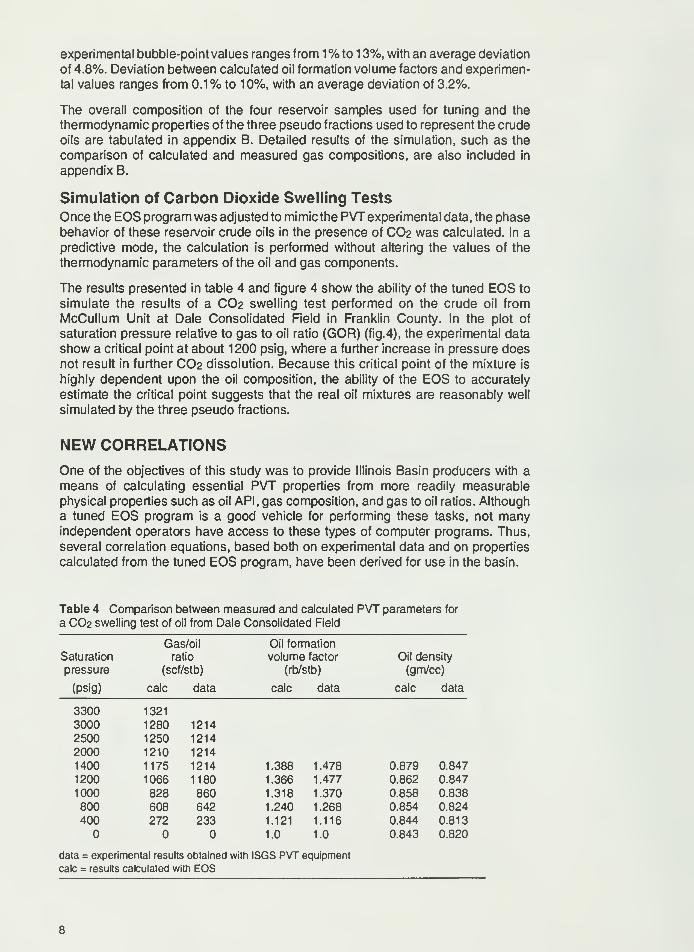
Bubble-Point Pressure Correlation
A better prediction of the saturation pressure of mixtures that have nitrogen contents
higher than 10% or gas gravities higher than 1 .2 required a different approach from
that of the three previous correlations. The pseudo critical temperature of the
solution gas, instead of the gas gravity, was used to represent the solution gas
properties. Figure 5 shows a plot of the measured bubble-point pressure relative to
a function containing the mole fraction of the gas and the pseudo critical temperature
of the gas mixture. The slope of the best fit line determined by least square method
2000
5 10 15 20 25
Tr*(0.679Exp(2.786*Yg)-0.323)/(Tcm+60)
30
Figure 5 Bubble-point pressure relative to critical temperature of
gas.
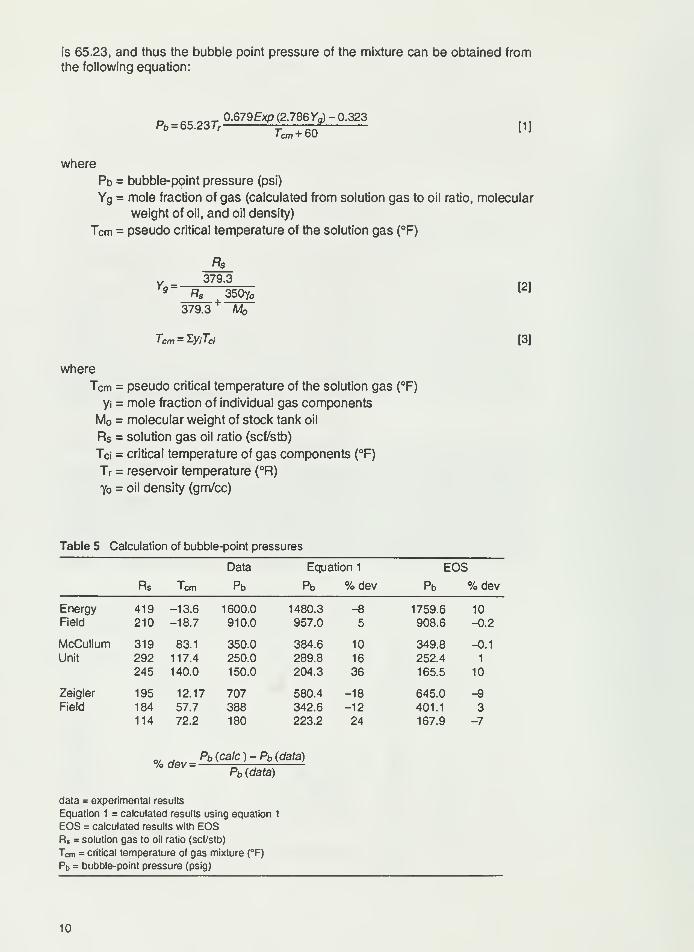
is 65.23, and thus the bubble point pressure of the mixture can be obtained from
the following equation:
P„-65.237> W6Q [1]
where
Pb = bubble-point pressure (psi)
Yg = mole fraction of gas (calculated from solution gas to oil ratio, molecular
weight of oil, and oil density)
TCm = pseudo critical temperature of the solution gas (°F)
_ 379.39 ~ Rs 350Yo
l J
379.3+ M
TCm = ^yiTci [3]
where
Tcm = pseudo critical temperature of the solution gas (°F)
yi = mole fraction of individual gas components
Mo = molecular weight of stock tank oil
Rs = solution gas oil ratio (scf/stb)
Tci = critical temperature of gas components (°F)
Tr = reservoir temperature (°R)
Yo = oil density (gm/cc)
Table 5 Calculation of bubble-point pressures
Data Equation 1 EOS
Rs Tcm Pb Pb % dev Pb % dev
Energy 419 -13.6 1600.0 1480.3 -8 1759.6 10
Field 210 -18.7 910.0 957.0 5 908.6 -0.2
McCullum 319 83.1 350.0 384.6 10 349.8 -0.1
Unit 292 117.4 250.0 289.8 16 252.4 1
245 140.0 150.0 204.3 36 165.5 10
Zeigler 195 12.17 707 580.4 -18 645.0 -9
Field 184 57.7 388 342.6 -12 401.1 3114 72.2 180 223.2 24 167.9 -7
% Pb (calc ) - i°b (data)
Pb (data)
data = experimental results
Equation 1 = calculated results using equation 1
EOS = calculated results with EOSRs = solution gas to oil ratio (scf/stb)
Tcm = critical temperature of gas mixture (°F)
Pb = bubble-point pressure (psig)
10

Table 6 Prediction of bubble-point pressures at 1 50°F
Rsscf/stb
EOSPbpsi
Pbpsi
Eq'nl
% dev
Standing
Pbpsi % dev
Lasater
Pbpsi % dev
Vasquez and BeggsPbpsi % dev
Energy 419 1853.6 1659.9 -10 1236.7 -33 1136.4 -39 1375.1 -26
Field 210 1152.5 1077.9 -7 718.7 -38 693.6 -40 792.6 -31
166 556.6 379.8 -32 539.3 -3 538.3 -3 592.3 6
65 108.5 148.4 36 219.5 82 293.7 170 215.3 98
McCullum 319 540.0 430.7 -20 812.0 50 720.5 33 897.1 66Unit 292 370.0 324.2 -12 753.1 104 670.8 81 831.1 124
245 254.2 252.3 -1 623.0 145 557.2 119 685.6 169
Zeigler 195 820.6 637.9 -22 625.6 -24 643.0 -22 657.4 -20
Field 184 491.2 377.2 -23 574.3 17 611.8 25 533.5 9
114 261.2 249.1 -5 385.4 48 427.0 64 421.1 61
% Pb {correlation) -Pb(EOS)
Pb (EOS)
Pb (correlation) = calculated by the various correlations
Pb (EOS) = calculated by the tuned equation of state program
Bubble-point values calculated with this equation can be compared with the values
from the EOS method (table 5). An example of the calculation is included in
appendix G. This simple correlation provides substantial improvement over the
Standing (1952), Lasater (1958), and Vasquez and Beggs (1980) methods in cases
where the nitrogen, propane, or butane contents are high in the solution gases.
Before this equation can be used, the composition of the solution gas must beanalyzed. The pseudo critical temperature of the solution gas mixture can then be
calculated with equation 3.
Table 6 compares the bubble-point pressures calculated with equation 1 at 150°F
with those predicted by the tuned EOS program and the three published correlation
methods. It shows that the bubble points predicted by equation 1 or by the tuned
EOS do not change significantly with temperature. Thus, in the absence of an EOSprogram, equation 1 can be used for prediction of the bubble-point pressure of crude
oil with temperatures up to 150°F.
Calculation of Oil Formation Volume Factors of Saturated Oil
Table 7 compares measured values for the saturated oil formation volume factor
with calculated values obtained with either the Standing (1 952) or the Vasquez and
Beggs (1980) method. It shows that Vasquez and Beggs provide a reasonable
estimate of the saturated oil formation volume factors even when the content of
nonhydrocarbon gas is high, as in the case of the CO2 swelling tests. The Standing
(1952) method substantially overestimates the oil swelling by CO2.
Calculation of Isothermal Compressibility
of Undersaturated Oil
Measurements of oil compressibility at pressures above the saturation pressure of
the reservoir fluid are part of the PVT analysis; they provide data essential for
evaluating the driving force during primary depletion from the original pressure of
the reservoir down to the bubble-point pressure of the reservoir crude.
11

Table 7 Calculation of oil formation volume factor
Pb Bo Bo B,3 BStanding Vasquez and Beggs EOS
Measured calc % dev calc % dev calc % dev
Energy 1600 1.187 1.227 3.3 1.206 1.6 1.163 -2
Field 910 1.124 1.107 -2 1.107 -1.5 1.123 -0.1
400 1.072 1.076 0.4 1.086 1.4 1.071 -0.1
100 1.039 1.037 -0.2 1.036 -0.3 1.040 0.1
McCullum 350 1.213 1.201 -1 1.161 -4.3 1.217 0.3
Unit 250 1.190 1.187 -0.3 1.151 -3 1.150 -0.4
150 1.130 1.158 2.5 1.126 -0.3 1.135 0.4
65 1.069 1.074 0.5 1.060 0.8 1.070 0.1
Zeigler 707 1.138 1.111 -1.6 1.105 -2.9 1.121 -1
Field 388 1.100 1.113 1 1.083 -1.5 1.099 -0.1
180 1.065 1.072 0.7 1.067 0.2 1.070 0.5
Swelling test of McCullum crude with CO2Pb Rs
1400 1214 1.478 1.926 30 1.579 7 1.388 -6
1200 1180 1.477 1.897 28 1.563 6 1.366 -7
1000 860 1.370 1.630 19 1.413 3 1.318 -4
800 642 1.268 1.456 15 1.311 3 1.240 -2
400 233 1.116 1.158 4 1.119 0.3 1.121 0.4
% A B°1 dev =—{calc) - B {data)
B \[data)
Table 8 lists oil compressibility factors measured at various solution gas to oil ratios
and reservoir pressure conditions. Using the Vasquez and Beggs (1 980) correlation
equation to calculate undersaturated oil compressibility does not provide an accu-
rate estimation. Correlation equation 4 was based on the data obtained experimen-
tally and calculated with EOS.
C = (Exp(1.85 + 0.0043(7-84) -0.0001 122P) + RsExp{-3.7 - 0.00074P))10 [4]
where
Rs = solution gas to oil ratio (scf/stb)
P = pressure of interest (psi)
T = reservoir temperature (°F)
Viscosity Relationships
Two methods are commonly used to calculate the viscosity of a gas-saturated crude
oils. Chew and Connally (1959) obtained gas-saturated viscosity values as follows:
U s = aU' od [5]
where
Uos = saturated oil viscosity (Cp)
Uod = gas free or dead oil viscosity (Cp)
a and b = function of solution gas to oil ratio obtained graphically
Beggs and Robinson (1 975) obtained similar values from the following relationship:
12

Table 8 Comparison between values for undersatu rated oil compressibility calculated by the methods of
Vasquez and Beggs (1980) and equation 4
Rs(scf/stb)
"foT
(°F)
API P(psi)
MeasuredCompressibility (Co)
Calculated
psi'1
Vasquez and Beggs
psi"1 % dev
Equation 4
psi"1 % dev
Energy
Field
419210210
1.038
1.001
1.001
848484
38
38
38
20001000
2000
7.7E-6
8.0E-6
6.7E-6
6.74E-6
3.41 E-6
3.85E-6
13
5742
7.44E-6
8.15E-6
6.26E-6
3-2
6
Zeigler
Field
198
198
124
124
1.098
1.098
1.109
1.109
9595
9595
38
3838
38
1000
20001000
2000
8.5E-6
6.8E-6
6.8E-6
5.8E-6
3.80E-6
1.90E-6
1.66E-6
8.30E-7
5572
7643
8.29E-6
6.45E-6
7.47E-6
6.03E-6
2
5-9
~4
McCullumUnit
319319113
113
1.312
1.312
1.310
1.310
989898
98
373737
37
1000
20001000
2000
9.6E-6
7.3E-6
7.4E-6
5.5E-6
7.66E-6
3.83E-6
5.00E-6
2.50E-6
204732
54
9.80E-6
7.19E-6
7.37E-6
6.04E-6
-2
1
1
-9
7 d3vC (data)-C (calc)
C (data)
Uos = AUod [6]
where
A = 10.715(Rs + 100)
B = 5.44(Rs+150)"
-0.515
-0.338
Both of these equations give reasonable values for the gas-saturated viscosity, if
the dead-oil viscosity at the temperature of interest is known. Table 9 comparesvalues for gas-saturated viscosity obtained experimentally with those calculated by
equations 5 and 6.
The calculated results from the Beggs and Robinson (1 975) method are better than
those from the Chew and Connally (1959) method applied to all three crude oils
measured for this study. The EOS-PAK™ program incorporates the Lohrenz, Bray,
and Clark (1964) relationship for the calculation of oil viscosity (table 9). Calculation
using this method requires knowledge of the critical volumes and densities of the
mixture. A regression subroutine was used to match the viscosities of the gas-free
oil at reservoir temperature. When this method was used, the calculated saturated
viscosities were consistently higher than the measured values. (It is beyond the
scope of this study to investigate the cause of this deviation.) When the EOS wastuned by matching the viscosity of gas-saturated oil, however, the calculated
viscosities matched the experimental data rather closely. Thus, it is recommendedthat the experimental viscosity of saturated oil be used for tuning of the EOS.
Correlation of Saturated Oil Densities
Values for the density of gas-saturated reservoir crude oil at various pressures at
the reservoir temperature are required for engineering calculations. The method of
Katz (1942) estimates live-oil density from oil API gravity, gas gravity, and the gas
to oil ratio. The calculated values using this method are compared with the measured
results in table 10. In general, the agreement is good within the range of pressure
13
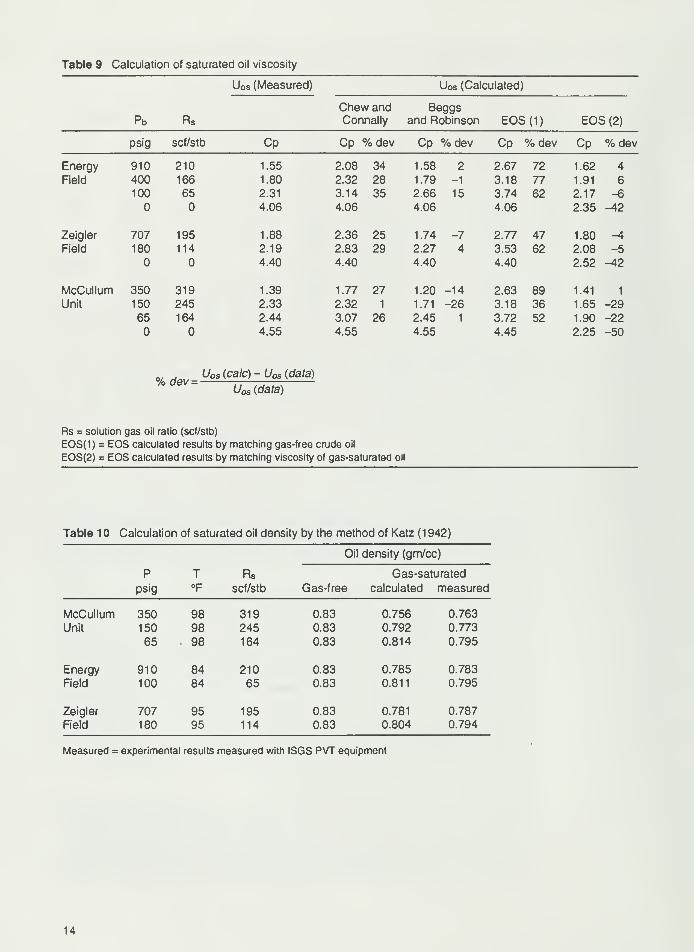
Table 9 Calculation of saturated oil viscosity
Rs
Uos (Measured) Uos (Calculated)
Pb
Chew andConnally
Beggsand Robinson EOS(1) EOS (2)
psig scf/stb Cp Cp %dev Cp %dev Cp %dev Cp % dev
Energy 910 210
Field 400 166
100 65
Zeigler 707 195
Field 180 114
McCullum 350 319Unit 150 245
65 164
1.55
1.80
2.31
4.06
1.88
2.19
4.40
1.39
2.33
2.44
4.55
2.08 34 1.58 2 2.67 72 1.62 4
2.32 28 1.79 -1 3.18 77 1.91 6
3.14 35 2.66 15 3.74 62 2.17 -6
4.06 4.06 4.06 2.35 -42
2.36 25 1.74 -7 2.77 47 1.80 -A2.83 29 2.27 4 3.53 62 2.08 -5
4.40 4.40 4.40 2.52 -42
1.77 27 1.20 -14 2.63 89 1.41 1
2.32 1 1.71 -26 3.18 36 1.65 -29
3.07 26 2.45 1 3.72 52 1.90 -22
4.55 4.55 4.45 2.25 -50
%dev =Uos (calc) - Uos (data)
Uos (data)
Rs = solution gas oil ratio (scf/stb)
EOS(1) = EOS calculated results by matching gas-free crude oil
EOS(2) = EOS calculated results by matching viscosity of gas-saturated oil
Table 10 Calculation of saturated oil density by the method of Katz (1 942)
P T Rs
Oil density (gm/cc)
Gas-saturated
psig °F scf/stb Gas-free calculated measured
McCullum 350 98 319 0.83 0.756 0.763
Unit 150 98 245 0.83 0.792 0.773
65 98 164 0.83 0.814 0.795
Energy 910 84 210 0.83 0.785 0.783
Field 100 84 65 0.83 0.811 0.795
Zeigler 707 95 195 0.83 0.781 0.787
Field 180 95 114 0.83 0.804 0.794
Measured = experimental results measured with ISGS PVT equipment
14

and gas to oil ratio under investigation. Thus, no attempt was made to construct a
different correlation method.
SUMMARYIllinois crude oil samples frequently contain solution gas that has a nonhydrocarbon
content higher than 10% and gravities higher than 1 .2. The samples are thus outside
the range of applicability of the commonly used methods for estimating bubble-point
pressures. A simple equation (1 ) that agrees with both the limited PVT data and the
calculated results of a tuned EOS has been derived for these types of crude oils.
The method of Vasquez and Beggs (1980) commonly used for the estimation of
isothermal oil compressibility has been found to be inadequate for the samples
analyzed. An equation (4) that shows better agreement with experimental values
was developed. For the estimation of saturated oil formation volume factors, the
Vasquez and Beggs method (1980) was found to be adequate. The relationship
derived by Standing (1 952) consistently overestimates oil swelling by CO2 for crude
oil from the Aux Vases Formation in the Illinois Basin.
Values for saturated oil viscosity estimated, on the basis of the Beggs and Robinson
(1975) method, from the viscosity of gas-free crude oil were found to be closer to
experimental values than those based on the Chew and Connally (1959) equation.
Values for gas-saturated oil density calculated using the Katz (1942) method agreed
closely with experimental determined values.
Further PVT experiments are needed to define the limits of applicability of equations
1 and 4.
ACKNOWLEDGMENTSI thank several colleagues at the Illinois State Geological Survey for their helpful
guidance and assistance in the preparation and review of this manuscript. Theassistance of Dennis J. Haggerty and Emmanuel O. Udegbunam with the sampling
of oil and gas is also appreciated. As part of the research on reservoir charac-
terization and improved oil recovery in the Illinois Basin, this project was funded by
the U.S. Department of Energy under grant DE-FG22-89BC14250 and the Illinois
Department of Energy and Natural Resources under grant AE-45. Support for the
research is gratefully acknowledged.
15

REFERENCES
Beggs, H. D., 1987, Oil system correlations, inH. B. Bradley, Petroleum Engineering
Handbook: Society of Petroleum Engineers, Richardson, Texas, 22 p.
Beggs, H. D., and J. R. Robinson, 1975, Estimating the viscosity of crude oil
systems: Journal of Petroleum Technology, v. 27, September, p. 1 140-1 141
.
Chew, J., and C. A. Connally, 1959, A viscosity correlation for gas-saturated crude
oils: Transactions of the American Institute of Mining, Metallurgical, and Petro-
leum Engineers, v. 216, p. 23-25.
Coats, K. H., 1980, An equation of state compositional model: Society of Petroleum
Engineers Journal, v. 20, October, p. 363-376.
Lasater, J. A., 1958, Bubble point pressure correlations: Transactions of the
American Institute of Mining, Metallurgical, and Petroleum Engineers, v. 213,
p.379-381.
Lahrenz, J., B. G. Bray, and C. R. Clark, 1964, Calculating viscosities for reservoir
fluids from their compositions: Journal of Petroleum Technology, v. 16, no. 10,
p. 1171-1176.
Meents, W. F., 1981, Analyses of Natural Gas in Illinois: Illinois State Geological
Survey, Illinois Petroleum 122, 64 p.
Peng, D. Y., and D. B. Robinson, 1976, A new two-constant equation of state:
Industrial Chemistry and Engineering Fundamentals, v. 15, p. 59-64.
Redlich, O., and J.N.S. Kwong, 1949, On the thermodynamics of solutions. V. Anequation of state. Fugacities of Gaseous Solutions: Chemical Review.v. 44,
p. 233-244.
Standing, M. B., 1952, Volumetric and Phase Behavior of Oil Field Hydrocarbon
Systems, Reinhold Publishing Corp., 122 p.
Sim, S.S.K., in preparation, Standard operation procedures of ISGS PVT system,
in Standard Operating Procedures for the Improved Oil Recovery Project: Illinois
State Geological Survey, Open File Report series.
Smith, C. S., G. W. Tracy, and R. L. Farrar, 1992, Fluid properties, in Applied
Reservoir Engineering: Oil & Gas Consultants International Publications, Tulsa,
Oklahoma, p.3-55.
Vasquez, M., and H. D. Beggs, 1980, Correlations for fluid physical property
prediction: Journal of Petroleum Technology, v. 32, no. 6, p. 968-970.
Whitson, C. S., 1982, Effect of Physical Properties Estimation on Equation of State
Predictions: Society of Petroleum Engineers, Paper 1 1200, 23 p.
16

APPENDIX A TWO EQUATIONS OF STATE
Redlich and Kwong (1949) equation of state
p= RT aT-05
V-b V(V+b)
where
fPt 2 -5
a = 0.4278^-•c
RTCb = 0.0867 -=-^
re
Pc = critical pressure
Tc = critical temperature
The Peng and Robinson (1976) equation of state
RT a(T)P =
V-b V(V+b) + b(V-b)
where
RTCb = 0.07780 -5-^
re
a(T) = (T«)a(TftO)
al/2
(Tfl) = 1+K(1-T?j5)
K = 0.37464 + 1 .54226(0 - 0.26992o2
where
co = acentric factor
Pc = critical pressure
Tc = critical temperature
For determination of a and b of mixtures
bm = 'L xi bj
a/, = (1 - 5,y) Va7ay
where
dij = interaction parameter between component i andj
For Redlich-Kwong EOS Qa = 0.4278 and Qq = 0.0867 and in Peng-Robinson
EOS Qa = 0.45724 and Qb = 0.0778
During the tuning of the equation of state program, the constants Qa and Qb for
the pseudo-fractions are sometimes altered in order to match the experimental
data.
17

APPENDIX B INPUT DATA AND RESULTS OFEOS MATCHING
Table B-1 Composition of reservoir fluid samples
Zeigler McCullumEnergy
sample 1
Energy
sample 2
N2 2.61 0.70 5.29 5.55
C02 0.08 0.15 0.10 0.13
Ci 10.22 8.34 10.18 14.46
c2 7.81 12.60 7.76 10.04
c3 9.67 14.12 6.00 7.75
I-C4 1.27 1.35 0.71 0.92
N-C4 3.69 6.81 2.57 3.32
I-C5 0.24 0.93 0.59 0.53
N-C5 1.36 1.28 1.19 1.28
F-1 15.95 14.11 18.44 15.35
F-2 35.74 28.17 37.16 32.04
F-3 11.36 11.43 10.01 8.60
Table B-2 Thermodynamic properties of oil fractions used in EOS simulation
Molecular Tc PC Acentric
weight (°F) (Psi) factor Zc
Fraction-1 102.74 561.68 430.14 0.30337 0.398328
Fraction-2 194.11 800.28 277.19 0.41406 0.360714
Fraction-3 399.14 1152.01 160.77 0.80008 0.306332
18

APPENDIX B continued
Table B-3 Gas composition matching
Differential Differential Flash910-400 (psi)
data calc
400-100 (psi)
data calc
910-0 (psi)
data calc
Energy N2 37.22 33.82 12.91 19.04 15.96 18.96
Field C02 0.85 0.17 1.82 0.38 1.2 0.33
Ci 46.08 51.73 46.09 45.76 35.57 36.42
c2 9.33 10.57 23.96 24.84 24.53 24.55
c3 3.81 2.91 10.96 7.95 13.27 13.99
l-C4 0.33 0.15 0.81 0.43 1.55 1.07
N-C4 1.06 0.42 2.22 1.13 5.32 3.13
I-C5 0.21 0.04 0.3 0.11 0.71 0.36
N-C5 0.38 0.07 0.44 0.17 1.02 0.57
Differential Differential Flash
707-388 (psig)
data calc
388-180 (psig)
data calc
707-0 (psig)
data calc
Zeigler N2 30.88 25.04 11.98 14.15 8.99 9.00
Field C02 0.45 0.14 0.58 0.23 0.22 0.25
C1 49.6 58.91 52.61 56.44 27.36 34.86
c2 9.55 10.39 17.91 18.54 20.9 23.95
c3 6.06 4.48 12.22 8.69 25.88 23.05
I-C4 0.52 0.27 0.99 0.53 3.38 2.11
N-C4 1.33 0.58 2.41 1.11 9.85 5.02
I-C5 0.13 0.02 0.31 0.03 0.6 0.17
N-C5 0.34 0.08 0.43 0.14 2.03 0.79
Differential Differential Differential
350 - 250 (psig)
data calc
250-150 (psig)
data calc
150-65
data
(psig)
calc
McCullum N2 7.95 9.07 3.37 2.78 0.51 0.42
Unit C02 0.39 0.46 0.45 0.52 0.48 0.50
C1 47.39 46.44 40.23 39.39 19.15 22.66
c2 24.09 29.58 30.77 36.44 40.76 40.97
C3 15.57 11.65 20.73 16.74 29.58 27.68
I-C4 0.80 0.52 0.98 0.77 1.89 1.42
N-C4 2.28 1.89 2.60 2.80 5.76 5.31
I-C4 0.31 0.12 0.24 0.17 0.58 0.33
N-C5 0.45 0.13 0.34 0.18 0.75 0.35
19

APPENDIX C PVT ANALYSIS OF RESERVOIR FLUID,ALEX LEASE, ZEIGLER FIELD,
FRANKLIN COUNTY
ProceduresThe oil sample obtained from the well head was flashed to room condition, and
the gas to oil ratio was measured to calculate the quantity of gas required for the
recombination to the specified solution gas to oil ratio, as provided by Mike Gal-
lagher of the Gallagher Drilling Company.
The casing gas sample and the oil samples were physically recombined to pro-
duce a fluid that has a solution gas to oil ratio of approximately 200 cubic feet of
gas per barrel of oil. Subsequent flash separation analysis of this recombined
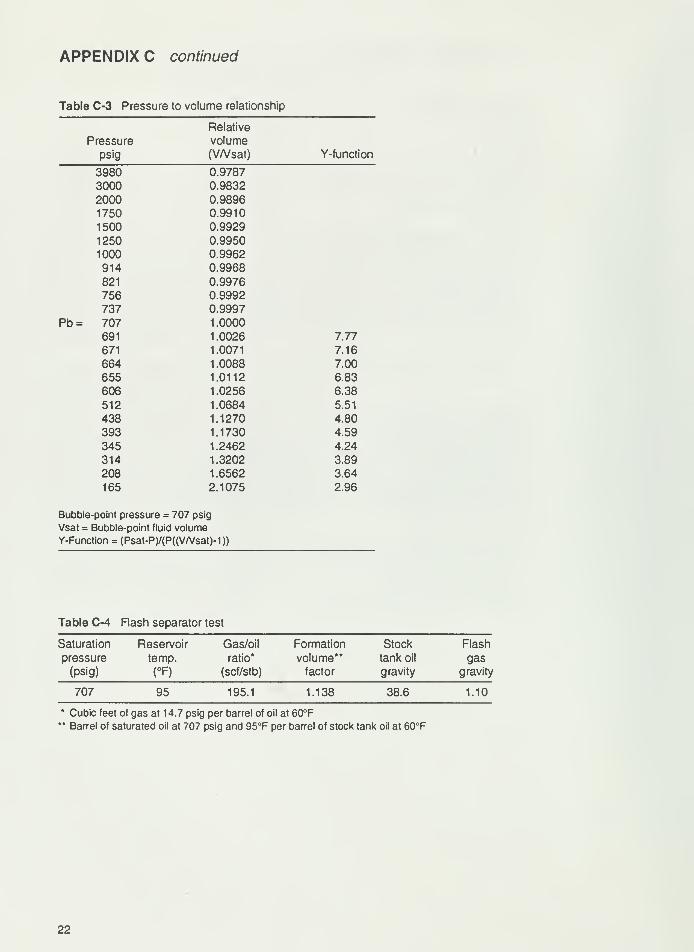
fluid gave a gas to oil ratio of 195 cubic feet per barrel. The pressure to volumerelationship and bubble-point pressure were determined by performing a con-
stant composition expansion on a portion of the recombined fluid at a reservoir
temperature of 95°F. The results of the constant composition expansion are pre-
sented in table C-3.
A single stage separator test was then carried out. The gas to oil ratio, formation
volume factor, gas gravity, gas composition, and stock tank oil gravity were deter-
mined. The data are summarized in table C-4.
A three step, differential vaporization test was carried out on the recombined fluid
at the reservoir temperature of 95°F. At each step, the equilibrium gas volume
was measured first at cell conditions and then at standard conditions after re-
moval of the gas from the cell. The gas was analyzed by gas chromatographic
technique. Results of the gas analysis are reported in tables C-6 and C-7. At
each step, a portion of the resulting oil sample was collected for determination of
oil density and the solution gas to oil ratio. Results of the analysis are reported
on table C-5.
The viscosity of the fluid was measured by a capillary viscometer at three pres-
sure points, starting from the initial reservoir pressure of 1250 psig. The results
are summarized in table C-8.
20

APPENDIX C continued
Table C-1 Field data
CompanyWell
Field
Formation
Location
County
Original reservoir pressure
Total depth
Production interval
Reservoir temperature
Date sampled
Separator temperature
Separator pressure
Well status
Gas-oil ratio (stock tank)
Water cut
Gallagher Drilling CompanyAlex No. 1
Zeigler
Aux VasesSec.19,T7S, R2EFranklin
1250 psig
2650 ft
2,61 1-2,650 ft
95°F
May 22, 1991
85°F
Atmospheric
Pumping200 scf/stb
Approximately 20%
Table C-2 PVT summary
Reservoir pressure (psig) 1250.0
Reservoir temperature (°F) 95.0
Density (g/cm3) 0.7869
Specific volume (scf/lb) 0.02036
Viscosity (Cp at 1250 psig) 1 .96
Viscosity (Cp at 800 psig) 1 .88
Formation volume factor (rb/stb) 1.138
Gas-oil ratio (scf/stb) 195.3
Compressibility coefficient (vol/vol/psixlO"6)
from 2000 psig to 4000 psig 5.46
from 1 250 psig to 2000 psig 7.37
from 703 psig to 1 250 psig 9. 1
5
Thermal expansion (V° at 95°FAfo at 77°F) 1 .008
21
APPENDIX C continued
Table C-3 Pressure to volume relationship
Relative
Pressure volume
psig (V/Vsat) Y-function
3980 0.9787
3000 0.9832
2000 0.9896
1750 0.9910
1500 0.9929
1250 0.9950
1000 0.9962
914 0.9968
821 0.9976
756 0.9992
737 0.9997
Pb = 707 1.0000
691 1.0026 7.77
671 1.0071 7.16
664 1.0088 7.00
655 1.0112 6.83
606 1.0256 6.38
512 1.0684 5.51
438 1.1270 4.80
393 1.1730 4.59
345 1.2462 4.24
314 1.3202 3.89
208 1.6562 3.64
165 2.1075 2.96
Bubble-point pressure = 707 psig
Vsat = Bubble-point fluid volume
Y-Function = (Psat-P)/(P((V/Vsat)-1))
Table C-4 Rash separator test
Saturation
pressure
(psig)
Reservoir
temp.
(°F)
Gas/oil
ratio*
(scf/stb)
Formation
volume"factor
Stock
tank oil
gravity
Flash
gas
gravity
707 95 195.1 1.138 38.6 1.10
* Cubic feet of gas at 14.7 psig per barrel of oil at 60°F** Barrel of saturated oil at 707 psig and 95°F per barrel of stock tank oil at 60°F
22

APPENDIX C continued
Table C-5 Differential vaporization at 95°F
Relative Gasoil Oil Solution expansion Gas
Pressure volume* density gas/oil" factor* deviation
(P) (Bo) (Yo) (Rs) (Bg) factor
(psig) (rb/stb) (gm/cc) (scf/stb) (scf/rcf) (Z)
707 1.138 0.7870 195.1
388 1.100 0.7878 184.4 29.71 0.88
180 1.065 0.7935 114.6 13.19 0.94
1.017 0.8151 0.0 0.93 0.99
* Volume at indicated pressure and temperature per volume of stock tank oil
at60°F** Volume of gas at 14.7 psia and 60°F per volume of stock tank oil at 60°F* Volume of gas at 14.7 psig and 60°F per volume of gas at indicated pressure
and temperature
Table C-6 Gas composition
Differential vaporization test
Casing gas 388 psig 180 psig
co2 0.20 0.45 0.58
N2 9.15 30.88 11.98
Ci 40.37 49.60 52.61
C2 17.05 9.55 17.91
c3 19.18 6.06 12.22
l-C4 2.40 0.52 0.99
N-C4 7.32 1.33 2.41
I-C5 0.99 0.13 0.31
N-C5 1.39 0.34 0.43
C6+ 1.94 1.13 0.56
23

APPENDIX C continued
Table C-7 Solution gas composition from flash
separation
707 psig 388 psig 180 psig
co2 0.22 0.51 0.48
N2 6.99 3.70 0.60
C1 27.36 26.88 19.24
c2 20.90 25.51 27.93
c3 25.88 28.68 34.31
I-C4 3.38 3.13 3.75
N-C4 9.85 8.12 9.47
I-C5 0.60 1.00 1.15
N-C5 2.13 1.29 1.45
Ce, 2.68 1.18 1.63
Table C-8 Oil viscosity at 95°F
Pressure Oil viscosity
(psig) (centi poise)
1250 1.96
707 1.88
180 2.19
24

APPENDIX D PVT ANALYSIS OF RESERVOIR FLUID(SAMPLE 1), MCCULLUM UNIT, DALECONSOLIDATED FIELD, FRANKLIN COUNTY
ProceduresPVT studies on this oil were carried out for the purpose of providing PVT data for
the ISGS reservoir simulation study of Dale Consolidated Field. The McCullumlease has been producing since September 1984, and the producing gas to oil ra-
tio of McCullum Nos. 2 and 3 wells, as measured on December 3, 1985, was1 ,917 cubic feet per stock barrel of oil. Saturation pressure of the reservoir fluid
was estimated using both the Standing (1952) and the Lasater (1958) correla-
tions, and a solution gas to oil ratio of 1 ,917 scf/stb, oil API of 36°, gas gravity of
1 .2, and reservoir temperature of 98°F. Both methods resulted in estimated bub-
ble-point pressures of more than 3,000 psi.
This saturation pressure is obviously too high for a reservoir of only 3,109 feet
deep. The reservoir has thus been producing below bubble-point pressure, and
the produced gas has included both solution and free gases.
Because information on the initial reservoir pressure, the original solution gas to
oil ratio, and the saturation pressure of the reservoir fluid was unavailable, two
reservoir fluid samples with different saturation pressures were prepared and ana-
lyzed to provide information on the sensitivity of PVT properties to the variation of
saturation pressure. The first sample was prepared with saturation pressure of
150 psig; the results of this study comprise appendix D. The second sample wasprepared with saturation pressure of 350 psig; the results of the analysis are in-
cluded in appendix E. Since it is uncertain whether any of the samples under
study represent the original reservoir fluid, extreme care must be taken when us-
ing the results.
The oil sample obtained from the well head and the casing gas were physically
recombined to give a reservoir fluid with a bubble-point pressure of 150 psig. Sub-
sequent flash separation analysis of this recombined fluid gave a gas to oil ratio
of 1 13 cubic feet of gas per barrel of stock tank oil. The pressure volume relation-
ship and bubble-point pressure were determined by performing a constant com-position expansion on a portion of the recombined fluid at a reservoir
temperature of 98°F. The results of the constant composition expansion are pre-
sented in table D-3 of this report.
A single stage separator test was then carried out. The gas to oil ratio, formation
volume factor, gas gravity, gas composition, and stock tank oil gravity were deter-
mined. These data are summarized in table D-4.
A three step, differential liberation test was carried out on the recombined fluid at
the reservoir temperature of 98°F. At each step, the equilibrium gas volume wasfirst measured at cell conditions and then at standard conditions after removal of
the gas from the cell. The gas was analyzed by gas chromatographic techniques;
the results are reported in table D-6. At each step, a portion of the resulting oil
sample was collected for the determination of oil density and solution gas to oil
ratio. The results of these analyses are reported in table D-5 .
The viscosity of the fluid was measured by capillary viscometer at three pressure
points, starting from a pressure of 1400 psig and decreasing to 10 psig. The re-
sults are summarized in table D-7.
25

APPENDIX D continued
Table D-1 Field data
CompanyWell
Field
Formation
Location
CountyTotal depth
Production interval
Reservoir temperature
Date sampledSeparator temperature
Separator pressure
Well status
Well tubing pumping pressure
Production gas to oil ratio (Dec. 3, 1985)
Water cut
Farrar Oil CompanyMcCullum Community No. 2
Dale Consolidated
Aux Vases
Sec. 24, T7S. R4EFranklin
3209 ft
3,158-3,176 ft
98°F
July 11, 1991
80°F
Atmospheric
Pumping50-100 psig
1917scf/stb
Not significant
Table D-2 PVT summary
Reservoir pressure (psig) 1250
Reservoir temperature (°F)
Density (g/cm )
98.0
0.7902
Specific volume 0.02028
Viscosity (Cp at 1250 psig) 2.24
Viscosity (Cp at 800 psig) 2.09
Formation volume factor (barrel/barrel) 1.103
Gas to oil ratio (scf/stb) 113.2
Compressibility coefficient (vol/vol/psix10-6)
from 2000 psig to 3000 psig 4.75
from 1 500 psig to 2000 psig 5.50
from 1000 psig to 1500 psig 6.80
from 500 psig to 1000 psig 7.30
from 300 Psig to 500 psig 7.80
from 1 50 psig to 300 Psig 9.60
26

APPENDIX D continued
Table D-3 Pressure to volume relationship
Pressure
(psig)
3000250020001500
1000
750500
300150
128
122
118
109
9284
75
59
50
Relative
Volume(V/Vsat)
0.9824
0.9847
0.9872
0.9900
0.9933
0.9952
0.9970
0.9986
1.0000
1.0115
1.0278
1.0432
1.0797
1.1486
1.2423
1.3282
1.4898
1.7013
Bubble-point pressure = 1 50 psig
Vsat = Bubble-point fluid volume
Table D-4 Rash separator test
Saturation
pressure
(psig)
Reservoir
temp.
(°F)
Gas/oil
ratio*
(scf/stb)
Formation
volume
factor"
Stock
tank oil
gravity*
Flash
gas
gravity
150 98 113.2 1.103 37.0 1.31
* Cubic feet of gas at 14.7 psig per barrel of oil at 60°F** Barrel of saturated oil at 150 psig and 98°F per barrel of stock tank oil at 60°F* Molecular weight of the stock tank oil = 194.6
27

APPENDIX D continued
Table D-5 Differential vaporization at 98°F
Relative Solution Gasoil Oil gas/oil" expansion
volume* density ratio factor*
Pressure (Bo) (Yo) (Rs) (Bg) Gas(psig) (rb/stb) (gm/cc) (scf/stb) (rcf/scf) gravity
2000 1.061
1000 1.085
150 1.103 0.7902 113.2
50 1.089 0.7942 92.4 4.30 1.06
10 1.062 0.7997 51.0 1.58 1.21
* Volume at indicated pressure and temperature per volume of stock tank oil at
60°F" Volume of gas at 14.7 psia and 60°F per volume of stock tank oil at 60°F* Volume of gas at 14.7 psig and 60°F per volume of gas at indicated pressure
and temperature
Table D-6 Gas composition
Field Flash Differential vaporization
gas separation (150-50) (50-10)
C02
N2
CiC2
C3
IC4
NC4
IC5NC5
C6+
AvemwGas gravity
0.25
1.14
19.23
30.40
31.22
2.84
10.32
1.32
1.77
1.51
37.61
1.31
0.19
0.91
19.29
30.49
31.31
2.84
10.35
1.33
1.77
1.52
37.63
1.31
0.36
2.38
40.54
26.15
22.40
1.46
4.57
0.63
0.85
0.68
30.22
1.05
0.33
0.36
16.30
34.02
31.98
2.75
9.76
1.24
1.71
1.56
37.94
1.32
Table D-7 Oil viscosity
Pressure Oil viscosity
(psig) (centi poise)
1400 2.24
150 2.09
50 2.19
10 2.41
28

APPENDIX E PVT ANALYSIS OF RESERVOIR FLUID(SAMPLE 2), MCCULLUM UNIT, DALECONSOLIDATED FIELD, FRANKLIN COUNTY
ProceduresThe oil sample obtained from the well head and the casing gas were physically
recombined to give a reservoir fluid with a bubble-point pressure of 350 psig. Sub-
sequent flash separation analysis of this recombined fluid gave a gas to oil ratio
of 319.4 cubic feet of gas per barrel of stock tank oil. The pressure to volume rela-
tionship and bubble-point pressure were determined by performing a constant
composition expansion on a portion of the recombined fluid at a reservoir tem-
perature of 98°F. The results of the constant composition expansion are pre-
sented in table E-3.
A single stage separator test was then carried out. The gas to oil ratio, formation
volume factor, gas gravity, gas composition, and stock tank oil gravity were deter-
mined. The data are summarized in tables E-4 and E-6.
A three step, differential liberation test was carried out on the recombined fluid at
the reservoir temperature of 98°F. At each step, the equilibrium gas volume wasmeasured first at cell conditions and then at standard conditions after removal of
the gas from the cell. The gas was analyzed by gas chromatographic technique;
the results are reported in table E-7. At each step, a portion of the resulting oil
sample was collected for the determination of oil density and solution gas to oil
ratio. The results of the analysis are reported in table E-5.
The viscosity of the fluid was measured by capillary viscometer at three pressure
points, starting from a pressure of 1500 psig and decreasing to 10 psig. The re-
sults are summarized in table E-8.
29

APPENDIX E continued
Table E-1 Field data
CompanyWell
Field
Formation
Location
County
Original reservoir pressure
Total depth
Production interval
Reservoir temperature
Date sampled
Separator temperature
Separator pressure
Well status
Gas to oil ratio (stock tank)(Dec. 3, 1985)
Water cut
Farrar Oil CompanyMcCullum Community No. 2
Dale Consolidated
Aux VasesSec. 24, T7S, R4EFranklin
1250 psig
3,209 ft
3,158-3,176 ft
98°F
July 11, 1991
80°F
Atmospheric
Pumping1917scf/stb
No
Table E-2 PVT summary
Reservoir pressure ( psig) 1250
Reservoir temperature (°F) 98.0
Density (g/cm3) 0.7902
Specific volume (scf/lb) 0.02028
Viscosity (Cp at 1 400 psig) 1 .35
Viscosity (Cp at 350 psig) 1 .24
Formation volume factor (barrel/barrel) 1.213
Gas to oil ratio (scf/stb) 319.4
Compressibility coefficient (vol/vol/psixlO"6)
from 2000 psig to 3000 psig 5.84
from 1 500 psig to 2000 psig 7.35
from 1000 psig to 1500 psig 8.60
from 500 psig to 1 000 psig 9.60
30

APPENDIX E continued
Table E-3 Pressure to volume relationship
Relative
Pressure volume
(psig) (V/V„t)
3000250020001500
13001100
900700500360350335315292
250180
0.9803
0.9829
0.9868
0.9906
0.9923
0.9936
0.9953
0.9970
0.9987
0.9999
1.0000
1.0500
1.1180
1.2100
1.3800
1.5825
Bubble-point pressure = 350 psig
Vsat = Bubble point fluid volume
Table E-4 Rash separator test
Saturation
pressure
(psig)
Reservoir
temp.
(°F)
Gas/oil
ratio*
(scf/stb)
Formation
volume
factor"
Stock
tank oil
gravity
Flash
gas
gravity
350 98 319.4 1.213 37.0 1.30
* Cubic feet of gas at 14.7 psig per barrel of oil at 60°F** Barrel of saturated oil at 350 psig and 98°F per barrel of stock tank oil at 60°F
31

APPENDIX E continued
Table E-5 Differential vaporization at 98°F
Pressure
(psig)
Relative
oil
volume*
(Bo)
Oil
density
(lb)
Solution
gas/oil
factor**
(Rs)
Gasexpansion*
(Bg) (Y3)
2000 1.197
1000 1.205
350 1.213 0.763 319.4
250 1.190 0.773 292.0 17.9 0.94
150 1.130 0.784 245.1 10.7 1.00
65 1.069 0.795 164.5 4.5 1.20
15 1.030 0.805 82.9 2.1 1.40
1.017 0.822 0.0 1.57
* Volume at indicated pressure and temperature per volume of stock tank oil
at60°F** Volume of gas at 14.7 psia and 60°F per volume of stock tank oil at 60°F* Volume of gas at 14.7 psig and 60°F per volume of gas at indicated pressure
and temperature
Table E-6 Gas composition
Flash separation test
Casing gas (350 psig) (15 psig)
CG-2 0.25 0.29 0.06
N2 1.14 0.71 0.08
Ci 19.23 17.75 0.59
c2 30.40 30.70 23.07
c3 31.22 33.88 51.09
IC4 2.84 2.81 4.63
NC4 10.32 9.41 15.21
ic5 1.32 1.04 1.64
NC5 1.77 1.37 2.09
c6+ 1.51 1.05 1.53
Avemw 37.61 37.39 45.17
Gas gravity 1.31 1.30 1.57
32

APPENDIX E continued
Table E-7 Gas composition from differential vaporization tests
(350-250) (250-150) (150-65) (65-10)
psig psig psig psig
0.45 0.48 0.23
3.37 0.51 0.02
40.23 19.15 4.99
30.77 40.76 36.58
20.73 29.58 41.87
0.98 1.89 3.12
2.60 5.76 9.93
0.26 0.58 1.03
0.34 0.75 1.36
0.27 0.55 0.88
28.73 34.60 40.44
Gas gravity 0.94 1.00 1.20 1.40
CC-2 0.39
N2 7.98
Ci 47.39
c2 24.09
c3 15.57
IC4 0.80
NC4 2.28
IC5 0.31
NC5 0.45
C6+ 0.73
Avemw 27.10
Table E-8 Oil viscosity
Pressure Oil viscosity
(psig) (centipoise)
1500 1.50
350 1.39
150 2.33
65 2.44
10 2.69
33

APPENDIX F PVT ANALYSIS OF RESERVOIR FLUID,
ENERGY FIELD,WILLIAMSON COUNTY
Procedures
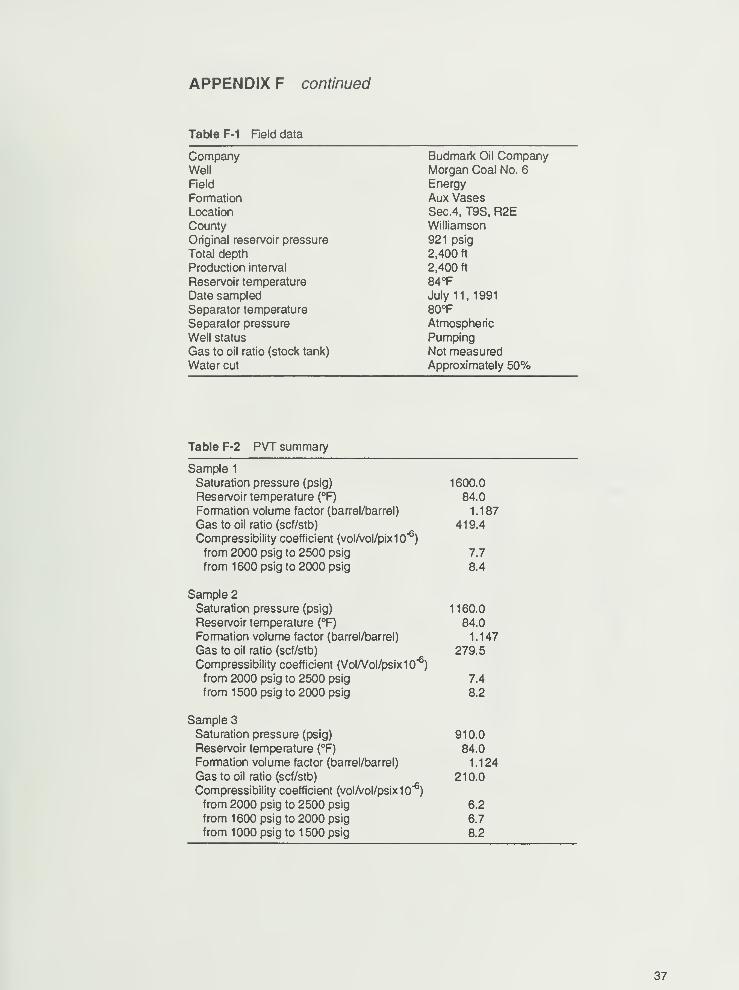
Casing gas and well head oil were collected from the Morgan Coal No. 6 well of
Energy Field in Williamson County, Illinois, for the purpose of performing reser-
voir fluid analyses. Because of uncertainty regarding the actual solution gas to oil
ratio and original reservoir fluid saturation pressure, it was decided to recombine
the well head oil with different amounts of solution gas to produce three reservoir
fluids of varying gas to oil ratios. The basic PVT properties of these samples,
such as saturation pressure, gas to oil ratio, and oil formation volume factors,
were determined and later summarized (table F-2).
The pressure to volume relationship and bubble-point pressure were determined
by performing a constant composition expansion on each of these recombined
fluids at a reservoir temperature of 84°F. The results of the constant composition
expansion are presented in tables F-3 to F-5.
A single stage separator test on the sample with saturation pressure of 910 psig
was then carried out. The gas to oil ratio, formation volume factor, gas gravity,
gas composition, and stock tank oil gravity were determined. The data are sum-marized in table F-6.
A three step, differential vaporization test was carried out on the same recom-
bined fluid at the reservoir temperature of 84°F. At each step, the equilibrium gas
volume was first measured at cell conditions and then at standard conditions
after removal of the gas from the cell. The gas was analyzed by gas chroma-
tographic technique; the results are reported in table F-8. At each step, a portion
of the resulting oil sample was collected for the determination of oil density and
solution gas to oil ratio. The results of the analysis are reported in table F-7.
The viscosity of the fluid was measured by capillary viscometer at four pressure
points, starting from the initial pressure of 2,000 psig. The results are summa-rized in table F-9.
Discussion
The basic PVT properties of three recombined reservoir fluid samples obtained
by recombination of the casing gas and well-head oil produced from the MorganCoal No. 6 well were measured. From the results presented in table F-2 and fig-
ures F-1 and F-2, the relationships between saturation pressure, solution gas to
oil ratio, and oil formation volume factor are close to linear within the limits of in-
vestigation. These relationships can be used by reservoir or production engi-
neers for the calculation of oil reserves as well as for planning production
strategy.
The differential vaporization test of sample 3 was performed giving the oil forma-
tion volume factors, gas to oil ratios, oil density, gas expansion factors, and oil
viscosity at the pressures of 400 psig and 100 psig. As shown on table F-7, the
change in PVT properties is much smaller near the initial bubble-point pressure
of 910 psig than at a lower saturation pressure of 100 psig. This observation is a
reflection of the facts that (a) the solubilities of gases in the oil phase are in the
order of N2 < C1 < CO2 < 62 < C3 < C4; and (b) the effect of dissolved gases on
the oil swelling and oil viscosity reduction are also in the same order of N2 <
C1 < CO2 < C2 < C3 < C4; and (c) the solution gases of the Energy Field contain
34

800 900 1000 1100 1200 1300 1400 1500 1600 1700
Saturation pressure (psig)
Figure F-1 Saturation pressure relative to B (Energy Field, Morgan
Coal No. 6).
450-
o 400-*^o</>
o 350-
m
o 300-
tnro
250-o3O 200-w
150-
800 900 1000 1100 1200 1300 1400 1500 1600 1700
Saturation pressure (psig)
Figure F-2 Saturation pressure relative to GOR (Energy Field,
Morgan Coal No. 6).
relatively large amounts of nitrogen (15.96%), propane (13.27%) and butane
(5.32%).
During differential vaporization, as the pressure of the sample is decreased, the
less soluble nitrogen and methane are being released from the reservoir fluid. Asshown in table F-8, the composition of the gases liberated from 910 to 400 psig
contain 37.32% of nitrogen and 46.08% of methane. The volume of gases re-
leased is only 21% of the total solution gas. The change in physical properties
such as oil swelling and viscosity reduction are minimal because (1 ) the effects
of dissolved nitrogen and methane on the oil swelling and viscosity reduction are
smaller, and they are also partly counter-balanced by the increase in pressure re-
quired to dissolve to gases; and (2) the amount of gas dissolved per unit pres-
sure is smaller.
At low saturation pressure, the change in oil properties measured reflects the ef-
fect of dissolved propane and butane on the oil. Their solubilities are large, andthe effect on the volume and viscosity is much more pronounced for a small
change in pressure.
35

This observation may partially explain the rapid decline in reservoir pressure dur-
ing primary production. For a solution gas drive reservoir, the amount of gases re-
leased during the initial phase of pressure depletion is small, and thus does not
provide a strong driving force for the production of oil.
Conversely, most of the dissolved gases, such as propane and butane, are kept
in solution up to relatively low pressure. Thus a lower oil viscosity and higher oil
saturation will be maintained and help to improve oil recovery during the water-
flood phase of the project.
36
APPENDIX F continued
Table F-1 Field data
CompanyWell
Field
Formation
Location
County
Original reservoir pressure
Total depth
Production interval
Reservoir temperature
Date sampled
Separator temperature
Separator pressure
Well status
Gas to oil ratio (stock tank)
Water cut
Budmark Oil CompanyMorgan Coal No. 6
Energy
Aux VasesSec.4, T9S, R2EWilliamson
921 psig
2,400 ft
2,400 ft
84°F
July 11, 1991
80°F
Atmospheric
PumpingNot measuredApproximately 50%
Table F-2 PVT summary
Sample 1
Saturation pressure (psig) 1600.0
Reservoir temperature (°F) 84.0
Formation volume factor (barrel/barrel) 1.187
Gas to oil ratio (scf/stb) 419.4
Compressibility coefficient (vol/vol/pixlO"6
)
from 2000 psig to 2500 psig 7.7
from 1600 psig to 2000 psig 8.4
Sample 2
Saturation pressure (psig) 1160.0
Reservoir temperature (°F) 84.0
Formation volume factor (barrel/barrel) 1.147
Gas to oil ratio (scf/stb) 279.5
Compressibility coefficient (VolA/ol/psixlO"6
)
from 2000 psig to 2500 psig 7.4
from 1500 psig to 2000 psig 8.2
Sample 3
Saturation pressure (psig) 910.0
Reservoir temperature (°F) 84.0
Formation volume factor (barrel/barrel) 1.124
Gas to oil ratio (scf/stb) 210.0
Compressibility coefficient (vol/vol/psixlO"6)
from 2000 psig to 2500 psig 6.2
from 1600 psig to 2000 psig 6.7
from 1000 psig to 1500 psig 8.2
37

APPENDIX F continued
Table F-3 Pressure to volume relationship of sample 1 at
reservoir temperature of 84°F
Relative
Pressure Volume(psig) (V/Vb)
2500 0.994
2000 0.998
1800 0.999
Pb= 1600 1.000
1550 1.006
1434 1.029
1326 1.050
1230 1.069
903 1.178
594 1.437
370 2.008
213 3.178
Relative volume =Total volume
Oil volume at bubble-point pressure
Table F-4 Pressure to volume relationship of sample 2 at
reservoir temperature of 84°F
Pressure Bo(psig) (V/Vsat)
2494 0.988
2012 0.991
1523 0.996
1310 0.998
Pb= 1160 1.000
1108 1.006
1065 1.013
996 1.025
926 1.043
849 1.062
663 1.149
550 1.241
439 1.391
341 1.622
286 1.821
234 2.116
Relative volume =Total volume
Oil volume at bubble-point pressure
38

APPENDIX F continued
Table F-5 Pressure to volume relationship of sample 3 at
reservoir temperature of 84°F
Pressure
(psig)
Relative volume
(V/Vb)
2500 0.988
2000 0.992
1500 0.995
1221 0.997
1010 0.999
Pb= 910 1.000
869 1.005
846 1.010
816 1.017
791 1.024
747 1.036
667 1.064
541 1.134
460 1.209
375 1.328
305 1.478
263 1.630
Relative volume =To fa/ volume
Oil volume at bubble-point pressure
Table F-6 Flash separator test
Saturation
pressure
(psig)
Reservoir
temp.
(°F)
Gas/oil
ratio*
(scf/stb)
Formation
volume
factor"
Stock
tank oil
gravity
Flash
gas
gravity
910 84 210.0 1.124 38.8 1.03
* Cubic feet of gas at 14.7 psig per barrel of oil at 60°F** Barrel of saturated oil at 910 psig and 84°F per barrel of stock tank oil at 60°F
39

APPENDIX F continued
Table F-7. Differential vaporization of reservoir fluid (sample 3) at 84°F
Pressure
(psig)
(P)
Oil
volumefactor*
(rb/stb)
(Bo)
Solution
gas/oil
ratio**
(scf/stb)
(Rs)
Gasexpansion
factor*
(cuft/cuft)
(Bg)
Oil
density
(gm/cm )
Gasspecific
gravity
(air=1)
2500 1.111
1500 1.118
910 1.124 210.1 0.783
400 1.072 166.2 31.1 0.85
100 1.039 65.1 8.4 0.795 0.92
1.011
* Volume at indicated pressure and temperature per volume of stock tank oil
at 60°F** Volume of gas at 14.7 psia and 60°F per volume of stock tank oil at 60°F* Volume of gas at 14.7 psig and 60°F per volume of gas at indicated pressure
and temperature
Table F-8 Gas composition
Flash
separator Differential vaporation
test test
910 400 100Casing gas psig psig psig
co2 0.30 1.20 0.85 1.82
N2 12.49 15.96 37.32 12.91
Ci 32.58 35.57 46.08 46.09
c2 22.60 24.53 9.33 23.96
c3 17.44 13.27 3.81 10.98
IC4 2.05 1.55 0.33 0.81
NC4 7.45 5.32 1.06 2.22
IC5 1.16 0.71 0.21 0.30
NC5 1.74 1.02 0.38 0.44
Cs+ 1.88 0.87 0.63 0.43
Avemw 32.58 30.24 24.4 26.53
Gas gravity 1.13 1.05 0.8 0.92
Table F-9 Viscosity of reservoir
fluid (sample 3) at 84°F
Pressure
(psig)
Viscosity
(Cp)
2000 1.64
910 1.55
400 1.80
100 2.31
40

APPENDIX G SAMPLE CALCULATION USING EQUATION 1
Example calculation of bubble-point pressure using equation 1
Where
API gravity of oil = 38.8
Molecular weight of oil = 199.3
Solution gas to oil ratio = 419.4 scf/stb
Reservoir temperature = 84°F
Density of oil (Yo)=131
1
^1
4a8
= 0.831 gm/cc
Rs
Mole fraction of gas (Yg)=379.3
Rs379.3
+ 350 x
419.4
379.3
MW
419.4+ 350 x
0.831
379.3 199.3
= 0.4311
Calculation of pseudo critical temperature of gas mixture
Tc Xci
N2 -232.4 17.49
C02 87.9 0.33
Ci -116.6 37.46
c2 90.1 24.46
c3 206 14.00
IC4 275 1.47
NC4 305.7 3.49
ICs 369.1 0.43
NC5 380.7 0.84
Where
Tcm of gas mixture = Ixj TC i= -13.66
65.23 (460+84) (0.679 Exp (2.786YQ) -0.323)b " (60-13.66)
= 1480 psi
41


^ O a z -Q. 3- —l-
2J.E
Q. fl)en J
5 3 m c-^ g
CO T3 o>0) w
CO 03 CO
$CD'3 o
CD
20CDCO
s=5 0) o ft
cco
I
-
CD
croQ.
coCDCO
cs
33 o 03c CO
CD
CO
CDCD
<CD 51
a
<J> Z2'—
£> CO c/
c? cQ. <
CD<
9)
Zo c om c to z33 X u D2 CD
Tl"° 5
3 $ > o 2^ zz > D to Z!
o _r- £§m s