Embed Size (px)
Citation preview
Pressure, temperature and fluid conditions during emerald
precipitation, southeastern Yukon, Canada: fluid inclusion and
stable isotope evidence
Dan Marshalla,*, Lee Groatb, Gaston Giulianic, Don Murphyd, Dave Matteye,T. Scott Ercitf, Michael A. Wiseg, William Wengzynowskih, W. Douglas Eatonh
aEarth Sciences Department, Simon Fraser University, Burnaby, BC, Canada V5A 1S6bEarth and Ocean Sciences, University of British Columbia, Vancouver, BC, Canada V6T 1Z4
cCentre de Recherches Petrographiques et Geochimiques, UPR A 6821, 15 rue Notre Dame des Pauvres, BP 20,
54501 Vandoeuvre-les-Nancy Cedex, FrancedYukon Geology Program, Government of the Yukon, Whitehorse, YT, Canada Y1A 2C6
eDepartment of Geology, Royal Holloway, University of London, Egham Hill, Egham, Surrey TW20 OEX, UKfResearch Division, Canadian Museum of Nature, Box 3443, Station D, Ottawa, ON, Canada K1P 6P4
gSmithsonian Institute, Mineral Sciences NHB119, Washington, DC 20560-0119, USAhExpatriate Resources Limited and Archer Cathro & Associates (1981) Limited, 1016-510 West Hastings Street,
Vancouver, BC, Canada V6B 1L8
Received 30 November 2001; received in revised form 3 May 2002
Abstract
The Crown emerald veins are somewhat enigmatic, displaying characteristics that are common to emerald deposits of
tectonic–hydrothermal origin and of igneous origin. The veins cut the Fire Lake mafic meta-volcanic rocks, occurring within
600 m of an outcrop of Cretaceous S-type granite. Field work and vein petrography are consistent with a polythermal origin for
the veins. The primary vein mineralogy is quartz and tourmaline with variable sized alteration haloes consisting of tourmaline,
quartz, muscovite, chlorite and emerald. The veins weather a buff brown colour due to jarosite, scheelite and minor
lepidocrocite, which were precipitated during the waning stages of vein formation. Microthermometic studies of primary fluid
inclusions within emerald growth zones are consistent with emerald precipitation from H2O–CO2–CH4 (FN2FH2S) bearing
saline brines. The estimated fluid composition is approximately 0.9391 mol% H2O, 0.0473 mol% CO2, 0.0077 mol% CH4 and
0.0059 mol% NaCl (f 2 wt.% NaCl eq.). Fluid inclusion and stable isotope studies are consistent with vein formation in the
temperature range 365–498 jC, with corresponding pressures along fluid inclusion isochore paths ranging from 700 to 2250
bars. These data correlate with a very slow uplift rate for the region of 0.02–0.07 mm/year.
Emerald deposits are generally formed when geological conditions bring together Cr (FV) and Be. Cr and V are presumed
to have been derived locally from the mafic and ultramafic rocks during hydrothermal alteration. The Be is most likely derived
from the nearby Cretaceous granite intrusion.
D 2002 Elsevier Science B.V. All rights reserved.
Keywords: Fluid inclusions; Stable isotopes; Emerald; Thermobarometry; Yukon
0009-2541/02/$ - see front matter D 2002 Elsevier Science B.V. All rights reserved.
PII: S0009 -2541 (02 )00277 -2
* Corresponding author. Fax: +1-604-291-4198.
E-mail address: [email protected] (D. Marshall).
www.elsevier.com/locate/chemgeo
Chemical Geology 194 (2003) 187–199
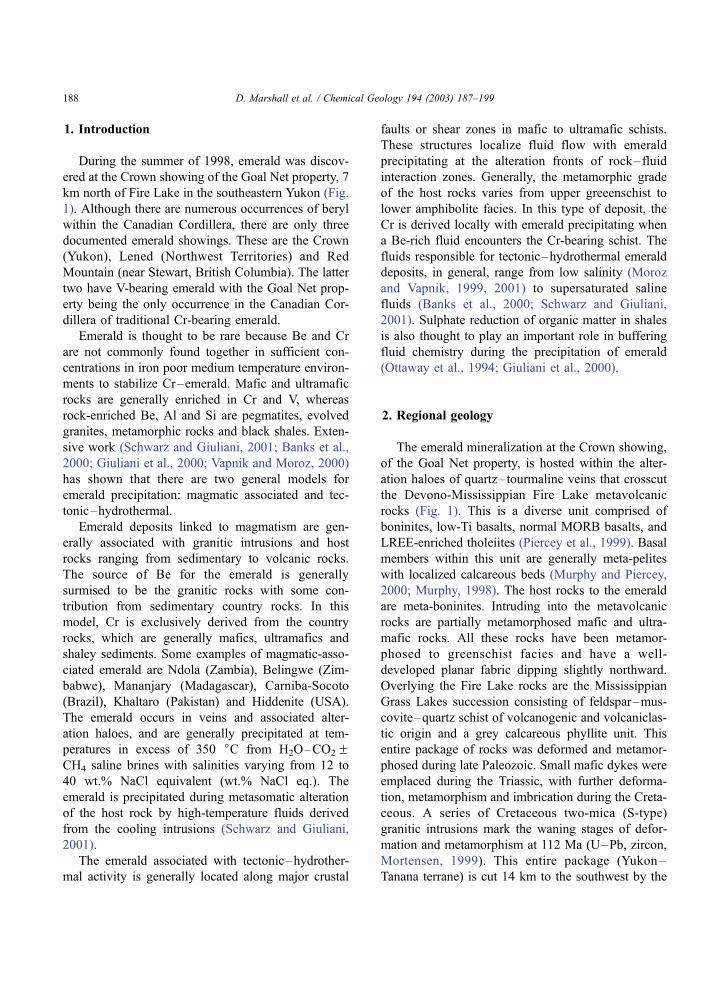
1. Introduction
During the summer of 1998, emerald was discov-
ered at the Crown showing of the Goal Net property, 7
km north of Fire Lake in the southeastern Yukon (Fig.
1). Although there are numerous occurrences of beryl
within the Canadian Cordillera, there are only three
documented emerald showings. These are the Crown
(Yukon), Lened (Northwest Territories) and Red
Mountain (near Stewart, British Columbia). The latter
two have V-bearing emerald with the Goal Net prop-
erty being the only occurrence in the Canadian Cor-
dillera of traditional Cr-bearing emerald.
Emerald is thought to be rare because Be and Cr
are not commonly found together in sufficient con-
centrations in iron poor medium temperature environ-
ments to stabilize Cr–emerald. Mafic and ultramafic
rocks are generally enriched in Cr and V, whereas
rock-enriched Be, Al and Si are pegmatites, evolved
granites, metamorphic rocks and black shales. Exten-
sive work (Schwarz and Giuliani, 2001; Banks et al.,
2000; Giuliani et al., 2000; Vapnik and Moroz, 2000)
has shown that there are two general models for
emerald precipitation: magmatic associated and tec-
tonic–hydrothermal.
Emerald deposits linked to magmatism are gen-
erally associated with granitic intrusions and host
rocks ranging from sedimentary to volcanic rocks.
The source of Be for the emerald is generally
surmised to be the granitic rocks with some con-
tribution from sedimentary country rocks. In this
model, Cr is exclusively derived from the country
rocks, which are generally mafics, ultramafics and
shaley sediments. Some examples of magmatic-asso-
ciated emerald are Ndola (Zambia), Belingwe (Zim-
babwe), Mananjary (Madagascar), Carniba-Socoto
(Brazil), Khaltaro (Pakistan) and Hiddenite (USA).
The emerald occurs in veins and associated alter-
ation haloes, and are generally precipitated at tem-
peratures in excess of 350 jC from H2O–CO2FCH4 saline brines with salinities varying from 12 to
40 wt.% NaCl equivalent (wt.% NaCl eq.). The
emerald is precipitated during metasomatic alteration
of the host rock by high-temperature fluids derived
from the cooling intrusions (Schwarz and Giuliani,
2001).
The emerald associated with tectonic–hydrother-
mal activity is generally located along major crustal
faults or shear zones in mafic to ultramafic schists.
These structures localize fluid flow with emerald
precipitating at the alteration fronts of rock–fluid
interaction zones. Generally, the metamorphic grade
of the host rocks varies from upper greeenschist to
lower amphibolite facies. In this type of deposit, the
Cr is derived locally with emerald precipitating when
a Be-rich fluid encounters the Cr-bearing schist. The
fluids responsible for tectonic–hydrothermal emerald
deposits, in general, range from low salinity (Moroz
and Vapnik, 1999, 2001) to supersaturated saline
fluids (Banks et al., 2000; Schwarz and Giuliani,
2001). Sulphate reduction of organic matter in shales
is also thought to play an important role in buffering
fluid chemistry during the precipitation of emerald
(Ottaway et al., 1994; Giuliani et al., 2000).
2. Regional geology
The emerald mineralization at the Crown showing,
of the Goal Net property, is hosted within the alter-
ation haloes of quartz–tourmaline veins that crosscut
the Devono-Mississippian Fire Lake metavolcanic
rocks (Fig. 1). This is a diverse unit comprised of
boninites, low-Ti basalts, normal MORB basalts, and
LREE-enriched tholeiites (Piercey et al., 1999). Basal
members within this unit are generally meta-pelites
with localized calcareous beds (Murphy and Piercey,
2000; Murphy, 1998). The host rocks to the emerald
are meta-boninites. Intruding into the metavolcanic
rocks are partially metamorphosed mafic and ultra-
mafic rocks. All these rocks have been metamor-
phosed to greenschist facies and have a well-
developed planar fabric dipping slightly northward.
Overlying the Fire Lake rocks are the Mississippian
Grass Lakes succession consisting of feldspar–mus-
covite–quartz schist of volcanogenic and volcaniclas-
tic origin and a grey calcareous phyllite unit. This
entire package of rocks was deformed and metamor-
phosed during late Paleozoic. Small mafic dykes were
emplaced during the Triassic, with further deforma-
tion, metamorphism and imbrication during the Creta-
ceous. A series of Cretaceous two-mica (S-type)
granitic intrusions mark the waning stages of defor-
mation and metamorphism at 112 Ma (U–Pb, zircon,
Mortensen, 1999). This entire package (Yukon–
Tanana terrane) is cut 14 km to the southwest by the
D. Marshall et al. / Chemical Geology 194 (2003) 187–199188
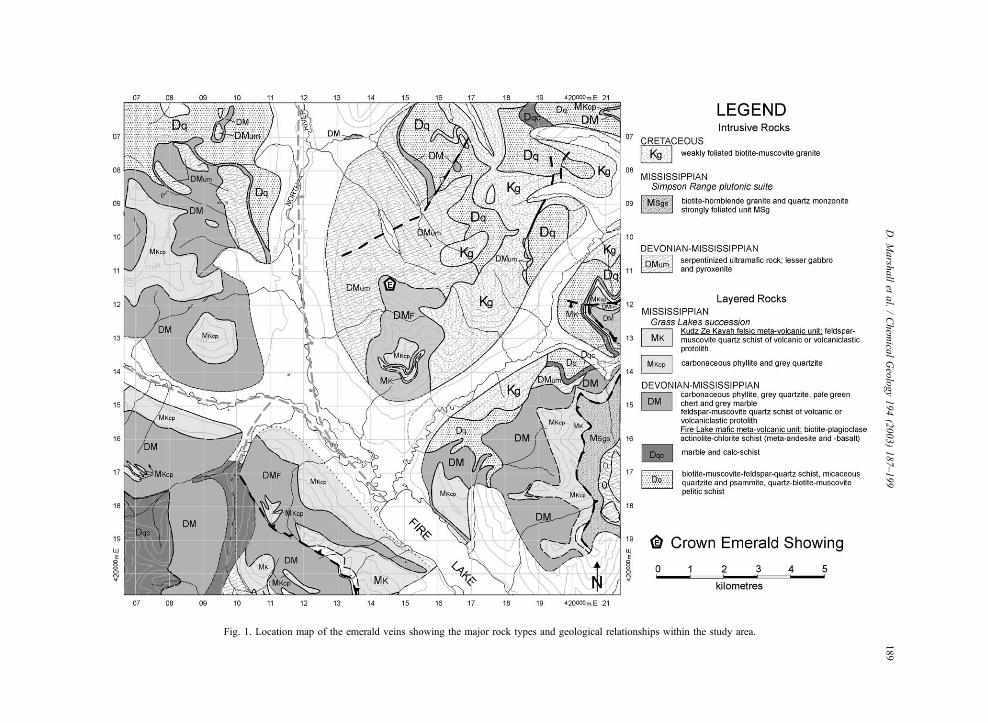
Fig. 1. Location map of the emerald veins showing the major rock types and geological relationships within the study area.
D.Marsh
allet
al./Chem
icalGeology194(2003)187–199
189

Tintina fault system, a major crustal feature with 450
km of right lateral displacement (Roddick, 1967).
There are eight distinct emerald zones within a few
hundred square meters. The closest Cretaceous granite
outcrop occurs 600 m to the southeast of the emerald
zones, but field mapping suggests the Cretaceous
granite may be present approximately 500 m below
the emerald veins. There are numerous generations of
quartz veins in the general area of the granite and the
emerald mineralization. These range from pure quartz
veins of 1 m in width to narrower quartz–tourmaline
veins. Due to the limited exposure, the maximum
length of the quartz veins has not been determined.
Some quartz and quartz–tourmaline veins cut the
granite indicating that at least some of the veins
postdate the granite. No veins hosting emerald have
been traced into the granite and there is no field
evidence suggesting a relationship between the emer-
ald and the granite. On the other hand, none of the
geological evidence suggests that the emerald miner-
alization is not related to the granite.
3. Petrology
The emerald zones consist of quartz–tourmaline
veins with a muscovite–tourmaline alteration halo
(Fig. 2). The mineralogy within the halo consists of
chlorite–muscovite– tourmaline–quartz–scheelite–
jarosite. The emerald occurs in vug-like structures
almost exclusively within the alteration halo and
rarely in the quartz vein. The alteration halo is up to
1.5 m thick but may be absent in places. The emeralds
are up to 4 cm in length. They are a deep green colour
and have good clarity.
Petrographic examination of the veins suggests that
the primary mineral assemblage within the veins is
quartz–tourmaline. At the vein–halo interface, the
stable mineral assemblage is quartz– tourmaline–
muscovite–chlorite–emerald. Jarosite, lepidocrocite
and scheelite are present in the alteration halo, but
appear to be late in the alteration assemblage. Schee-
lite fills cracks in brittlely deformed tourmaline and is
interpreted to have precipitated during the waning
stages of hydrothermal alteration. The jarosite is fine
grained, and when altered, gives the haloes a yellow-
ish colour and a clay-like appearance where present in
significant quantity.
The emerald has been studied in detail by Groat et
al. (in press). It is Cr-bearing with concentrations of
up to 7816 ppm and V contents in up to 333 ppm.
These values are similar to a number of emerald
deposits worldwide, most notably those of Pakistan
and Somondoco, Colombia. The tourmaline proximal
to the veins is generally dravite, while the distal
tourmaline found in quartz veins and in the granite
is usually schorl or dravite. Tourmaline found as solid
inclusions within the emerald has compositions, deter-
mined by electron microprobe analyses, ranging from
dravite to uvite. Other solid inclusions found within
Fig. 2. Schematic cross-section of a quartz tourmaline vein showing the relationship to the overlying ultramafic rocks, alteration halo and
emerald distribution. Qtz: quartz, Tm: tourmaline, Em: Emerald, Chl: Chlorite, Sch: Schist.
D. Marshall et al. / Chemical Geology 194 (2003) 187–199190
the emerald, using scanning electron microscopy, are
calcite, chalcopyrite, molybdenite, phlogopite, pyrite,
quartz, scheelite and zircon.
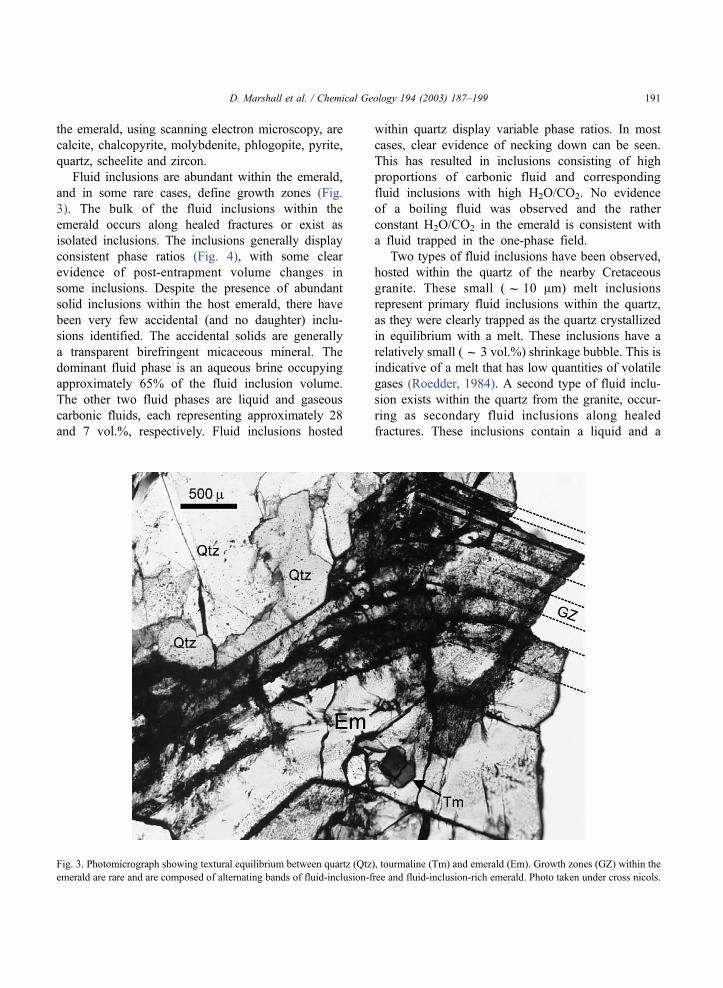
Fluid inclusions are abundant within the emerald,
and in some rare cases, define growth zones (Fig.
3). The bulk of the fluid inclusions within the
emerald occurs along healed fractures or exist as
isolated inclusions. The inclusions generally display
consistent phase ratios (Fig. 4), with some clear
evidence of post-entrapment volume changes in
some inclusions. Despite the presence of abundant
solid inclusions within the host emerald, there have
been very few accidental (and no daughter) inclu-
sions identified. The accidental solids are generally
a transparent birefringent micaceous mineral. The
dominant fluid phase is an aqueous brine occupying
approximately 65% of the fluid inclusion volume.
The other two fluid phases are liquid and gaseous
carbonic fluids, each representing approximately 28
and 7 vol.%, respectively. Fluid inclusions hosted
within quartz display variable phase ratios. In most
cases, clear evidence of necking down can be seen.
This has resulted in inclusions consisting of high
proportions of carbonic fluid and corresponding
fluid inclusions with high H2O/CO2. No evidence
of a boiling fluid was observed and the rather
constant H2O/CO2 in the emerald is consistent with
a fluid trapped in the one-phase field.
Two types of fluid inclusions have been observed,
hosted within the quartz of the nearby Cretaceous
granite. These small (f 10 Am) melt inclusions
represent primary fluid inclusions within the quartz,
as they were clearly trapped as the quartz crystallized
in equilibrium with a melt. These inclusions have a
relatively small (f 3 vol.%) shrinkage bubble. This is
indicative of a melt that has low quantities of volatile
gases (Roedder, 1984). A second type of fluid inclu-
sion exists within the quartz from the granite, occur-
ring as secondary fluid inclusions along healed
fractures. These inclusions contain a liquid and a
Fig. 3. Photomicrograph showing textural equilibrium between quartz (Qtz), tourmaline (Tm) and emerald (Em). Growth zones (GZ) within the
emerald are rare and are composed of alternating bands of fluid-inclusion-free and fluid-inclusion-rich emerald. Photo taken under cross nicols.
D. Marshall et al. / Chemical Geology 194 (2003) 187–199 191

vapour phase at room temperature. The vapour occu-
pies approximately 5 vol.% of the inclusion at room
temperature. These two-phase inclusions have not
been observed in the emerald veins.
4. Emerald vein fluid inclusion data
The fluid inclusion data from the emerald veins
are derived from inclusions hosted within emerald.
Reconnaissance observations of three-phase fluid
inclusions hosted within quartz from the emerald
veins indicate that the quartz hosted fluid inclusions
contain the same fluid as the inclusions hosted
within the emerald. Due to the petrographic evi-
dence of post-entrapment volume changes within
the quartz-hosted fluid inclusions, it was deemed
superfluous to collect data from the quartz. Hence,
the data and interpretation is based upon the fluid
inclusions in emerald. However, this data can be
Fig. 4. Typical three-phase fluid inclusions hosted within emerald from three different emerald (Em) specimens. (A) Sample 10-1-C1: slightly
stretched fluid inclusion after heating to approximately 350 jC. (B) Relatively flat fluid inclusion, used for initial estimate of vapour fraction
within the fluid inclusion population, showing the relative proportions of Aqueous Liquid (Laq), Carbonic Liquid (Lc) and Carbonic Vapour
(Vc). (C) Sample 10-1-C2: three phase inclusions prior to any measurements showing consistent phase ratios between different fluid inclusions.
All photos taken at room temperature in plane polarized light.
D. Marshall et al. / Chemical Geology 194 (2003) 187–199192

extrapolated to the quartz as petrographic and fluid
inclusion evidence indicates that quartz coprecipi-
tated with the emerald.
Microthermometric data were obtained from dou-
bly polished mineral plates utilizing a Linkam THMS-
G 600 heating–freezing stage on an Olympus BX50
microscope equipped with 40� and 100� long
working distance Olympus objectives. The stage is
capable of measurements in the � 190 to + 500 jCrange. The stage was calibrated with two synthetic
fluid inclusions having four readily observable phase
transitions at � 56.6, 0.0, 10.0 and 374.1 jC. Thestage was periodically checked against the standards
and results were always within F 0.1 jC of the two
low temperature standards and within 0.5 jC of the
higher temperature phase transition. From these meas-
urements, we conclude that the (2r) error is less thanF 0.1 jC for temperatures below 50 jC and 0.5 jCfor temperatures in excess of 50 jC.
Upon cooling from room temperature to � 190 jC,the three-phase fluid inclusions nucleate three addi-
tional phases. At approximately � 36 jC, clathratenucleates. This is followed closely by the formation of
ice at approximately � 48 jC. Solid CO2 nucleates at
approximately � 101 jC.Heating of the fluid inclusions from � 190 jC
results in numerous phase changes. The first occurs at
approximately � 70 jC. The solids in the inclusions
darken slightly, and occasionally, there are cracks
developed in the solids. Solid CO2 melts over the
temperature range � 64 to � 56.6 jC (Fig. 5, Table
1). Continued heating results in continuous melting of
ice in the inclusions commencing at an average
eutectic temperature of � 20.1 jC, with ice melting
temperatures occurring over the temperature interval
� 8.1 to � 0.5 jC. Further heating reveals final
clathrate melting temperatures in the 7.4–12.1 jCrange (Fig. 6). More heating results in the homoge-
nization of the carbonic fluids into the vapour (dew-
point transition) over the temperature range 22.3–
29.8 jC. Final homogenization to the liquid takes
place over the temperature range 259–367 jC (Fig.
7). Many of the fluid inclusions decrepitate prior to
total homogenization, and some inclusions show evi-
dence of stretching such as cracks and enlarged
vapour bubbles. Smaller inclusions are less likely to
stretch and our observations are consistent with total
homogenization temperatures in the range 260–310
jC, with minor stretching generally accounting for the
higher homogenization temperatures.
Freezing point depression of solid CO2 within the
inclusions is indicative of additional gas species. The
two most likely gases are CH4 and N2. Clathrate
melting temperatures in excess of 10.0 jC are indi-
cative of CH4, as its presence expands the clathrate
stability field (Diamond, 1992). N2 has the opposite
effect lowering the clathrate melting temperature. The
high clathrate melting temperatures are indicative of
CH4 in the inclusions, but do not negate the presence
of N2. Raman studies to determine the gas composi-
tions of the fluid inclusions in emerald have been
unsuccessful as the emerald fluoresce and mask any
Raman peaks. Crushing studies in paraffin and glyc-
erol have been inconclusive in determining gas com-
positions.
It is evident from the variable solid CO2 and
clathrate melting temperatures that salinity and X-
CH4 vary within the fluid inclusion population. The
presence of methane, and thus elevated clathrate
melting temperatures, makes salinity determinations
difficult. The variable solid CO2 melting temperatures
(Table 1) are consistent with a range of X-CH4 in the
carbonic phase ranging from 0.0 to over 50 mol%
Fig. 5. Histogram showing the range of solid CO2 melting
temperatures for fluid inclusions hosted in emerald. n=Number of
inclusions measured.
D. Marshall et al. / Chemical Geology 194 (2003) 187–199 193
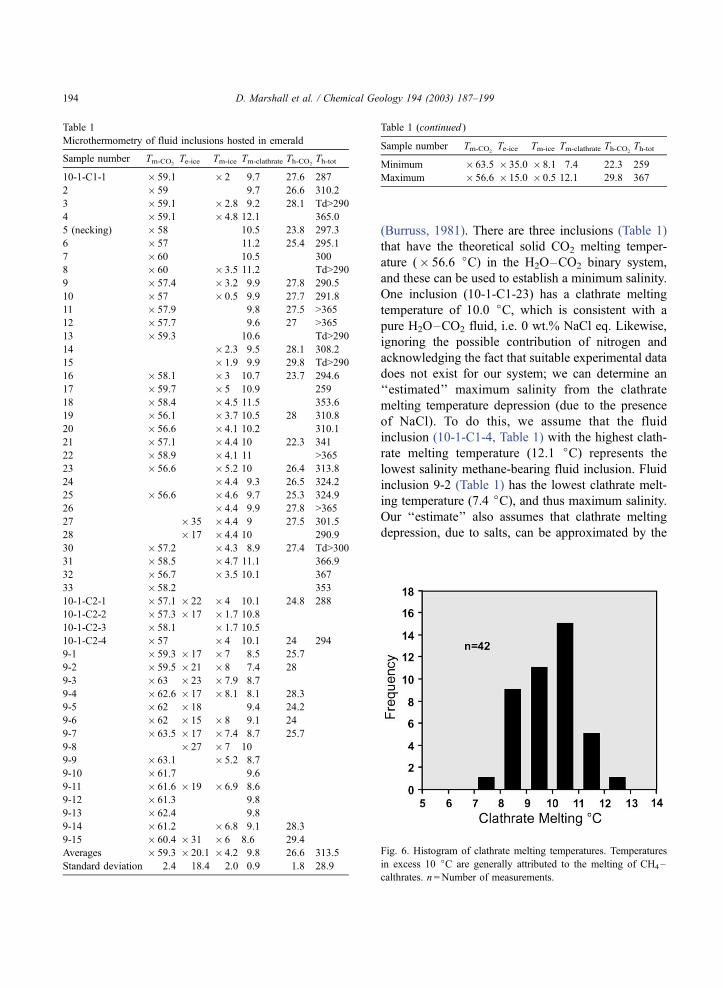
(Burruss, 1981). There are three inclusions (Table 1)
that have the theoretical solid CO2 melting temper-
ature (� 56.6 jC) in the H2O–CO2 binary system,
and these can be used to establish a minimum salinity.
One inclusion (10-1-C1-23) has a clathrate melting
temperature of 10.0 jC, which is consistent with a
pure H2O–CO2 fluid, i.e. 0 wt.% NaCl eq. Likewise,
ignoring the possible contribution of nitrogen and
acknowledging the fact that suitable experimental data
does not exist for our system; we can determine an
‘‘estimated’’ maximum salinity from the clathrate
melting temperature depression (due to the presence
of NaCl). To do this, we assume that the fluid
inclusion (10-1-C1-4, Table 1) with the highest clath-
rate melting temperature (12.1 jC) represents the
lowest salinity methane-bearing fluid inclusion. Fluid
inclusion 9-2 (Table 1) has the lowest clathrate melt-
ing temperature (7.4 jC), and thus maximum salinity.
Our ‘‘estimate’’ also assumes that clathrate melting
depression, due to salts, can be approximated by the
Table 1
Microthermometry of fluid inclusions hosted in emerald
Sample number Tm-CO2Te-ice Tm-ice Tm-clathrate Th-CO2
Th-tot
10-1-C1-1 � 59.1 � 2 9.7 27.6 287
2 � 59 9.7 26.6 310.2
3 � 59.1 � 2.8 9.2 28.1 Td>290
4 � 59.1 � 4.8 12.1 365.0
5 (necking) � 58 10.5 23.8 297.3
6 � 57 11.2 25.4 295.1
7 � 60 10.5 300
8 � 60 � 3.5 11.2 Td>290
9 � 57.4 � 3.2 9.9 27.8 290.5
10 � 57 � 0.5 9.9 27.7 291.8
11 � 57.9 9.8 27.5 >365
12 � 57.7 9.6 27 >365
13 � 59.3 10.6 Td>290
14 � 2.3 9.5 28.1 308.2
15 � 1.9 9.9 29.8 Td>290
16 � 58.1 � 3 10.7 23.7 294.6
17 � 59.7 � 5 10.9 259
18 � 58.4 � 4.5 11.5 353.6
19 � 56.1 � 3.7 10.5 28 310.8
20 � 56.6 � 4.1 10.2 310.1
21 � 57.1 � 4.4 10 22.3 341
22 � 58.9 � 4.1 11 >365
23 � 56.6 � 5.2 10 26.4 313.8
24 � 4.4 9.3 26.5 324.2
25 � 56.6 � 4.6 9.7 25.3 324.9
26 � 4.4 9.9 27.8 >365
27 � 35 � 4.4 9 27.5 301.5
28 � 17 � 4.4 10 290.9
30 � 57.2 � 4.3 8.9 27.4 Td>300
31 � 58.5 � 4.7 11.1 366.9
32 � 56.7 � 3.5 10.1 367
33 � 58.2 353
10-1-C2-1 � 57.1 � 22 � 4 10.1 24.8 288
10-1-C2-2 � 57.3 � 17 � 1.7 10.8
10-1-C2-3 � 58.1 � 1.7 10.5
10-1-C2-4 � 57 � 4 10.1 24 294
9-1 � 59.3 � 17 � 7 8.5 25.7
9-2 � 59.5 � 21 � 8 7.4 28
9-3 � 63 � 23 � 7.9 8.7
9-4 � 62.6 � 17 � 8.1 8.1 28.3
9-5 � 62 � 18 9.4 24.2
9-6 � 62 � 15 � 8 9.1 24
9-7 � 63.5 � 17 � 7.4 8.7 25.7
9-8 � 27 � 7 10
9-9 � 63.1 � 5.2 8.7
9-10 � 61.7 9.6
9-11 � 61.6 � 19 � 6.9 8.6
9-12 � 61.3 9.8
9-13 � 62.4 9.8
9-14 � 61.2 � 6.8 9.1 28.3
9-15 � 60.4 � 31 � 6 8.6 29.4
Averages � 59.3 � 20.1 � 4.2 9.8 26.6 313.5
Standard deviation 2.4 18.4 2.0 0.9 1.8 28.9
Sample number Tm-CO2Te-ice Tm-ice Tm-clathrate Th-CO2
Th-tot
Minimum � 63.5 � 35.0 � 8.1 7.4 22.3 259
Maximum � 56.6 � 15.0 � 0.5 12.1 29.8 367
Table 1 (continued )
Fig. 6. Histogram of clathrate melting temperatures. Temperatures
in excess 10 jC are generally attributed to the melting of CH4–
calthrates. n=Number of measurements.
D. Marshall et al. / Chemical Geology 194 (2003) 187–199194

pseudo-ternary (H2O–CO2–NaCl) system with an X-
CH4 of 0.1 (Diamond, 1992) in the carbonic compo-
nent. Using the data of Diamond (1992), a clathrate
melting temperature of 7.4 jC corresponds to an
‘‘estimated’’ maximum salinity of approximately 8
and an average salinity 2 wt.% NaCl eq. Additionally,
there is a discrepancy between our Th-CO2and the
theoretical maximum of 23.2 jC for the pseudo
ternary H2O–CO2 with an X-CH4 of 0.1 (Diamond,
1992). The increase of the Th-CO2beyond the critical
point of the pseudo-binary can be accounted for by
minor amounts of H2S. Diamond’s (1992) data was
extrapolated beyond the critical curve for the salinity
estimates for our inclusions.
Pending a Raman analyses of the carbonic phase,
vapour fractions and initial X-CO2 within the fluid
inclusions were estimated visually and then refined
using the technique of Diamond (2001) and Bakker
and Diamond (2000), assuming all compressible gases
within the inclusions behave as CO2. Finally, X-CH4
was determined from the average depression of the
CO2 triple point and the initial X-CO2 was subse-
quently corrected to account for the methane with the
inclusions, using the method of Diamond (2001). X-
CO2 in the aqueous phase is estimated at 0.027. This
is estimated from the maximum CO2 solubility in the
aqueous phase in the H2O–CO2 binary. This is a
minimum, as a higher internal (fluid inclusion) pres-
sure due to methane will enhance the solubility of
CO2. X-CH4 in the aqueous phase is assumed to be 0.
Internal fluid inclusion pressure at the average final
clathrate melting temperature is estimated at 46 bars
from Diamond (1992). Using these assumptions,
approximations and the data obtained from micro-
thermometry (Table 1), an ‘‘estimated’’ average fluid
inclusion composition of 0.9391 mol% H2O, 0.0473
mol% CO2, 0.0077 mol% CH4 and 0.0059 mol%
NaCl (f 2 wt.% NaCl eq.) and an estimated bulk
molar volume of 26.35 cm3/mol was determined.
To complement the microthermometric salinity
determinations, three grains of emerald and quartz
were frozen in liquid nitrogen, broken and rapidly
placed (uncoated) in the chamber of a Bausch and
Lomb Nanolab scanning electron microscope (SEM)
equipped with an energy dispsersive X-ray (EDX)
system. The mineral grains were examined using a
modified technique after Kelly and Burgio (1983) for
breached fluid inclusions. Several cavities resembling
breached fluid inclusions were found in the quartz and
emerald samples. No residua was visible within or
surrounding the fluid inclusion cavities. The electron
beam was directed inside a number of breached
inclusions and an EDX spectrum collected. Likewise,
an area encompassing the breached inclusions and the
surrounding area was scanned and an EDX spectrum
collected. In all cases, the spectra contained the
theoretical peaks of the host minerals, but no peaks
attributable to the major chlorides (Na, K, Mg, Ca or
Cl) were observed.
5. Cretaceous granite fluid inclusion data
Attempts to crush the rare primary melt inclusions
within quartz from the granite failed to identify any
compressed gases within the shrinkage bubbles. The
relatively small volume of the shrinkage bubble
makes this test difficult; however, repeated tests
yielded consistent data. Reconnaissance microther-
mometry of the secondary fluid inclusions indicates
Fig. 7. Histogram of total homogenization temperatures. All
inclusion homogenized to the vapour phase. The secondary peak
at higher temperatures is attributed to a volume change within the
fluid inclusion due to the increased internal pressure at high
temperature. Some inclusions underwent total decrepitation (Td) at
temperature in excess of 300 jC.
D. Marshall et al. / Chemical Geology 194 (2003) 187–199 195

they contain no compressible gases and undergo total
homogenization approximately 50j less than the
emerald inclusions, suggesting that these fluids are
markedly different from the fluid inclusions associ-
ated with the emerald veins.
6. Stable isotopes
Oxygen isotope data were obtained from scheelite,
quartz and tourmaline separates from a single-hand
specimen in an attempt to establish if these minerals
were contemporaneous and to constrain the temper-
atures of vein formation. Petrographic relations were
consistent with the coprecipitation of quartz and
tourmaline, followed by scheelite. The analytical
conditions are described in Mattey et al. (1994) and
Mattey and MacPherson (1993). The isotope data are
presented in Table 2. Quartz–tourmaline thermometry
based on the calibration of Kotzer et al. (1993) yields
equilibrium temperatures ranging from 365 to 498 jC.The quartz–scheelite fractionation curve of Zheng
(1992) yields temperatures of 248–263 jC. Tourma-
line–scheelite pairs yield temperatures in the range of
120–250 jC using the combined calibrations of
Zheng (1992, 1993).
Groat et al. (in press) present oxygen isotope data
for emerald from the Crown showing. Combining
their emerald data with the quartz isotope data from
this study yields variable equilibrium temperatures in
the range 569–1670 jC using the beryl–H2O cali-
bration of Taylor et al. (1992) combined with the
quartz–H2O calibration of Clayton et al. (1972).
These temperatures are discordant with temperatures
obtained for quartz–tourmaline pairs and inconsistent
with the metamorphic grade observed in the rocks.
This is good evidence for localized oxygen isotope
equilibrium throughout the deposit as the quartz–
tourmaline and beryl (emerald) samples were taken
from different localities within the showing.
7. Pressure–temperature conditions of vein
formation
The main purpose of the fluid inclusion study on
the emerald was to determine the composition of the
fluids responsible for the growth of emerald, to
determine isochoric constraints for these fluids and
to integrate these findings with the preliminary oxy-
gen–isotope thermometry to approximate the pres-
sures and temperatures of vein formation and dis-
tinguish between a tectonic–hydrothermal versus a
magmatic origin.
The fluid inclusion composition is rather complex
with an aqueous brine phase and a carbonic phase
containing CO2 and CH4. It may also contain minor
amounts of H2S and N2. In an attempt to generate
fluid inclusion isochores for an estimated average
composition, a variety of methods have been em-
ployed. Initially, the program FLINCOR (Brown,
1989) was used to calculate isochores. The Bowers
and Helgeson (1983) equation of state for H2O–
CO2–NaCl fluids was used, assuming all the carbonic
component of the inclusions was CO2. Secondly, an
isochore was calculated using the Jacobs and Kerrick
(1981) equation of state for H2O–CO2 fluids. A third
isochore was calculated using the GASWET8 pro-
gram and the Bakker (1999) equation of state using
the composition as determined in the H2O–CO2–
CH4–NaCl ternary (Fig. 8). Lastly, interpolation of
the experimental data of Gehrig (1980) was used to
derive an isochore in the H2O–CO2–NaCl ternary.
Repeated calculations with the Bakker (1999) equa-
tion revealed that it provides the best fit to the
experimental data of Gehrig (1980) for compositions
and molar volumes similar to the fluid inclusions in
this study. Therefore, our preferred isochoric path
would lie in the area bounded by the Gehrig inter-
polation and the Bakker (1999) equation of state
(Fig. 8).
Pressure–temperature (P–T) constraints can be
derived by intersecting the fluid inclusion isochores
with the temperature constraints obtained from stable
isotope thermometry of quartz–tourmaline pairs. This
Table 2
Oxygen isotope data
Sample Mineral d 18OSMOW
WW-EM-1 quartz 12.37
WW-EM-2 tourmaline 9.52
WW-EM-3 tourmaline 10.30
WW-EM-4 scheelite 6.32
WW-EM-5 scheelite 6.07
D. Marshall et al. / Chemical Geology 194 (2003) 187–199196

intersection defines an area ranging from 365 to 498
jC, with corresponding pressures along the isochoric
paths ranging from 700 to 2250 bars. These pressures
correspond to burial depths ranging from just over 2
to approximately 7 km. This is in reasonably good
agreement with the Cretaceous metamorphic grade in
the area of upper greenschist to lower amphibolite.
The P–T data obtained from the emerald veins is also
somewhat ambiguous as to the source of the emerald.
The higher end of the temperature range is probably
slightly higher than the regional metamorphism and
suggests some igneous input of at least heat and
possibly Be, B and Si. However, the lower end of
the P–T data is in good agreement with the regional
metamorphism with a possible distal fluid (Be, B and
Si) source with transport along the Tintina Fault
System.
The state of the fluid during emerald precipitation
is consistent with a single-phase (non-boiling) fluid.
This is shown by the consistent phase ratios within the
fluid inclusions and that the P–T constraints fall
within the one-phase field (Takenouchi and Kennedy,
1964) on a CO2–H2O diagram approximating the
fluid inclusion compositions obtained in this study
(Fig. 8).
8. Discussion and conclusions
The emerald at the Crown showing is the only
occurrence of Cr-bearing emerald in the Canadian
Cordillera and its discovery indicates that there may
be a new exploration target in this area. Future
exploration will be predicated on what is known about
the Crown showing and how it ‘‘pigeon holes’’ into
the existing models of emerald formation. The emer-
ald is found in close proximity to S-type Cretaceous
granite and hosted within mafic schists of sufficient
metamorphic grade to account for a hydrothermal
origin for the emerald. H and O isotope studies (Groat
et al., in press) on the Crown emerald are ambiguous
in delineating a magmatic versus a tectonic–hydro-
thermal origin for the emerald. Oxygen isotope studies
presented here indicate a polythermal paragenesis,
with local isotopic equilibrium attained at the hand
specimen scale. This is consistent with the petro-
graphic and field relationships, which indicate the
primary vein minerals are quartz and tourmaline with
emerald generally being restricted to the vein alter-
ation haloes comprised of a tourmaline–muscovite
schist. This alteration assemblage is overprinted by a
lower temperature assemblage of chlorite, scheelite,
Fig. 8. Pressure– temperature diagram showing the range of possible P–T conditions for emerald growth at the Crown showing. Temperature
constraints are derived from co-existing quartz and tourmaline oxygen isotope data. Fluid inclusion isochores are derived from the interpolation
of Gehrig’s (1980) experimental data and equations of state (Jacobs and Kerrick, 1981; Bakker, 1999). The two-phase field is interpolated from
the data of Takenouchi and Kennedy (1964) for a binary H2O–CO2 fluid with an X-CO2 of 0.05.
D. Marshall et al. / Chemical Geology 194 (2003) 187–199 197
quartz, lepidocrocite and jarosite, during the waning
stages of the hydrothermal system.
Fluid inclusion studies on the quartz–tourmaline–
emerald veins and the granite suggest markedly differ-
ent fluid compositions within the emerald and granite,
as the granite contains low volatile melt inclusions
and aqueous volatile poor secondary inclusions, while
the primary fluid inclusions in emerald are CO2-
bearing. Although carbonate units have been reported
within the Fire Lake metavolcanic rocks (Fig. 1) on
the eastern side of the granite, no such carbonates
have been observed in the general proximity of the
emerald mineralization, which lies to the west of the
granite. Geochemistry of the nearby Cretaceous gran-
ite (Groat et al., in press) indicates anomalously low
Be values, suggesting beryllium may be sourced from
elsewhere and transported to the emerald showing via
large crustal structures (Nwe and Grundmann, 1990;
Nwe and Morteani, 1993; Grundmann and Morteani,
1989) such as the Tintina Fault system, a major fault
14 km to the southwest of the emerald veins. It is
conceivable that the majority of the Be was taken
from the melt prior to crystallization of the granite.
This would require an elevated partitioning coefficient
for Be between the melt and fluid. Despite the require-
ment of an elevated partitioning coefficient, the Creta-
ceous granite is the most likely source of Be because
the emerald veins are 14 km from Tintina Fault, and
there is no evidence of fluid transport from the
Tintina.
The temperature range of emerald precipitation is
365–498 jC. The upper part of this temperature range
is probably slightly in excess of the regional meta-
morphic grade. This may be an artifact of partial
disequilibrium in the 18O of the quartz and tourmaline,
or it could indicate that the granite contributed to the
overall heat budget during emerald formation. Forma-
tional pressures correspond to burial depths on the
order of 2–7 km. As the emerald is either related to
the intrusion of the granite or peak metamorphism,
both of which occurred at approximately 112 Ma, this
constrains the uplift rate in the area to a very slow rate
of approximately 0.02–0.07 mm/year.
Studies underway include hydrogen and oxygen
isotope studies on the Cretaceous granite, bulk-leach-
ate fluid inclusion analyses and Ar–Ar studies on the
muscovite from the vein alteration haloes. The Ar–Ar
data will only be able to delineate a post-granite
tectonic–hydrothermal for the veins as peak meta-
morphism coincides with granite emplacement. O–H
isotopic studies, on the other hand, may provide a link
between the emerald O–H data and the magmatic
fluid composition and remove the need to rely upon
literature O–H data for S-type granites. Despite the
growing body of scientific data on the Crown emerald
veins, and although the combined fluid inclusion and
stable isotope data favour a tectonic–hydrothermal
origin with probable heat input from the Creatceous
granite, at present, there is still no clear indication of a
tectonic–hydrothermal versus a magmatic or hybrid
origin for these deposits.
Acknowledgements
Financial support for the project was provided by
NSERC grants to DM and LG. Danae Voormeij is
thanked for helping with fluid inclusion measure-
ments, field work and draughting. Special thanks to
True North Gems and Expatriate Resources for field
support during this project. Holly Keyes is thanked for
help with the figures. Anita Lam assisted with some of
the field work. [RR]
References
Bakker, R.J., 1999. Adaptation of the Bowers and Helgeson (1983)
equation of state for the H2O–CO2–CH4–N2–NaCl system.
Chem. Geol. 154, 225–236.
Bakker, R.J., Diamond, L.W., 2000. Determination of the compo-
sition and molar volume of H2O–CO2 fluid inclusions by mi-
crothermometry. Geochim. Cosmochim. Acta 10, 1753–1764.
Banks, D.A., Giuliani, G., Yardley, B.W.D., Cheilletz, A., 2000.
Emerald mineralization in Colombia: fluid chemistry and the
role of brine mixing. Miner. Depos. 35, 699–713.
Bowers, T.S., Helgeson, H.C., 1983. Calculation of the thermody-
namic and geochemical consequences of nonideal mixing in
the system H2O–CO2–NaCl on phase relations in geologic
systems: equation of state for H2O–CO2–NaCl fluids at high
pressures and temperatures. Geochim. Cosmochim. Acta 47,
1247–1275.
Brown, P., 1989. FLINCOR: a microcomputer program for the
reduction and investigation of fluid inclusion data. Am. Mineral.
74, 1390–1393.
Burruss, R.C., 1981. Analysis of phase equilibria in C–O–H–S
fluid inclusions. Fluid Inclusions: Applications to Petrology.
Mineralogical Association of Canada, Short Course, vol. 6,
pp. 39–74.
D. Marshall et al. / Chemical Geology 194 (2003) 187–199198

Clayton, R.N., O’Neil, J.R., Mayeda, T.K., 1972. Oxygen isotope
exchange between quartz and water. J. Geophys. Res. 77,
3057–3067.
Diamond, L.W., 1992. Gas clathrate hydrates in fluid inclusions:
phase equilibria and applications. Fourth Biennial Pan-Ameri-
can Conference on Research on Fluid inclusions (PACROFI
IV), Program and Abstracts, pp. 119–122.
Diamond, L.W., 2001. Review of the systematics of CO2–H2O
fluid inclusions. Lithos 55, 69–99.
Gehrig, M., 1980. Phasengleichgewichte und PVT-Daten ternarer
Mischungen aus Wasser, Kohlendioxid und Natriumchlorid bis
3 kbar und 550 jC. PhD thesis, University of Karlsruhe Uni-
versity, HochschulVerlag, Freiburg, 109 pp.
Giuliani, G., France-Lanord, C., Cheilletz, A., Coget, P., Branquet,
Y., Laumomnier, B., 2000. Sulfate reduction by organic matter
in Colombian emerald deposits; chemical and stable isotope (C,
O, H) evidence. Econ. Geol. 95, 1129–1153.
Groat, L.A., Marshall, D.D., Giuliani, G., Murphy, D.C., Piercey,
S.J., Jambor, J.L., Mortensen, J.K., Ercit, T.S., Gault, R.A.,
Mattey, D.P., Schwarz, D., Wise, M.A., Wengzynowski, W.,
Eaton, D., 2002. Canadian emerald: geology, mineralogy, and
origin of the Crown Showing, Southeastern Yukon. Can. Min-
eral. (in press).
Grundmann, G., Morteani, G., 1989. Emerald mineralisation during
regional metamorphism: the Habachtal (Austria) and Leydsdorp
(Transvaal, South Africa) deposits. Econ. Geol. 84, 1835–1849.
Jacobs, G.K., Kerrick, D.M., 1981. Devolatilization equilibria in
H2O–CO2 and H2O–CO2–NaCl fluids: an experimental and
thermodynamic evaluation at elevated pressures and tempera-
tures. Am. Mineral. 66, 1135–1153.
Kelly, W.C., Burgio, P.A., 1983. Cryogenic scanning electron mi-
croscopy of fluid inclusions in ore and gangue minerals. Econ.
Geol. 78, 1262–1267.
Kotzer, T.G., Kyser, T.K., King, R.W., Kerrich, R., 1993. An em-
pirical oxygen—and hydrogen—isotope geothermometer for
quartz– tourmaline and tourmaline–water. Geochim. Cosmo-
chim. Acta 57, 3421–3426.
Mattey, D.P., MacPherson, C.M., 1993. High-precision oxygen iso-
tope analysis of microgram quantities of silicate by laser fluo-
rination. Chem. Geol. 105, 305–318.
Mattey, D.P., Lowry, D., Macpherson, C.M., 1994. Oxygen isotope
composition of mantle olivine. Earth Planet. Sci. Lett. 128,
321–341.
Moroz, I., Vapnik, Ye., 1999. Fluid inclusions in emeralds from
schist-type deposits. Can. Gemmol. 20, 8–14.
Moroz, I., Vapnik, Ye., 2001. Fluid inclusions in Panjshir emerald
(Afghanistan). European Current Research on Fluid Inclusions
Meeting (ECROFI XVI), Abstracts.
Mortensen, J.K., 1999. YUKONAGE, an isotopic age database for
the Yukon Territory. In: Gordey, S.P., Makepeace, A.J. (Eds.),
Yukon Digital Geology. Geol. Surv. Can., Open File D3826, and
Exploration and Geological Services Division, Yukon, Indian
and Northern Affairs Canada, Open File 1999-1(D).
Murphy, D.C., 1998. Stratigraphic framework for syngenetic min-
eral occurrences, Yukon–Tanana Terrane south of Finlayson
Lake: a progress report. In: Yukon Exploration and Geology
1997. Exploration and Geological Services Division, Yukon,
Indian and Northern Affairs Canada, pp. 51–58.
Murphy, D.C., Piercey, S.J., 2000. Syn-mineralization faults and
their re-activation, Finlayson Lake massive sulphide district,
Yukon–Tanana Terrane, southeastern Yukon. In: Emond, D.S.,
Weston, L.H. (Eds.), Yukon Exploration and Geology 1999.
Exploration and Geological Services Division, Yukon, Indian
and Northern Affairs Canada, pp. 55–66.
Nwe, Y.Y., Grundmann, G., 1990. Evolution of metamorphic fluids
in shear zones: the record from the emeralds of Habachtal,
Tauern window, Austria. Lithos 25, 281–304.
Nwe, Y.Y., Morteani, G., 1993. Fluid evolution in the H2O–CH4–
CO2–NaCl system during emerald mineralization at Gravelotte,
Murchinson greenstone belt, Northeast Transvaal, South Africa.
Geochim. Cosmochim. Acta 57, 89–103.
Ottaway, T.L., Wicks, F.J., Bryndzia, L.T., Kyser, T.K., Spooner,
E.T.C., 1994. Formation of the Muzo hydrothermal emerald
deposit in Colombia. Nature 369, 552–554.
Piercey, S.J., Hunt, J.A., Murphy, D.C., 1999. Lithogeochemistry of
meta-volcanic rocks from Yukon–Tanana Terrane, Finlayson
Lake region: preliminary results. In: Roots, C.F., Emond, D.S.
(Eds.), Yukon Exploration and Geology 1998. Exploration and
Geological Services Division, Yukon, Indian and Northern Af-
fairs Canada, pp. 55–66.
Roddick, J.A., 1967. The Tintina Trench. J. Geol. 75, 23–32.
Roedder, E., 1984. Fluid inclusions. Mineral. Soc. Am. Short
Course 12 (646 pp.).
Schwarz, D., Giullani, G., 2001. Emerald deposits—a review. Aust.
Gemmol. 21, 17–23.
Takenouchi, S., Kennedy, G.C., 1964. The binary system H2O–
CO2 at high temperatures and pressures. Am. J. Sci. 262,
1055–1074.
Taylor, R.P., Fallick, A.E., Breaks, F.W., 1992. Volatile evolution in
Archean rare-element granitic pegmatites: evidence from the
hydrogen-isotopic composition of channel H2O in beryl. Can.
Mineral. 30, 877–893.
Vapnik, Y., Moroz, I., 2000. Fluid inclusions in emerald from the
Jos complex (Central Nigeria). Schweiz. Mineral. Petrogr. Mitt.
80, 117–129.
Zheng, Y.-F., 1992. Oxygen isotope fractionation in wolframite.
Eur. J. Mineral. 4, 1331–1335.
Zheng, Y.-F., 1993. Calculation of oxygen isotope fractionation
in hydroxyl-bearing silicates. Earth Planet. Sci. Lett. 120,
247–263.
D. Marshall et al. / Chemical Geology 194 (2003) 187–199 199