Embed Size (px)
Citation preview
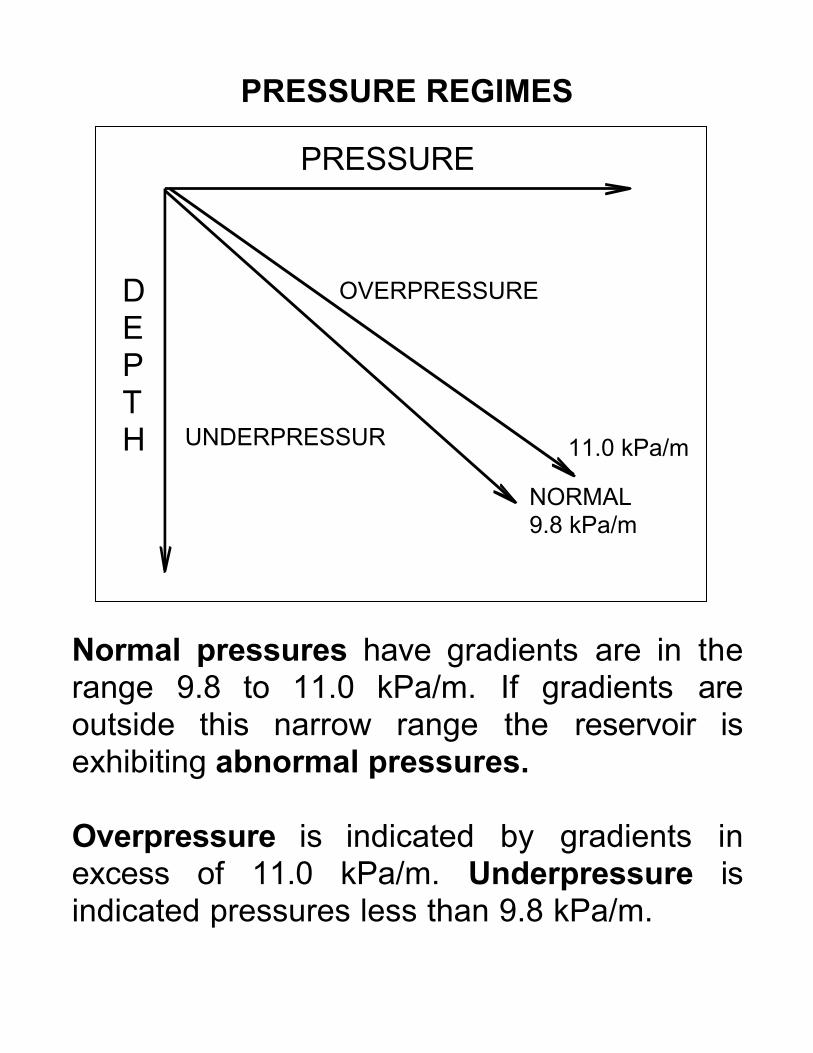
PRESSURE REGIMES
Normal pressures have gradients are in therange 9.8 to 11.0 kPa/m. If gradients areoutside this narrow range the reservoir isexhibiting abnormal pressures.
Overpressure is indicated by gradients inexcess of 11.0 kPa/m. Underpressure isindicated pressures less than 9.8 kPa/m.
PRESSURE
DEPTH
NORMAL9.8 kPa/m
UNDERPRESSUR
OVERPRESSURE
11.0 kPa/m
PRESSURE
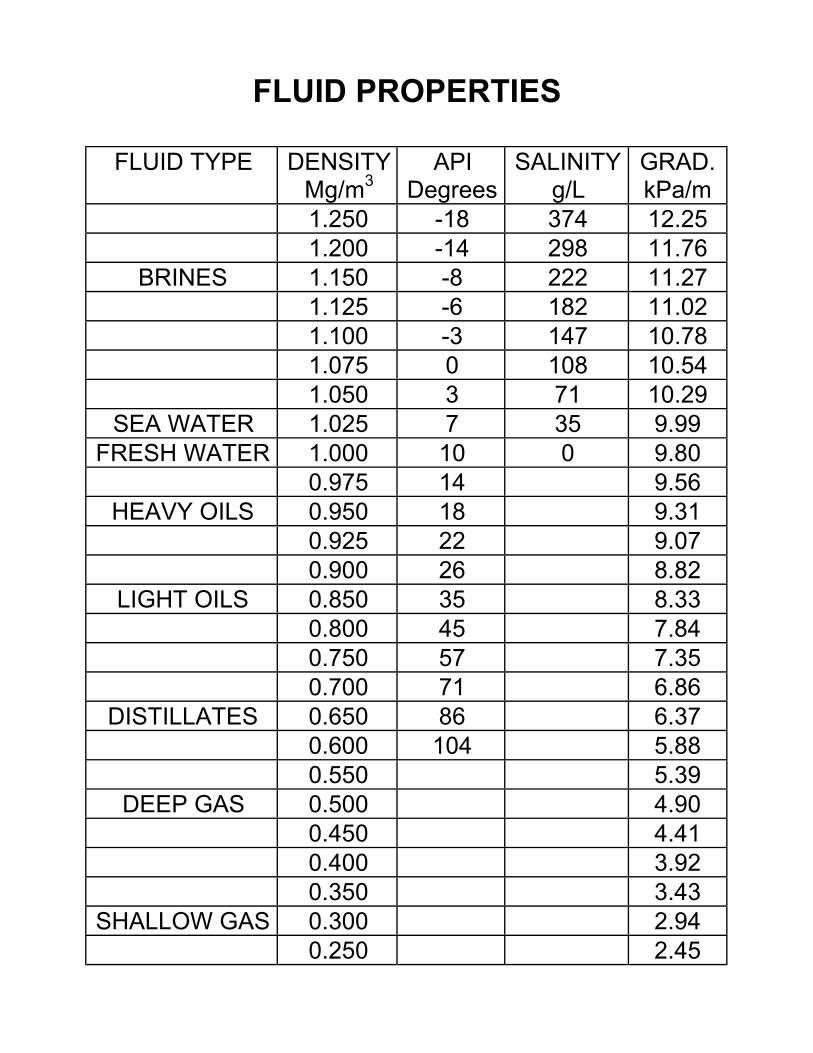
FLUID PROPERTIES
FLUID TYPE DENSITYMg/m3
APIDegrees
SALINITYg/L
GRAD.kPa/m
1.250 -18 374 12.251.200 -14 298 11.76
BRINES 1.150 -8 222 11.271.125 -6 182 11.021.100 -3 147 10.781.075 0 108 10.541.050 3 71 10.29
SEA WATER 1.025 7 35 9.99FRESH WATER 1.000 10 0 9.80
0.975 14 9.56HEAVY OILS 0.950 18 9.31
0.925 22 9.070.900 26 8.82
LIGHT OILS 0.850 35 8.330.800 45 7.840.750 57 7.350.700 71 6.86
DISTILLATES 0.650 86 6.370.600 104 5.880.550 5.39
DEEP GAS 0.500 4.900.450 4.410.400 3.920.350 3.43
SHALLOW GAS 0.300 2.940.250 2.45
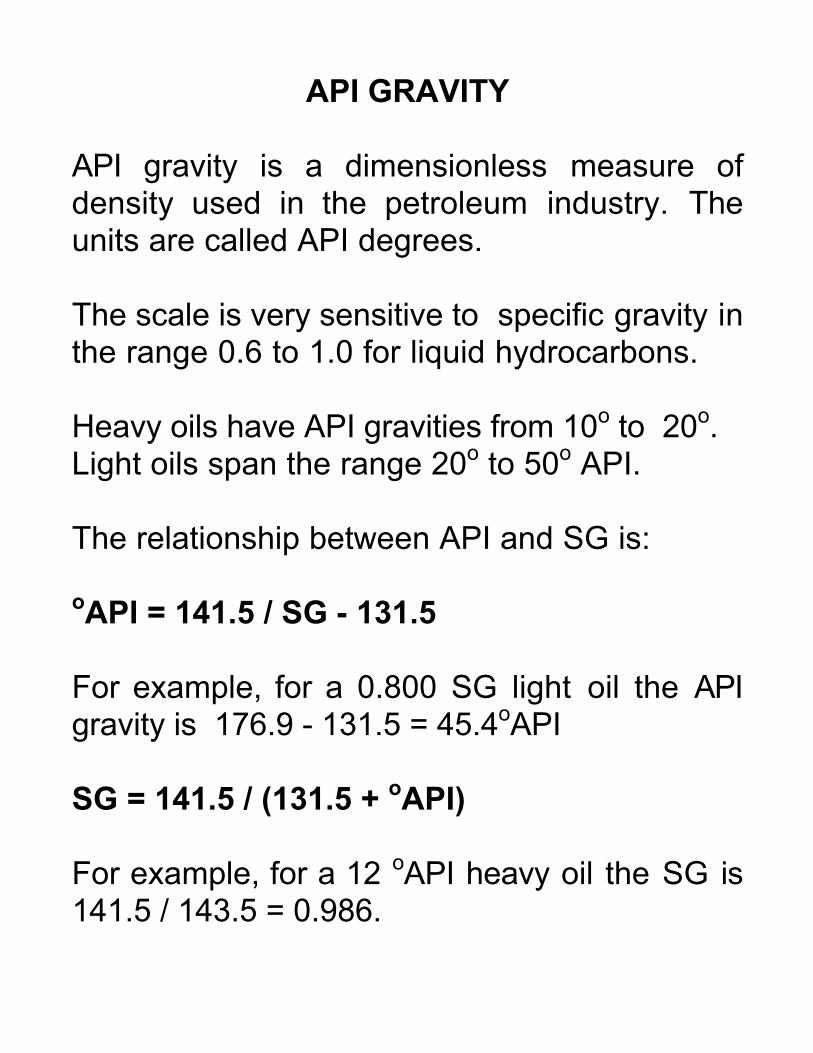
API GRAVITY
API gravity is a dimensionless measure ofdensity used in the petroleum industry. Theunits are called API degrees.
The scale is very sensitive to specific gravity inthe range 0.6 to 1.0 for liquid hydrocarbons.
Heavy oils have API gravities from 10o to 20o.Light oils span the range 20o to 50o API.
The relationship between API and SG is:
oAPI = 141.5 / SG - 131.5
For example, for a 0.800 SG light oil the APIgravity is 176.9 - 131.5 = 45.4oAPI
SG = 141.5 / (131.5 + oAPI)
For example, for a 12 oAPI heavy oil the SG is141.5 / 143.5 = 0.986.
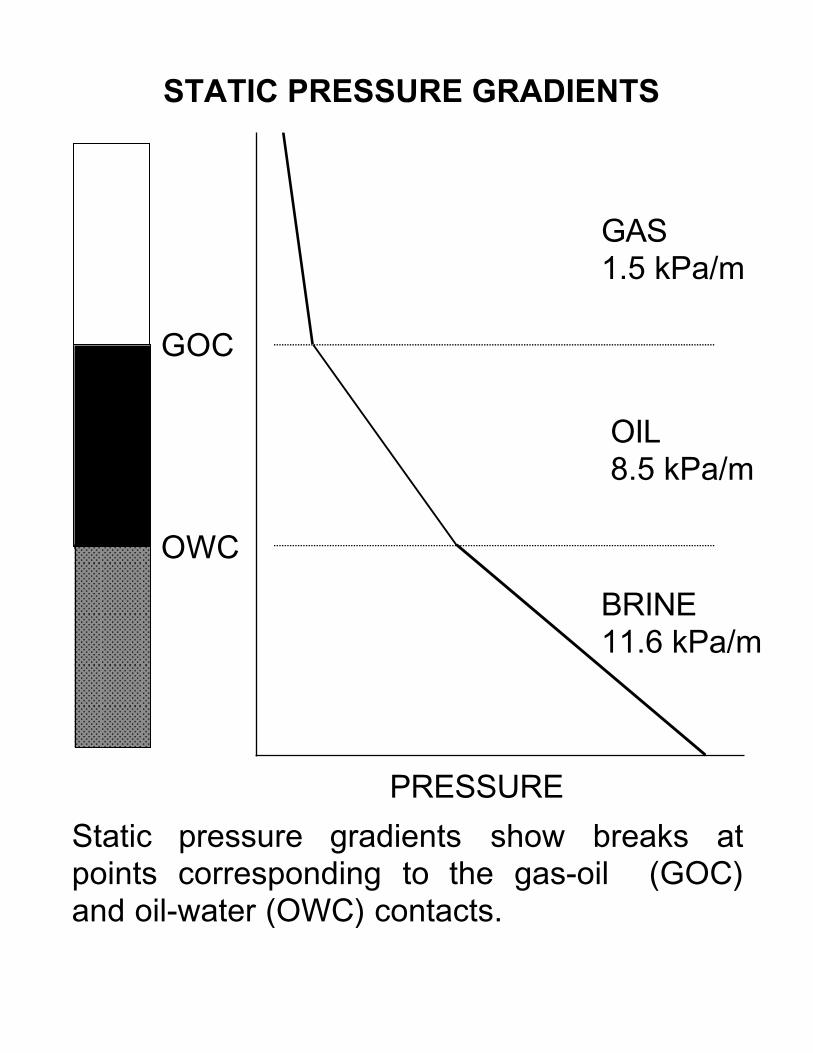
STATIC PRESSURE GRADIENTS
.
Static pressure gradients show breaks atpoints corresponding to the gas-oil (GOC)and oil-water (OWC) contacts.
PRESSURE
GOC
OWC
GAS1.5 kPa/m
OIL8.5 kPa/m
BRINE11.6 kPa/m
SOURCES OF ABNORMAL PRESSURES
Abnormal pressures are created andmaintained by the restriction of pore fluidmovement.
Several kinds of stress changes can lead toabnormal pore fluid pressures:
• rapid geologic loading (deposition) orunloading (erosion) creating compaction(consolidation) disequilibrium• thermal expansion of fluids• regional compressive (squeezing) or tensile(stretching) tectonic stresses• generation of oil and gas from organicmatter.
Abnormal pressures are created when externalstress changes take place too quickly for fluidflow to dissipate the excess pore-pressuresgenerated.
PROCESSES
1. Epeirogenic Movements: Uplift and subsidence associated with erosionand deposition.2. Aquathermal Pressures: Thermal expansion and contraction of porousmedia and reservoir fluids.3. Osmotic Pressures:Membrane filtration by shales and clays. Waterflow to equalize brine concentrations.4. Chemical Diagenesis:Precipitation from trapped pore waters andother chemical processes.5. Hydrocarbon Generation:Carbonization of trapped organic matter.6. Buoyancy Forces:Density differences between reservoir fluids.7. Tectonic Stresses:Compressive and dilational regional stresses.8. Clay conversion:Volume change reactions involving clayminerals.
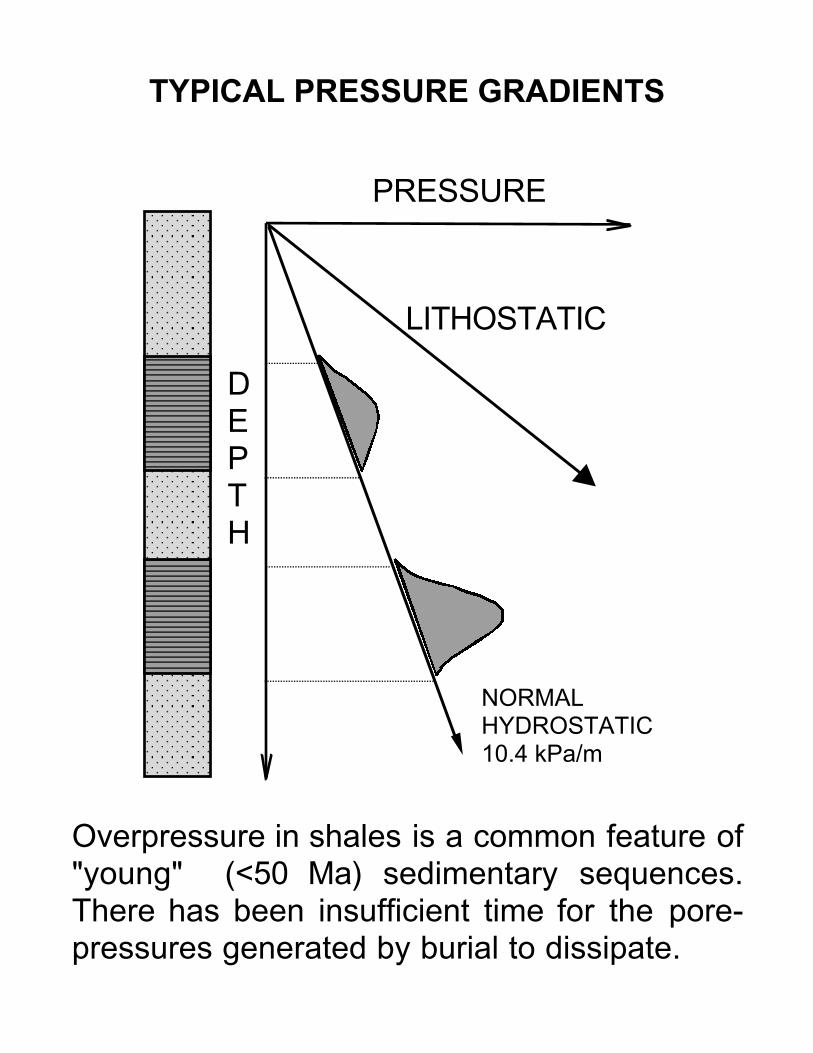
TYPICAL PRESSURE GRADIENTS
Overpressure in shales is a common feature of"young" (<50 Ma) sedimentary sequences.There has been insufficient time for the pore-pressures generated by burial to dissipate.
NORMALHYDROSTATIC10.4 kPa/m
DEPTH
PRESSURE
LITHOSTATIC
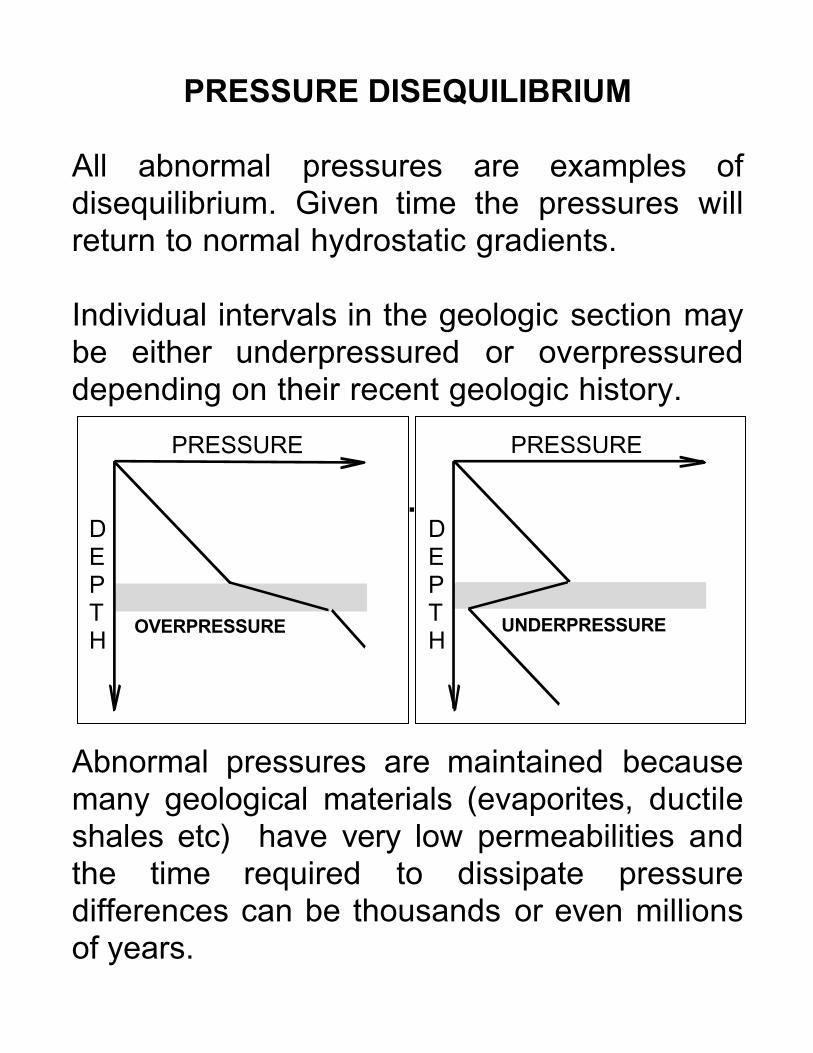
PRESSURE DISEQUILIBRIUM
All abnormal pressures are examples ofdisequilibrium. Given time the pressures willreturn to normal hydrostatic gradients.
Individual intervals in the geologic section maybe either underpressured or overpressureddepending on their recent geologic history.
.
Abnormal pressures are maintained becausemany geological materials (evaporites, ductileshales etc) have very low permeabilities andthe time required to dissipate pressuredifferences can be thousands or even millionsof years.
DEPTH
PRESSURE
DEPTH
PRESSURE
UNDERPRESSUREOVERPRESSURE
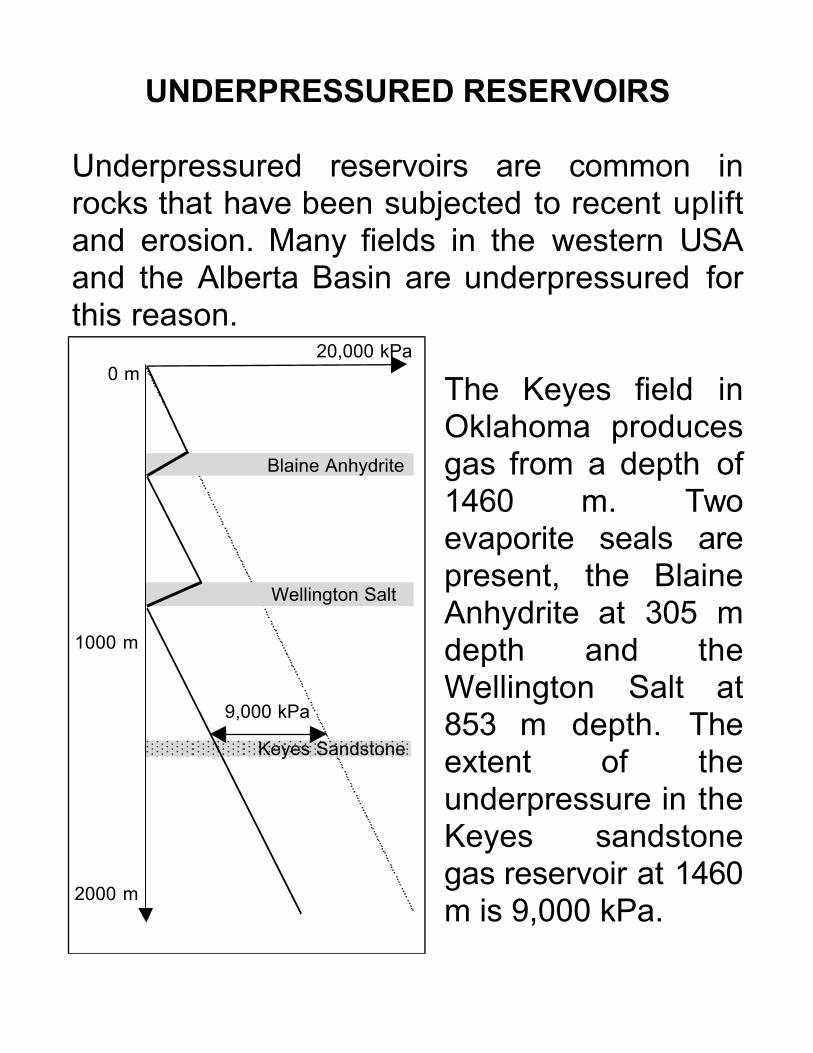
UNDERPRESSURED RESERVOIRS
Underpressured reservoirs are common inrocks that have been subjected to recent upliftand erosion. Many fields in the western USAand the Alberta Basin are underpressured forthis reason.
The Keyes field inOklahoma producesgas from a depth of1460 m. Twoevaporite seals arepresent, the BlaineAnhydrite at 305 mdepth and theWellington Salt at853 m depth. Theextent of theunderpressure in theKeyes sandstonegas reservoir at 1460m is 9,000 kPa.
2000 m
1000 m
0 m
Wellington Salt
Blaine Anhydrite
Keyes Sandstone
20,000 kPa
9,000 kPa
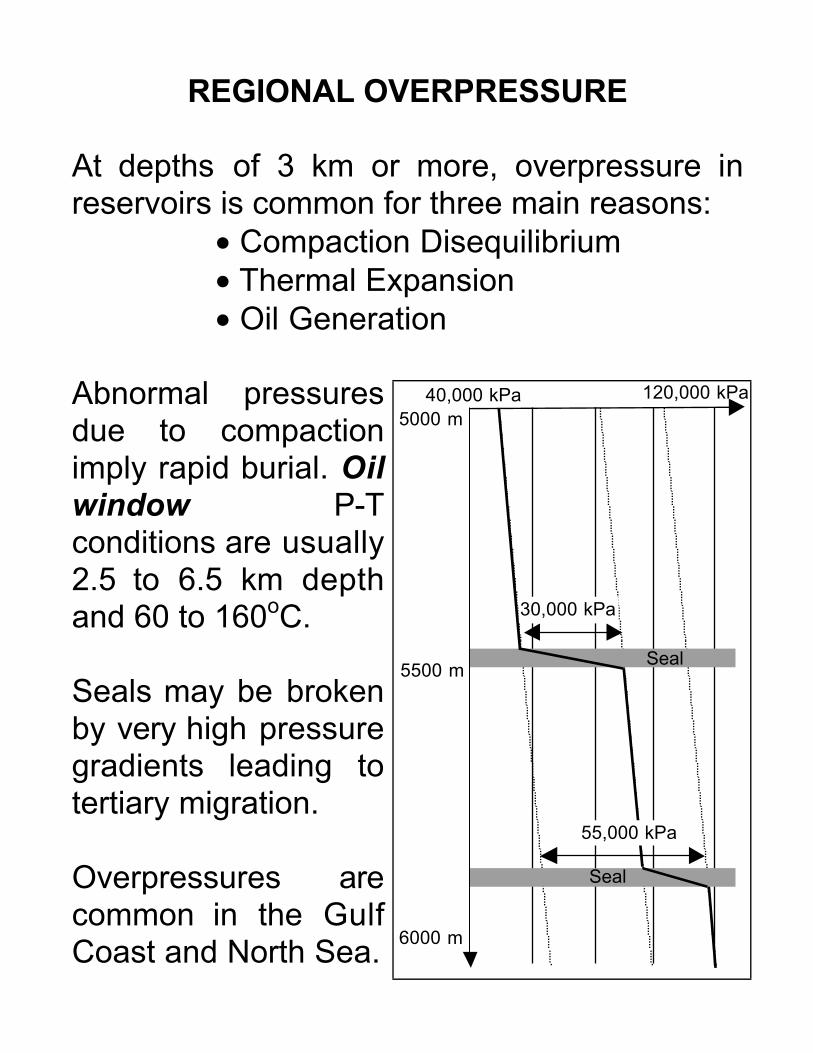
REGIONAL OVERPRESSURE
At depths of 3 km or more, overpressure inreservoirs is common for three main reasons:
• Compaction Disequilibrium• Thermal Expansion• Oil Generation
Abnormal pressuresdue to compactionimply rapid burial. Oilwindow P-Tconditions are usually2.5 to 6.5 km depthand 60 to 160oC.
Seals may be brokenby very high pressuregradients leading totertiary migration.
Overpressures arecommon in the GulfCoast and North Sea.
6000 m
5000 m
120,000 kPa40,000 kPa
30,000 kPa
5500 mSeal
Seal
55,000 kPa
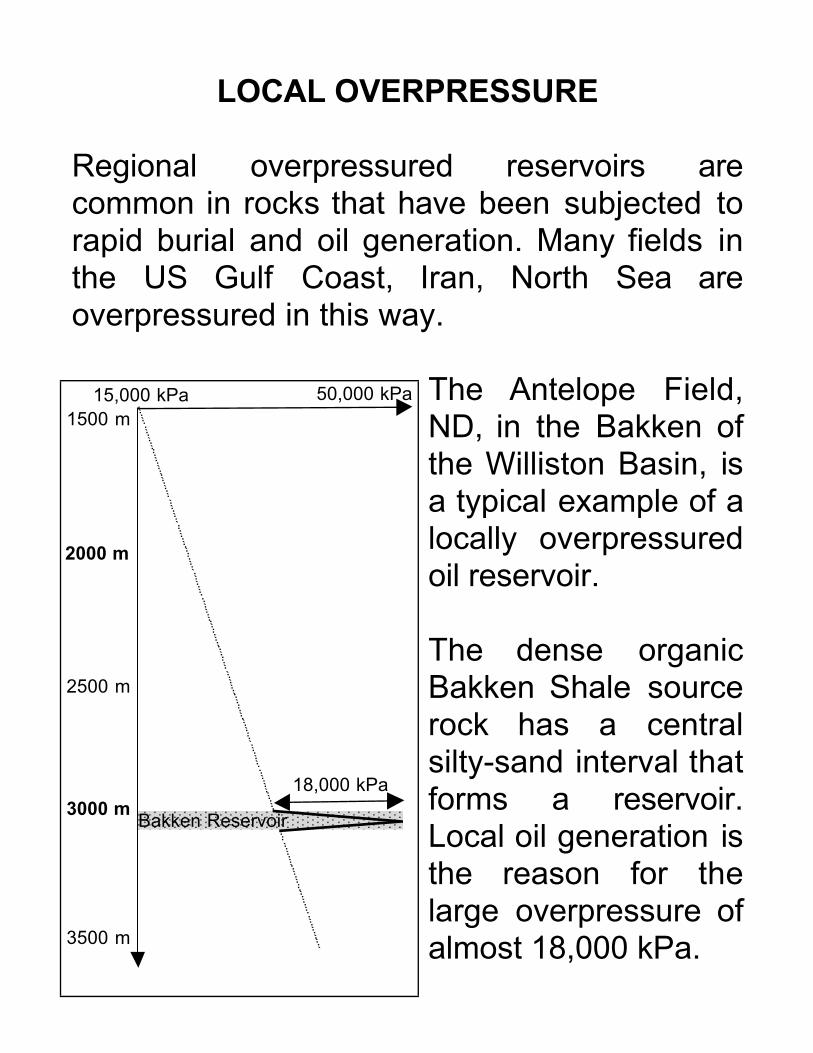
LOCAL OVERPRESSURE
Regional overpressured reservoirs arecommon in rocks that have been subjected torapid burial and oil generation. Many fields inthe US Gulf Coast, Iran, North Sea areoverpressured in this way.
The Antelope Field,ND, in the Bakken ofthe Williston Basin, isa typical example of alocally overpressuredoil reservoir.
The dense organicBakken Shale sourcerock has a centralsilty-sand interval thatforms a reservoir.Local oil generation isthe reason for thelarge overpressure ofalmost 18,000 kPa.3500 m
2500 m
1500 m
Bakken Reservoir
50,000 kPa
2000 m
3000 m
15,000 kPa
18,000 kPa
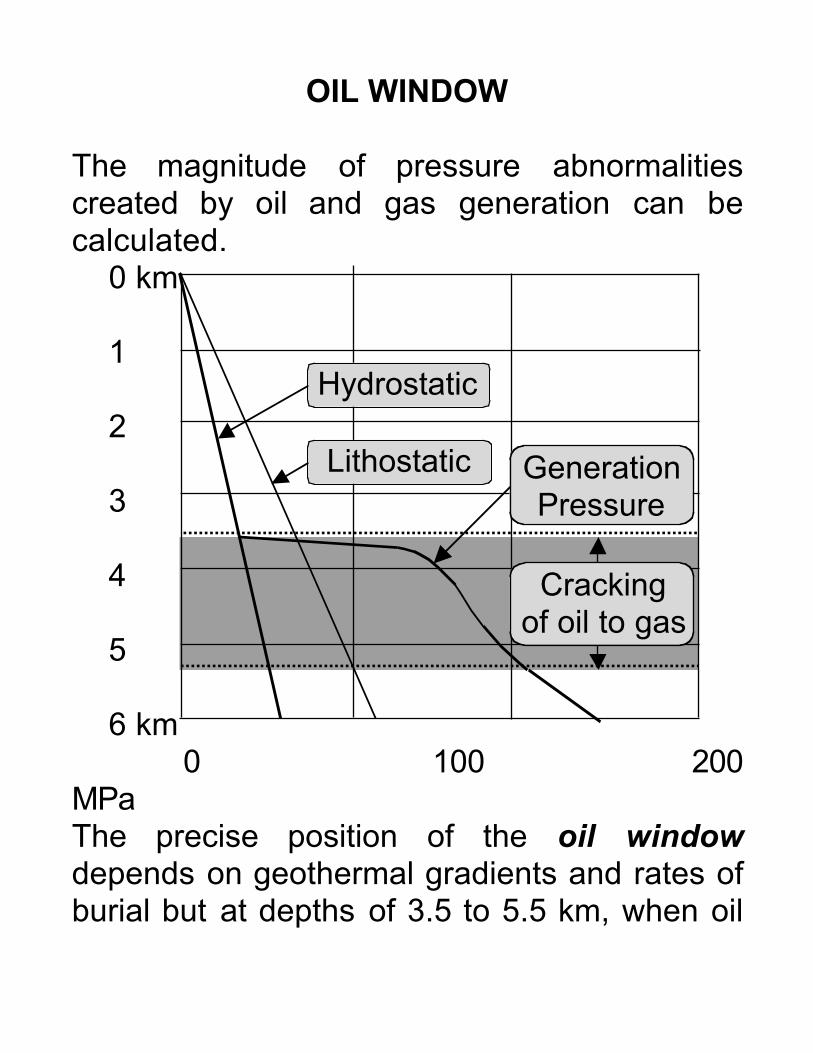
OIL WINDOW
The magnitude of pressure abnormalitiescreated by oil and gas generation can becalculated. 0 km
1
2
3
4
5
6 km 0 100 200 MPaThe precise position of the oil windowdepends on geothermal gradients and rates ofburial but at depths of 3.5 to 5.5 km, when oil
Hydrostatic
Lithostatic
Cracking of oil to gas
GenerationPressure
cracks to gas at 50% oil saturation, an excesspressure of about 150,000 kPa is generated.
FORMATION EVALUATION
Formation evaluation can be defined as thepractice of determining the physical andchemical properties of rocks and theircontained fluids.
Four main tools are available:1. Mud logging2. Wireline logging3. Core analysis4. Drillstem testing
Well logging is the process of creating arecord (or log) of some engineering orgeological property as a function of depth ortime.
This includes many kinds of data:1. Mud logs2. Wireline logs3. Core analysis plots4. Stratigraphic core logs5. Drillstem test parameter logs
WELL LOGGING
For simplicity, we will use well logging to meanmud logging and well logging only.
Since the first 10 electrical logs completed in1927 the number of wireline logs conductedper year has risen to over 500,000 in 1997. Theadoption of wireline logs as a commercialservices dates back to 1950.
Over half (53%) of all wireline logs conductedare radiation logs of some kind. About 35%are electrical logs and the remaining 12% areacoustic logs.
Mud logging was first introduced as acommercial service in 1939. The first mud logsinvolved only the detection of combustiblegases. By the 1970's, mud logging haddeveloped into a computerized procedureproviding continuous records of a largenumber of physical and chemical parameters.
MUD LOGGING
In the process of drilling, cuttings are mixedwith the drilling fluid (mud) and carried to thesurface where they are subjected to some orall of the following:
• gas-in-mud analysis• oil-in-mud analysis• gas-in-cuttings analysis• oil-in-cuttings analysis• cuttings description• non-hydrocarbon gas identification• cuttings density determination• drilling-fluid property analysis
The hydrocarbon analyses, drill penetrationrate, cuttings description and other propertiesplotted as a function of depth constitute a mudlog.
The mud log is the important first stage in theformation evaluation cycle ahead of coring,wireline logging and drillstem testing.
MUD LOGGING SENSORS
Sensors on the surface monitor:
• in and out mud weight, flow and temperature• in and out mud salinity and resistivity• mud pit level and volume• standpipe pressure• hook load (weight on bit)• drillpipe rotary torque and revolution rate• mud pump rate and pressure• total bit revolutions• depth penetration and rate of penetration
Sensors on the drillstring (near the bit)monitor:
• direction and inclination of the hole• resistivity of the formation• natural gamma radiation• mud temperature and resistivity• weight and torque on the bit• mud column pressure
IMPORTANCE OF MUD LOGGING
Comprehensive data on drilling performanceand mud conditions are essential to safe andcost-effective drilling operations.
Formation evaluation, drilling optimization andrig-site safety are all served by mud logginginformation.
Continuous monitoring of drilling fluidproperties, pressures and volumes providesearly warning of potential hazards including:
• abnormal formation pressures• sour gas (hydrogen sulphide)• salt-section penetration
Weight on bit and rotary torque relationshipsprovide insight on:
• formation properties including fracturing• optimizing bit performance
DRILLING FLUID
Drilling fluid (mud) is formulated to controlformation fluid pressure. Because mudpressure normally exceeds formation pressure(overbalanced drilling), mud filtrate invadesnewly drilled formation and flusheshydrocarbon ahead of the bit.
Flushing tendencies increase as the pressureoverbalance is increased. The desire to avoid"blow-outs" often leads to drilling with mudpressures significantly in excess of formationpressures.
For logging purposes, an optimum drilling fluidinvolves:
• straight in-gauge holes• minimum overbalance• effective cutting carrying capacity• no hydrocarbon contamination
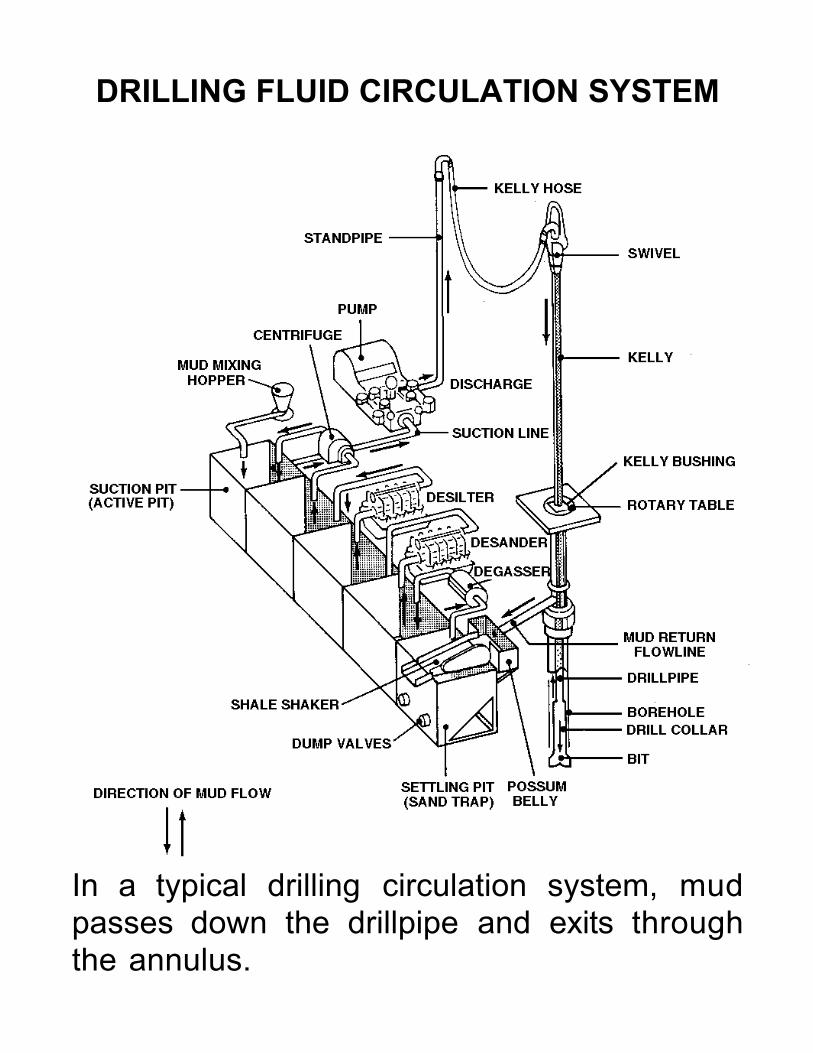
DRILLING FLUID CIRCULATION SYSTEM
In a typical drilling circulation system, mudpasses down the drillpipe and exits throughthe annulus.
DRILLING FLUID CIRCULATION
Drilling fluid is pumped to the bottom of thehole through the drillpipe and collars andarrives after a time that depends on thedrillstring volume. Contamination from jointlubricants can be a problem and chemicalreactions can occur between drillstring andmuds generating H2, which may be falselydetected as hydrocarbon.
At the drill bit, flow ports designed to increasepressure and velocity at the bit-formationinterface can increase the tendency forflushing and effect hydrocarbon logging. Thedesign of the bit teeth controls the size andshape of cuttings.
The annulus between the drillpipe and theborehole face is the conduit for mud andcuttings returning to the surface. This exposesthe cuttings to contamination by caving frompreviously drilled formations and/or producedfluids.
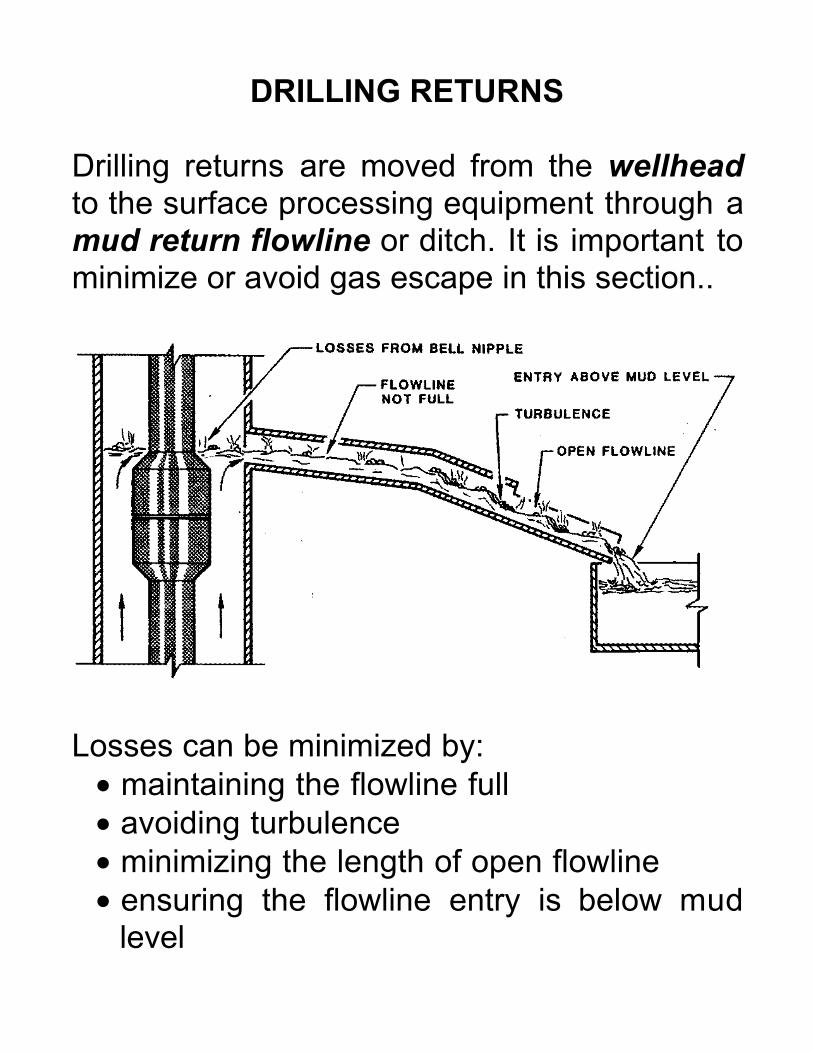
DRILLING RETURNS
Drilling returns are moved from the wellheadto the surface processing equipment through amud return flowline or ditch. It is important tominimize or avoid gas escape in this section..
Losses can be minimized by:• maintaining the flowline full• avoiding turbulence• minimizing the length of open flowline• ensuring the flowline entry is below mud
level
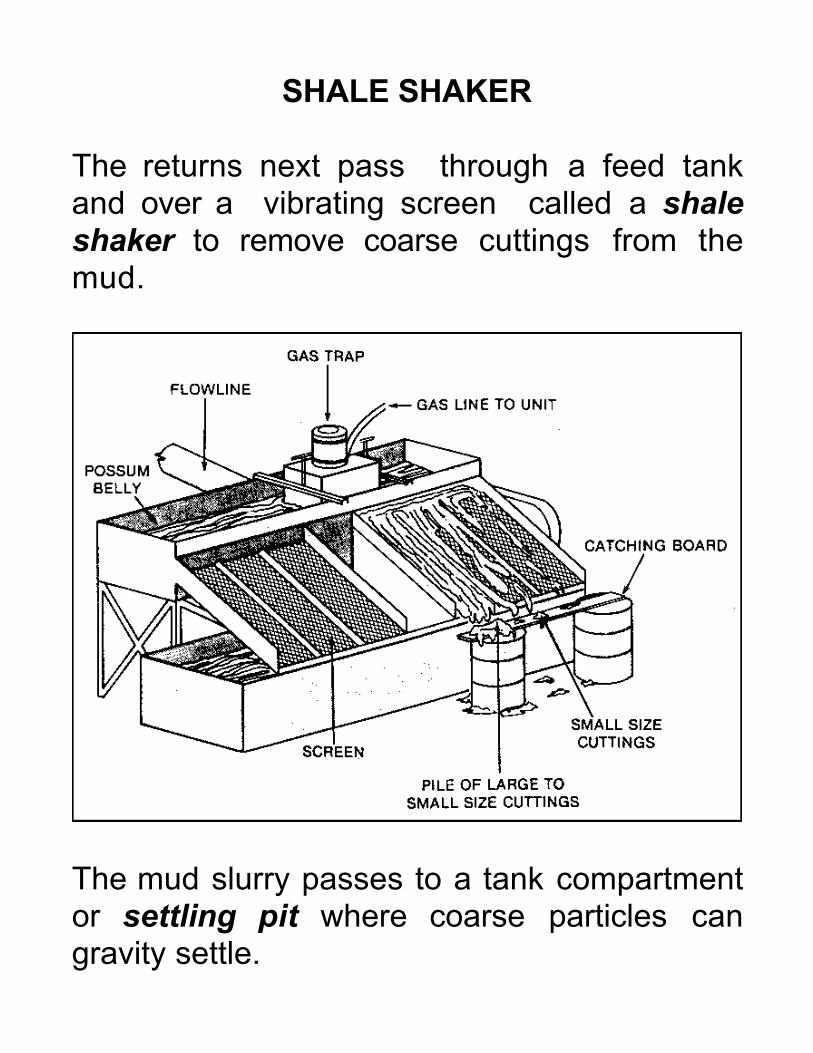
SHALE SHAKER
The returns next pass through a feed tankand over a vibrating screen called a shaleshaker to remove coarse cuttings from themud.
The mud slurry passes to a tank compartmentor settling pit where coarse particles cangravity settle.
MUD CONDITIONING
Subsequent tank compartments pass the mudthrough a degasser, to minimize hydrocarboncontamination in the recirculated fluids, and onthrough desanders and desilters, to removefiner particles.
The objective of this part of the circulationsystem is to maintain mud quality andminimize contamination and degradation of themud.
The final tank compartment is the suction pitfrom which the mud pump draws. Hereadditional material is added to the mud tomaintain its density and viscosity before it ispumped into the drillstring and down to the bit.
Suction pit additives include:• mud (bentonite, etc)• lubricants (diesel etc)• densifiers (barite etc)• fluid (brine etc)
MEASUREMENT OF SAMPLE DEPTH
Finally, the mud arrives in the active suctionpit where the it is conditioned to the requireddensity and viscosity before it passes throughthe mud pump and back to the hole.
Because drilling advances in the time interval ittakes for mud and cuttings to flow up the hole,there is a lag between the driller's depth whenthe sample is cut and the driller's depth whenthe sample arrives at the surface.
Mud pump displacement measurement iscritical to the assignment of accurate depths tocuttings samples. Differences are measured inthe number of pump strokes, which are readilyconverted to depth increments.
This lag is measured by using both gas(acetylene generated from addition of calciumcarbide) and solid tracers (crushed brick etc)because buoyancy causes gases and cuttingsto travel at different rates in the annulus.
PENETRATION RATE
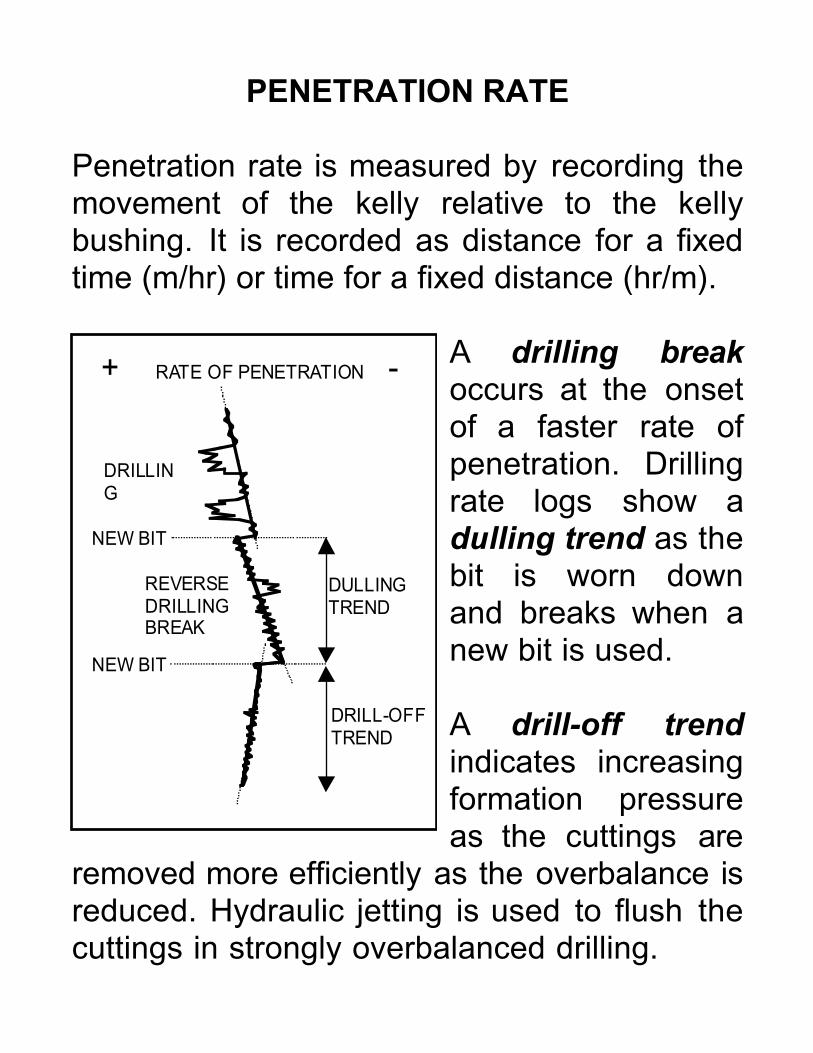
Penetration rate is measured by recording themovement of the kelly relative to the kellybushing. It is recorded as distance for a fixedtime (m/hr) or time for a fixed distance (hr/m).
A drilling breakoccurs at the onsetof a faster rate ofpenetration. Drillingrate logs show adulling trend as thebit is worn downand breaks when anew bit is used.
A drill-off trendindicates increasingformation pressureas the cuttings are
removed more efficiently as the overbalance isreduced. Hydraulic jetting is used to flush thecuttings in strongly overbalanced drilling.
+ RATE OF PENETRATION -
DRILL-OFFTREND
DRILLING
REVERSEDRILLINGBREAK
DULLINGTREND
NEW BIT
NEW BIT
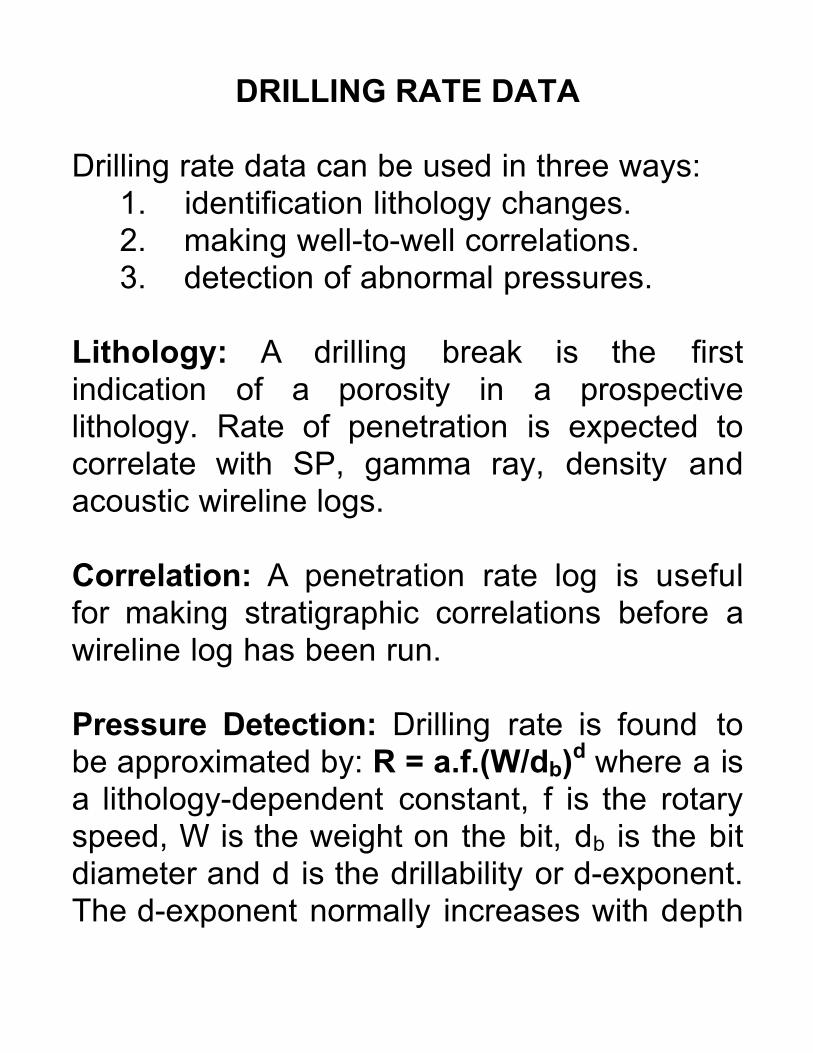
DRILLING RATE DATA
Drilling rate data can be used in three ways:1. identification lithology changes.2. making well-to-well correlations.3. detection of abnormal pressures.
Lithology: A drilling break is the firstindication of a porosity in a prospectivelithology. Rate of penetration is expected tocorrelate with SP, gamma ray, density andacoustic wireline logs.
Correlation: A penetration rate log is usefulfor making stratigraphic correlations before awireline log has been run.
Pressure Detection: Drilling rate is found tobe approximated by: R = a.f.(W/db)d where a isa lithology-dependent constant, f is the rotaryspeed, W is the weight on the bit, db is the bitdiameter and d is the drillability or d-exponent.The d-exponent normally increases with depth

but is observed to fall with depth whenoverpressure is encountered.
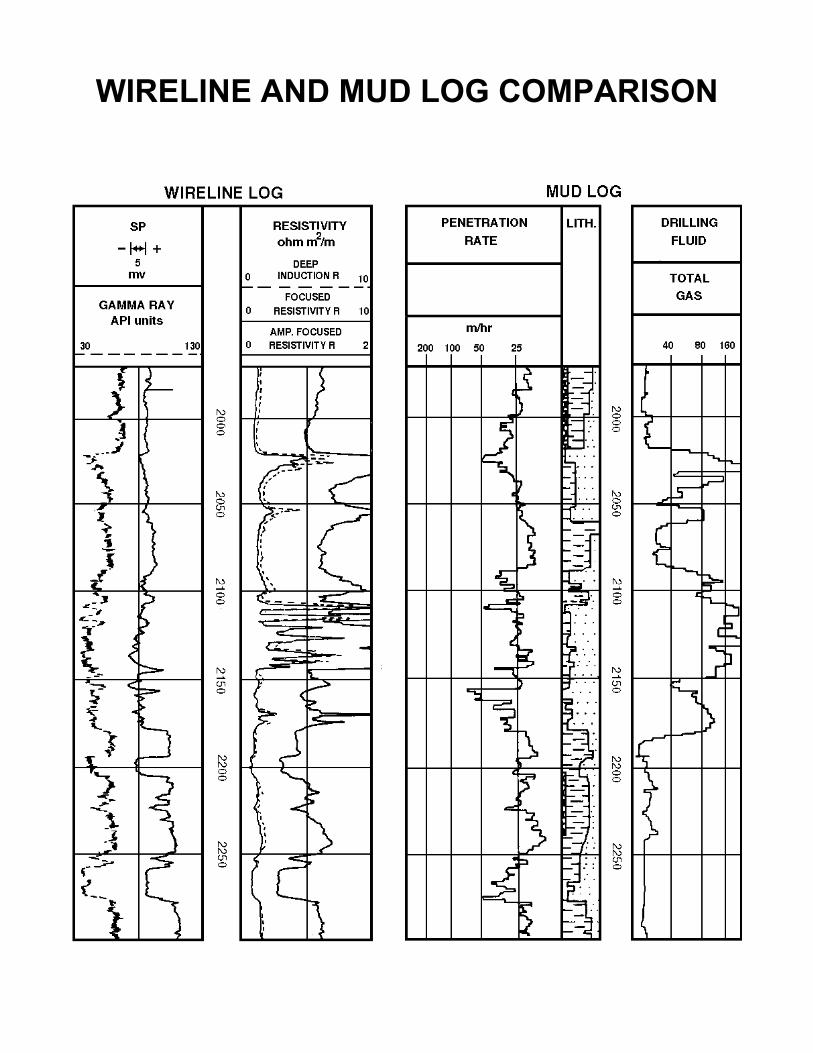
WIRELINE AND MUD LOG COMPARISON
LOGGING HYDROCARBONS
Hydrocarbon sensing is a critical component ofmud logging.
Logging cuttings lithologies, and penetrationrates are important for reducing ambiguities inthe origin of entrained oil and gas but theultimate success or failure of a mud loggingoperation depends on the sensitivity andreliability of hydrocarbon monitoring.
Identification of the sources of oil and gas indrilling returns is a prerequisite to successfulformation evaluation.
Oil and gas enter the drilling fluid from severalsources:
1. cuttings and fluids from the current interval,2. production from previously drilled intervals,3. thermocatalytic generation during drilling,4. contamination
LIBERATED AND EXPELLED FLUIDS
As a new hole is drilled, a cylindrical volume offormation is broken up and mixed with thedrilling fluid. This process liberates formationfluids into the drilling fluid.
Cuttings from a newly drilled interval retain aportion of their formation fluids in the chips.The cuttings and fluids enter the mud columnunder bottom hole pressure (bhp).
As the cuttings travel to the surface thepressure reduces. The retained fluids in thechips expand and are expelled into thedrilling returns.
There is no practical method to distinguishbetween liberated and expelled fluids sincethese component are mixed in the mudcolumn.
The combined liberated, expelled and retainedfluids constitute a show.
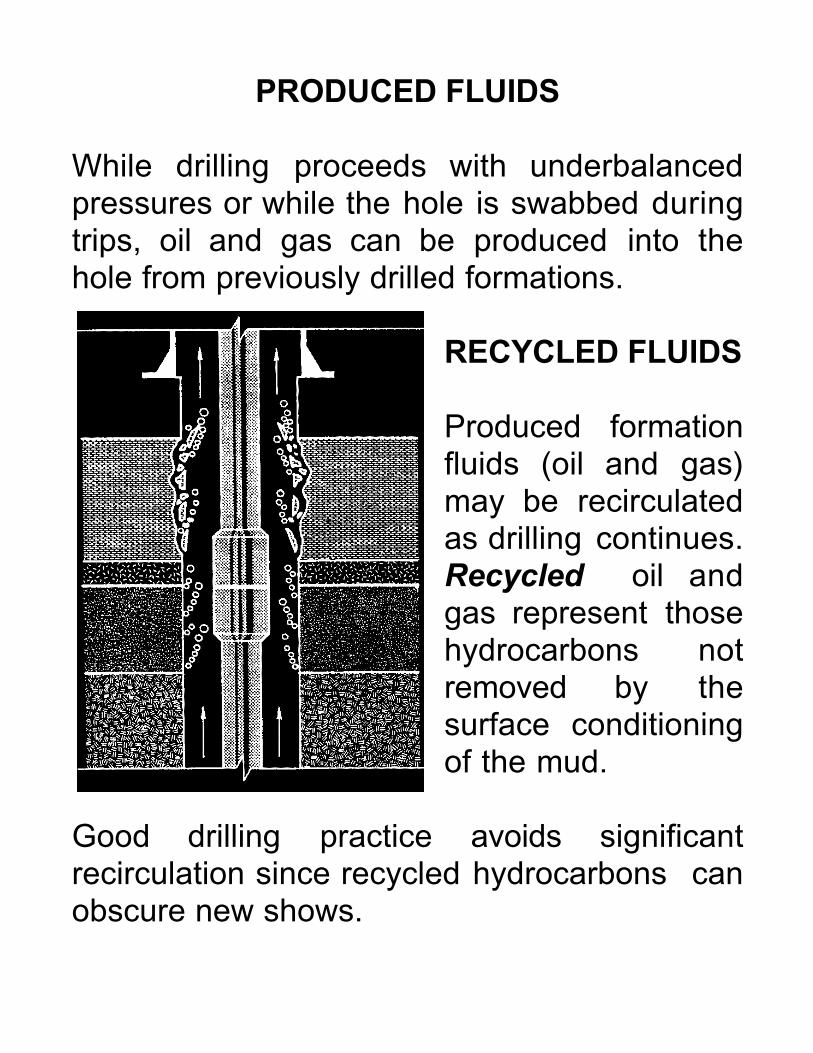
PRODUCED FLUIDS
While drilling proceeds with underbalancedpressures or while the hole is swabbed duringtrips, oil and gas can be produced into thehole from previously drilled formations.
RECYCLED FLUIDS
Produced formationfluids (oil and gas)may be recirculatedas drilling continues.Recycled oil andgas represent thosehydrocarbons notremoved by thesurface conditioningof the mud.
Good drilling practice avoids significantrecirculation since recycled hydrocarbons canobscure new shows.
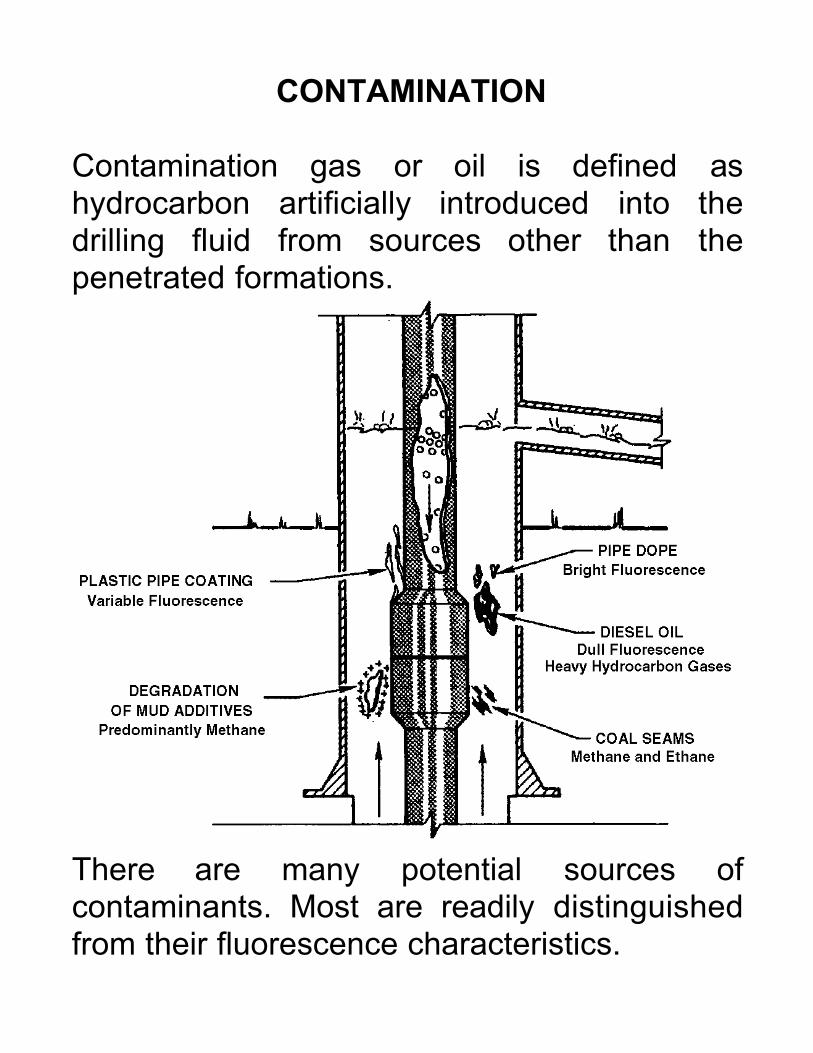
CONTAMINATION
Contamination gas or oil is defined ashydrocarbon artificially introduced into thedrilling fluid from sources other than thepenetrated formations.
There are many potential sources ofcontaminants. Most are readily distinguishedfrom their fluorescence characteristics.
CONTAMINANT SOURCES
A common contaminant is diesel fuel, whichmay either: contribute small amounts of gas orscavenge gas and deplete the mud returns.Diesel contamination is either a minornuisance as a source of gas or a seriousproblem as a scavenger. These problems areminimized by using Grade 1 or Grade 2 refineddiesel products rather than bunker fuel.
Hydrocarbon gases can also originate fromorganic additives (such as lubricant greasesand pipe dope), which may generate H2S orCO2 and interfere with some gas-in-mudmeasurements.
THERMOCATALYTIC GENERATION
Conversion of organic content by thermalprocesses associated with drilling has beenpostulated as a source of false shows. Thephenomenon is most likely to occur during theslow drilling of organic-rich shales.