Embed Size (px)
Citation preview
0 | Pressure in the system
Unlocking enterprise value through working capital management
2017/18
Pressure on the production lineWorking Capital in Global Manufacturing
www.pwc.com/workingcapitalopportunity
1 | Pressure in the system
Forward
Text for forward
Foreword
A time to capitalise on working capital to fund investment in technology
PwC’s annual global cross-industry study of working capital – ‘Pressure in the system’ – provides valuable insights into how companies are managing and using working capital. But it’s at the industry level that we often find the data is most useful to management in formulating and executing their working capital strategies.
Our study has looked at the cash opportunity tied up in working capital in manufacturing companies:
Global: €177bn UK: €5.1bn EU: €26.5bn
This sector-focused report into working capital in global manufacturing is no exception. At a time when manufacturers across the world are benefitting from rising global trade, our analysis shows clearly that the industry’s level of investment has been continuing to decline. This is worrying – especially given that manufacturing companies currently face a pressing need to invest in new technologies to sustain their long-term competitiveness.
The failure to invest more heavily in digital capabilities reflects the choices companies make. It’s understandable – and often valid – for manufacturers to claim they don’t have the cash to hand to invest at the moment. But there are many different ways to raise cash for investment, and one of the most readily-available is better management of working capital. This is an opportunity that many companies are currently failing to seize.
If there’s one message that shines through in this report, it’s that manufacturing companies should not regard their working capital simply as an overdraft, but should focus on it as the first option for funding investment in their business, without the need to access additional funding or put pressure on cash flows. For many manufacturers, the cash for investment in new technologies is already sitting in their business as working capital. It’s time to release it.
Cara HaffeyIndustrial Manufacturing Leader, PwC UK
Cara HaffeyIndustrial Manufacturing LeaderPwC UK
+44 (0)78 0955 [email protected]
2 | Pressure in the system
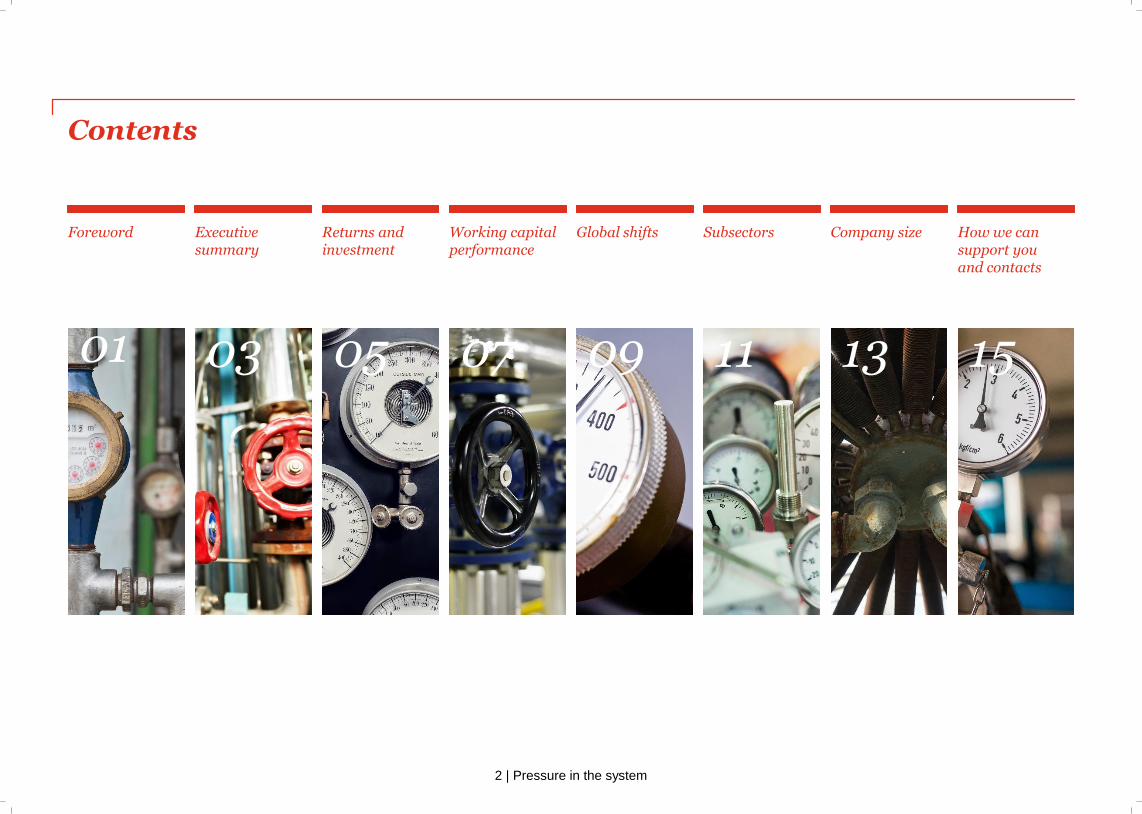
Contents
Foreword Executive summary
Returns and investment
Working capital performance
Global shifts Subsectors Company size How we can support you and contacts
01 03 05 07 09 11 13 15
3 | Pressure in the system
ForwardExecutive summary
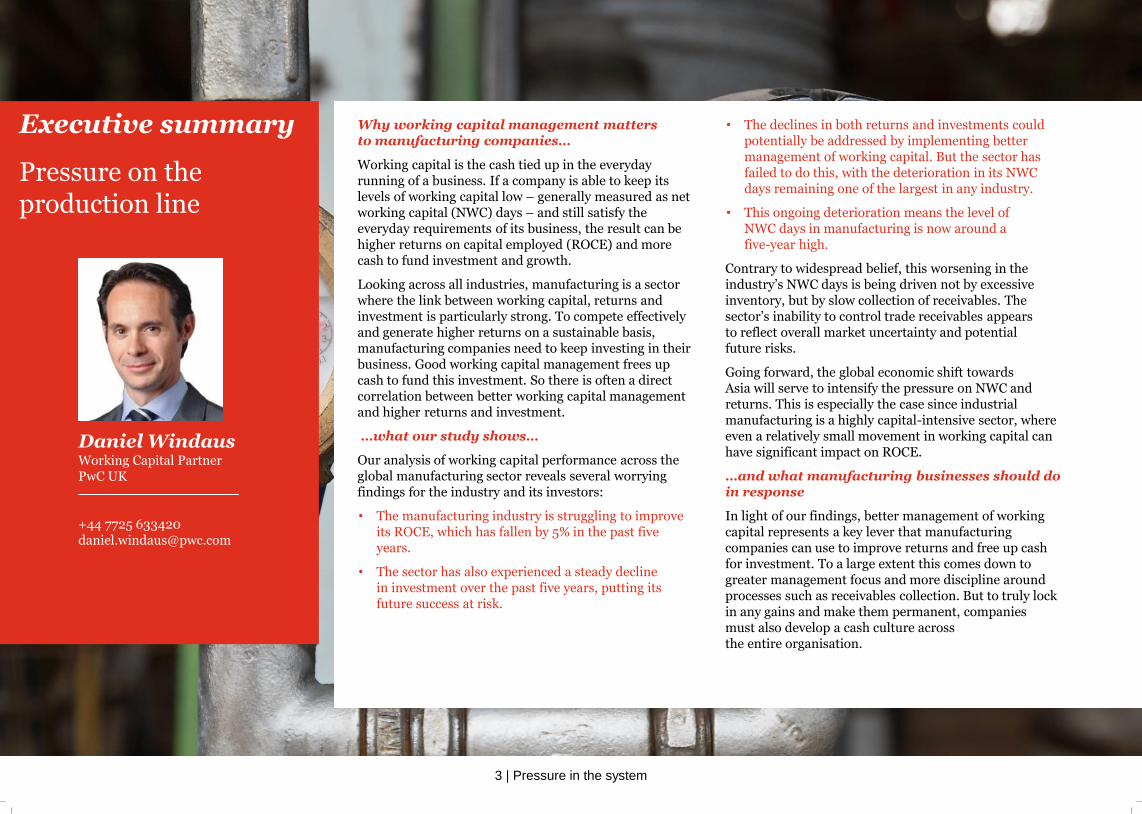
Pressure on the production line
Daniel WindausWorking Capital PartnerPwC UK
+44 7725 [email protected]
Why working capital management matters to manufacturing companies…
Working capital is the cash tied up in the everyday running of a business. If a company is able to keep its levels of working capital low – generally measured as net working capital (NWC) days – and still satisfy the everyday requirements of its business, the result can be higher returns on capital employed (ROCE) and more cash to fund investment and growth.
Looking across all industries, manufacturing is a sector where the link between working capital, returns and investment is particularly strong. To compete effectively and generate higher returns on a sustainable basis, manufacturing companies need to keep investing in their business. Good working capital management frees up cash to fund this investment. So there is often a direct correlation between better working capital management and higher returns and investment.
…what our study shows…
Our analysis of working capital performance across the global manufacturing sector reveals several worrying findings for the industry and its investors:
• The manufacturing industry is struggling to improve its ROCE, which has fallen by 5% in the past five years.
• The sector has also experienced a steady decline in investment over the past five years, putting its future success at risk.
• The declines in both returns and investments could potentially be addressed by implementing better management of working capital. But the sector has failed to do this, with the deterioration in its NWC days remaining one of the largest in any industry.
• This ongoing deterioration means the level of NWC days in manufacturing is now around a five-year high.
Contrary to widespread belief, this worsening in the industry’s NWC days is being driven not by excessive inventory, but by slow collection of receivables. The sector’s inability to control trade receivables appears to reflect overall market uncertainty and potential future risks.
Going forward, the global economic shift towards Asia will serve to intensify the pressure on NWC and returns. This is especially the case since industrial manufacturing is a highly capital-intensive sector, where even a relatively small movement in working capital can have significant impact on ROCE.
…and what manufacturing businesses should do in response
In light of our findings, better management of working capital represents a key lever that manufacturing companies can use to improve returns and free up cash for investment. To a large extent this comes down to greater management focus and more discipline around processes such as receivables collection. But to truly lock in any gains and make them permanent, companies must also develop a cash culture across the entire organisation.
4 | Pressure in the system
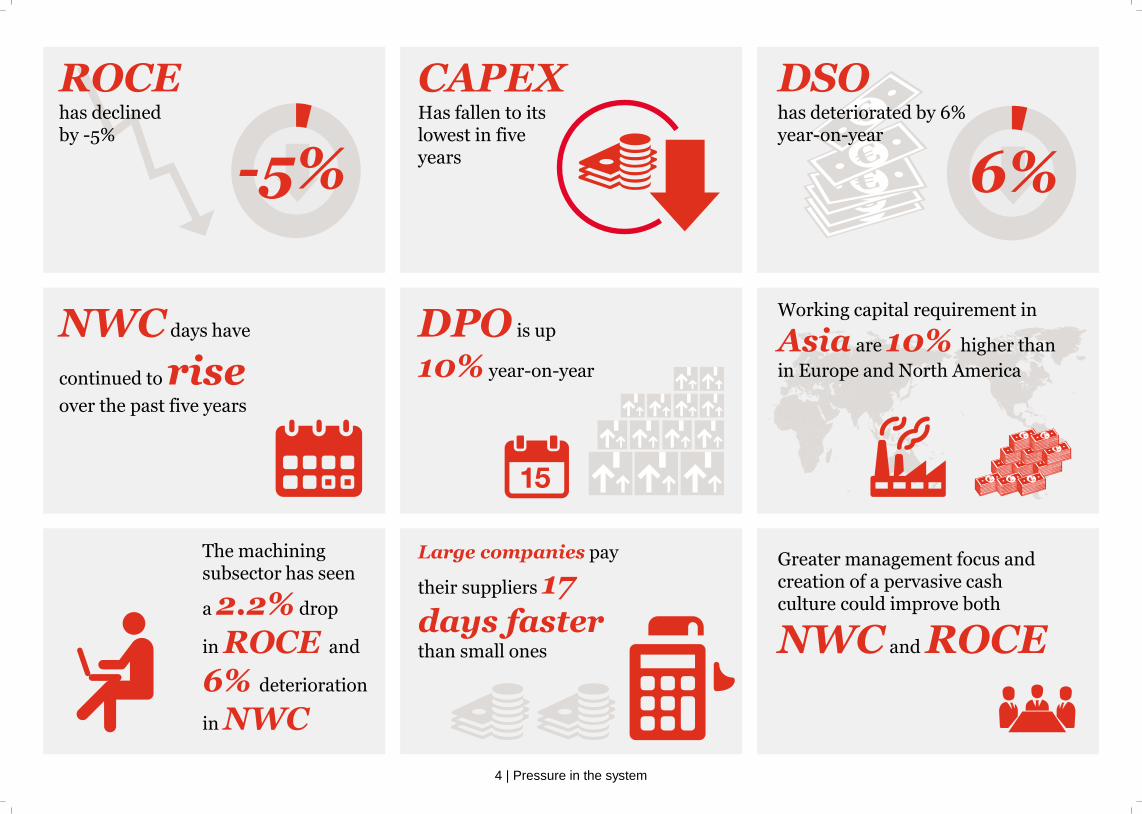
ROCEhas declinedby -5%
-5% 6%
CAPEXHas fallen to its lowest in five years
DSOhas deteriorated by 6% year-on-year
Working capital requirement in
Asia are 10% higher than
in Europe and North America
DPO is up
10% year-on-year
NWC days have
continued to riseover the past five years
The machining subsector has seen
a 2.2% drop
in ROCE and
6% deterioration
in NWC
Large companies pay
their suppliers 17 days fasterthan small ones
Greater management focus and creation of a pervasive cash culture could improve both
NWC and ROCE
5 | Pressure in the system
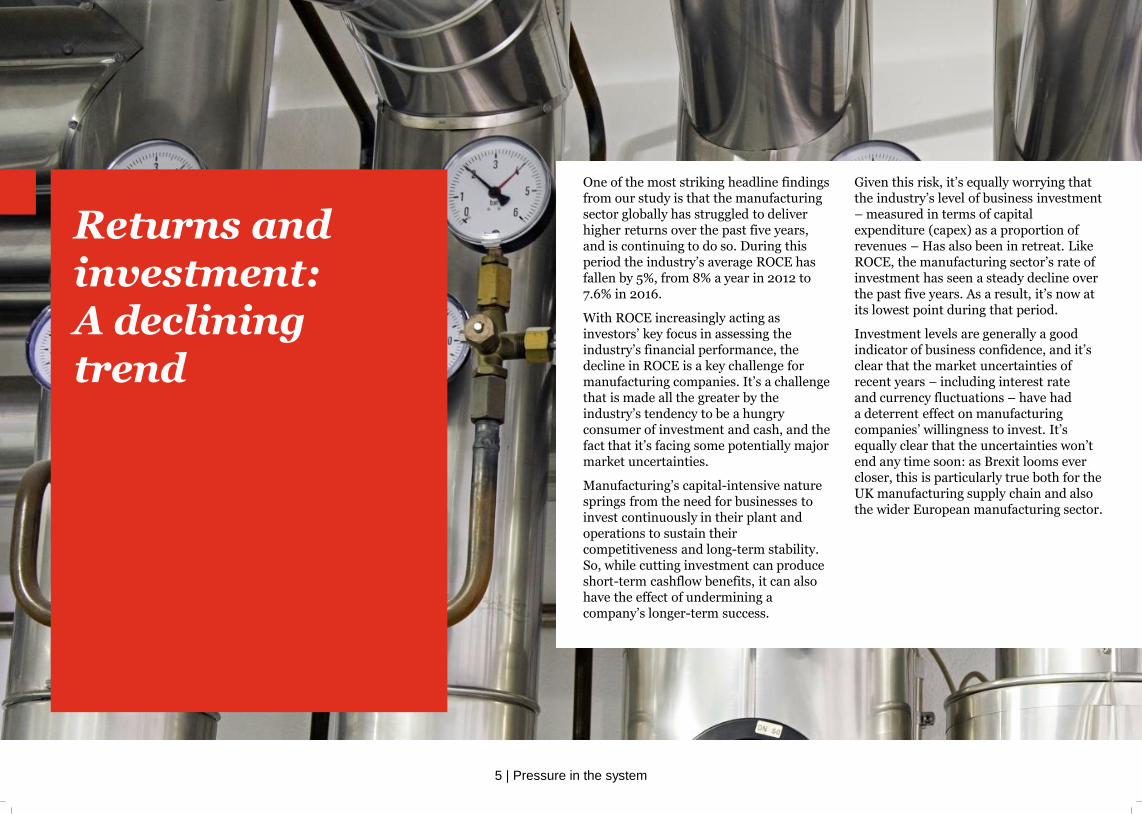
Returns and investment: A declining trend
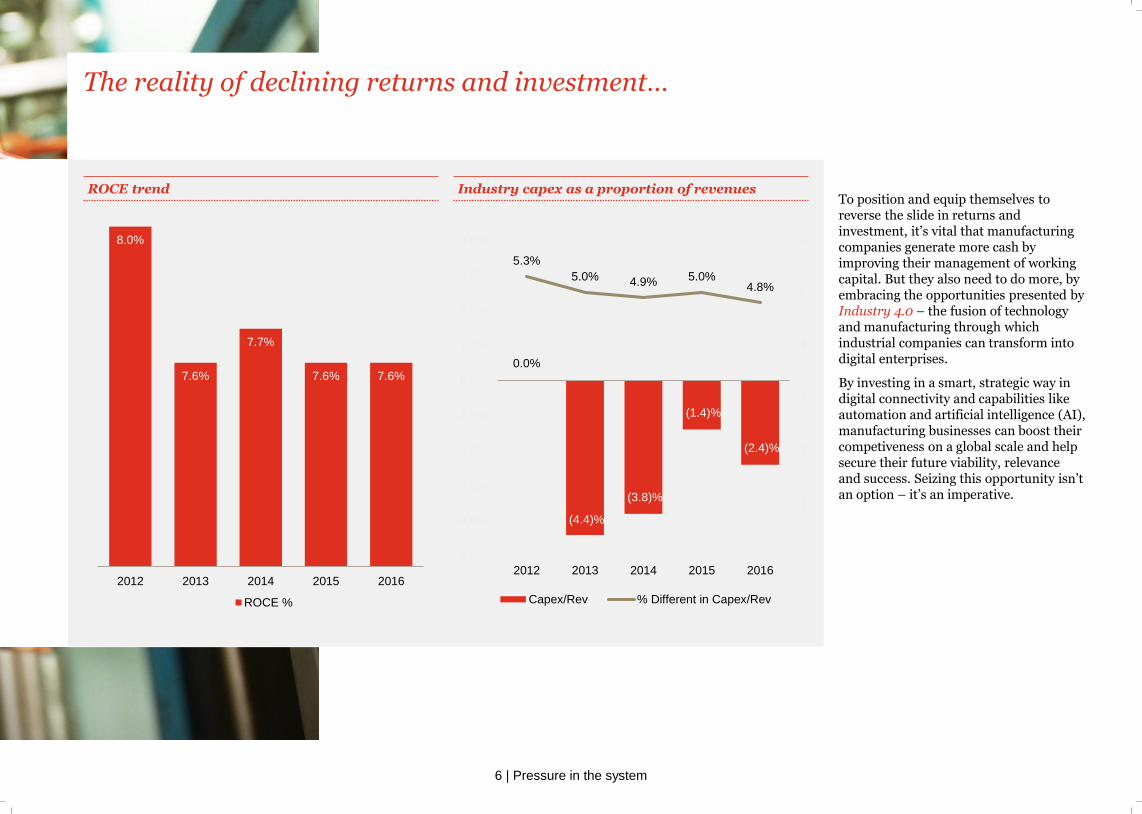
One of the most striking headline findings from our study is that the manufacturing sector globally has struggled to deliver higher returns over the past five years, and is continuing to do so. During this period the industry’s average ROCE has fallen by 5%, from 8% a year in 2012 to 7.6% in 2016.
With ROCE increasingly acting as investors’ key focus in assessing the industry’s financial performance, the decline in ROCE is a key challenge for manufacturing companies. It’s a challenge that is made all the greater by the industry’s tendency to be a hungry consumer of investment and cash, and the fact that it’s facing some potentially major market uncertainties.
Manufacturing’s capital-intensive nature springs from the need for businesses to invest continuously in their plant and operations to sustain their competitiveness and long-term stability. So, while cutting investment can produce short-term cashflow benefits, it can also have the effect of undermining a company’s longer-term success.
Given this risk, it’s equally worrying that the industry’s level of business investment – measured in terms of capital expenditure (capex) as a proportion of revenues – Has also been in retreat. Like ROCE, the manufacturing sector’s rate of investment has seen a steady decline over the past five years. As a result, it’s now at its lowest point during that period.
Investment levels are generally a good indicator of business confidence, and it’s clear that the market uncertainties of recent years – including interest rate and currency fluctuations – have had a deterrent effect on manufacturing companies’ willingness to invest. It’s equally clear that the uncertainties won’t end any time soon: as Brexit looms ever closer, this is particularly true both for the UK manufacturing supply chain and also the wider European manufacturing sector.
6 | Pressure in the system
ROCE trend Industry capex as a proportion of revenues
8.0%
7.6%
7.7%
7.6% 7.6%
2012 2013 2014 2015 2016
ROCE %
0.0%
(4.4)%
(3.8)%
(1.4)%
(2.4)%
5.3%
5.0% 4.9% 5.0%4.8%
0
1
2
3
4
5
6
-5.0%
-4.0%
-3.0%
-2.0%
-1.0%
0.0%
1.0%
2.0%
3.0%
4.0%
2012 2013 2014 2015 2016
Capex/Rev % Different in Capex/Rev
The reality of declining returns and investment…
To position and equip themselves to reverse the slide in returns and investment, it’s vital that manufacturing companies generate more cash by improving their management of working capital. But they also need to do more, by embracing the opportunities presented by Industry 4.0 – the fusion of technology and manufacturing through which industrial companies can transform into digital enterprises.
By investing in a smart, strategic way in digital connectivity and capabilities like automation and artificial intelligence (AI), manufacturing businesses can boost their competiveness on a global scale and help secure their future viability, relevance and success. Seizing this opportunity isn’t an option – it’s an imperative.
7 | Pressure in the system
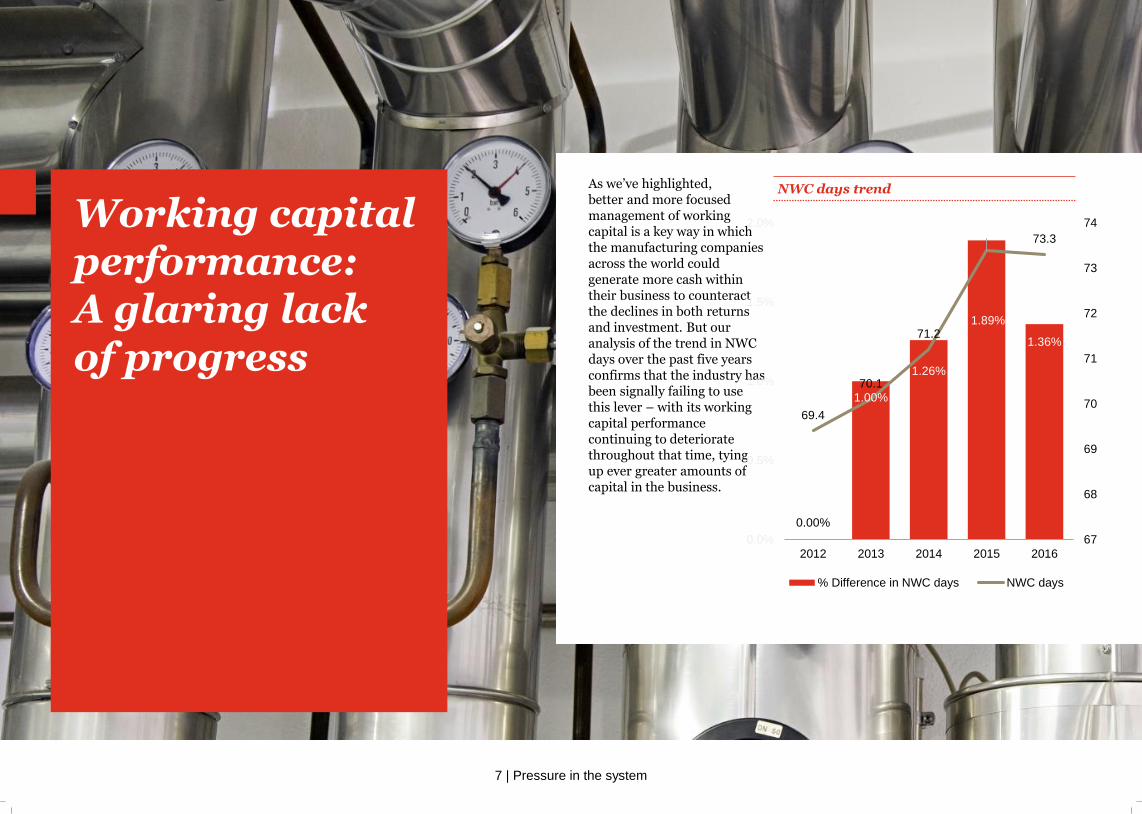
Working capital performance: A glaring lack of progress
As we’ve highlighted, better and more focused management of working capital is a key way in which the manufacturing companies across the world could generate more cash within their business to counteract the declines in both returns and investment. But our analysis of the trend in NWC days over the past five years confirms that the industry has been signally failing to use this lever – with its working capital performance continuing to deteriorate throughout that time, tying up ever greater amounts of capital in the business.
NWC days trend
0.00%
1.00%
1.26%
1.89%
1.36%
69.4
70.1
71.2
73.473.3
67
68
69
70
71
72
73
74
0.0%
0.5%
1.0%
1.5%
2.0%
2012 2013 2014 2015 2016
% Difference in NWC days NWC days
8 | Pressure in the system
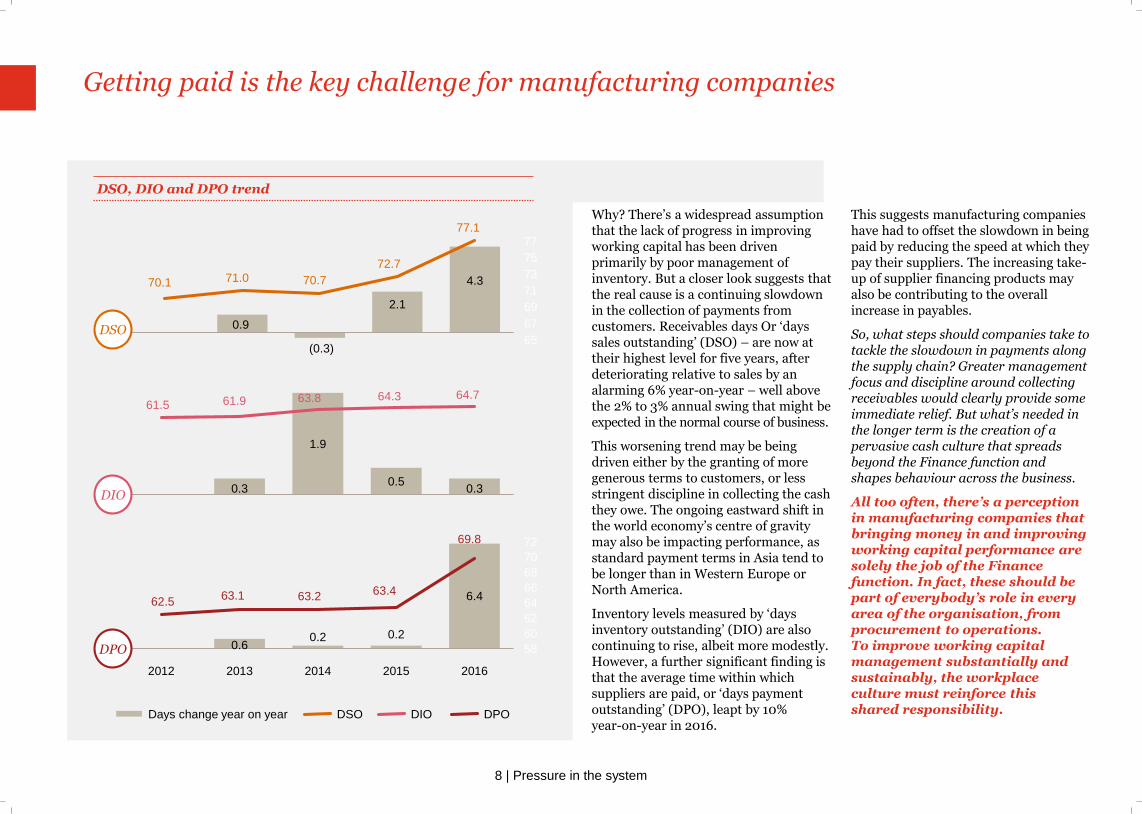
Getting paid is the key challenge for manufacturing companies
DSO, DIO and DPO trend
0.9
(0.3)
2.1
4.370.1 71.0 70.7
72.7
77.1
65
67
69
71
73
75
77
-0.4
0.6
1.6
2.6
3.6
4.6
2012 2013 2014 2015 2016
DSO
0.3
1.9
0.50.3
61.5 61.9 63.8 64.3 64.7
40
45
50
55
60
65
70
0.0
0.5
1.0
1.5
2.0
2012 2013 2014 2015 2016
DIO
0.60.2 0.2
6.462.563.1 63.2 63.4
69.8
58
60
62
64
66
68
70
72
0.0
1.0
2.0
3.0
4.0
5.0
6.0
2012 2013 2014 2015 2016
DPO
Days change year on year DSO DIO DPO
Why? There’s a widespread assumption that the lack of progress in improving working capital has been driven primarily by poor management of inventory. But a closer look suggests that the real cause is a continuing slowdown in the collection of payments from customers. Receivables days Or ‘days sales outstanding’ (DSO) – are now at their highest level for five years, after deteriorating relative to sales by an alarming 6% year-on-year – well above the 2% to 3% annual swing that might be expected in the normal course of business.
This worsening trend may be being driven either by the granting of more generous terms to customers, or less stringent discipline in collecting the cash they owe. The ongoing eastward shift in the world economy’s centre of gravity may also be impacting performance, as standard payment terms in Asia tend to be longer than in Western Europe or North America.
Inventory levels measured by ‘days inventory outstanding’ (DIO) are also continuing to rise, albeit more modestly. However, a further significant finding is that the average time within which suppliers are paid, or ‘days payment outstanding’ (DPO), leapt by 10% year-on-year in 2016.
This suggests manufacturing companies have had to offset the slowdown in being paid by reducing the speed at which they pay their suppliers. The increasing take-up of supplier financing products may also be contributing to the overall increase in payables.
So, what steps should companies take to tackle the slowdown in payments along the supply chain? Greater management focus and discipline around collecting receivables would clearly provide some immediate relief. But what’s needed in the longer term is the creation of a pervasive cash culture that spreads beyond the Finance function and shapes behaviour across the business.
All too often, there’s a perception in manufacturing companies that bringing money in and improving working capital performance are solely the job of the Finance function. In fact, these should be part of everybody’s role in every area of the organisation, from procurement to operations. To improve working capital management substantially and sustainably, the workplace culture must reinforce this shared responsibility.
9 | Pressure in the system
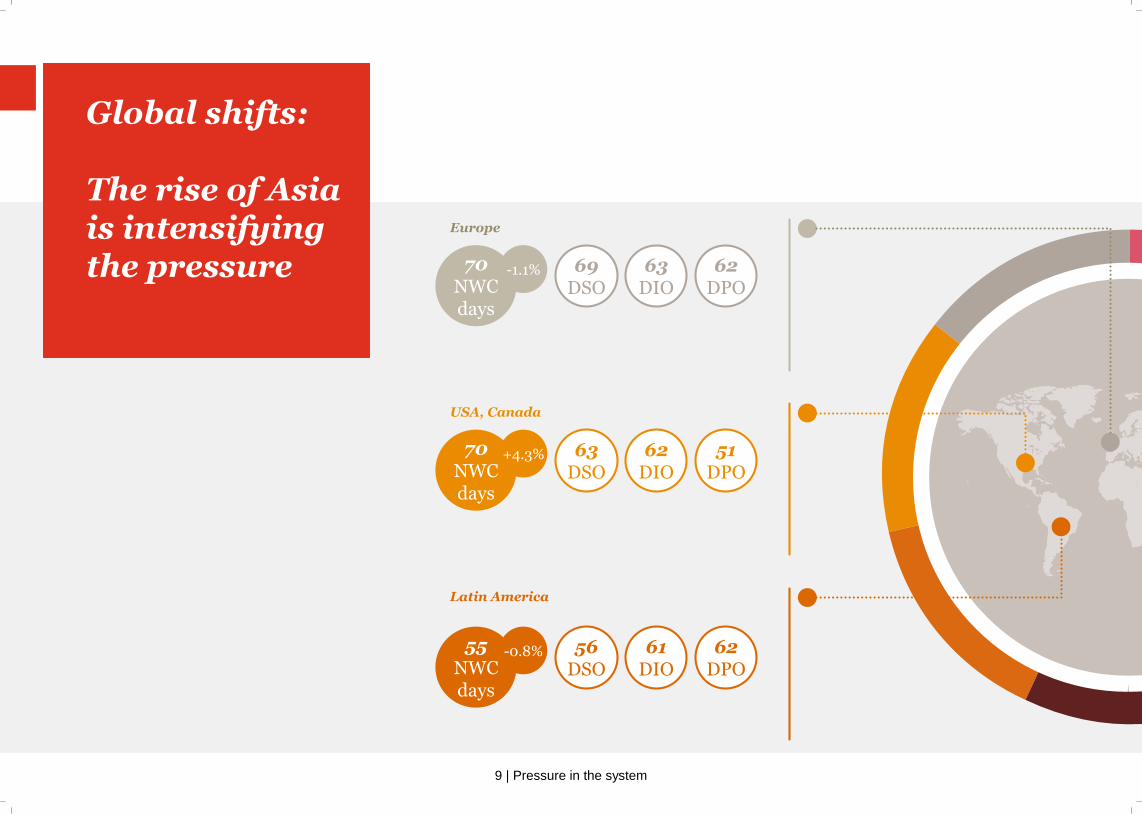
Europe
USA, Canada
Latin America
70NWCdays
-1.1% 69DSO
63DIO
62DPO
70NWCdays
+4.3% 63DSO
62DIO
51DPO
55NWCdays
-0.8% 56DSO
61DIO
62DPO
Global shifts:
The rise of Asia is intensifying the pressure
10 | Pressure in the system
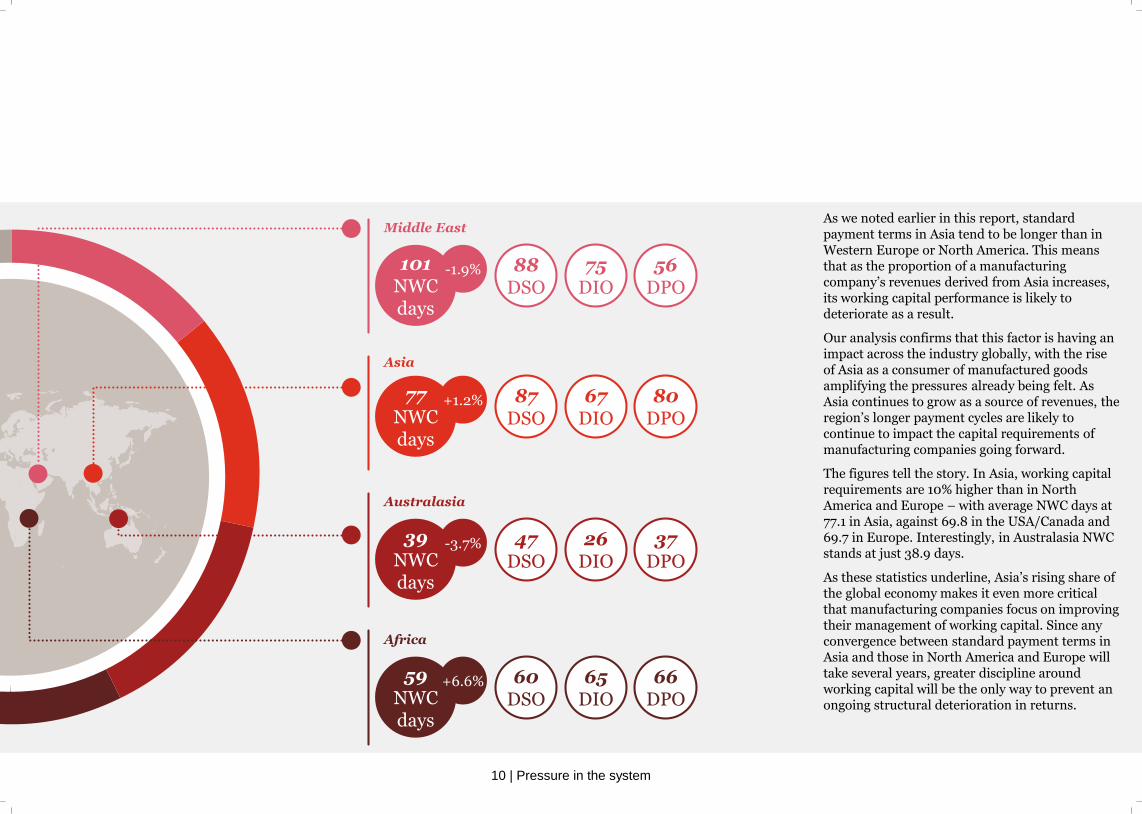
Middle East
Asia
Australasia
101NWCdays
-1.9% 88DSO
75DIO
56DPO
77NWCdays
+1.2% 87DSO
67DIO
80DPO
39NWCdays
-3.7% 47DSO
26DIO
37DPO
Africa
59NWCdays
+6.6% 60DSO
65DIO
66DPO
As we noted earlier in this report, standard payment terms in Asia tend to be longer than in Western Europe or North America. This means that as the proportion of a manufacturing company’s revenues derived from Asia increases, its working capital performance is likely to deteriorate as a result.
Our analysis confirms that this factor is having an impact across the industry globally, with the rise of Asia as a consumer of manufactured goods amplifying the pressures already being felt. As Asia continues to grow as a source of revenues, the region’s longer payment cycles are likely to continue to impact the capital requirements of manufacturing companies going forward.
The figures tell the story. In Asia, working capital requirements are 10% higher than in North America and Europe – with average NWC days at 77.1 in Asia, against 69.8 in the USA/Canada and 69.7 in Europe. Interestingly, in Australasia NWC stands at just 38.9 days.
As these statistics underline, Asia’s rising share of the global economy makes it even more critical that manufacturing companies focus on improving their management of working capital. Since any convergence between standard payment terms in Asia and those in North America and Europe will take several years, greater discipline around working capital will be the only way to prevent an ongoing structural deterioration in returns.
11 | Pressure in the system
Subsectors:
12 | Pressure in the system
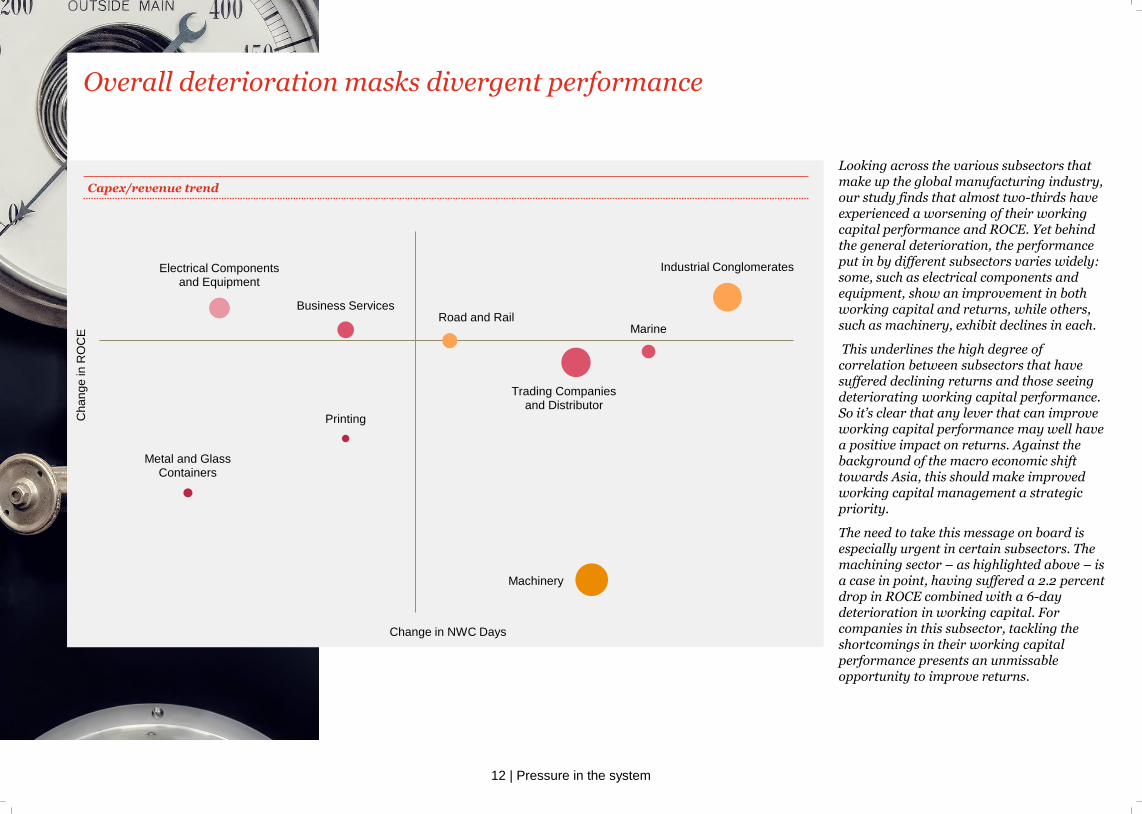
Business Services
Electrical Components and Equipment
Industrial Conglomerates
Machinery
Marine
Metal and Glass Containers
Printing
Road and Rail
Trading Companies and Distributor
Capex/revenue trend
Overall deterioration masks divergent performance
Change in NWC Days
Cha
ng
e in
RO
CE
Looking across the various subsectors that make up the global manufacturing industry, our study finds that almost two-thirds have experienced a worsening of their working capital performance and ROCE. Yet behind the general deterioration, the performance put in by different subsectors varies widely: some, such as electrical components and equipment, show an improvement in both working capital and returns, while others, such as machinery, exhibit declines in each.
This underlines the high degree of correlation between subsectors that have suffered declining returns and those seeing deteriorating working capital performance. So it’s clear that any lever that can improve working capital performance may well have a positive impact on returns. Against the background of the macro economic shift towards Asia, this should make improved working capital management a strategic priority.
The need to take this message on board is especially urgent in certain subsectors. The machining sector – as highlighted above – is a case in point, having suffered a 2.2 percent drop in ROCE combined with a 6-day deterioration in working capital. For companies in this subsector, tackling the shortcomings in their working capital performance presents an unmissable opportunity to improve returns.
13 | Pressure in the system
Company size
14 | Pressure in the system
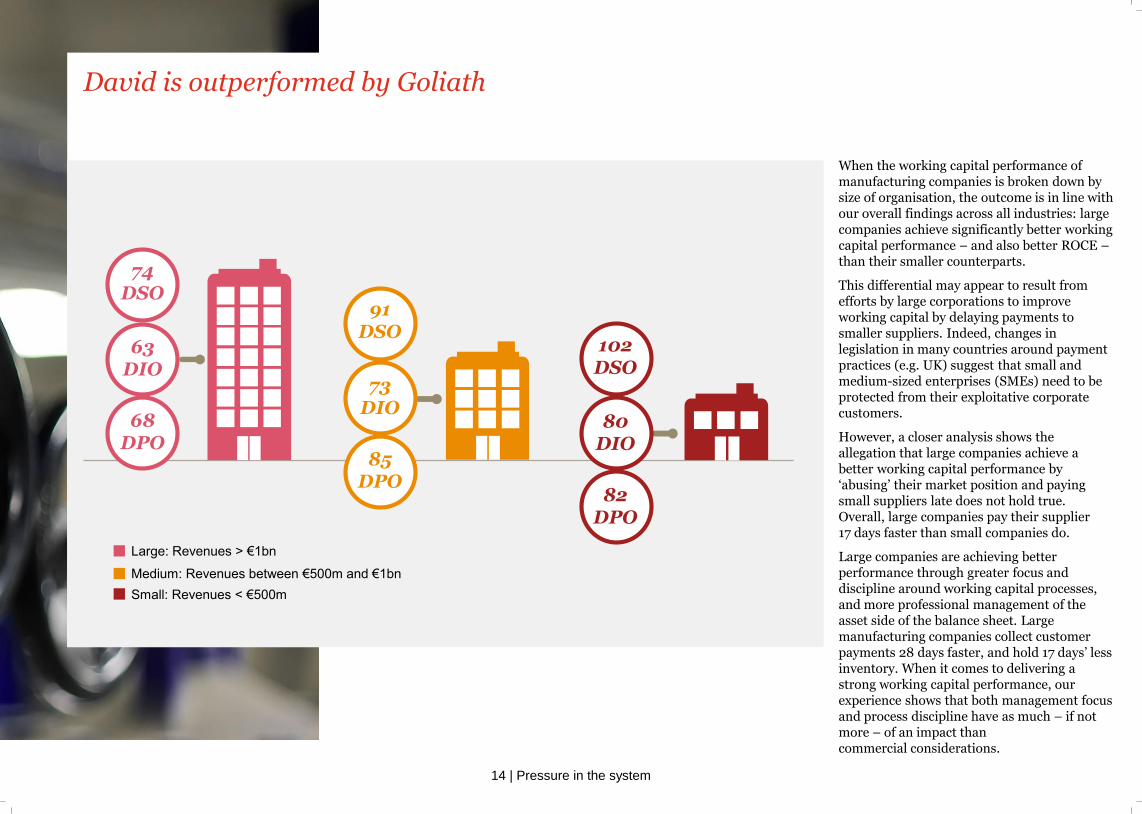
74DSO
63DIO
68DPO
91DSO
73DIO
85DPO
102DSO
80DIO
82DPO
Large: Revenues > €1bn
Medium: Revenues between €500m and €1bn
Small: Revenues < €500m
David is outperformed by Goliath
When the working capital performance of manufacturing companies is broken down by size of organisation, the outcome is in line with our overall findings across all industries: large companies achieve significantly better working capital performance – and also better ROCE –than their smaller counterparts.
This differential may appear to result from efforts by large corporations to improve working capital by delaying payments to smaller suppliers. Indeed, changes in legislation in many countries around payment practices (e.g. UK) suggest that small and medium-sized enterprises (SMEs) need to be protected from their exploitative corporate customers.
However, a closer analysis shows the allegation that large companies achieve a better working capital performance by ‘abusing’ their market position and paying small suppliers late does not hold true. Overall, large companies pay their supplier 17 days faster than small companies do.
Large companies are achieving better performance through greater focus and discipline around working capital processes, and more professional management of the asset side of the balance sheet. Large manufacturing companies collect customer payments 28 days faster, and hold 17 days’ less inventory. When it comes to delivering a strong working capital performance, our experience shows that both management focus and process discipline have as much – if not more – of an impact than commercial considerations.
15 | Pressure in the system
How we can support you
16 | Pressure in the system
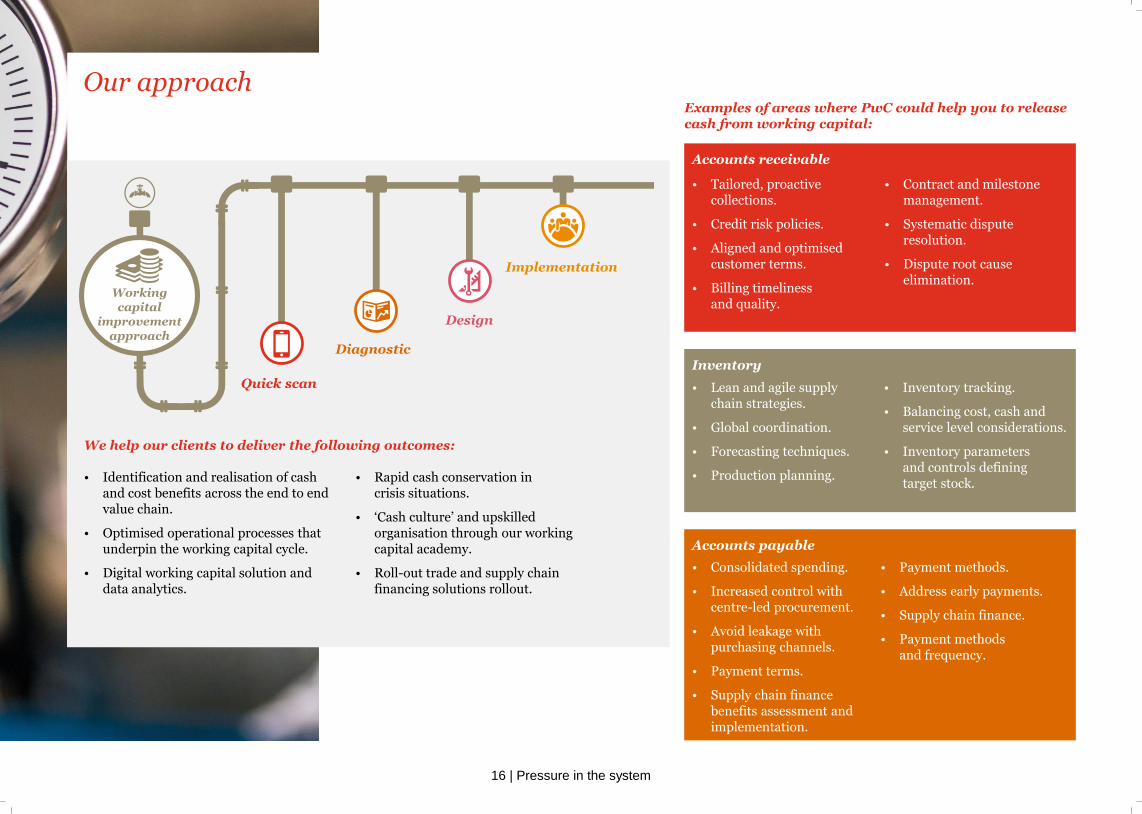
• Identification and realisation of cash and cost benefits across the end to end value chain.
• Optimised operational processes that underpin the working capital cycle.
• Digital working capital solution and data analytics.
• Rapid cash conservation in crisis situations.
• ‘Cash culture’ and upskilled organisation through our working capital academy.
• Roll-out trade and supply chain financing solutions rollout.
Examples of areas where PwC could help you to release cash from working capital:
Accounts receivable
Inventory
Accounts payable
Quick scan
Diagnostic
Design
Implementation
Workingcapital
improvementapproach
• Tailored, proactive collections.
• Credit risk policies.
• Aligned and optimised customer terms.
• Billing timeliness and quality.
• Contract and milestone management.
• Systematic dispute resolution.
• Dispute root cause elimination.
• Lean and agile supply chain strategies.
• Global coordination.
• Forecasting techniques.
• Production planning.
• Inventory tracking.
• Balancing cost, cash and service level considerations.
• Inventory parameters and controls defining target stock.
• Consolidated spending.
• Increased control with centre-led procurement.
• Avoid leakage with purchasing channels.
• Payment terms.
• Supply chain finance benefits assessment and implementation.
• Payment methods.
• Address early payments.
• Supply chain finance.
• Payment methods and frequency.
We help our clients to deliver the following outcomes:
Our approach

17 | Pressure in the system
Contacts

18 | Pressure in the system
Contacts
Daniel WindausWorking Capital Partner, PwC UK
M: +44(0) 7725 633420E: [email protected]
Cara HaffeyIndustrial Manufacturing Leader, PwC UK
M: +44(0) 7809 551517E: [email protected]
Craig KerrConsulting Manufacturing Partner, PwC UK
M: +44(0) 7714 229399E: [email protected]
Rob KortmanWorking Capital Partner, PwC UK
M: +44(0) 7803 859001E: [email protected]
Stephen TebbettWorking Capital Partner, PwC UK
M: +44(0) 7717 782240E: [email protected]

19 | Pressure in the system
All facts and figures derived from PwC’s Pressure in the system 2017/18 report.
This content is for general information purposes only, and should not be used as a substitute for consultations with professional advisors.
© 2018 PwC. All rights reserved. PwC refers to the PwC network and/or one or more of its member firms, each of which a separate legal entity. Please see
www.pwc.com/structure for further details.
180129-121746-KE-OS
www.pwc.com
www.pwc.com/workingcapitalopportunity