Embed Size (px)
Citation preview
MINISTEROFINTERNATIONALTRADEANDINDUSTRY
MALAYSIA
Embargo until 1200 hours,Friday, 6th November 2015
MALAYSIA EXTERNAL TRADE STATISTICS
TRADE PERFORMANCE FOR THE MONTH OF SEPTEMBER 2015 AND THE
PERIOD OF JANUARY- SEPTEMBER 2015 #
Minister of International Trade and IndustryMalaysia
Monthly Exports Breached RM70 billion Mark
Malaysia’s exports in September 2015 recorded a strong year-on-year growth of
8.8%, reaching RM70.16 billion, the highest monthly exports recorded in the first 9
months of the year. The achievement was supported by robust demand from major
markets mainly from ASEAN, the European Union (EU), the People’s Republic of
China (PRC) as well as the United States of America (USA). Imports in September
2015 grew by 9.6% to RM60.47 billion. Total trade rose 9.1% to RM130.63 billion
while trade surplus expanded by 4.1% to RM9.69 billion compared with September
2014, making it the 215th consecutive month of trade surplus since November 1997.
In the third Quarter (Q3) of 2015 total trade expanded by RM15.39 billion to
RM377.54 billion. Both exports and imports increased, registering growth of 5.5% to
RM199.88 billion and 2.9% to RM177.66 billion, respectively, compared to Q3 2014. A
sizeable trade surplus of RM22.22 billion was recorded in the Q3 2015, an increase of
Embargo until 1200 hours, Friday, 6th
November 2015
2
32.5%. On year-on-year basis, the expansion in exports in Q3 2015 was due to
higher exports of electrical and electronic (E&E) products; manufactures of metal,
machinery, appliances and parts, as well as chemicals and chemical products. In
terms of markets, significant increases in exports were recorded to the PRC, the USA,
Thailand, Vietnam, the Philippines and Germany.
On quarter-on-quarter basis, comparing Q3 2015 to Q2 2015, higher growth rate
was recorded for trade, exports and imports by 7.9%, 8% and 7.8%, respectively. This
was mainly contributed by the expansion in exports of E&E products, palm oil and
palm-based products, chemicals and chemical products as well as liquefied natural
gas (LNG). In terms of markets, higher exports were recorded to Singapore, the USA
and the PRC, driven mainly by exports of E&E products.
First Nine Months 2015 - Trade Surplus Widened to RM63.91 Billion
The country’s trade for the first 9 months of 2015 exceeded RM1 trillion mark, with
total trade amounting to RM1.073 trillion compared with RM1.077 trillion recorded in
the same period of 2014. Exports were valued at RM568.21 billion compared with
RM569.48 billion, while imports totalled RM504.3 billion compared with RM507.98
billion. Trade surplus for the first 9 months of 2015 increased to RM63.91 billion, a
3.9% growth.
Performance of Major Sectors
Overall, in September 2015 exports of manufactured goods registered positive growth
with almost all subsectors recording increases. Exports of agricultural and mining
goods, however, registered negative growth.
Manufactured Exports Grew 15.5%
Exports of manufactured goods valued at RM56.78 billion in September 2015,
accounted for 81% share of Malaysia’s total exports. Manufactured exports grew by
15.5% or RM7.64 billion, the highest growth recorded in the first 9 months of 2015.
Embargo until 1200 hours, Friday, 6th
November 2015
3
The increase in exports of manufactured goods was driven mainly by higher exports of
E&E products especially photosensitive semi-conductor devices, as well as parts and
accessories for office machines. Exports of E&E products in September 2015 were
valued at RM26.09 billion, an increase of 13.6% or RM3.13 billion from September
2014. Increases in exports were also recorded for most manufactured subsectors in
September 2015.
Exports of agricultural goods declined by 2.8% to RM6.38 billion due to lower
exports of palm oil and palm-based products which fell RM350.5 million or 7.3% to
RM4.43 billion from September 2014. Exports of natural rubber, however, increased
by RM61.5 million or 20.1%. Agricultural goods accounted for 9.1% of Malaysia’s total
exports in September 2015.
Exports of mining goods decreased by 21.7% to RM6.6 billion affected by the decline
in exports of LNG and crude petroleum. Mining goods accounted for 9.4% of
Malaysia’s total exports in September 2015.
Major exports in September 2015 were:
Electrical and electronic products valued at RM26.09 billion, with a share of 37.2%
of total exports, increased by 13.6% from September 2014;
Chemicals and chemical products (RM4.88 billion, 7.0%, ↑17.8%);
Petroleum products (RM4.63 billion, 6.6%, ↓10.1%);
Palm oil and palm-based products (palm oil; palm kernel oil and other palm based
products) (RM4.43 billion, 6.3%, ↓7.3%); and
LNG (RM3.35 billion, 4.8%, ↓33.3%).
For the first nine months of 2015, exports of manufactured goods grew by 4.4% to
RM454.88 billion with 80.1% share of total exports. Exports of mining goods
decreased by 22.6% to RM60.22 billion, (10.6% share) while exports of agricultural
goods were down by 4.9% to RM49.68 billion, (8.7% share).
Significant increases in manufactured exports were recorded for E&E products by
RM15.31 billion, manufactures of metal (↑RM4.31 billion), machinery, appliances and
Embargo until 1200 hours, Friday, 6th
November 2015
4
parts (↑RM3.72 billion), chemicals and chemical products (↑RM2.65 billion), and
rubber products (↑RM1.33 billion).
Performance of Major Markets
Double Digit Growth in Exports to ASEAN
Exports to ASEAN in September 2015 rose 11.5% to RM19.8 billion and accounted
for 28.2% share of Malaysia’s total exports. The increase was contributed mainly by
higher exports of E&E products (electronic integrated circuits), crude petroleum,
chemicals and chemical products (plastics in primary form), manufactures of metal,
machinery, appliances and parts (heating, cooling equipment & parts), processed food
as well as jewellery. Lower exports were however registered for petroleum products
as well as palm oil and palm-based products. Trade with ASEAN rose 14.8% to
RM35.97 billion, with higher imports from ASEAN by 19.2% to RM16.17 billion.
Breakdown of exports to ASEAN countries as follows:
Singapore RM 9.79 billion, increased by 10.4%
Thailand RM 3.71 billion, ↑16.2%
Indonesia RM 2.68 billion, ↓10.3%
Vietnam RM 1.61 billion, ↑26.8%
Philippines RM 1.49 billion, ↑70.8%
Myanmar RM 234.3 million, ↓11.6%
Brunei RM 209.9 million,↓14.9%
Cambodia RM 76.7 million, ↑33.6%
Lao PDR RM 4.7 million, ↓1.1%
Exports to Singapore increased by RM923.5 million with higher exports of E&E
products mainly electronic integrated circuits, jewellery, as well as machinery,
appliances and parts. Exports to Thailand expanded by RM516.8 million driven by
higher exports of E&E products (television reception apparatus) as well as chemicals
and chemical products. Higher exports to Vietnam by RM339.9 million were attributed
to petroleum products as well as chemicals and chemical products. Exports to
Embargo until 1200 hours, Friday, 6th
November 2015
5
Indonesia declined by RM307.9 million with lower exports were recorded for
petroleum products and E&E products.
Trade with ASEAN accounted for 27.3% of Malaysia’s total trade, with value of
RM292.86 billion compared with RM290.77 billion recorded in January-September
2014. Exports were valued at RM160.25 billion while imports amounted to RM132.61
billion, compared to RM159 billion and RM131.77 billion, respectively, for the
corresponding period in 2014.
Exports to the PRC Up by 13.1%
Exports to the PRC remained strong, registering positive growth year-on-year for the
seventh consecutive month since March 2015. In September 2015, exports to the
PRC rose 13.1% or RM1.05 billion to RM9.06 billion. This was mainly due to
significant increases in exports of manufactures of metal, petroleum products,
metalliferous ores, chemicals and chemical products as well as optical and scientific
equipment.
Imports from the PRC was valued at RM11.97 billion, an increase of 22.6% from
September 2014. Main imports from the PRC comprised E&E products, machinery,
appliances and parts, manufactures of metal, chemicals and chemical products as
well as clothings. In September 2015, total trade with the PRC expanded by 18.3% to
RM21.03 billion.
Malaysia’s trade with the PRC for the first nine months of 2015 registered a growth
of 10.6% to RM168.38 billion. Exports rose 9.7% to RM74.23 billion while imports
increased 11.3% to RM94.15 billion. Expansion in exports to the PRC was contributed
mainly by higher exports of petroleum products, metalliferous ores (aluminium ores
and concentrates), chemicals and chemical products, E&E products, as well as
machinery, appliances and parts.
Embargo until 1200 hours, Friday, 6th
November 2015
6
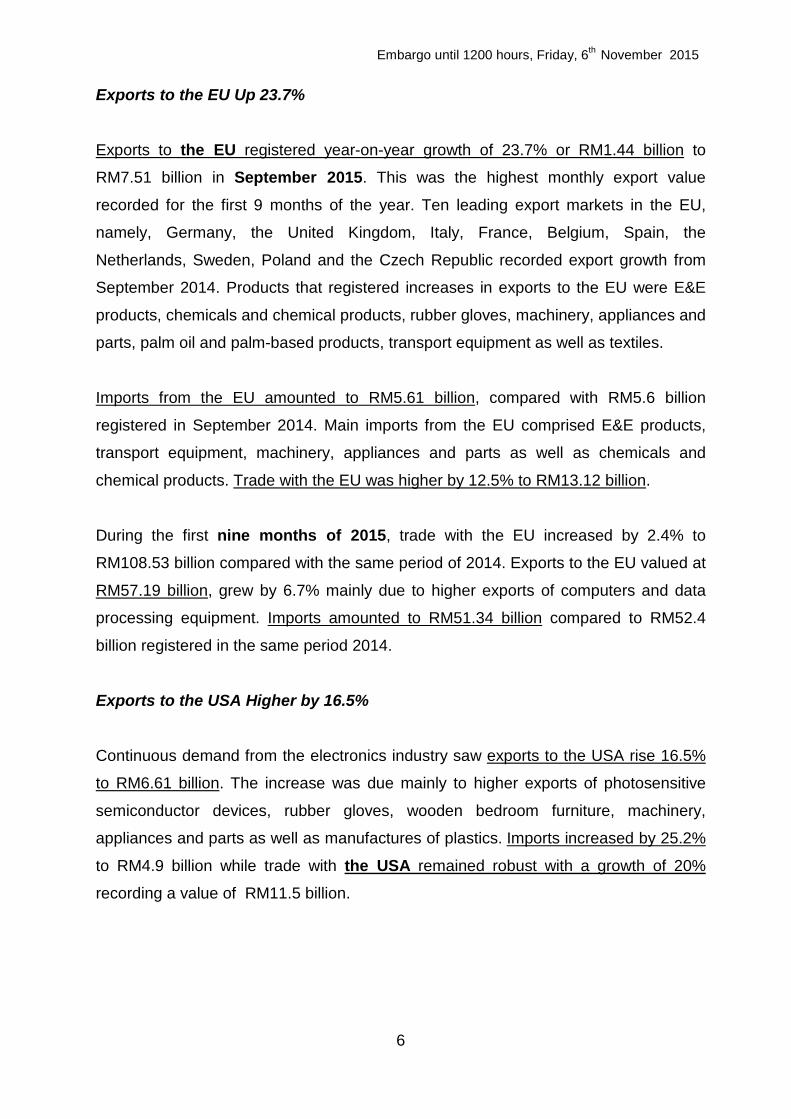
Exports to the EU Up 23.7%
Exports to the EU registered year-on-year growth of 23.7% or RM1.44 billion to
RM7.51 billion in September 2015. This was the highest monthly export value
recorded for the first 9 months of the year. Ten leading export markets in the EU,
namely, Germany, the United Kingdom, Italy, France, Belgium, Spain, the
Netherlands, Sweden, Poland and the Czech Republic recorded export growth from
September 2014. Products that registered increases in exports to the EU were E&E
products, chemicals and chemical products, rubber gloves, machinery, appliances and
parts, palm oil and palm-based products, transport equipment as well as textiles.
Imports from the EU amounted to RM5.61 billion, compared with RM5.6 billion
registered in September 2014. Main imports from the EU comprised E&E products,
transport equipment, machinery, appliances and parts as well as chemicals and
chemical products. Trade with the EU was higher by 12.5% to RM13.12 billion.
During the first nine months of 2015, trade with the EU increased by 2.4% to
RM108.53 billion compared with the same period of 2014. Exports to the EU valued at
RM57.19 billion, grew by 6.7% mainly due to higher exports of computers and data
processing equipment. Imports amounted to RM51.34 billion compared to RM52.4
billion registered in the same period 2014.
Exports to the USA Higher by 16.5%
Continuous demand from the electronics industry saw exports to the USA rise 16.5%
to RM6.61 billion. The increase was due mainly to higher exports of photosensitive
semiconductor devices, rubber gloves, wooden bedroom furniture, machinery,
appliances and parts as well as manufactures of plastics. Imports increased by 25.2%
to RM4.9 billion while trade with the USA remained robust with a growth of 20%
recording a value of RM11.5 billion.
Embargo until 1200 hours, Friday, 6th
November 2015
7
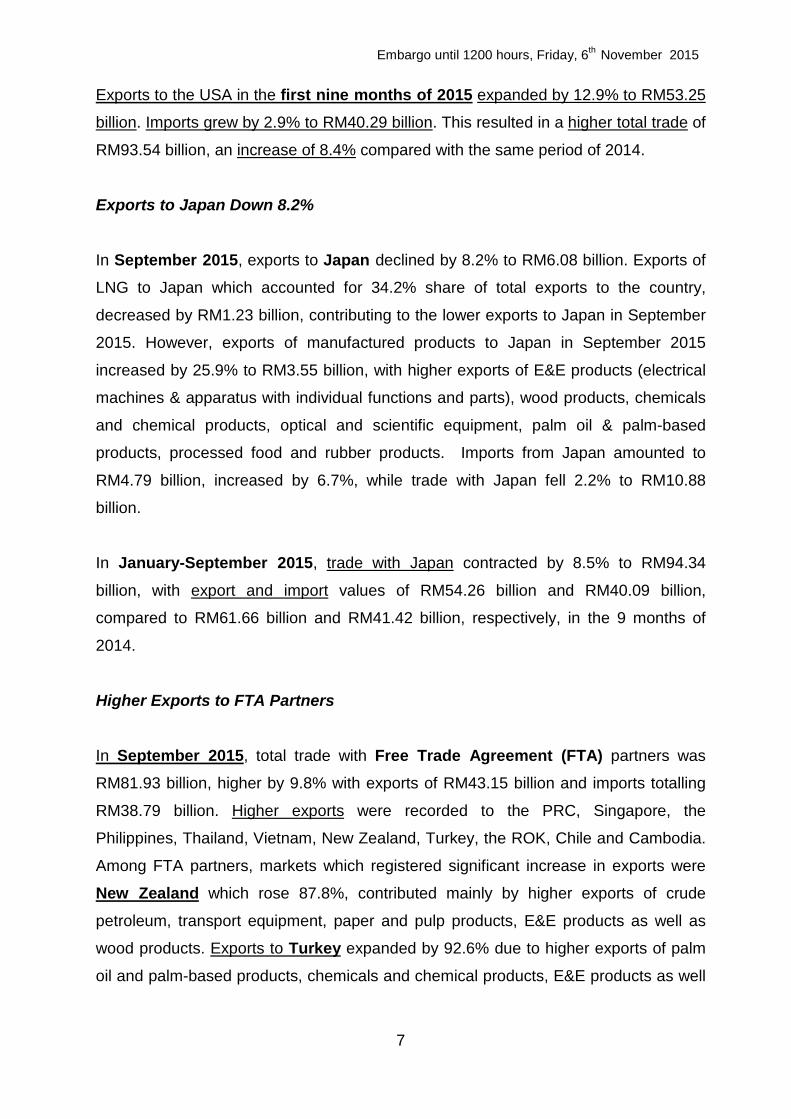
Exports to the USA in the first nine months of 2015 expanded by 12.9% to RM53.25
billion. Imports grew by 2.9% to RM40.29 billion. This resulted in a higher total trade of
RM93.54 billion, an increase of 8.4% compared with the same period of 2014.
Exports to Japan Down 8.2%
In September 2015, exports to Japan declined by 8.2% to RM6.08 billion. Exports of
LNG to Japan which accounted for 34.2% share of total exports to the country,
decreased by RM1.23 billion, contributing to the lower exports to Japan in September
2015. However, exports of manufactured products to Japan in September 2015
increased by 25.9% to RM3.55 billion, with higher exports of E&E products (electrical
machines & apparatus with individual functions and parts), wood products, chemicals
and chemical products, optical and scientific equipment, palm oil & palm-based
products, processed food and rubber products. Imports from Japan amounted to
RM4.79 billion, increased by 6.7%, while trade with Japan fell 2.2% to RM10.88
billion.
In January-September 2015, trade with Japan contracted by 8.5% to RM94.34
billion, with export and import values of RM54.26 billion and RM40.09 billion,
compared to RM61.66 billion and RM41.42 billion, respectively, in the 9 months of
2014.
Higher Exports to FTA Partners
In September 2015, total trade with Free Trade Agreement (FTA) partners was
RM81.93 billion, higher by 9.8% with exports of RM43.15 billion and imports totalling
RM38.79 billion. Higher exports were recorded to the PRC, Singapore, the
Philippines, Thailand, Vietnam, New Zealand, Turkey, the ROK, Chile and Cambodia.
Among FTA partners, markets which registered significant increase in exports were
New Zealand which rose 87.8%, contributed mainly by higher exports of crude
petroleum, transport equipment, paper and pulp products, E&E products as well as
wood products. Exports to Turkey expanded by 92.6% due to higher exports of palm
oil and palm-based products, chemicals and chemical products, E&E products as well
Embargo until 1200 hours, Friday, 6th
November 2015
8
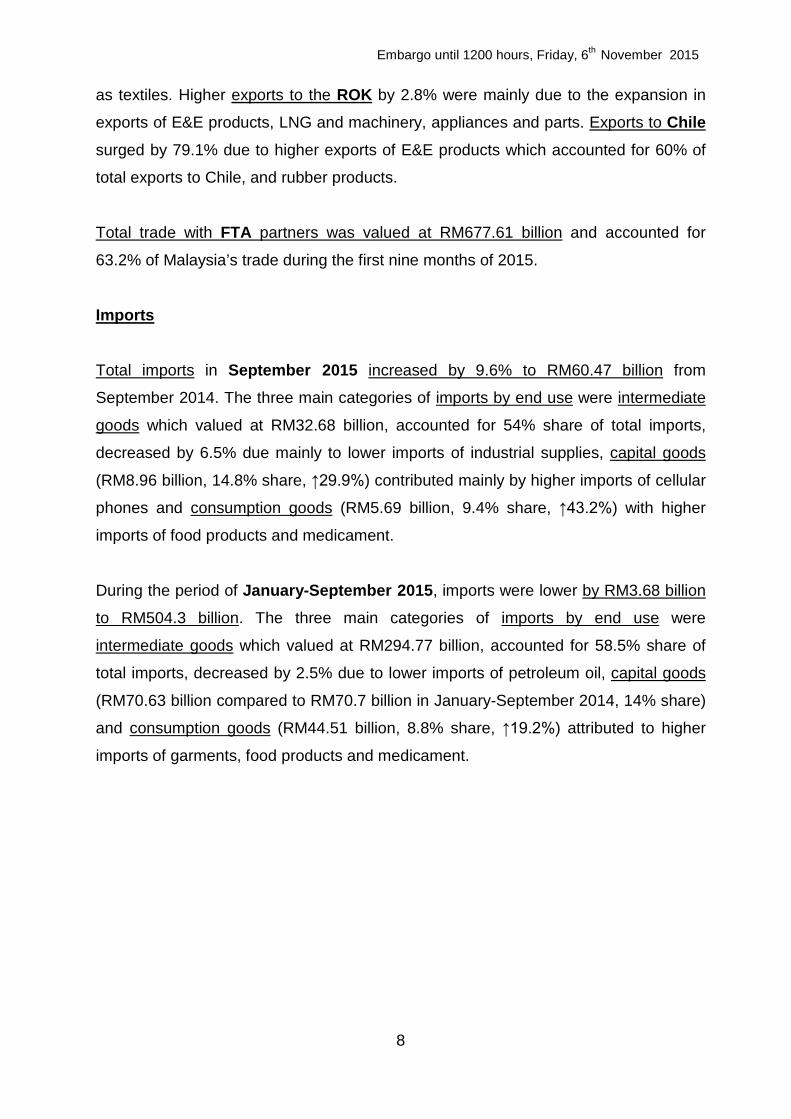
as textiles. Higher exports to the ROK by 2.8% were mainly due to the expansion in
exports of E&E products, LNG and machinery, appliances and parts. Exports to Chile
surged by 79.1% due to higher exports of E&E products which accounted for 60% of
total exports to Chile, and rubber products.
Total trade with FTA partners was valued at RM677.61 billion and accounted for
63.2% of Malaysia’s trade during the first nine months of 2015.
Imports
Total imports in September 2015 increased by 9.6% to RM60.47 billion from
September 2014. The three main categories of imports by end use were intermediate
goods which valued at RM32.68 billion, accounted for 54% share of total imports,
decreased by 6.5% due mainly to lower imports of industrial supplies, capital goods
(RM8.96 billion, 14.8% share, ↑29.9%) contributed mainly by higher imports of cellular
phones and consumption goods (RM5.69 billion, 9.4% share, ↑43.2%) with higher
imports of food products and medicament.
During the period of January-September 2015, imports were lower by RM3.68 billion
to RM504.3 billion. The three main categories of imports by end use were
intermediate goods which valued at RM294.77 billion, accounted for 58.5% share of
total imports, decreased by 2.5% due to lower imports of petroleum oil, capital goods
(RM70.63 billion compared to RM70.7 billion in January-September 2014, 14% share)
and consumption goods (RM44.51 billion, 8.8% share, ↑19.2%) attributed to higher
imports of garments, food products and medicament.
Embargo until 1200 hours, Friday, 6th
November 2015
9
Note:
It should be noted that, conceptually, the export and import figures in the external trade statistics are different
from that in the goods account of the balance of payments compilation. The compilation of international
merchandise trade statistics is usually based on customs records, which essentially reflect the physical
movement of goods across borders, and follow international guidelines on concepts and definitions, which do
not fully conform to the principles of the System of National Accounts (SNA) and the Balance of Payments
Compilation. Goods are defined in the SNA as “physical objects for which a demand exists, over which
ownership rights can be established and whose ownership can be transferred from one institutional unit to
another by engaging in transactions on markets”.
This is a preliminary release, full details would be published in the “MONTHLY EXTERNAL TRADE
STATISTICS” report by the Department of Statistics, Malaysia, to be disseminated at 1200 hours, Friday, 6th
November 2015.
+ This report can be accessed through the homepages of the Ministry of International Trade and Industry
(http://www.miti.gov.my) and Malaysia External Trade Development Corporation (http://www.matrade.gov.my).
The September 2015 data is provisional and subject to revision in later issue.
With effect from reference month September 2015, there are some minor changes to the selection of codes for
exports and imports of major and selected products/commodities.
Embargo until 1200 hours, Friday, 6th
November 2015
10
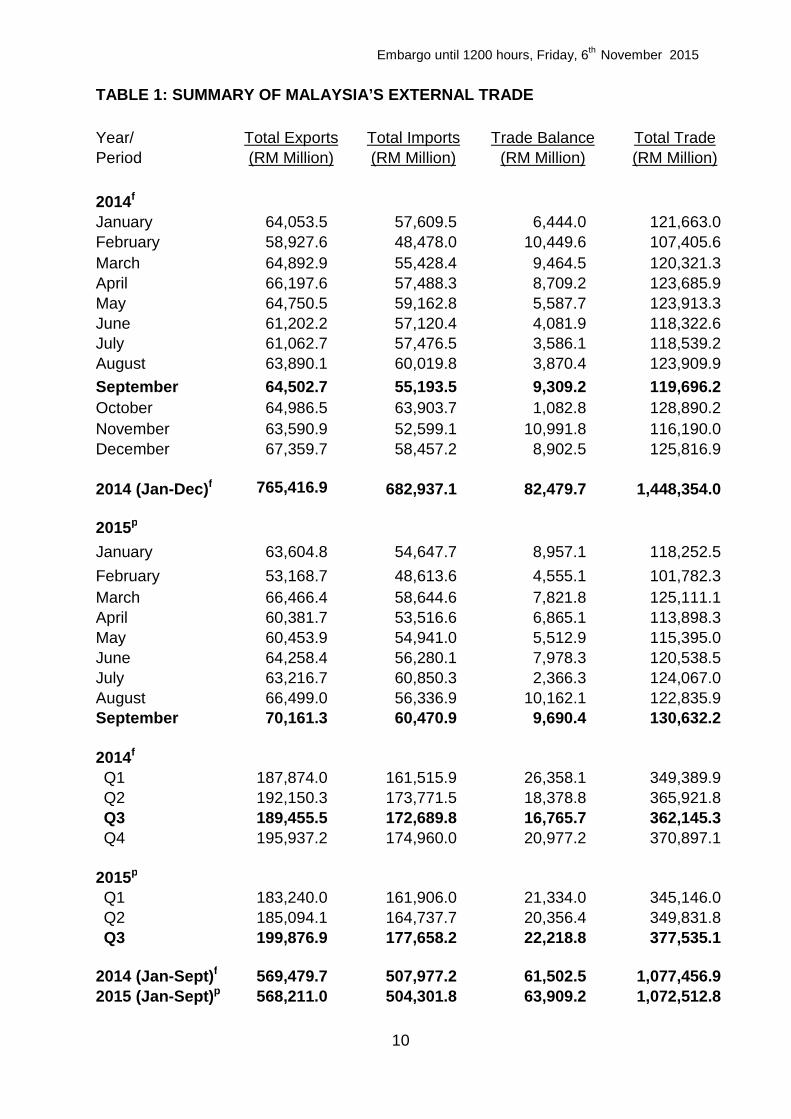
TABLE 1: SUMMARY OF MALAYSIA’S EXTERNAL TRADE
Year/ Total Exports Total Imports Trade Balance Total Trade
Period (RM Million) (RM Million) (RM Million) (RM Million)
2014f
January 64,053.5 57,609.5 6,444.0 121,663.0
February 58,927.6 48,478.0 10,449.6 107,405.6
March 64,892.9 55,428.4 9,464.5 120,321.3
April 66,197.6 57,488.3 8,709.2 123,685.9
May 64,750.5 59,162.8 5,587.7 123,913.3
June 61,202.2 57,120.4 4,081.9 118,322.6July 61,062.7 57,476.5 3,586.1 118,539.2
August 63,890.1 60,019.8 3,870.4 123,909.9
September 64,502.7 55,193.5 9,309.2 119,696.2
October 64,986.5 63,903.7 1,082.8 128,890.2
November 63,590.9 52,599.1 10,991.8 116,190.0
December 67,359.7 58,457.2 8,902.5 125,816.9
2014 (Jan-Dec)f 765,416.9 682,937.1 82,479.7 1,448,354.0
2015p
January 63,604.8 54,647.7 8,957.1 118,252.5
February 53,168.7 48,613.6 4,555.1 101,782.3
March 66,466.4 58,644.6 7,821.8 125,111.1
April 60,381.7 53,516.6 6,865.1 113,898.3
May 60,453.9 54,941.0 5,512.9 115,395.0
June 64,258.4 56,280.1 7,978.3 120,538.5
July 63,216.7 60,850.3 2,366.3 124,067.0
August 66,499.0 56,336.9 10,162.1 122,835.9September 70,161.3 60,470.9 9,690.4 130,632.2
2014f
Q1 187,874.0 161,515.9 26,358.1 349,389.9
Q2 192,150.3 173,771.5 18,378.8 365,921.8
Q3 189,455.5 172,689.8 16,765.7 362,145.3
Q4 195,937.2 174,960.0 20,977.2 370,897.1
2015p
Q1 183,240.0 161,906.0 21,334.0 345,146.0
Q2 185,094.1 164,737.7 20,356.4 349,831.8
Q3 199,876.9 177,658.2 22,218.8 377,535.1
2014 (Jan-Sept)f 569,479.7 507,977.2 61,502.5 1,077,456.9
2015 (Jan-Sept)p 568,211.0 504,301.8 63,909.2 1,072,512.8
Embargo until 1200 hours, Friday, 6th
November 2015
11
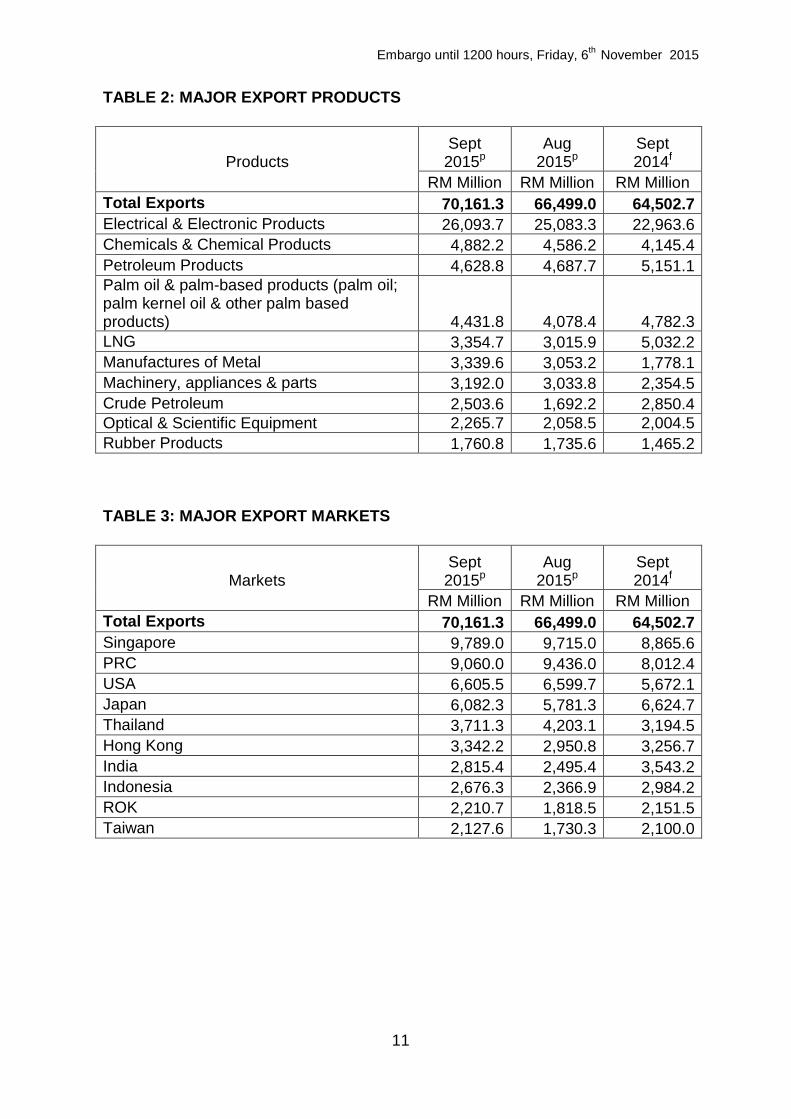
TABLE 2: MAJOR EXPORT PRODUCTS
ProductsSept2015p
Aug2015p
Sept2014f
RM Million RM Million RM Million
Total Exports 70,161.3 66,499.0 64,502.7Electrical & Electronic Products 26,093.7 25,083.3 22,963.6Chemicals & Chemical Products 4,882.2 4,586.2 4,145.4Petroleum Products 4,628.8 4,687.7 5,151.1Palm oil & palm-based products (palm oil;palm kernel oil & other palm basedproducts) 4,431.8 4,078.4 4,782.3LNG 3,354.7 3,015.9 5,032.2Manufactures of Metal 3,339.6 3,053.2 1,778.1Machinery, appliances & parts 3,192.0 3,033.8 2,354.5Crude Petroleum 2,503.6 1,692.2 2,850.4Optical & Scientific Equipment 2,265.7 2,058.5 2,004.5Rubber Products 1,760.8 1,735.6 1,465.2
TABLE 3: MAJOR EXPORT MARKETS
MarketsSept2015p
Aug2015p
Sept2014f
RM Million RM Million RM Million
Total Exports 70,161.3 66,499.0 64,502.7Singapore 9,789.0 9,715.0 8,865.6PRC 9,060.0 9,436.0 8,012.4USA 6,605.5 6,599.7 5,672.1Japan 6,082.3 5,781.3 6,624.7Thailand 3,711.3 4,203.1 3,194.5Hong Kong 3,342.2 2,950.8 3,256.7India 2,815.4 2,495.4 3,543.2Indonesia 2,676.3 2,366.9 2,984.2ROK 2,210.7 1,818.5 2,151.5Taiwan 2,127.6 1,730.3 2,100.0
Embargo until 1200 hours, Friday, 6th
November 2015
12
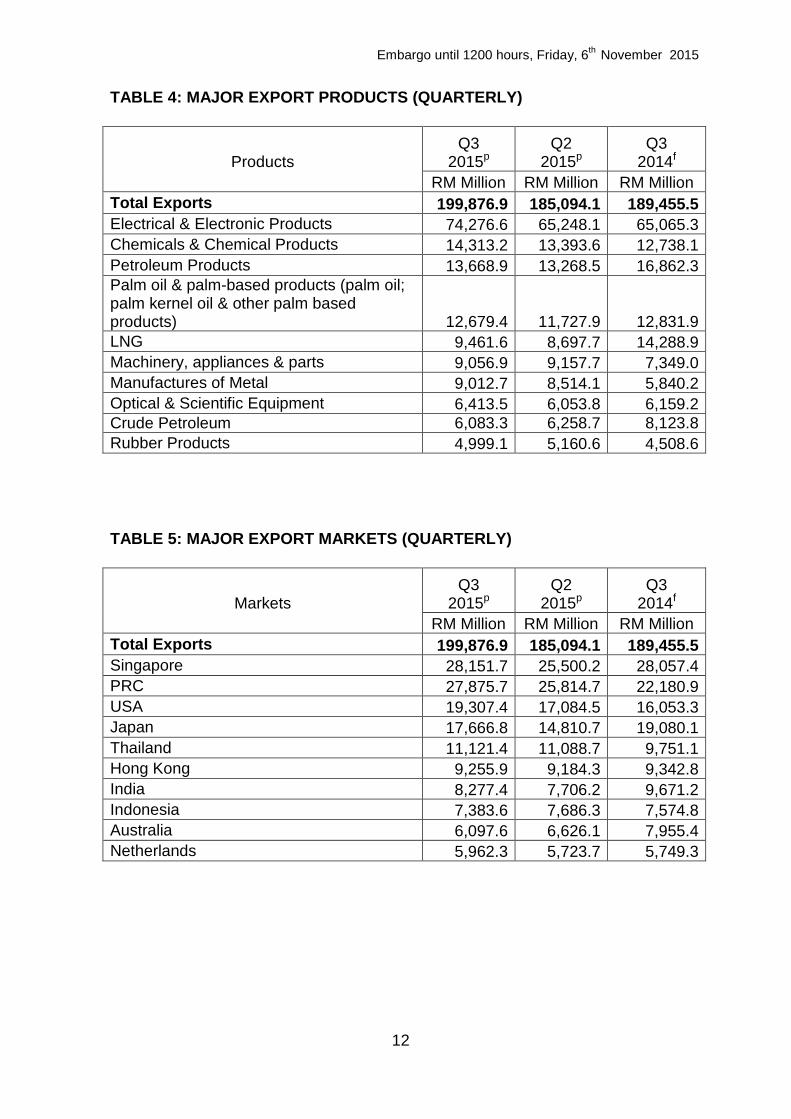
TABLE 4: MAJOR EXPORT PRODUCTS (QUARTERLY)
ProductsQ3
2015pQ2
2015pQ3
2014f
RM Million RM Million RM Million
Total Exports 199,876.9 185,094.1 189,455.5Electrical & Electronic Products 74,276.6 65,248.1 65,065.3Chemicals & Chemical Products 14,313.2 13,393.6 12,738.1Petroleum Products 13,668.9 13,268.5 16,862.3Palm oil & palm-based products (palm oil;palm kernel oil & other palm basedproducts) 12,679.4 11,727.9 12,831.9LNG 9,461.6 8,697.7 14,288.9Machinery, appliances & parts 9,056.9 9,157.7 7,349.0Manufactures of Metal 9,012.7 8,514.1 5,840.2Optical & Scientific Equipment 6,413.5 6,053.8 6,159.2Crude Petroleum 6,083.3 6,258.7 8,123.8Rubber Products 4,999.1 5,160.6 4,508.6
TABLE 5: MAJOR EXPORT MARKETS (QUARTERLY)
MarketsQ3
2015pQ2
2015pQ3
2014f
RM Million RM Million RM Million
Total Exports 199,876.9 185,094.1 189,455.5Singapore 28,151.7 25,500.2 28,057.4PRC 27,875.7 25,814.7 22,180.9USA 19,307.4 17,084.5 16,053.3Japan 17,666.8 14,810.7 19,080.1Thailand 11,121.4 11,088.7 9,751.1Hong Kong 9,255.9 9,184.3 9,342.8India 8,277.4 7,706.2 9,671.2Indonesia 7,383.6 7,686.3 7,574.8Australia 6,097.6 6,626.1 7,955.4Netherlands 5,962.3 5,723.7 5,749.3
Embargo until 1200 hours, Friday, 6th
November 2015
13
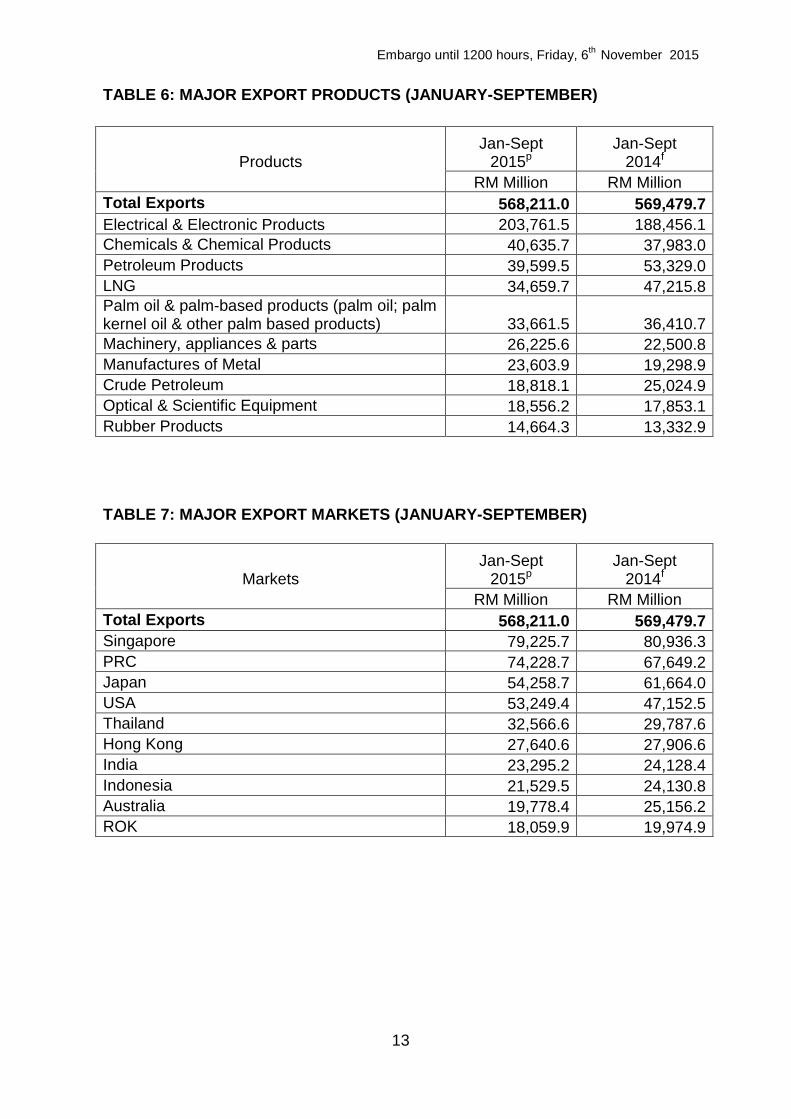
TABLE 6: MAJOR EXPORT PRODUCTS (JANUARY-SEPTEMBER)
ProductsJan-Sept
2015pJan-Sept
2014f
RM Million RM Million
Total Exports 568,211.0 569,479.7
Electrical & Electronic Products 203,761.5 188,456.1Chemicals & Chemical Products 40,635.7 37,983.0Petroleum Products 39,599.5 53,329.0LNG 34,659.7 47,215.8Palm oil & palm-based products (palm oil; palmkernel oil & other palm based products) 33,661.5 36,410.7Machinery, appliances & parts 26,225.6 22,500.8Manufactures of Metal 23,603.9 19,298.9Crude Petroleum 18,818.1 25,024.9Optical & Scientific Equipment 18,556.2 17,853.1Rubber Products 14,664.3 13,332.9
TABLE 7: MAJOR EXPORT MARKETS (JANUARY-SEPTEMBER)
MarketsJan-Sept
2015pJan-Sept
2014f
RM Million RM Million
Total Exports 568,211.0 569,479.7Singapore 79,225.7 80,936.3PRC 74,228.7 67,649.2Japan 54,258.7 61,664.0USA 53,249.4 47,152.5Thailand 32,566.6 29,787.6Hong Kong 27,640.6 27,906.6India 23,295.2 24,128.4
Indonesia 21,529.5 24,130.8Australia 19,778.4 25,156.2ROK 18,059.9 19,974.9
Embargo until 1200 hours, Friday, 6th
November 2015
14
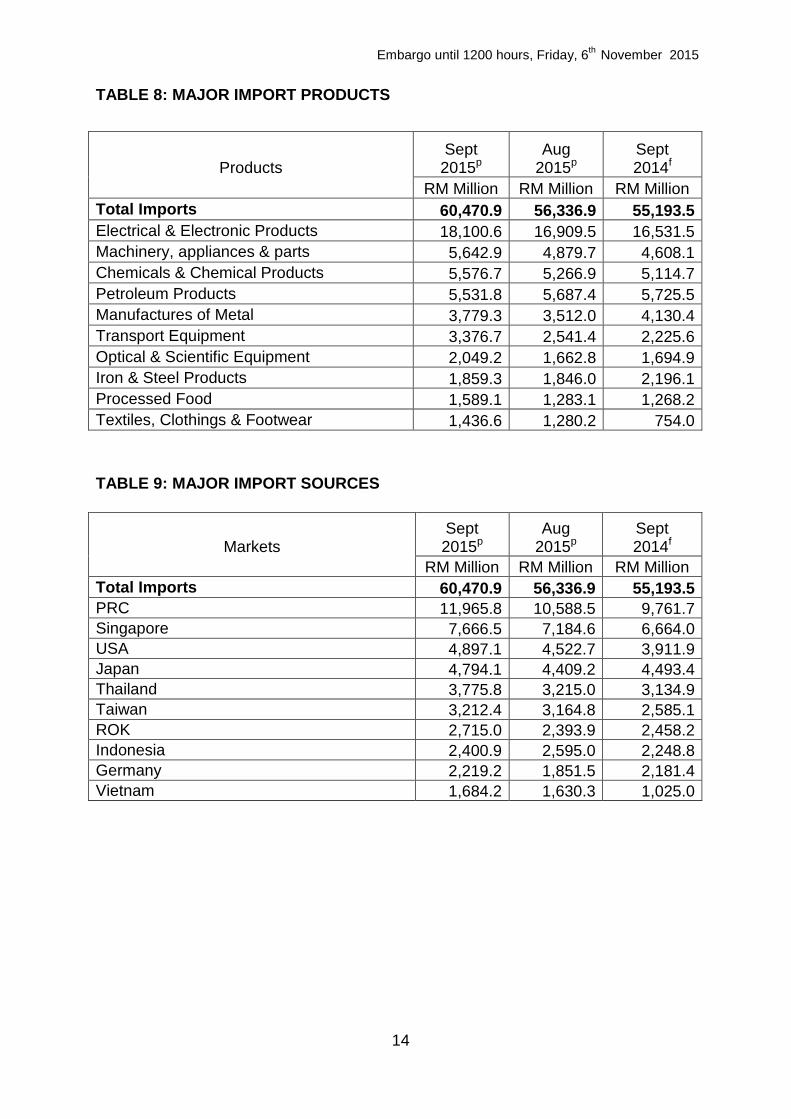
TABLE 8: MAJOR IMPORT PRODUCTS
ProductsSept2015p
Aug2015p
Sept2014f
RM Million RM Million RM Million
Total Imports 60,470.9 56,336.9 55,193.5
Electrical & Electronic Products 18,100.6 16,909.5 16,531.5Machinery, appliances & parts 5,642.9 4,879.7 4,608.1Chemicals & Chemical Products 5,576.7 5,266.9 5,114.7
Petroleum Products 5,531.8 5,687.4 5,725.5Manufactures of Metal 3,779.3 3,512.0 4,130.4Transport Equipment 3,376.7 2,541.4 2,225.6
Optical & Scientific Equipment 2,049.2 1,662.8 1,694.9Iron & Steel Products 1,859.3 1,846.0 2,196.1Processed Food 1,589.1 1,283.1 1,268.2
Textiles, Clothings & Footwear 1,436.6 1,280.2 754.0
TABLE 9: MAJOR IMPORT SOURCES
MarketsSept2015p
Aug2015p
Sept2014f
RM Million RM Million RM Million
Total Imports 60,470.9 56,336.9 55,193.5PRC 11,965.8 10,588.5 9,761.7Singapore 7,666.5 7,184.6 6,664.0USA 4,897.1 4,522.7 3,911.9Japan 4,794.1 4,409.2 4,493.4Thailand 3,775.8 3,215.0 3,134.9Taiwan 3,212.4 3,164.8 2,585.1ROK 2,715.0 2,393.9 2,458.2Indonesia 2,400.9 2,595.0 2,248.8Germany 2,219.2 1,851.5 2,181.4Vietnam 1,684.2 1,630.3 1,025.0
Embargo until 1200 hours, Friday, 6th
November 2015
15
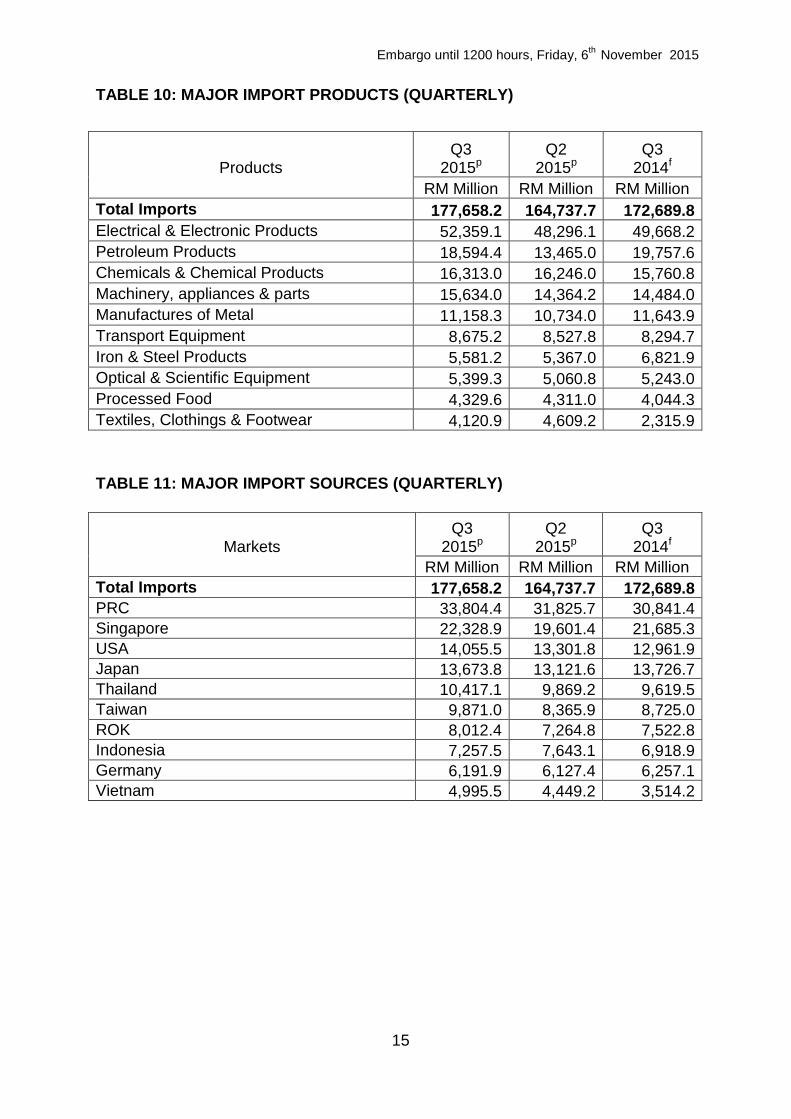
TABLE 10: MAJOR IMPORT PRODUCTS (QUARTERLY)
ProductsQ3
2015pQ2
2015pQ3
2014f
RM Million RM Million RM Million
Total Imports 177,658.2 164,737.7 172,689.8
Electrical & Electronic Products 52,359.1 48,296.1 49,668.2Petroleum Products 18,594.4 13,465.0 19,757.6Chemicals & Chemical Products 16,313.0 16,246.0 15,760.8
Machinery, appliances & parts 15,634.0 14,364.2 14,484.0Manufactures of Metal 11,158.3 10,734.0 11,643.9Transport Equipment 8,675.2 8,527.8 8,294.7
Iron & Steel Products 5,581.2 5,367.0 6,821.9Optical & Scientific Equipment 5,399.3 5,060.8 5,243.0Processed Food 4,329.6 4,311.0 4,044.3
Textiles, Clothings & Footwear 4,120.9 4,609.2 2,315.9
TABLE 11: MAJOR IMPORT SOURCES (QUARTERLY)
MarketsQ3
2015pQ2
2015pQ3
2014f
RM Million RM Million RM Million
Total Imports 177,658.2 164,737.7 172,689.8PRC 33,804.4 31,825.7 30,841.4Singapore 22,328.9 19,601.4 21,685.3USA 14,055.5 13,301.8 12,961.9Japan 13,673.8 13,121.6 13,726.7Thailand 10,417.1 9,869.2 9,619.5Taiwan 9,871.0 8,365.9 8,725.0ROK 8,012.4 7,264.8 7,522.8Indonesia 7,257.5 7,643.1 6,918.9Germany 6,191.9 6,127.4 6,257.1Vietnam 4,995.5 4,449.2 3,514.2
Embargo until 1200 hours, Friday, 6th
November 2015
16
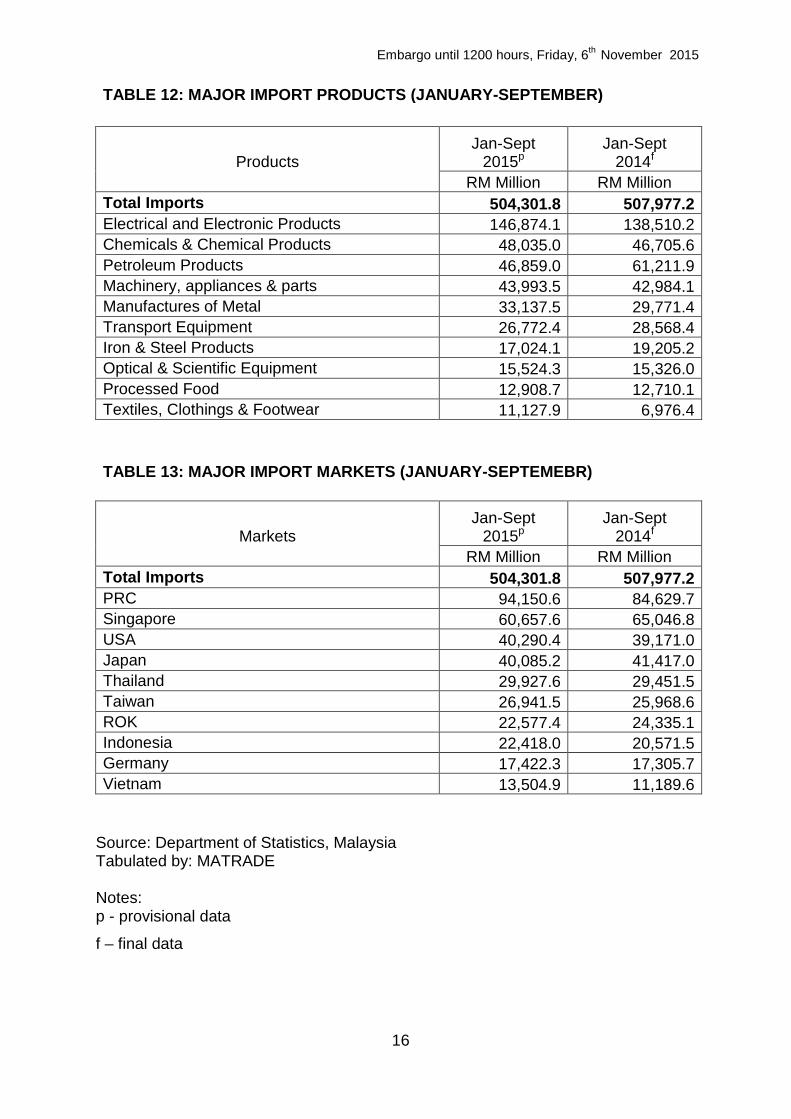
TABLE 12: MAJOR IMPORT PRODUCTS (JANUARY-SEPTEMBER)
ProductsJan-Sept
2015pJan-Sept
2014f
RM Million RM Million
Total Imports 504,301.8 507,977.2Electrical and Electronic Products 146,874.1 138,510.2Chemicals & Chemical Products 48,035.0 46,705.6Petroleum Products 46,859.0 61,211.9Machinery, appliances & parts 43,993.5 42,984.1Manufactures of Metal 33,137.5 29,771.4Transport Equipment 26,772.4 28,568.4Iron & Steel Products 17,024.1 19,205.2Optical & Scientific Equipment 15,524.3 15,326.0Processed Food 12,908.7 12,710.1Textiles, Clothings & Footwear 11,127.9 6,976.4
TABLE 13: MAJOR IMPORT MARKETS (JANUARY-SEPTEMEBR)
MarketsJan-Sept
2015pJan-Sept
2014f
RM Million RM Million
Total Imports 504,301.8 507,977.2PRC 94,150.6 84,629.7Singapore 60,657.6 65,046.8USA 40,290.4 39,171.0Japan 40,085.2 41,417.0Thailand 29,927.6 29,451.5Taiwan 26,941.5 25,968.6ROK 22,577.4 24,335.1Indonesia 22,418.0 20,571.5Germany 17,422.3 17,305.7Vietnam 13,504.9 11,189.6
Source: Department of Statistics, MalaysiaTabulated by: MATRADE
Notes:p - provisional data
f – final data
Embargo until 1200 hours, Friday, 6th
November 2015
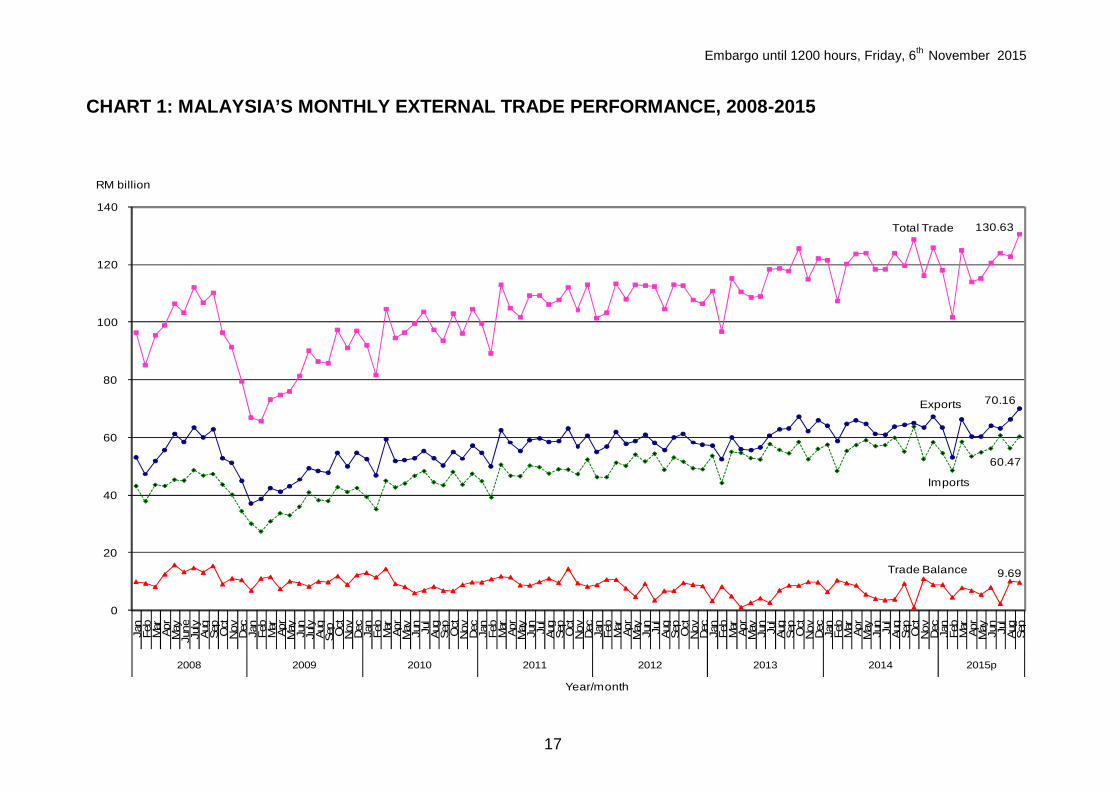
CHART 1: MALAYSIA’S MONTHLY EXTERNAL TRADE PERFORMANCE, 2008-2015
Imports
Exports 70.16
60.47
Trade Balance 9.69
Total Trade 130.63
0
20
40
60
80
100
120
140
Jan
Feb
Mar
Apr
May
June
July
Aug
Sep Oct
Nov
Dec
Jan
Feb
Mar
Apr
May
Jun
July
Aug
Sep Oct
Nov
Dec
Jan
Feb
Mar
Apr
May
Jun
Jul
Aug
Sep Oct
Nov
Dec
Jan
Feb
Mar
Apr
May
Jun
Jul
Aug
Sep Oct
Nov
Dec
Jan
Feb
Mar
Apr
May
Jun
Jul
Aug
Sep Oct
Nov
Dec
Jan
Feb
Mar
Apr
May
Jun
Jul
Aug
Sep Oct
Nov
Dec
Jan
Feb
Mar
Apr
May
Jun
Jul
Aug
Sep Oct
Nov
Dec
Jan
Feb
Mar
Apr
May
Jun
Jul
Aug
Sep
2008 2009 2010 2011 2012 2013 2014 2015p
RM billion
Year/month
17