Embed Size (px)
Citation preview
Press Release
1
Second quarter and first half 2018 results
Paris, July 26, 2018 - Total’s Board of Directors met on July 25, 2018, to review the Group’s second quarter 2018 accounts. Commenting on the results, Chairman and CEO Patrick Pouyanné said: « Oil prices continued to increase, averaging 74 $/b in the second quarter, supported notably by inventory reductions and geopolitical tensions. Total benefited fully from this by remaining focused on operational efficiency: adjusted net income was $3.6 billion, a 44% increase from a year ago, and the return on equity for the past 12 months rose to 10.9%. In line with objectives for the year, the Group generated $6.8 billion of cash flow (DACF) in the second quarter 2018, an increase of 20% compared to the first quarter, while oil prices increased by only 11%. Discipline on spending is resolutely maintained and the organic pre-dividend breakeven continues to decrease, to less than 25 $/b in the quarter. Production strongly increased by 8.7% from a year ago to 2.7 Mboe/d, due to the contribution from Maersk Oil and the ramp up of new projects, including Yamal LNG, Moho Nord and Fort Hills. Adjusted net operating income from Exploration & Production doubled from a year ago to $2.7 billion in the second quarter 2018, and the segment generated $5.1 billion of cash flow in the same period. Total also launched the development of the Zinia 2 project in Angola, after reducing the cost by more than 50%. The Group is continuing to actively expand along the gas and electricity value chain. Total became the second-largest player in the fast growing global LNG industry by finalizing the acquisition of Engie LNG. The Group also announced its entry with a 10% stake in the giant Arctic 2 LNG project in Russia. In addition, it finalized the acquisition of 73% of Direct Energie to accelerate the downstream integration in the gas-electricity chain, and it launched an offer for the remaining shares. In an environment with European refining margins of 35 $/t, the Downstream generated $1.7 billion of cash flow in the second quarter, in line with the objective for the year. Notably, Marketing & Services continues to deliver steady and profitable growth. The Group is preparing for its future in petrochemicals by launching studies for a new giant complex integrated into the SATORP refinery with Saudi Aramco and a new project in Algeria with Sonatrach. In line with the announced shareholder return policy, the Group has bought back all the shares issued during the year for the scrip dividend. In addition, it bought back shares for $600 million to share with shareholders the benefit realized from higher prices. »
2Q18 Changevs 2Q17 1H18
Changevs 1H17
Adjusted net income (Group share)1
- in billions of dollars (B$) 3.6 44% 6.4 +28%- in dollars per share 1.31 36% 2.41 +22%
DACF9 (B$) 6.8 22% 12.5 +19%
Cash flow from operations (B$) 6.2 35% 8.3 -11%
Net income (Group share) of 3.7 B$ in 2Q18, an 83% increase compared to 2Q17Net-debt-to-capital ratio of 16.5% at June 30, 2018 Hydrocarbon production of 2,717 kboe/d in 2Q18, an increase of 8.7% compared to 2Q17Ex-dividend date for second interim 2018 dividend of 0.64 €/share on December 18, 2018
2
Key figures1
45678910
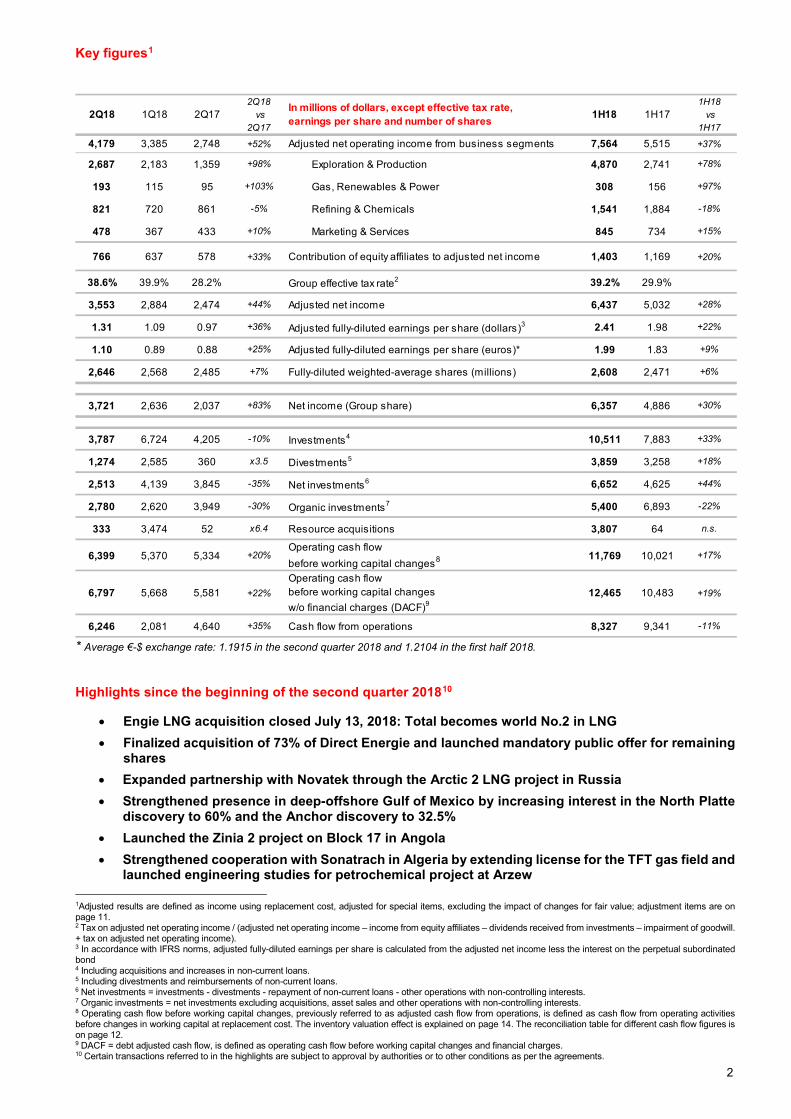
* Average €-$ exchange rate: 1.1915 in the second quarter 2018 and 1.2104 in the first half 2018. Highlights since the beginning of the second quarter 201810
• Engie LNG acquisition closed July 13, 2018: Total becomes world No.2 in LNG • Finalized acquisition of 73% of Direct Energie and launched mandatory public offer for remaining
shares • Expanded partnership with Novatek through the Arctic 2 LNG project in Russia • Strengthened presence in deep-offshore Gulf of Mexico by increasing interest in the North Platte
discovery to 60% and the Anchor discovery to 32.5% • Launched the Zinia 2 project on Block 17 in Angola • Strengthened cooperation with Sonatrach in Algeria by extending license for the TFT gas field and
launched engineering studies for petrochemical project at Arzew 1Adjusted results are defined as income using replacement cost, adjusted for special items, excluding the impact of changes for fair value; adjustment items are on page 11. 2 Tax on adjusted net operating income / (adjusted net operating income – income from equity affiliates – dividends received from investments – impairment of goodwill. + tax on adjusted net operating income). 3 In accordance with IFRS norms, adjusted fully-diluted earnings per share is calculated from the adjusted net income less the interest on the perpetual subordinated bond 4 Including acquisitions and increases in non-current loans. 5 Including divestments and reimbursements of non-current loans. 6 Net investments = investments - divestments - repayment of non-current loans - other operations with non-controlling interests. 7 Organic investments = net investments excluding acquisitions, asset sales and other operations with non-controlling interests. 8 Operating cash flow before working capital changes, previously referred to as adjusted cash flow from operations, is defined as cash flow from operating activities before changes in working capital at replacement cost. The inventory valuation effect is explained on page 14. The reconciliation table for different cash flow figures is on page 12. 9 DACF = debt adjusted cash flow, is defined as operating cash flow before working capital changes and financial charges. 10 Certain transactions referred to in the highlights are subject to approval by authorities or to other conditions as per the agreements.
2Q18 1Q18 2Q172Q18
vs 2Q17
In millions of dollars, except effective tax rate,earnings per share and number of shares 1H18 1H17
1H18 vs
1H17
4,179 3,385 2,748 +52% Adjusted net operating income from business segments 7,564 5,515 +37%
2,687 2,183 1,359 +98% Exploration & Production 4,870 2,741 +78%
193 115 95 +103% Gas, Renewables & Power 308 156 +97%
821 720 861 -5% Refining & Chemicals 1,541 1,884 -18%
478 367 433 +10% Marketing & Services 845 734 +15%
766 637 578 +33% Contribution of equity affiliates to adjusted net income 1,403 1,169 +20%
38.6% 39.9% 28.2% Group effective tax rate2 39.2% 29.9%
3,553 2,884 2,474 +44% Adjusted net income 6,437 5,032 +28%
1.31 1.09 0.97 +36% Adjusted fully-diluted earnings per share (dollars)3 2.41 1.98 +22%
1.10 0.89 0.88 +25% Adjusted fully-diluted earnings per share (euros)* 1.99 1.83 +9%
2,646 2,568 2,485 +7% Fully-diluted weighted-average shares (millions) 2,608 2,471 +6%
3,721 2,636 2,037 +83% Net income (Group share) 6,357 4,886 +30%
3,787 6,724 4,205 -10% Investments4 10,511 7,883 +33%
1,274 2,585 360 x3.5 Divestments5 3,859 3,258 +18%
2,513 4,139 3,845 -35% Net investments6 6,652 4,625 +44%
2,780 2,620 3,949 -30% Organic investments7 5,400 6,893 -22%
333 3,474 52 x6.4 Resource acquisitions 3,807 64 n.s.
6,399 5,370 5,334 +20%Operating cash flow before working capital changes8 11,769 10,021 +17%
6,797 5,668 5,581 +22%Operating cash flow before working capital changes w/o financial charges (DACF)9
12,465 10,483 +19%
6,246 2,081 4,640 +35% Cash flow from operations 8,327 9,341 -11%
3
• Signed MOU with Saudi Aramco to build petrochemical complex at Jubail in Saudi Arabia • Acquired 25% of Clean Energy to accelerate use of natural gas for heavy-duty trucks in the United
States • Expanding LNG as marine fuel in Singapore in the framework of cooperation with Pavillion
• Signed an agreement to sell interest in Dunkirk LNG terminal Analysis of business segments Exploration & Production
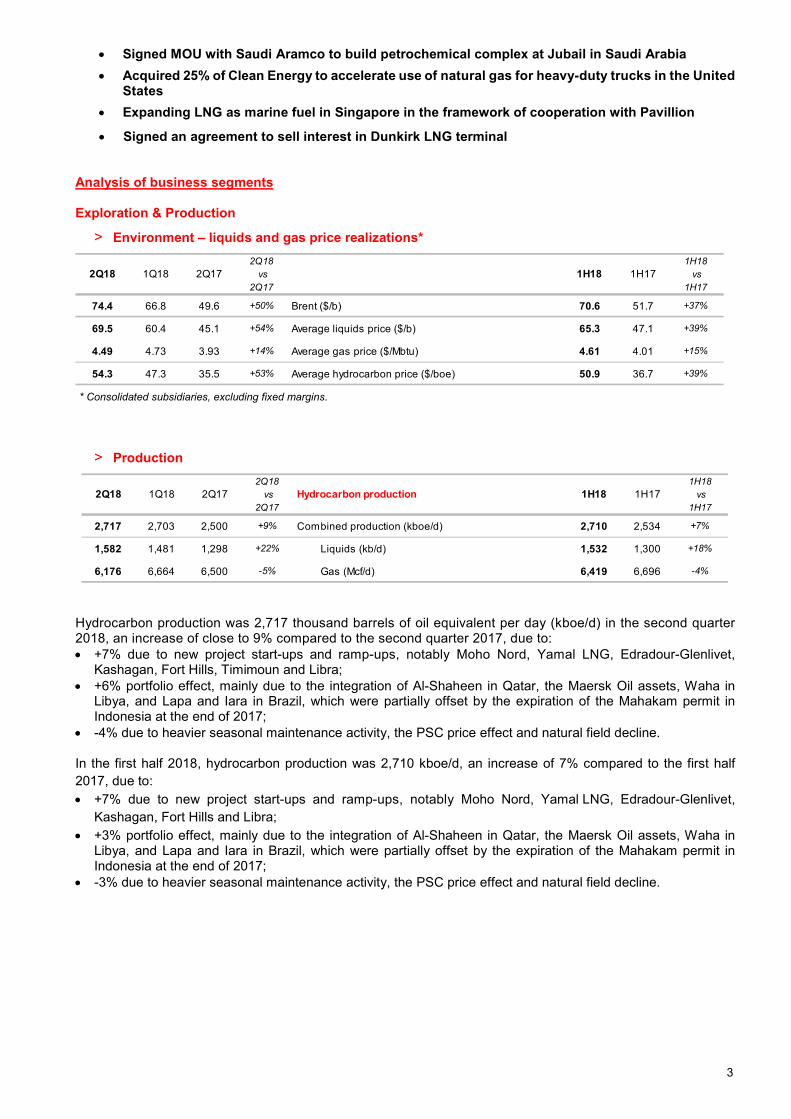
> Environment – liquids and gas price realizations*
* Consolidated subsidiaries, excluding fixed margins.
> Production
Hydrocarbon production was 2,717 thousand barrels of oil equivalent per day (kboe/d) in the second quarter 2018, an increase of close to 9% compared to the second quarter 2017, due to: • +7% due to new project start-ups and ramp-ups, notably Moho Nord, Yamal LNG, Edradour-Glenlivet,
Kashagan, Fort Hills, Timimoun and Libra; • +6% portfolio effect, mainly due to the integration of Al-Shaheen in Qatar, the Maersk Oil assets, Waha in
Libya, and Lapa and Iara in Brazil, which were partially offset by the expiration of the Mahakam permit in Indonesia at the end of 2017;
• -4% due to heavier seasonal maintenance activity, the PSC price effect and natural field decline. In the first half 2018, hydrocarbon production was 2,710 kboe/d, an increase of 7% compared to the first half 2017, due to: • +7% due to new project start-ups and ramp-ups, notably Moho Nord, Yamal LNG, Edradour-Glenlivet,
Kashagan, Fort Hills and Libra; • +3% portfolio effect, mainly due to the integration of Al-Shaheen in Qatar, the Maersk Oil assets, Waha in
Libya, and Lapa and Iara in Brazil, which were partially offset by the expiration of the Mahakam permit in Indonesia at the end of 2017;
• -3% due to heavier seasonal maintenance activity, the PSC price effect and natural field decline.
2Q18 1Q18 2Q172Q18
vs 2Q17
1H18 1H171H18 vs
1H17
74.4 66.8 49.6 +50% Brent ($/b) 70.6 51.7 +37%
69.5 60.4 45.1 +54% Average liquids price ($/b) 65.3 47.1 +39%
4.49 4.73 3.93 +14% Average gas price ($/Mbtu) 4.61 4.01 +15%
54.3 47.3 35.5 +53% Average hydrocarbon price ($/boe) 50.9 36.7 +39%
2Q18 1Q18 2Q172Q18
vs 2Q17
Hydrocarbon production 1H18 1H171H18 vs
1H17
2,717 2,703 2,500 +9% Combined production (kboe/d) 2,710 2,534 +7%
1,582 1,481 1,298 +22% Liquids (kb/d) 1,532 1,300 +18%
6,176 6,664 6,500 -5% Gas (Mcf/d) 6,419 6,696 -4%
4
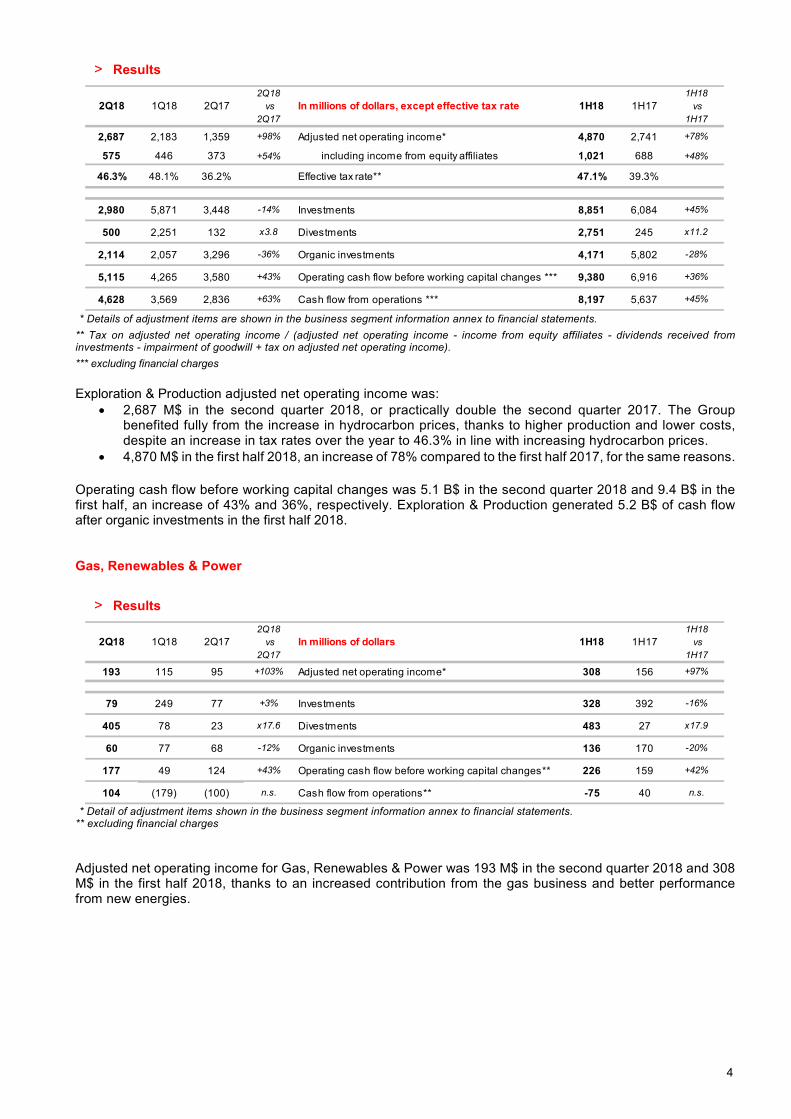
> Results
* Details of adjustment items are shown in the business segment information annex to financial statements. ** Tax on adjusted net operating income / (adjusted net operating income - income from equity affiliates - dividends received from investments - impairment of goodwill + tax on adjusted net operating income). *** excluding financial charges Exploration & Production adjusted net operating income was:
• 2,687 M$ in the second quarter 2018, or practically double the second quarter 2017. The Group benefited fully from the increase in hydrocarbon prices, thanks to higher production and lower costs, despite an increase in tax rates over the year to 46.3% in line with increasing hydrocarbon prices.
• 4,870 M$ in the first half 2018, an increase of 78% compared to the first half 2017, for the same reasons. Operating cash flow before working capital changes was 5.1 B$ in the second quarter 2018 and 9.4 B$ in the first half, an increase of 43% and 36%, respectively. Exploration & Production generated 5.2 B$ of cash flow after organic investments in the first half 2018. Gas, Renewables & Power
> Results
* Detail of adjustment items shown in the business segment information annex to financial statements. ** excluding financial charges Adjusted net operating income for Gas, Renewables & Power was 193 M$ in the second quarter 2018 and 308 M$ in the first half 2018, thanks to an increased contribution from the gas business and better performance from new energies.
2Q18 1Q18 2Q172Q18
vs 2Q17
In millions of dollars, except effective tax rate 1H18 1H171H18 vs
1H17
2,687 2,183 1,359 +98% Adjusted net operating income* 4,870 2,741 +78%
575 446 373 +54% including income from equity affiliates 1,021 688 +48%
46.3% 48.1% 36.2% Effective tax rate** 47.1% 39.3%
2,980 5,871 3,448 -14% Investments 8,851 6,084 +45%
500 2,251 132 x3.8 Divestments 2,751 245 x11.2
2,114 2,057 3,296 -36% Organic investments 4,171 5,802 -28%
5,115 4,265 3,580 +43% Operating cash flow before working capital changes *** 9,380 6,916 +36%
4,628 3,569 2,836 +63% Cash flow from operations *** 8,197 5,637 +45%
2Q18 1Q18 2Q172Q18
vs 2Q17
In millions of dollars 1H18 1H171H18 vs
1H17
193 115 95 +103% Adjusted net operating income* 308 156 +97%
79 249 77 +3% Investments 328 392 -16%
405 78 23 x17.6 Divestments 483 27 x17.9
60 77 68 -12% Organic investments 136 170 -20%
177 49 124 +43% Operating cash flow before working capital changes** 226 159 +42%
104 (179) (100) n.s. Cash flow from operations** -75 40 n.s.
5
Refining & Chemicals
> Refinery throughput and utilization rates*
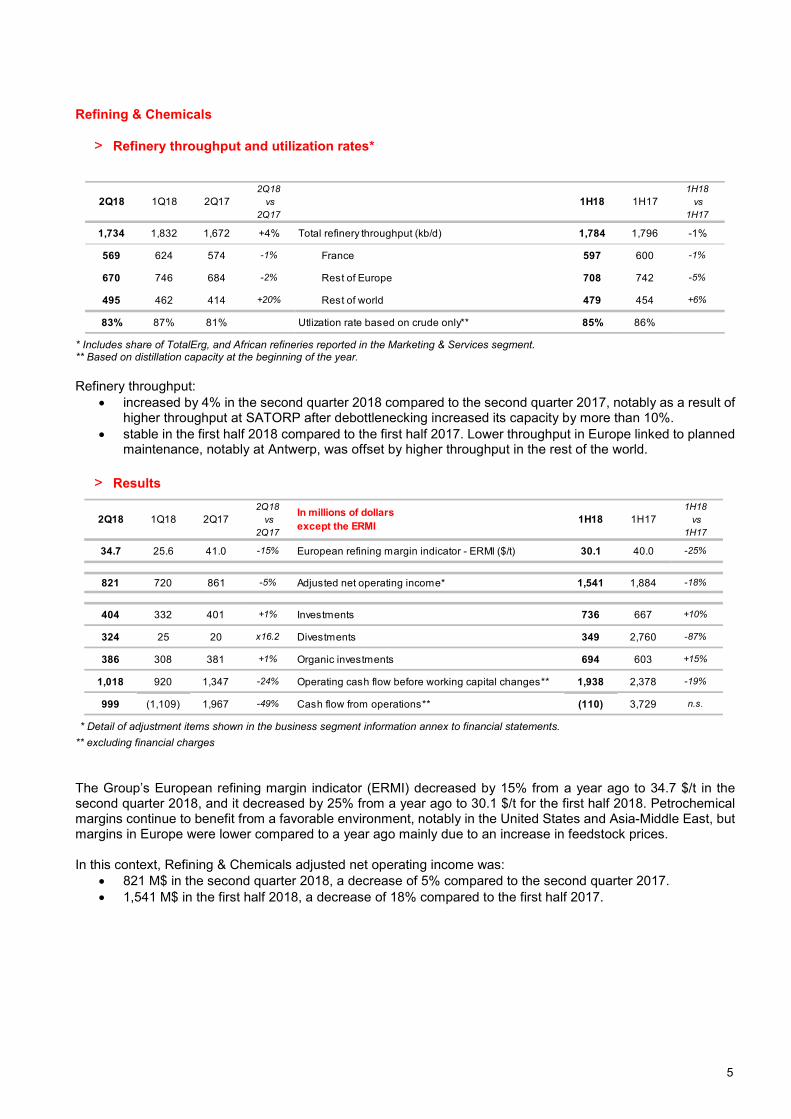
* Includes share of TotalErg, and African refineries reported in the Marketing & Services segment. ** Based on distillation capacity at the beginning of the year. Refinery throughput:
• increased by 4% in the second quarter 2018 compared to the second quarter 2017, notably as a result of higher throughput at SATORP after debottlenecking increased its capacity by more than 10%.
• stable in the first half 2018 compared to the first half 2017. Lower throughput in Europe linked to planned maintenance, notably at Antwerp, was offset by higher throughput in the rest of the world.
> Results
* Detail of adjustment items shown in the business segment information annex to financial statements. ** excluding financial charges
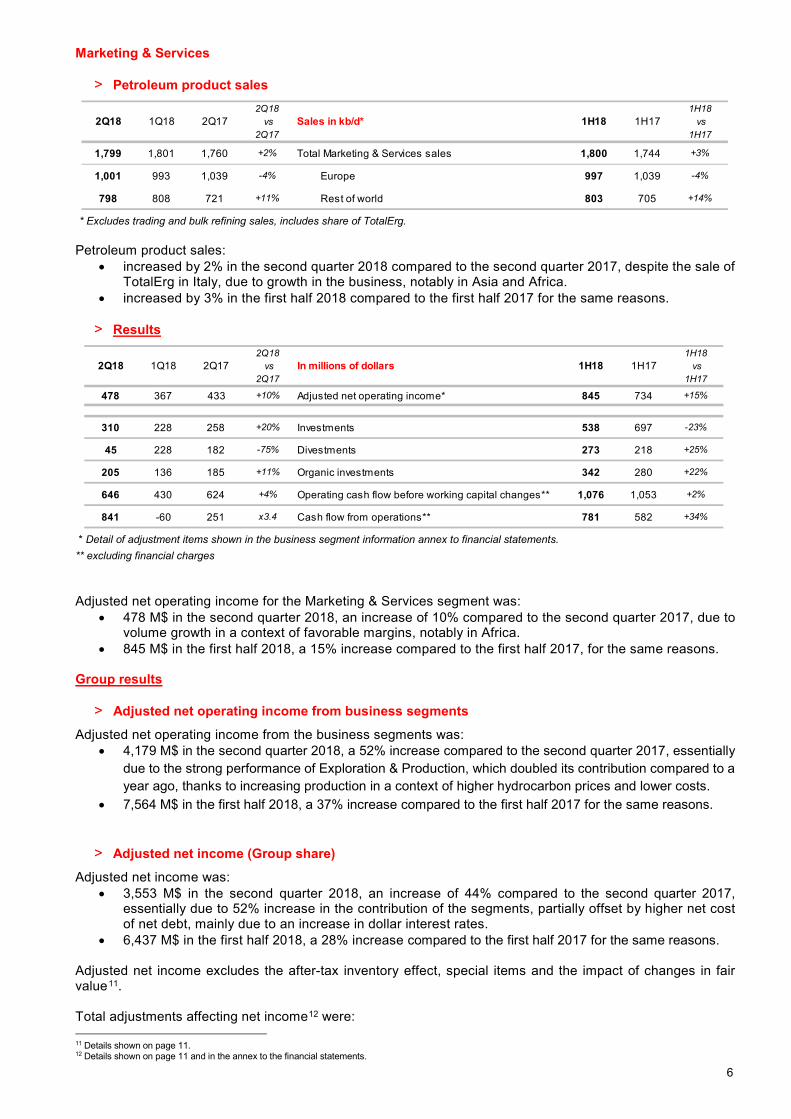
The Group’s European refining margin indicator (ERMI) decreased by 15% from a year ago to 34.7 $/t in the second quarter 2018, and it decreased by 25% from a year ago to 30.1 $/t for the first half 2018. Petrochemical margins continue to benefit from a favorable environment, notably in the United States and Asia-Middle East, but margins in Europe were lower compared to a year ago mainly due to an increase in feedstock prices. In this context, Refining & Chemicals adjusted net operating income was:
• 821 M$ in the second quarter 2018, a decrease of 5% compared to the second quarter 2017. • 1,541 M$ in the first half 2018, a decrease of 18% compared to the first half 2017.
2Q18 1Q18 2Q172Q18
vs 2Q17
1H18 1H171H18 vs
1H17
1,734 1,832 1,672 +4% Total refinery throughput (kb/d) 1,784 1,796 -1%
569 624 574 -1% France 597 600 -1%
670 746 684 -2% Rest of Europe 708 742 -5%
495 462 414 +20% Rest of world 479 454 +6%
83% 87% 81% Utlization rate based on crude only** 85% 86%
2Q18 1Q18 2Q172Q18
vs 2Q17
In millions of dollarsexcept the ERMI 1H18 1H17
1H18 vs
1H17
34.7 25.6 41.0 -15% European refining margin indicator - ERMI ($/t) 30.1 40.0 -25%
821 720 861 -5% Adjusted net operating income* 1,541 1,884 -18%
404 332 401 +1% Investments 736 667 +10%
324 25 20 x16.2 Divestments 349 2,760 -87%
386 308 381 +1% Organic investments 694 603 +15%
1,018 920 1,347 -24% Operating cash flow before working capital changes** 1,938 2,378 -19%
999 (1,109) 1,967 -49% Cash flow from operations** (110) 3,729 n.s.
6
Marketing & Services
> Petroleum product sales
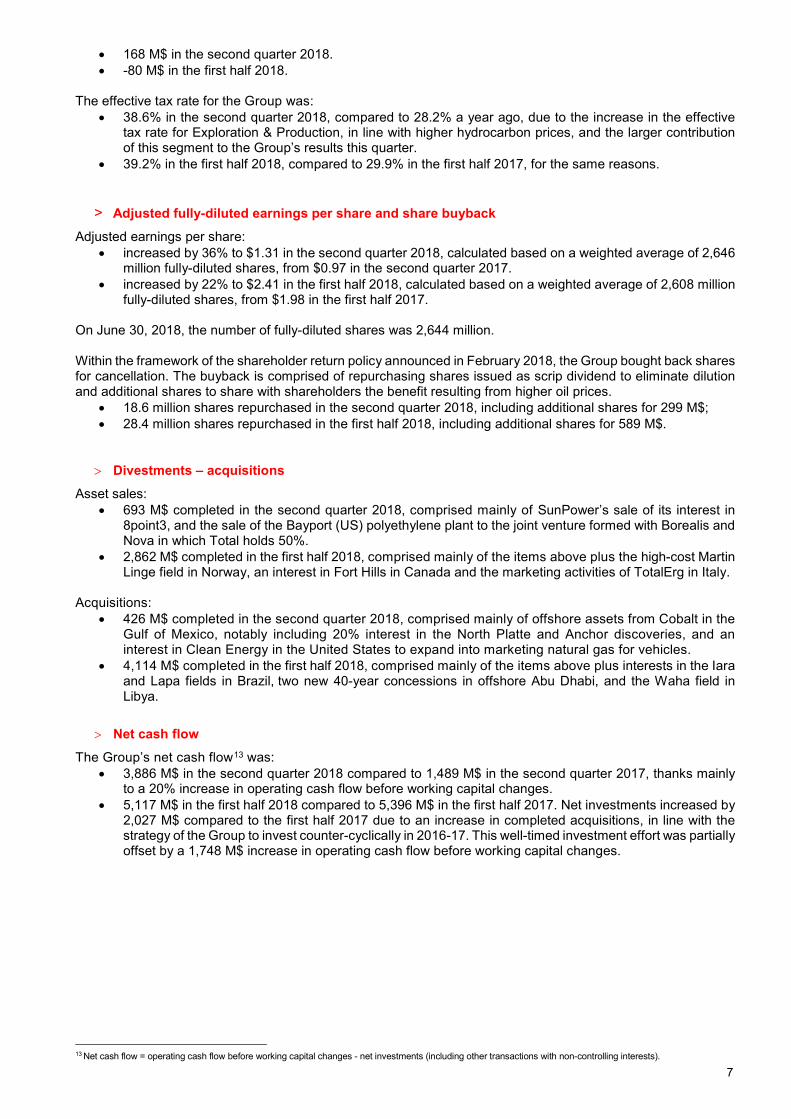
* Excludes trading and bulk refining sales, includes share of TotalErg. Petroleum product sales:
• increased by 2% in the second quarter 2018 compared to the second quarter 2017, despite the sale of TotalErg in Italy, due to growth in the business, notably in Asia and Africa.
• increased by 3% in the first half 2018 compared to the first half 2017 for the same reasons.
> Results
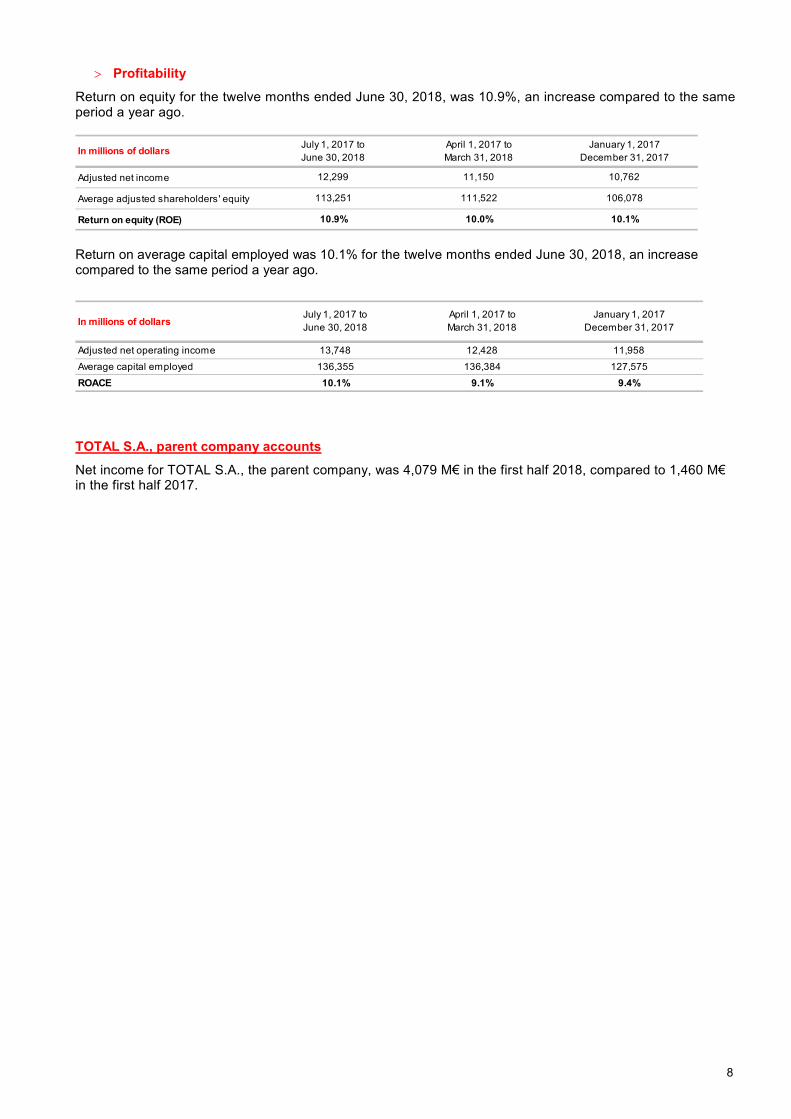
* Detail of adjustment items shown in the business segment information annex to financial statements. ** excluding financial charges Adjusted net operating income for the Marketing & Services segment was:
• 478 M$ in the second quarter 2018, an increase of 10% compared to the second quarter 2017, due to volume growth in a context of favorable margins, notably in Africa.
• 845 M$ in the first half 2018, a 15% increase compared to the first half 2017, for the same reasons. Group results
> Adjusted net operating income from business segments
Adjusted net operating income from the business segments was: • 4,179 M$ in the second quarter 2018, a 52% increase compared to the second quarter 2017, essentially
due to the strong performance of Exploration & Production, which doubled its contribution compared to a year ago, thanks to increasing production in a context of higher hydrocarbon prices and lower costs.
• 7,564 M$ in the first half 2018, a 37% increase compared to the first half 2017 for the same reasons.
> Adjusted net income (Group share)
Adjusted net income was: • 3,553 M$ in the second quarter 2018, an increase of 44% compared to the second quarter 2017,
essentially due to 52% increase in the contribution of the segments, partially offset by higher net cost of net debt, mainly due to an increase in dollar interest rates.
• 6,437 M$ in the first half 2018, a 28% increase compared to the first half 2017 for the same reasons. Adjusted net income excludes the after-tax inventory effect, special items and the impact of changes in fair value11. Total adjustments affecting net income12 were: 11 Details shown on page 11. 12 Details shown on page 11 and in the annex to the financial statements.
2Q18 1Q18 2Q172Q18
vs 2Q17
Sales in kb/d* 1H18 1H171H18 vs
1H17
1,799 1,801 1,760 +2% Total Marketing & Services sales 1,800 1,744 +3%
1,001 993 1,039 -4% Europe 997 1,039 -4%
798 808 721 +11% Rest of world 803 705 +14%
2Q18 1Q18 2Q172Q18
vs 2Q17
In millions of dollars 1H18 1H171H18 vs
1H17
478 367 433 +10% Adjusted net operating income* 845 734 +15%
310 228 258 +20% Investments 538 697 -23%
45 228 182 -75% Divestments 273 218 +25%
205 136 185 +11% Organic investments 342 280 +22%
646 430 624 +4% Operating cash flow before working capital changes** 1,076 1,053 +2%
841 -60 251 x3.4 Cash flow from operations** 781 582 +34%
7
• 168 M$ in the second quarter 2018. • -80 M$ in the first half 2018.
The effective tax rate for the Group was:
• 38.6% in the second quarter 2018, compared to 28.2% a year ago, due to the increase in the effective tax rate for Exploration & Production, in line with higher hydrocarbon prices, and the larger contribution of this segment to the Group’s results this quarter.
• 39.2% in the first half 2018, compared to 29.9% in the first half 2017, for the same reasons.
> Adjusted fully-diluted earnings per share and share buyback
Adjusted earnings per share: • increased by 36% to $1.31 in the second quarter 2018, calculated based on a weighted average of 2,646
million fully-diluted shares, from $0.97 in the second quarter 2017. • increased by 22% to $2.41 in the first half 2018, calculated based on a weighted average of 2,608 million
fully-diluted shares, from $1.98 in the first half 2017. On June 30, 2018, the number of fully-diluted shares was 2,644 million. Within the framework of the shareholder return policy announced in February 2018, the Group bought back shares for cancellation. The buyback is comprised of repurchasing shares issued as scrip dividend to eliminate dilution and additional shares to share with shareholders the benefit resulting from higher oil prices.
• 18.6 million shares repurchased in the second quarter 2018, including additional shares for 299 M$; • 28.4 million shares repurchased in the first half 2018, including additional shares for 589 M$.
> Divestments – acquisitions
Asset sales: • 693 M$ completed in the second quarter 2018, comprised mainly of SunPower’s sale of its interest in
8point3, and the sale of the Bayport (US) polyethylene plant to the joint venture formed with Borealis and Nova in which Total holds 50%.
• 2,862 M$ completed in the first half 2018, comprised mainly of the items above plus the high-cost Martin Linge field in Norway, an interest in Fort Hills in Canada and the marketing activities of TotalErg in Italy.
Acquisitions:
• 426 M$ completed in the second quarter 2018, comprised mainly of offshore assets from Cobalt in the Gulf of Mexico, notably including 20% interest in the North Platte and Anchor discoveries, and an interest in Clean Energy in the United States to expand into marketing natural gas for vehicles.
• 4,114 M$ completed in the first half 2018, comprised mainly of the items above plus interests in the Iara and Lapa fields in Brazil, two new 40-year concessions in offshore Abu Dhabi, and the Waha field in Libya.
> Net cash flow
The Group’s net cash flow13 was: • 3,886 M$ in the second quarter 2018 compared to 1,489 M$ in the second quarter 2017, thanks mainly
to a 20% increase in operating cash flow before working capital changes. • 5,117 M$ in the first half 2018 compared to 5,396 M$ in the first half 2017. Net investments increased by
2,027 M$ compared to the first half 2017 due to an increase in completed acquisitions, in line with the strategy of the Group to invest counter-cyclically in 2016-17. This well-timed investment effort was partially offset by a 1,748 M$ increase in operating cash flow before working capital changes.
13 Net cash flow = operating cash flow before working capital changes - net investments (including other transactions with non-controlling interests).
8
> Profitability
Return on equity for the twelve months ended June 30, 2018, was 10.9%, an increase compared to the same period a year ago.
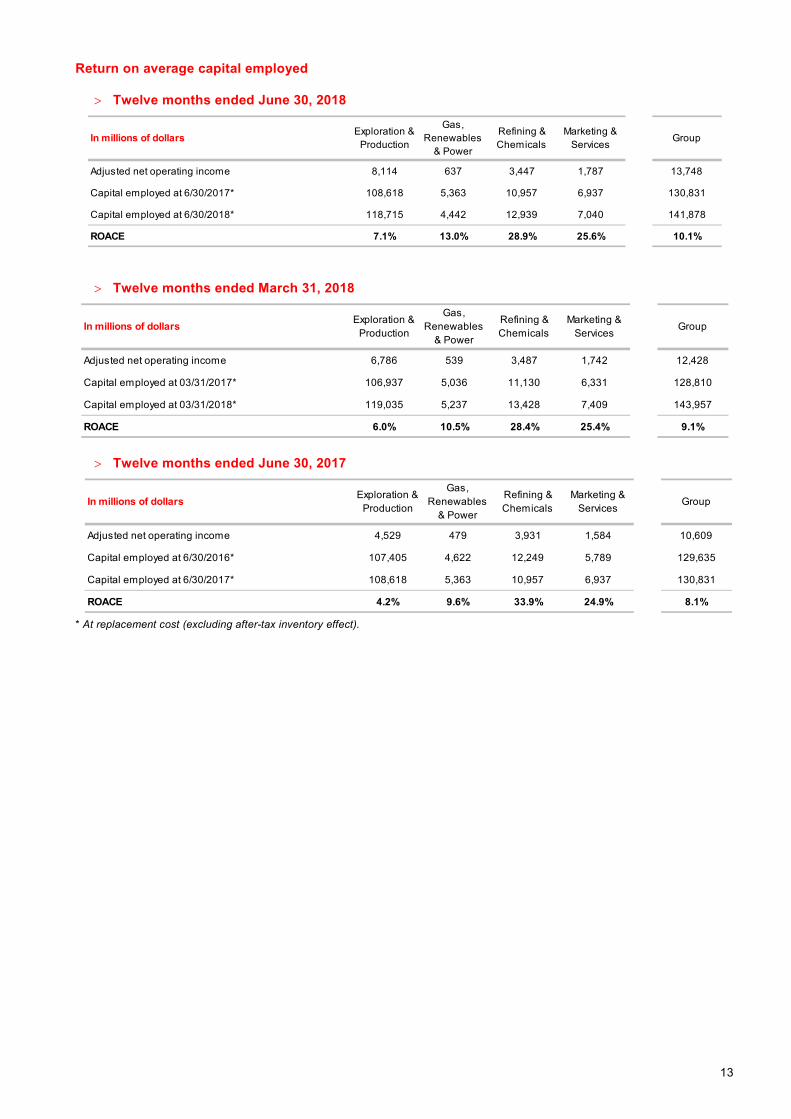
Return on average capital employed was 10.1% for the twelve months ended June 30, 2018, an increase compared to the same period a year ago.
TOTAL S.A., parent company accounts
Net income for TOTAL S.A., the parent company, was 4,079 M€ in the first half 2018, compared to 1,460 M€ in the first half 2017.
In millions of dollars
Adjusted net income
Average adjusted shareholders' equity
Return on equity (ROE)
January 1, 2017 December 31, 2017
10,762
106,078
10.1%10.9% 10.0%
July 1, 2017 to June 30, 2018
April 1, 2017 to March 31, 2018
12,299 11,150
113,251 111,522
In millions of dollars
Adjusted net operating income
Average capital employed
ROACE
July 1, 2017 to June 30, 2018
April 1, 2017 to March 31, 2018
January 1, 2017 December 31, 2017
13,748 12,428 11,958
136,355 136,384 127,575
10.1% 9.1% 9.4%
9
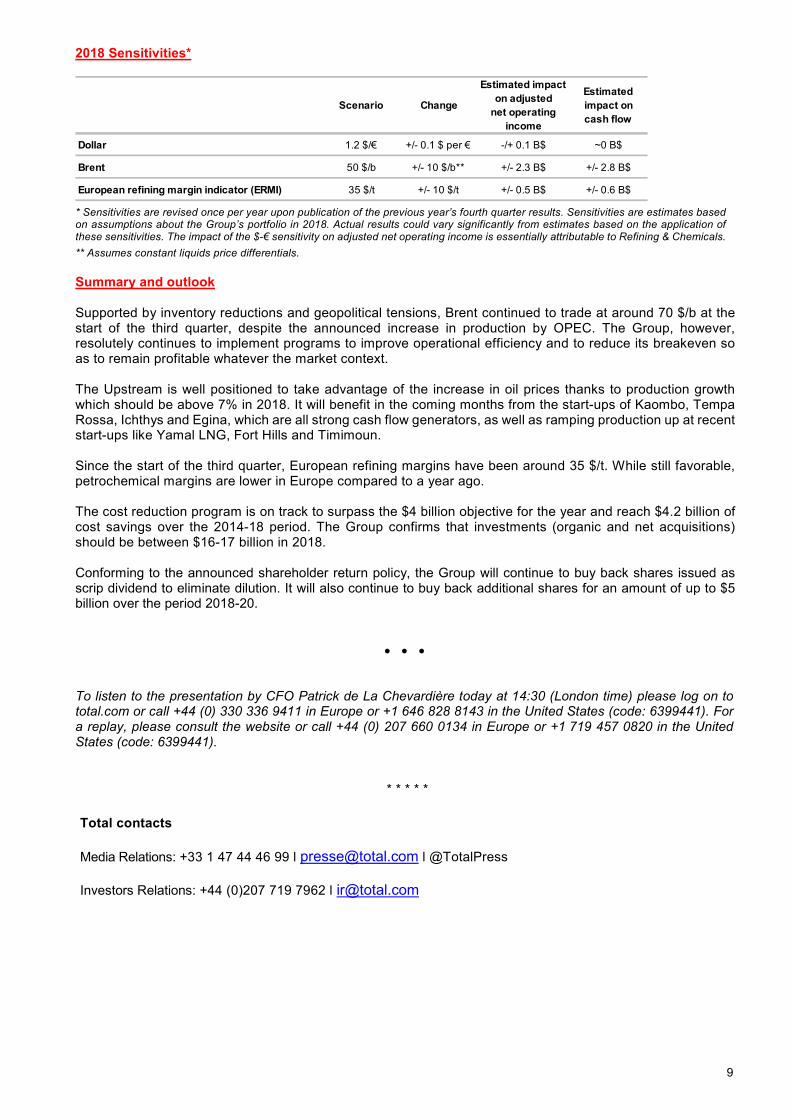
2018 Sensitivities*
* Sensitivities are revised once per year upon publication of the previous year’s fourth quarter results. Sensitivities are estimates based on assumptions about the Group’s portfolio in 2018. Actual results could vary significantly from estimates based on the application of these sensitivities. The impact of the $-€ sensitivity on adjusted net operating income is essentially attributable to Refining & Chemicals. ** Assumes constant liquids price differentials. Summary and outlook Supported by inventory reductions and geopolitical tensions, Brent continued to trade at around 70 $/b at the start of the third quarter, despite the announced increase in production by OPEC. The Group, however, resolutely continues to implement programs to improve operational efficiency and to reduce its breakeven so as to remain profitable whatever the market context. The Upstream is well positioned to take advantage of the increase in oil prices thanks to production growth which should be above 7% in 2018. It will benefit in the coming months from the start-ups of Kaombo, Tempa Rossa, Ichthys and Egina, which are all strong cash flow generators, as well as ramping production up at recent start-ups like Yamal LNG, Fort Hills and Timimoun. Since the start of the third quarter, European refining margins have been around 35 $/t. While still favorable, petrochemical margins are lower in Europe compared to a year ago. The cost reduction program is on track to surpass the $4 billion objective for the year and reach $4.2 billion of cost savings over the 2014-18 period. The Group confirms that investments (organic and net acquisitions) should be between $16-17 billion in 2018. Conforming to the announced shareholder return policy, the Group will continue to buy back shares issued as scrip dividend to eliminate dilution. It will also continue to buy back additional shares for an amount of up to $5 billion over the period 2018-20.
• • • To listen to the presentation by CFO Patrick de La Chevardière today at 14:30 (London time) please log on to total.com or call +44 (0) 330 336 9411 in Europe or +1 646 828 8143 in the United States (code: 6399441). For a replay, please consult the website or call +44 (0) 207 660 0134 in Europe or +1 719 457 0820 in the United States (code: 6399441).
* * * * *
Total contacts
Media Relations: +33 1 47 44 46 99 l [email protected] l @TotalPress
Investors Relations: +44 (0)207 719 7962 l [email protected]
Scenario Change
Estimated impact on adjusted
net operating income
Estimated impact on cash flow
Dollar 1.2 $/€ +/- 0.1 $ per € -/+ 0.1 B$ ~0 B$
Brent 50 $/b +/- 10 $/b** +/- 2.3 B$ +/- 2.8 B$
European refining margin indicator (ERMI) 35 $/t +/- 10 $/t +/- 0.5 B$ +/- 0.6 B$
10
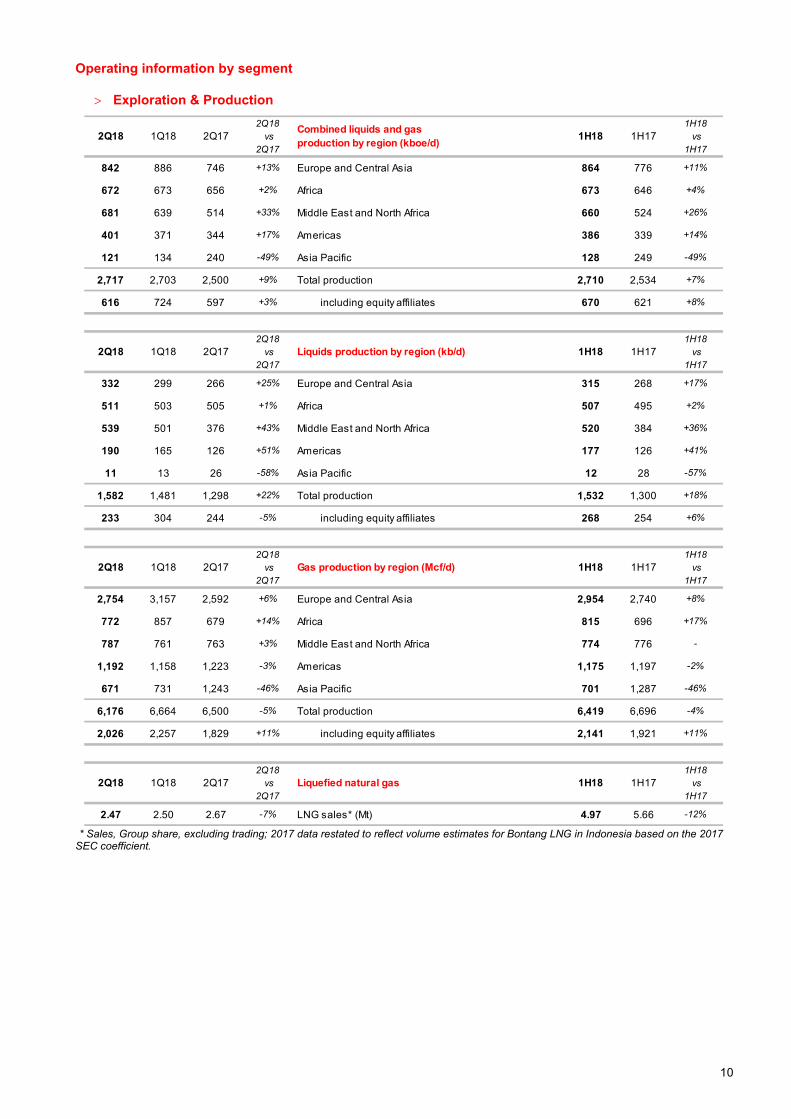
Operating information by segment
> Exploration & Production
* Sales, Group share, excluding trading; 2017 data restated to reflect volume estimates for Bontang LNG in Indonesia based on the 2017 SEC coefficient.
2Q18 1Q18 2Q172Q18
vs 2Q17
Combined liquids and gasproduction by region (kboe/d) 1H18 1H17
1H18 vs
1H17
842 886 746 +13% Europe and Central Asia 864 776 +11%
672 673 656 +2% Africa 673 646 +4%
681 639 514 +33% Middle East and North Africa 660 524 +26%
401 371 344 +17% Americas 386 339 +14%
121 134 240 -49% Asia Pacific 128 249 -49%
2,717 2,703 2,500 +9% Total production 2,710 2,534 +7%
616 724 597 +3% including equity affiliates 670 621 +8%
2Q18 1Q18 2Q172Q18
vs 2Q17
Liquids production by region (kb/d) 1H18 1H171H18 vs
1H17
332 299 266 +25% Europe and Central Asia 315 268 +17%
511 503 505 +1% Africa 507 495 +2%
539 501 376 +43% Middle East and North Africa 520 384 +36%
190 165 126 +51% Americas 177 126 +41%
11 13 26 -58% Asia Pacific 12 28 -57%
1,582 1,481 1,298 +22% Total production 1,532 1,300 +18%
233 304 244 -5% including equity affiliates 268 254 +6%
2Q18 1Q18 2Q172Q18
vs 2Q17
Gas production by region (Mcf/d) 1H18 1H171H18 vs
1H17
2,754 3,157 2,592 +6% Europe and Central Asia 2,954 2,740 +8%
772 857 679 +14% Africa 815 696 +17%
787 761 763 +3% Middle East and North Africa 774 776 -
1,192 1,158 1,223 -3% Americas 1,175 1,197 -2%
671 731 1,243 -46% Asia Pacific 701 1,287 -46%
6,176 6,664 6,500 -5% Total production 6,419 6,696 -4%
2,026 2,257 1,829 +11% including equity affiliates 2,141 1,921 +11%
2Q18 1Q18 2Q172Q18
vs 2Q17
Liquefied natural gas 1H18 1H171H18 vs
1H17
2.47 2.50 2.67 -7% LNG sales* (Mt) 4.97 5.66 -12%
11
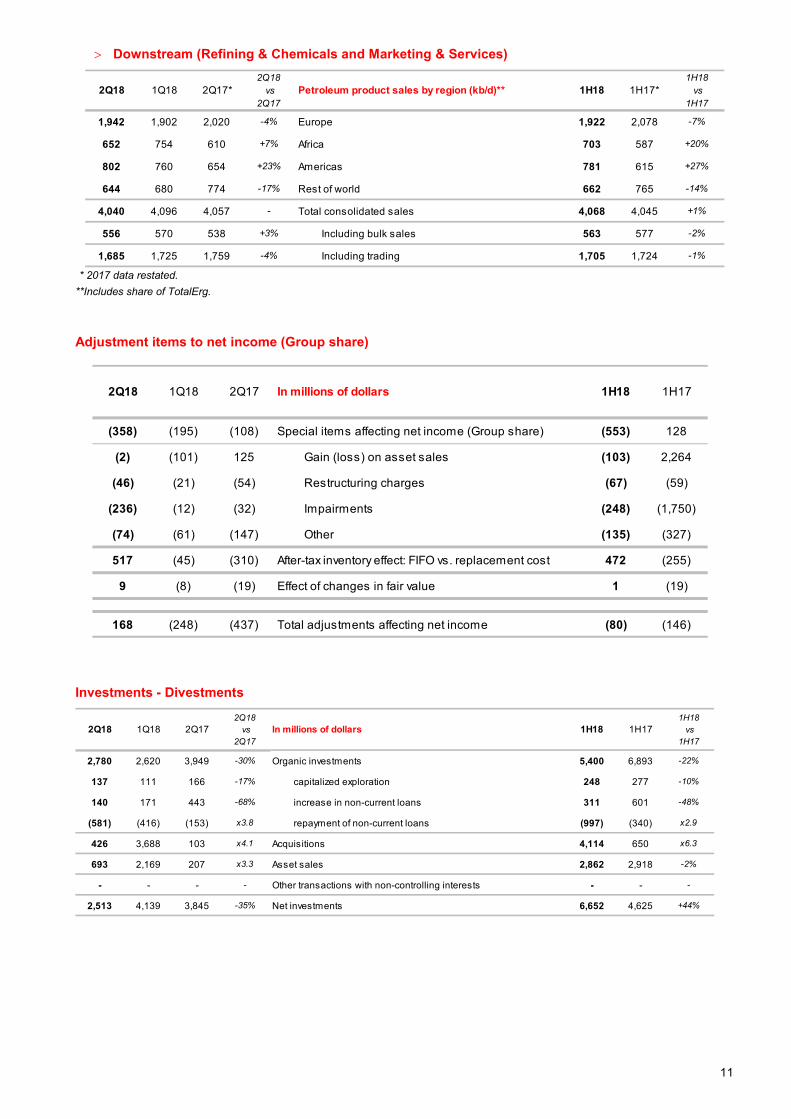
> Downstream (Refining & Chemicals and Marketing & Services)
* 2017 data restated. **Includes share of TotalErg.
Adjustment items to net income (Group share)
Investments - Divestments
2Q18 1Q18 2Q17*2Q18
vs 2Q17
Petroleum product sales by region (kb/d)** 1H18 1H17*1H18 vs
1H17
1,942 1,902 2,020 -4% Europe 1,922 2,078 -7%
652 754 610 +7% Africa 703 587 +20%
802 760 654 +23% Americas 781 615 +27%
644 680 774 -17% Rest of world 662 765 -14%
4,040 4,096 4,057 - Total consolidated sales 4,068 4,045 +1%
556 570 538 +3% Including bulk sales 563 577 -2%
1,685 1,725 1,759 -4% Including trading 1,705 1,724 -1%
2Q18 1Q18 2Q17 In millions of dollars 1H18 1H17
(358) (195) (108) Special items affecting net income (Group share) (553) 128
(2) (101) 125 Gain (loss) on asset sales (103) 2,264
(46) (21) (54) Restructuring charges (67) (59)
(236) (12) (32) Impairments (248) (1,750)
(74) (61) (147) Other (135) (327)
517 (45) (310) After-tax inventory effect: FIFO vs. replacement cost 472 (255)
9 (8) (19) Effect of changes in fair value 1 (19)
168 (248) (437) Total adjustments affecting net income (80) (146)
2Q18 1Q18 2Q172Q18
vs 2Q17
In millions of dollars 1H18 1H171H18 vs
1H17
2,780 2,620 3,949 -30% Organic investments 5,400 6,893 -22%
137 111 166 -17% capitalized exploration 248 277 -10%
140 171 443 -68% increase in non-current loans 311 601 -48%
(581) (416) (153) x3.8 repayment of non-current loans (997) (340) x2.9
426 3,688 103 x4.1 Acquisitions 4,114 650 x6.3
693 2,169 207 x3.3 Asset sales 2,862 2,918 -2%
- - - - Other transactions with non-controlling interests - - -
2,513 4,139 3,845 -35% Net investments 6,652 4,625 +44%
12
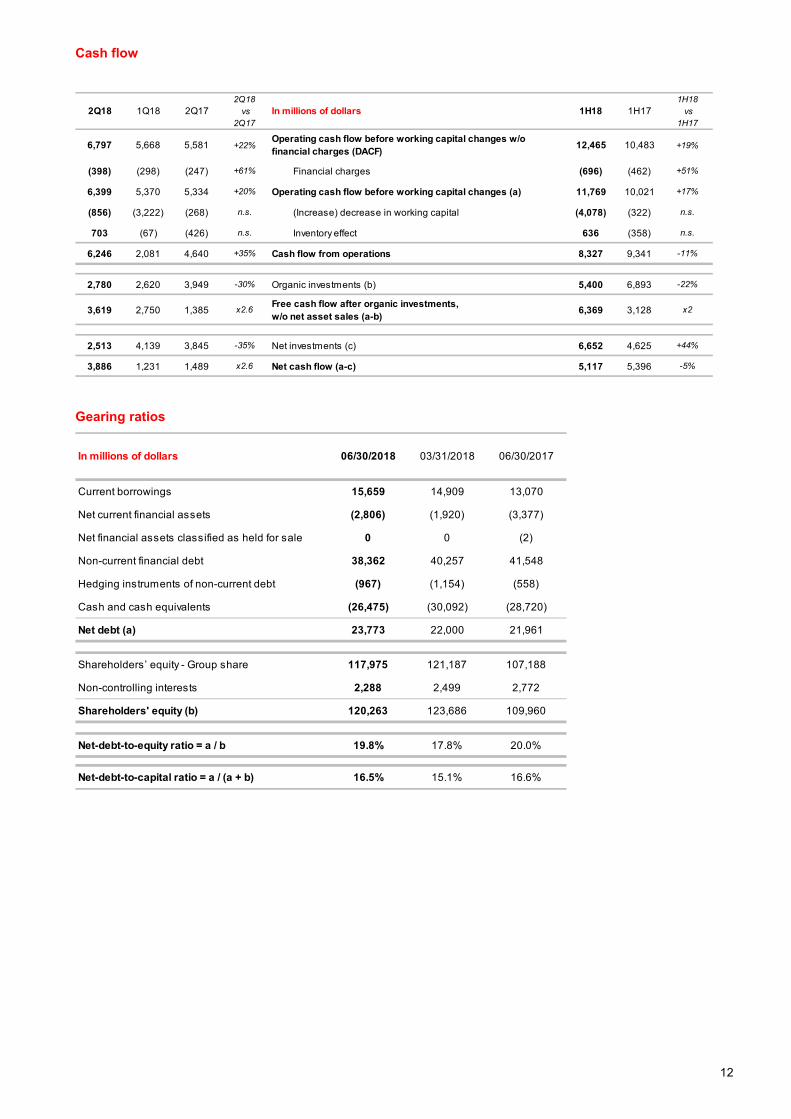
Cash flow
Gearing ratios
2Q18 1Q18 2Q172Q18
vs 2Q17
In millions of dollars 1H18 1H171H18 vs
1H17
6,797 5,668 5,581 +22%Operating cash flow before working capital changes w/o financial charges (DACF) 12,465 10,483 +19%
(398) (298) (247) +61% Financial charges (696) (462) +51%
6,399 5,370 5,334 +20% Operating cash flow before working capital changes (a) 11,769 10,021 +17%
(856) (3,222) (268) n.s. (Increase) decrease in working capital (4,078) (322) n.s.
703 (67) (426) n.s. Inventory effect 636 (358) n.s.
6,246 2,081 4,640 +35% Cash flow from operations 8,327 9,341 -11%
2,780 2,620 3,949 -30% Organic investments (b) 5,400 6,893 -22%
3,619 2,750 1,385 x2.6 Free cash flow after organic investments, w/o net asset sales (a-b) 6,369 3,128 x2
2,513 4,139 3,845 -35% Net investments (c) 6,652 4,625 +44%
3,886 1,231 1,489 x2.6 Net cash flow (a-c) 5,117 5,396 -5%
In millions of dollars 06/30/2018 03/31/2018 06/30/2017
Current borrowings 15,659 14,909 13,070
Net current financial assets (2,806) (1,920) (3,377)
Net financial assets classified as held for sale 0 0 (2)
Non-current financial debt 38,362 40,257 41,548
Hedging instruments of non-current debt (967) (1,154) (558)
Cash and cash equivalents (26,475) (30,092) (28,720)
Net debt (a) 23,773 22,000 21,961
Shareholders’ equity - Group share 117,975 121,187 107,188
Non-controlling interests 2,288 2,499 2,772
Shareholders' equity (b) 120,263 123,686 109,960
Net-debt-to-equity ratio = a / b 19.8% 17.8% 20.0%
Net-debt-to-capital ratio = a / (a + b) 16.5% 15.1% 16.6%
13
Return on average capital employed
> Twelve months ended June 30, 2018
> Twelve months ended March 31, 2018
> Twelve months ended June 30, 2017
* At replacement cost (excluding after-tax inventory effect).
In millions of dollars Exploration & Production
Gas, Renewables
& Power
Refining & Chemicals
Marketing & Services
Group
Adjusted net operating income 8,114 637 3,447 1,787 13,748
Capital employed at 6/30/2017* 108,618 5,363 10,957 6,937 130,831
Capital employed at 6/30/2018* 118,715 4,442 12,939 7,040 141,878
ROACE 7.1% 13.0% 28.9% 25.6% 10.1%
In millions of dollars Exploration & Production
Gas, Renewables
& Power
Refining & Chemicals
Marketing & Services
Group
Adjusted net operating income 6,786 539 3,487 1,742 12,428
Capital employed at 03/31/2017* 106,937 5,036 11,130 6,331 128,810
Capital employed at 03/31/2018* 119,035 5,237 13,428 7,409 143,957
ROACE 6.0% 10.5% 28.4% 25.4% 9.1%
In millions of dollars Exploration & Production
Gas, Renewables
& Power
Refining & Chemicals
Marketing & Services
Group
Adjusted net operating income 4,529 479 3,931 1,584 10,609
Capital employed at 6/30/2016* 107,405 4,622 12,249 5,789 129,635
Capital employed at 6/30/2017* 108,618 5,363 10,957 6,937 130,831
ROACE 4.2% 9.6% 33.9% 24.9% 8.1%
14
This document does not constitute the Financial Report for the first half of 2018 which will be separately published, in accordance with article L. 451-1-2 III of the French Code monétaire et financier, and is available on the Total website total.com. This press release presents the results for the second quarter and half-year 2018 from the consolidated financial statements of TOTAL S.A. as of June 30, 2018 (unaudited). The audit procedures by the Statutory Auditors are underway. The notes to these consolidated financial statements (unaudited) are available on the TOTAL website total.com This document may contain forward-looking information on the Group (including objectives and trends), as well as forward-looking statements within the meaning of the Private Securities Litigation Reform Act of 1995, notably with respect to the financial condition, results of operations, business, strategy and plans of TOTAL. These data do not represent forecasts within the meaning of European Regulation No. 809/2004. Such forward-looking information and statements included in this document are based on a number of economic data and assumptions made in a given economic, competitive and regulatory environment. They may prove to be inaccurate in the future, and are subject to a number of risk factors that could lead to a significant difference between actual results and those anticipated, including currency fluctuations, the price of petroleum products, the ability to realize cost reductions and operating efficiencies without unduly disrupting business operations, environmental regulatory considerations and general economic and business conditions. Certain financial information is based on estimates particularly in the assessment of the recoverable value of assets and potential impairments of assets relating thereto. Neither TOTAL nor any of its subsidiaries assumes any obligation to update publicly any forward-looking information or statement, objectives or trends contained in this document whether as a result of new information, future events or otherwise. Further information on factors, risks and uncertainties that could affect the Company’s financial results or the Group’s activities is provided in the most recent Registration Document, the French language version of which is filed by the Company with the French Autorité des Marchés Financiers and annual report on Form 20-F filed with the United States Securities and Exchange Commission (“SEC”). Financial information by business segment is reported in accordance with the internal reporting system and shows internal segment information that is used to manage and measure the performance of TOTAL. Performance indicators excluding the adjustment items, such as adjusted operating income, adjusted net operating income, and adjusted net income are meant to facilitate the analysis of the financial performance and the comparison of income between periods. These adjustment items include: (i) Special items Due to their unusual nature or particular significance, certain transactions qualified as "special items" are excluded from the business segment figures. In general, special items relate to transactions that are significant, infrequent or unusual. However, in certain instances, transactions such as restructuring costs or asset disposals, which are not considered to be representative of the normal course of business, may be qualified as special items although they may have occurred within prior years or are likely to occur again within the coming years. (ii) Inventory valuation effect The adjusted results of the Refining & Chemicals and Marketing & Services segments are presented according to the replacement cost method. This method is used to assess the segments’ performance and facilitate the comparability of the segments’ performance with those of its competitors. In the replacement cost method, which approximates the LIFO (Last-In, First-Out) method, the variation of inventory values in the statement of income is, depending on the nature of the inventory, determined using either the month-end price differentials between one period and another or the average prices of the period rather than the historical value. The inventory valuation effect is the difference between the results according to the FIFO (First-In, First-Out) and the replacement cost. (iii) Effect of changes in fair value The effect of changes in fair value presented as an adjustment item reflects, for some transactions, differences between internal measures of performance used by TOTAL’s management and the accounting for these transactions under IFRS. IFRS requires that trading inventories be recorded at their fair value using period-end spot prices. In order to best reflect the management of economic exposure through derivative transactions, internal indicators used to measure performance include valuations of trading inventories based on forward prices. Furthermore, TOTAL, in its trading activities, enters into storage contracts, whose future effects are recorded at fair value in Group’s internal economic performance. IFRS precludes recognition of this fair value effect. The adjusted results (adjusted operating income, adjusted net operating income, adjusted net income) are defined as replacement cost results, adjusted for special items, excluding the effect of changes in fair value. Euro amounts presented herein represent dollar amounts converted at the average euro-dollar (€-$) exchange rate for the applicable period and are not the result of financial statements prepared in euros. Cautionary Note to U.S. Investors – The SEC permits oil and gas companies, in their filings with the SEC, to separately disclose proved, probable and possible reserves that a company has determined in accordance with SEC rules. We may use certain terms in this press release, such as “potential reserves” or “resources”, that the SEC’s guidelines strictly prohibit us from including in filings with the SEC. U.S. investors are urged to consider closely the disclosure in our Form 20-F, File N° 1-10888, available from us at 2, place Jean Millier – Arche Nord Coupole/Regnault - 92078 Paris-La Défense Cedex, France, or at our website total.com. You can also obtain this form from the SEC by calling 1-800-SEC-0330 or on the SEC’s website sec.gov.
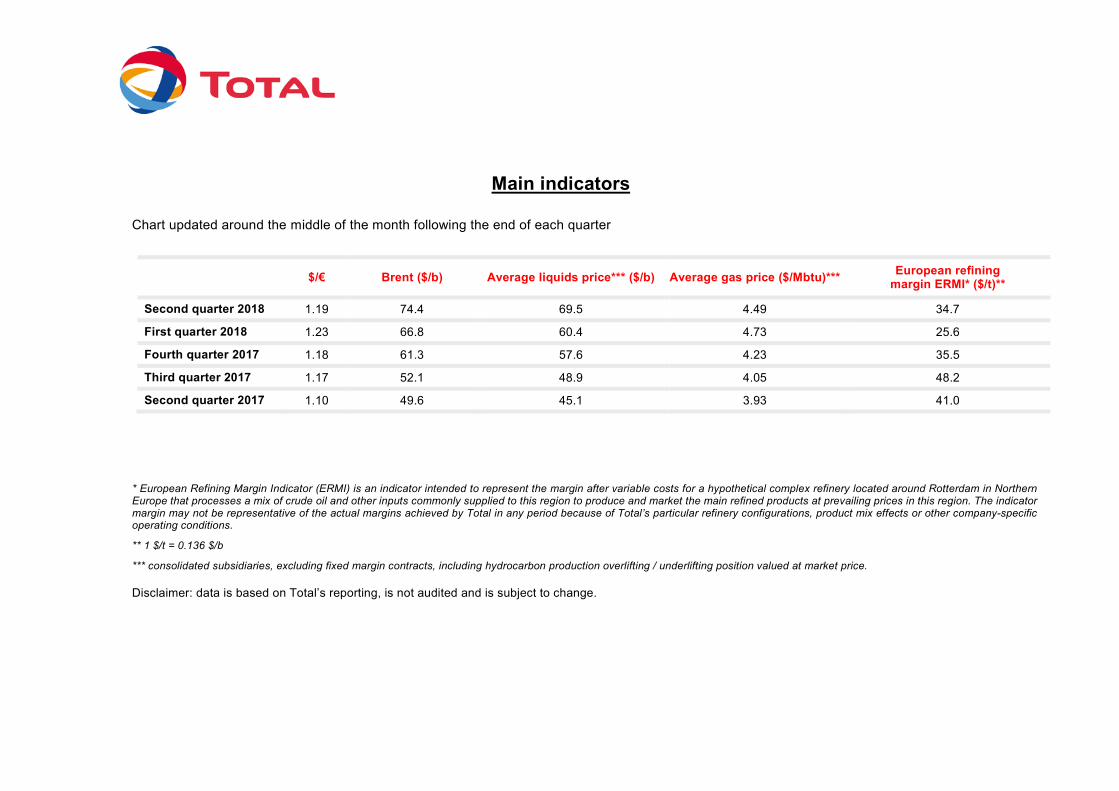
Main indicators
Chart updated around the middle of the month following the end of each quarter
$/€ Brent ($/b) Average liquids price*** ($/b) Average gas price ($/Mbtu)*** European refining margin ERMI* ($/t)**
Second quarter 2018 1.19 74.4 69.5 4.49 34.7
First quarter 2018 1.23 66.8 60.4 4.73 25.6
Fourth quarter 2017 1.18 61.3 57.6 4.23 35.5
Third quarter 2017 1.17 52.1 48.9 4.05 48.2
Second quarter 2017 1.10 49.6 45.1 3.93 41.0
* European Refining Margin Indicator (ERMI) is an indicator intended to represent the margin after variable costs for a hypothetical complex refinery located around Rotterdam in Northern Europe that processes a mix of crude oil and other inputs commonly supplied to this region to produce and market the main refined products at prevailing prices in this region. The indicator margin may not be representative of the actual margins achieved by Total in any period because of Total’s particular refinery configurations, product mix effects or other company-specific operating conditions.
** 1 $/t = 0.136 $/b
*** consolidated subsidiaries, excluding fixed margin contracts, including hydrocarbon production overlifting / underlifting position valued at market price. Disclaimer: data is based on Total’s reporting, is not audited and is subject to change.
Total financial statements Second quarter and first half 2018 consolidated accounts, IFRS
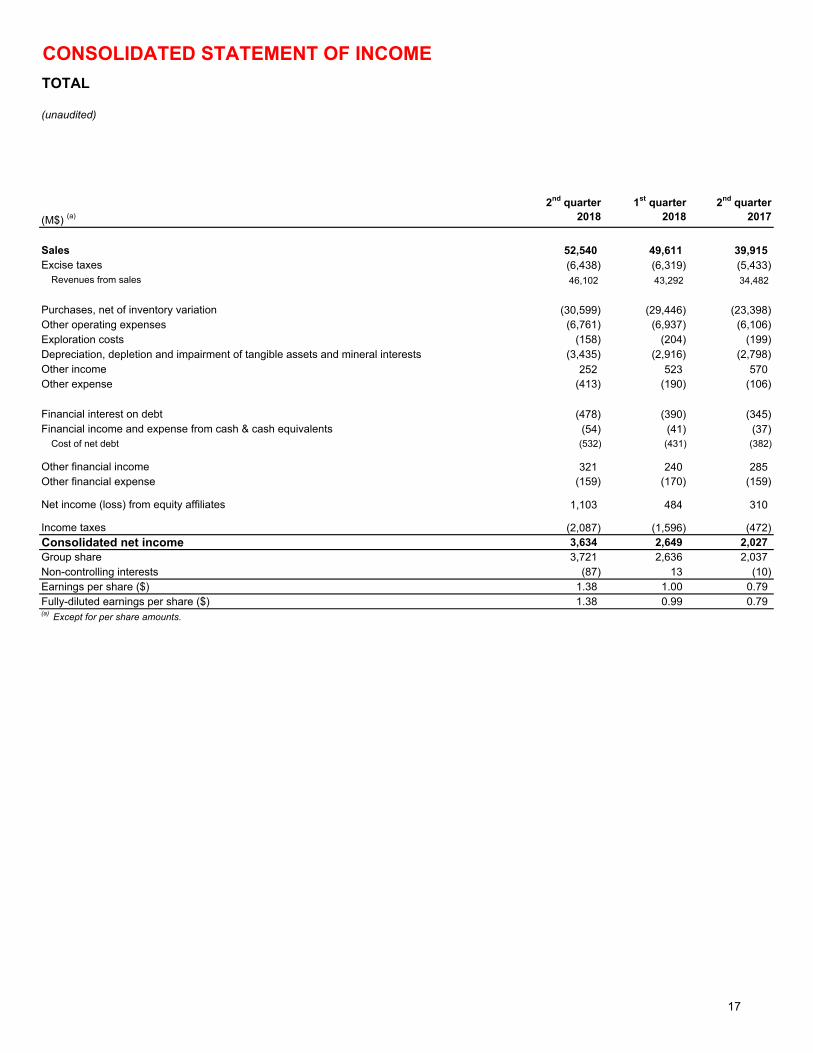
CONSOLIDATED STATEMENT OF INCOME
TOTAL
(M$) (a)
2nd quarter2018
1st quarter2018
2nd quarter2017
Sales 52,540 49,611 39,915Excise taxes (6,438) (6,319) (5,433)
Revenues from sales 46,102 43,292 34,482
Purchases, net of inventory variation (30,599) (29,446) (23,398)Other operating expenses (6,761) (6,937) (6,106)Exploration costs (158) (204) (199)Depreciation, depletion and impairment of tangible assets and mineral interests (3,435) (2,916) (2,798)Other income 252 523 570Other expense (413) (190) (106)
Financial interest on debt (478) (390) (345)Financial income and expense from cash & cash equivalents (54) (41) (37)
Cost of net debt (532) (431) (382)
Other financial income 321 240 285Other financial expense (159) (170) (159)
Net income (loss) from equity affiliates 1,103 484 310
Income taxes (2,087) (1,596) (472)Consolidated net income 3,634 2,649 2,027Group share 3,721 2,636 2,037Non-controlling interests (87) 13 (10)Earnings per share ($) 1.38 1.00 0.79 Fully-diluted earnings per share ($) 1.38 0.99 0.79 (a) Except for per share amounts.
(unaudited)
17
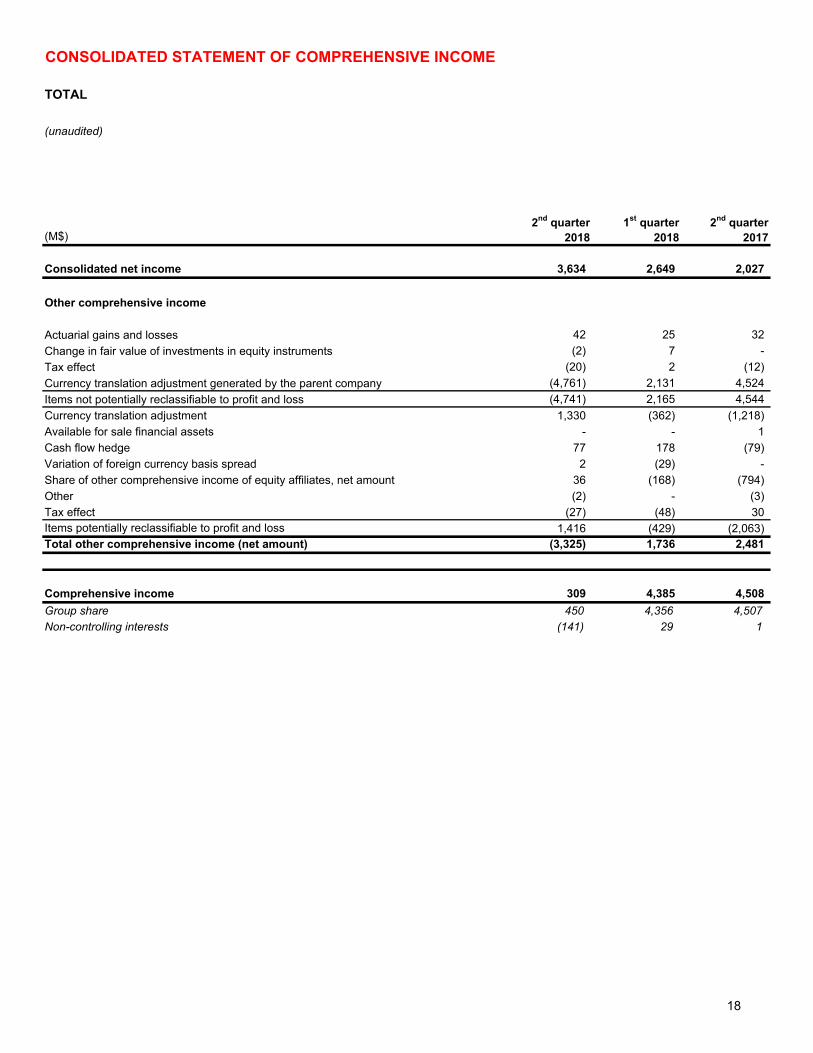
CONSOLIDATED STATEMENT OF COMPREHENSIVE INCOME
TOTAL
(M$)2nd quarter
20181st quarter
20182nd quarter
2017
Consolidated net income 3,634 2,649 2,027
Other comprehensive income
Actuarial gains and losses 42 25 32
Change in fair value of investments in equity instruments (2) 7 -
Tax effect (20) 2 (12)
Currency translation adjustment generated by the parent company (4,761) 2,131 4,524
Items not potentially reclassifiable to profit and loss (4,741) 2,165 4,544
Currency translation adjustment 1,330 (362) (1,218)
Available for sale financial assets - - 1
Cash flow hedge 77 178 (79)
Variation of foreign currency basis spread 2 (29) -
Share of other comprehensive income of equity affiliates, net amount 36 (168) (794)
Other (2) - (3)
Tax effect (27) (48) 30Items potentially reclassifiable to profit and loss 1,416 (429) (2,063)Total other comprehensive income (net amount) (3,325) 1,736 2,481
Comprehensive income 309 4,385 4,508
Group share 450 4,356 4,507Non-controlling interests (141) 29 1
(unaudited)
18
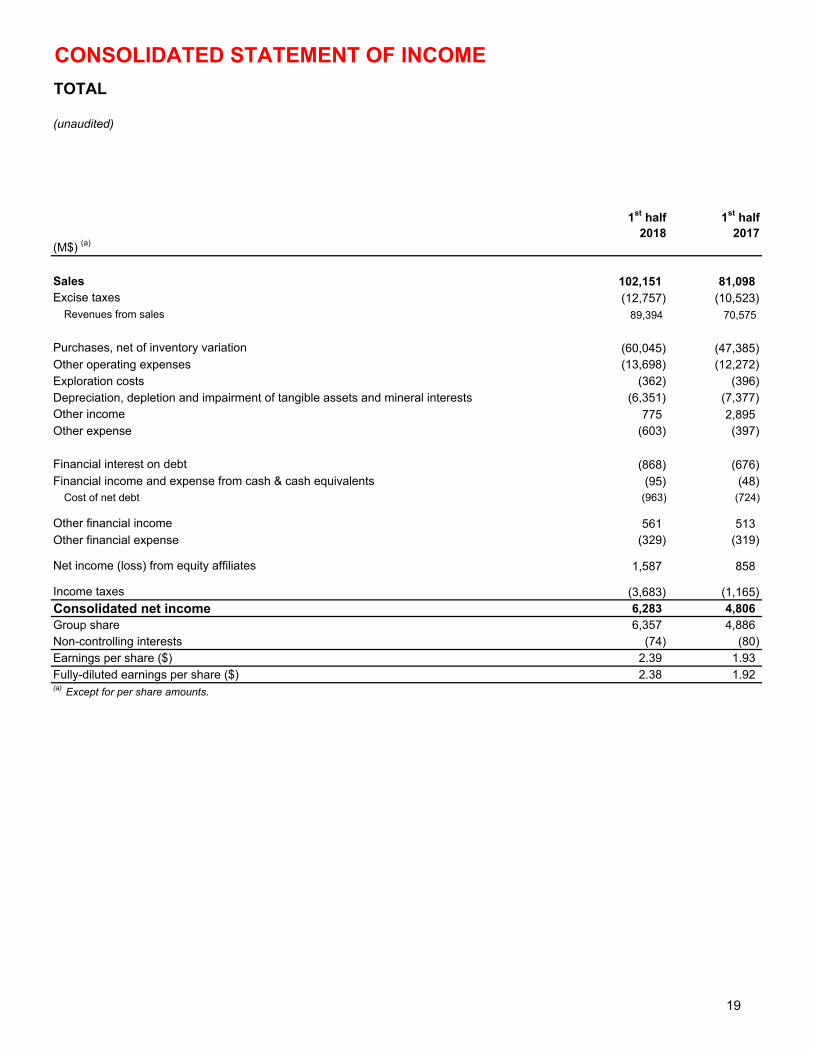
CONSOLIDATED STATEMENT OF INCOME
TOTAL
(M$) (a)
1st half2018
1st half2017
Sales 102,151 81,098Excise taxes (12,757) (10,523)
Revenues from sales 89,394 70,575
Purchases, net of inventory variation (60,045) (47,385)Other operating expenses (13,698) (12,272)Exploration costs (362) (396)Depreciation, depletion and impairment of tangible assets and mineral interests (6,351) (7,377)Other income 775 2,895Other expense (603) (397)
Financial interest on debt (868) (676)Financial income and expense from cash & cash equivalents (95) (48)
Cost of net debt (963) (724)
Other financial income 561 513Other financial expense (329) (319)
Net income (loss) from equity affiliates 1,587 858
Income taxes (3,683) (1,165)
Consolidated net income 6,283 4,806Group share 6,357 4,886Non-controlling interests (74) (80)Earnings per share ($) 2.39 1.93 Fully-diluted earnings per share ($) 2.38 1.92 (a) Except for per share amounts.
(unaudited)
19
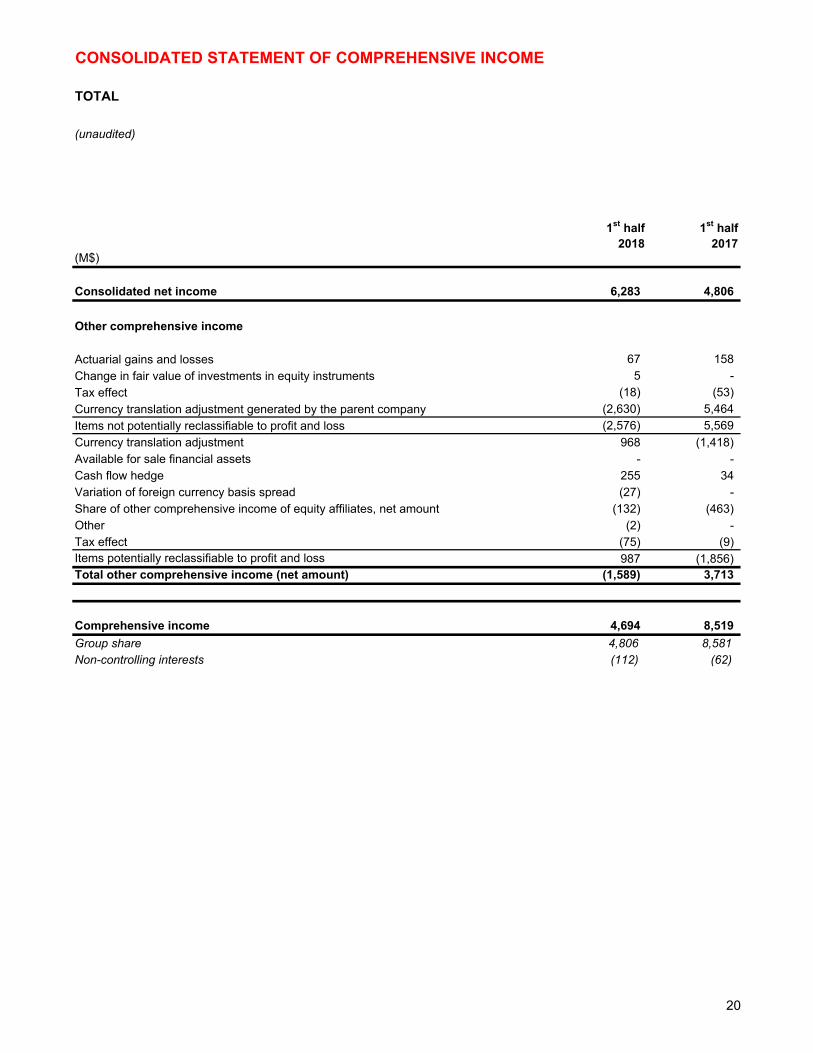
CONSOLIDATED STATEMENT OF COMPREHENSIVE INCOME
TOTAL
(M$)
1st half2018
1st half2017
Consolidated net income 6,283 4,806
Other comprehensive income
Actuarial gains and losses 67 158
Change in fair value of investments in equity instruments 5 -
Tax effect (18) (53)
Currency translation adjustment generated by the parent company (2,630) 5,464
Items not potentially reclassifiable to profit and loss (2,576) 5,569
Currency translation adjustment 968 (1,418)Available for sale financial assets - -Cash flow hedge 255 34Variation of foreign currency basis spread (27) -Share of other comprehensive income of equity affiliates, net amount (132) (463)Other (2) -Tax effect (75) (9)Items potentially reclassifiable to profit and loss 987 (1,856)Total other comprehensive income (net amount) (1,589) 3,713
Comprehensive income 4,694 8,519
Group share 4,806 8,581Non-controlling interests (112) (62)
(unaudited)
20
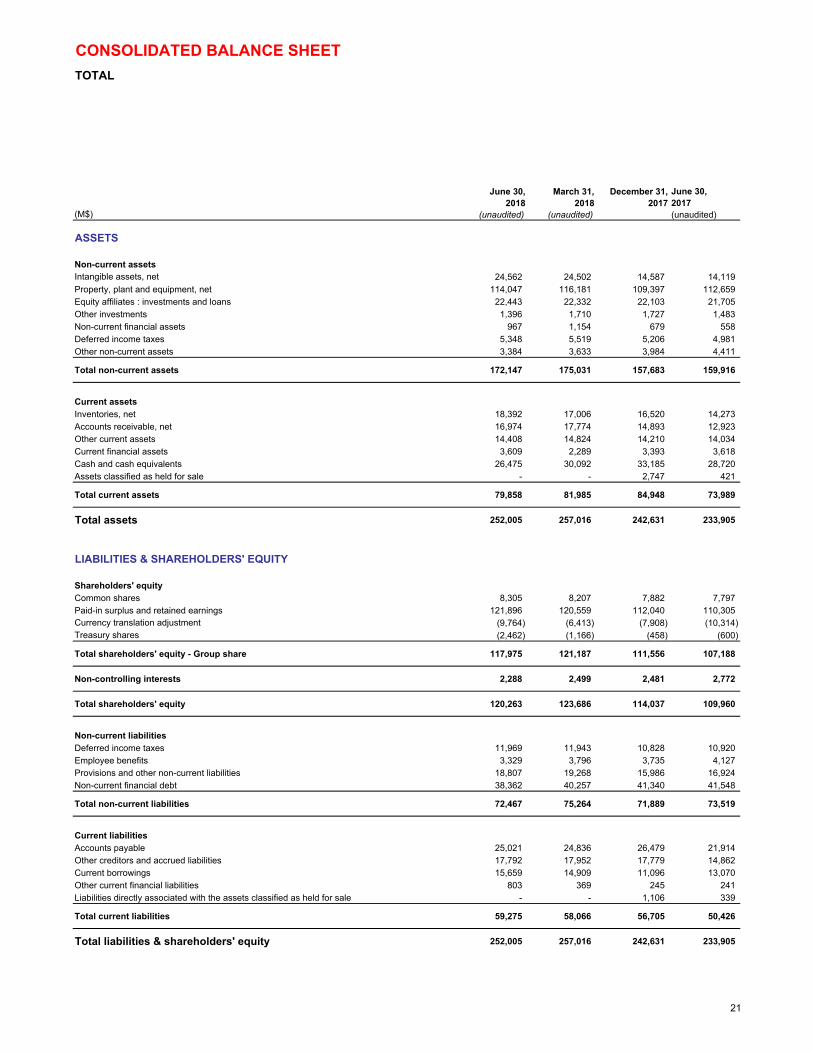
CONSOLIDATED BALANCE SHEET
TOTAL
(M$)
June 30, 2018
(unaudited)
March 31, 2018
(unaudited)
December 31, 2017
(unaudited)
June 30, 2017(unaudited)
ASSETS
Non-current assetsIntangible assets, net 24,562 24,502 14,587 14,119Property, plant and equipment, net 114,047 116,181 109,397 112,659Equity affiliates : investments and loans 22,443 22,332 22,103 21,705Other investments 1,396 1,710 1,727 1,483Non-current financial assets 967 1,154 679 558Deferred income taxes 5,348 5,519 5,206 4,981Other non-current assets 3,384 3,633 3,984 4,411
Total non-current assets 172,147 175,031 157,683 159,916
Current assetsInventories, net 18,392 17,006 16,520 14,273Accounts receivable, net 16,974 17,774 14,893 12,923Other current assets 14,408 14,824 14,210 14,034Current financial assets 3,609 2,289 3,393 3,618Cash and cash equivalents 26,475 30,092 33,185 28,720Assets classified as held for sale - - 2,747 421
Total current assets 79,858 81,985 84,948 73,989
Total assets 252,005 257,016 242,631 233,905
LIABILITIES & SHAREHOLDERS' EQUITY
Shareholders' equityCommon shares 8,305 8,207 7,882 7,797Paid-in surplus and retained earnings 121,896 120,559 112,040 110,305Currency translation adjustment (9,764) (6,413) (7,908) (10,314)Treasury shares (2,462) (1,166) (458) (600)
Total shareholders' equity - Group share 117,975 121,187 111,556 107,188
Non-controlling interests 2,288 2,499 2,481 2,772
Total shareholders' equity 120,263 123,686 114,037 109,960
Non-current liabilitiesDeferred income taxes 11,969 11,943 10,828 10,920Employee benefits 3,329 3,796 3,735 4,127Provisions and other non-current liabilities 18,807 19,268 15,986 16,924Non-current financial debt 38,362 40,257 41,340 41,548
Total non-current liabilities 72,467 75,264 71,889 73,519
Current liabilitiesAccounts payable 25,021 24,836 26,479 21,914Other creditors and accrued liabilities 17,792 17,952 17,779 14,862Current borrowings 15,659 14,909 11,096 13,070Other current financial liabilities 803 369 245 241Liabilities directly associated with the assets classified as held for sale - - 1,106 339
Total current liabilities 59,275 58,066 56,705 50,426
Total liabilities & shareholders' equity 252,005 257,016 242,631 233,905
(unaudited)
21
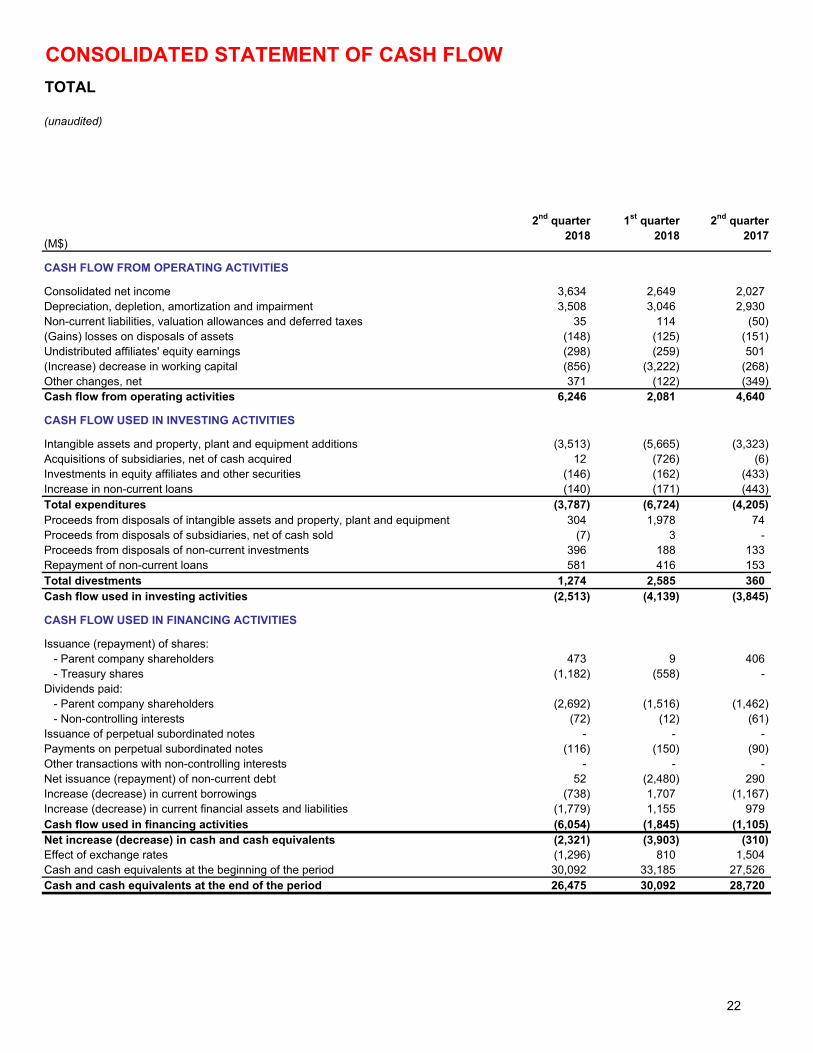
CONSOLIDATED STATEMENT OF CASH FLOW
TOTAL
(M$)
2nd quarter2018
1st quarter2018
2nd quarter2017
CASH FLOW FROM OPERATING ACTIVITIES
Consolidated net income 3,634 2,649 2,027Depreciation, depletion, amortization and impairment 3,508 3,046 2,930Non-current liabilities, valuation allowances and deferred taxes 35 114 (50)(Gains) losses on disposals of assets (148) (125) (151)Undistributed affiliates' equity earnings (298) (259) 501(Increase) decrease in working capital (856) (3,222) (268)Other changes, net 371 (122) (349)Cash flow from operating activities 6,246 2,081 4,640
CASH FLOW USED IN INVESTING ACTIVITIES
Intangible assets and property, plant and equipment additions (3,513) (5,665) (3,323)Acquisitions of subsidiaries, net of cash acquired 12 (726) (6)Investments in equity affiliates and other securities (146) (162) (433)Increase in non-current loans (140) (171) (443)Total expenditures (3,787) (6,724) (4,205)Proceeds from disposals of intangible assets and property, plant and equipment 304 1,978 74Proceeds from disposals of subsidiaries, net of cash sold (7) 3 -Proceeds from disposals of non-current investments 396 188 133Repayment of non-current loans 581 416 153Total divestments 1,274 2,585 360Cash flow used in investing activities (2,513) (4,139) (3,845)
CASH FLOW USED IN FINANCING ACTIVITIES
Issuance (repayment) of shares: - Parent company shareholders 473 9 406 - Treasury shares (1,182) (558) -Dividends paid: - Parent company shareholders (2,692) (1,516) (1,462) - Non-controlling interests (72) (12) (61)Issuance of perpetual subordinated notes - - -Payments on perpetual subordinated notes (116) (150) (90)Other transactions with non-controlling interests - - -Net issuance (repayment) of non-current debt 52 (2,480) 290Increase (decrease) in current borrowings (738) 1,707 (1,167)Increase (decrease) in current financial assets and liabilities (1,779) 1,155 979Cash flow used in financing activities (6,054) (1,845) (1,105)Net increase (decrease) in cash and cash equivalents (2,321) (3,903) (310)Effect of exchange rates (1,296) 810 1,504Cash and cash equivalents at the beginning of the period 30,092 33,185 27,526Cash and cash equivalents at the end of the period 26,475 30,092 28,720
(unaudited)
22
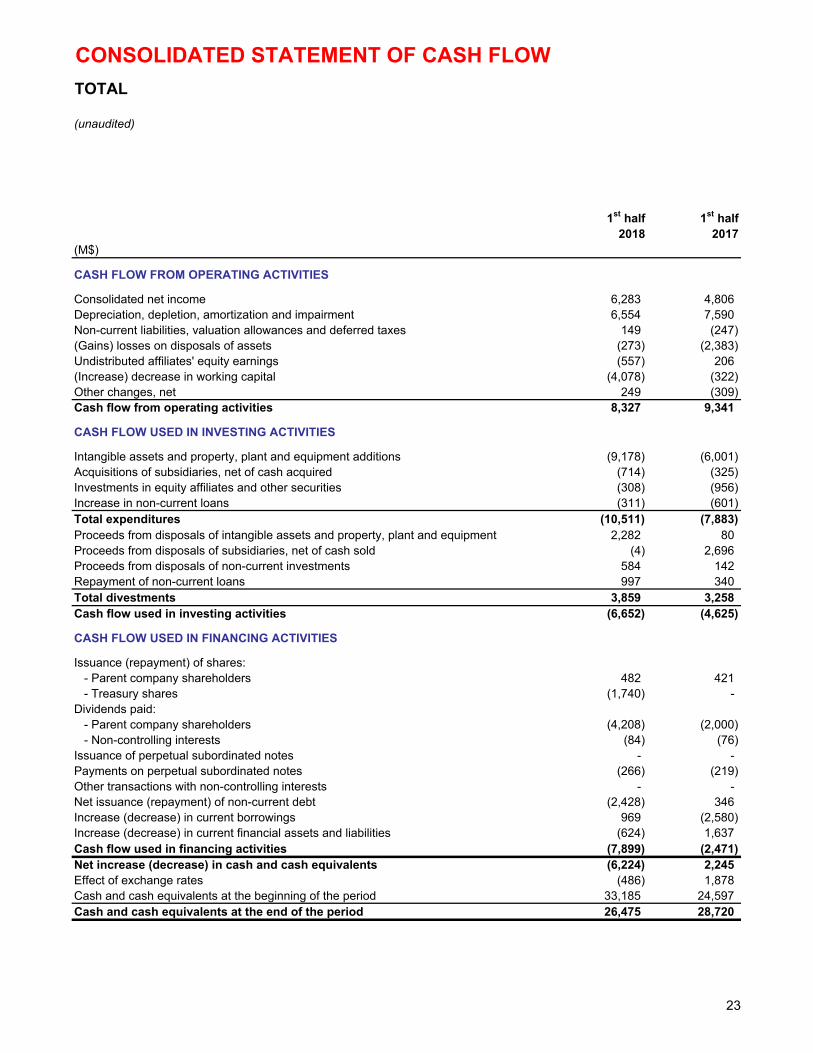
CONSOLIDATED STATEMENT OF CASH FLOW
TOTAL
(M$)
1st half2018
1st half2017
CASH FLOW FROM OPERATING ACTIVITIES
Consolidated net income 6,283 4,806Depreciation, depletion, amortization and impairment 6,554 7,590Non-current liabilities, valuation allowances and deferred taxes 149 (247)(Gains) losses on disposals of assets (273) (2,383)Undistributed affiliates' equity earnings (557) 206(Increase) decrease in working capital (4,078) (322)Other changes, net 249 (309)Cash flow from operating activities 8,327 9,341
CASH FLOW USED IN INVESTING ACTIVITIES
Intangible assets and property, plant and equipment additions (9,178) (6,001)Acquisitions of subsidiaries, net of cash acquired (714) (325)Investments in equity affiliates and other securities (308) (956)Increase in non-current loans (311) (601)Total expenditures (10,511) (7,883)Proceeds from disposals of intangible assets and property, plant and equipment 2,282 80Proceeds from disposals of subsidiaries, net of cash sold (4) 2,696Proceeds from disposals of non-current investments 584 142Repayment of non-current loans 997 340Total divestments 3,859 3,258Cash flow used in investing activities (6,652) (4,625)
CASH FLOW USED IN FINANCING ACTIVITIES
Issuance (repayment) of shares: - Parent company shareholders 482 421 - Treasury shares (1,740) -Dividends paid: - Parent company shareholders (4,208) (2,000) - Non-controlling interests (84) (76)Issuance of perpetual subordinated notes - -Payments on perpetual subordinated notes (266) (219)Other transactions with non-controlling interests - -Net issuance (repayment) of non-current debt (2,428) 346Increase (decrease) in current borrowings 969 (2,580)Increase (decrease) in current financial assets and liabilities (624) 1,637Cash flow used in financing activities (7,899) (2,471)Net increase (decrease) in cash and cash equivalents (6,224) 2,245Effect of exchange rates (486) 1,878Cash and cash equivalents at the beginning of the period 33,185 24,597Cash and cash equivalents at the end of the period 26,475 28,720
(unaudited)
23
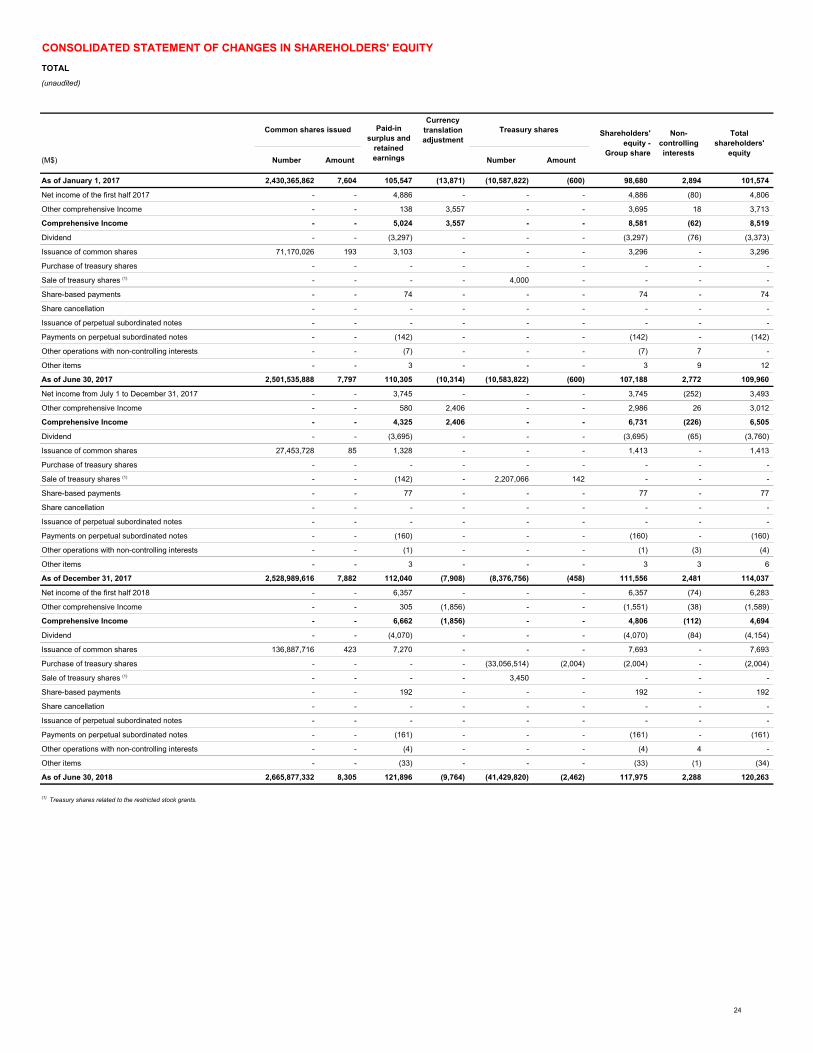
CONSOLIDATED STATEMENT OF CHANGES IN SHAREHOLDERS' EQUITY
TOTAL
(unaudited)
Currency translation adjustment
(M$) Number Amount Number Amount
As of January 1, 2017 2,430,365,862 7,604 105,547 (13,871) (10,587,822) (600) 98,680 2,894 101,574
Net income of the first half 2017 - - 4,886 - - - 4,886 (80) 4,806
Other comprehensive Income - - 138 3,557 - - 3,695 18 3,713
Comprehensive Income - - 5,024 3,557 - - 8,581 (62) 8,519
Dividend - - (3,297) - - - (3,297) (76) (3,373)
Issuance of common shares 71,170,026 193 3,103 - - - 3,296 - 3,296
Purchase of treasury shares - - - - - - - - -
Sale of treasury shares (1) - - - - 4,000 - - - -
Share-based payments - - 74 - - - 74 - 74
Share cancellation - - - - - - - - -
Issuance of perpetual subordinated notes - - - - - - - - -
Payments on perpetual subordinated notes - - (142) - - - (142) - (142)
Other operations with non-controlling interests - - (7) - - - (7) 7 -
Other items - - 3 - - - 3 9 12
As of June 30, 2017 2,501,535,888 7,797 110,305 (10,314) (10,583,822) (600) 107,188 2,772 109,960
Net income from July 1 to December 31, 2017 - - 3,745 - - - 3,745 (252) 3,493
Other comprehensive Income - - 580 2,406 - - 2,986 26 3,012
Comprehensive Income - - 4,325 2,406 - - 6,731 (226) 6,505
Dividend - - (3,695) - - - (3,695) (65) (3,760)
Issuance of common shares 27,453,728 85 1,328 - - - 1,413 - 1,413
Purchase of treasury shares - - - - - - - - -
Sale of treasury shares (1) - - (142) - 2,207,066 142 - - -
Share-based payments - - 77 - - - 77 - 77
Share cancellation - - - - - - - - -
Issuance of perpetual subordinated notes - - - - - - - - -
Payments on perpetual subordinated notes - - (160) - - - (160) - (160)
Other operations with non-controlling interests - - (1) - - - (1) (3) (4)
Other items - - 3 - - - 3 3 6
As of December 31, 2017 2,528,989,616 7,882 112,040 (7,908) (8,376,756) (458) 111,556 2,481 114,037
Net income of the first half 2018 - - 6,357 - - - 6,357 (74) 6,283
Other comprehensive Income - - 305 (1,856) - - (1,551) (38) (1,589)
Comprehensive Income - - 6,662 (1,856) - - 4,806 (112) 4,694
Dividend - - (4,070) - - - (4,070) (84) (4,154)
Issuance of common shares 136,887,716 423 7,270 - - - 7,693 - 7,693
Purchase of treasury shares - - - - (33,056,514) (2,004) (2,004) - (2,004)
Sale of treasury shares (1) - - - - 3,450 - - - -
Share-based payments - - 192 - - - 192 - 192
Share cancellation - - - - - - - - -
Issuance of perpetual subordinated notes - - - - - - - - -
Payments on perpetual subordinated notes - - (161) - - - (161) - (161)
Other operations with non-controlling interests - - (4) - - - (4) 4 -
Other items - - (33) - - - (33) (1) (34)
As of June 30, 2018 2,665,877,332 8,305 121,896 (9,764) (41,429,820) (2,462) 117,975 2,288 120,263
(1) Treasury shares related to the restricted stock grants.
Total shareholders'
equity
Shareholders' equity -
Group share
Common shares issued Treasury sharesPaid-in surplus and
retained earnings
Non-controlling interests
24
BUSINESS SEGMENT INFORMATIONTOTAL
(unaudited)
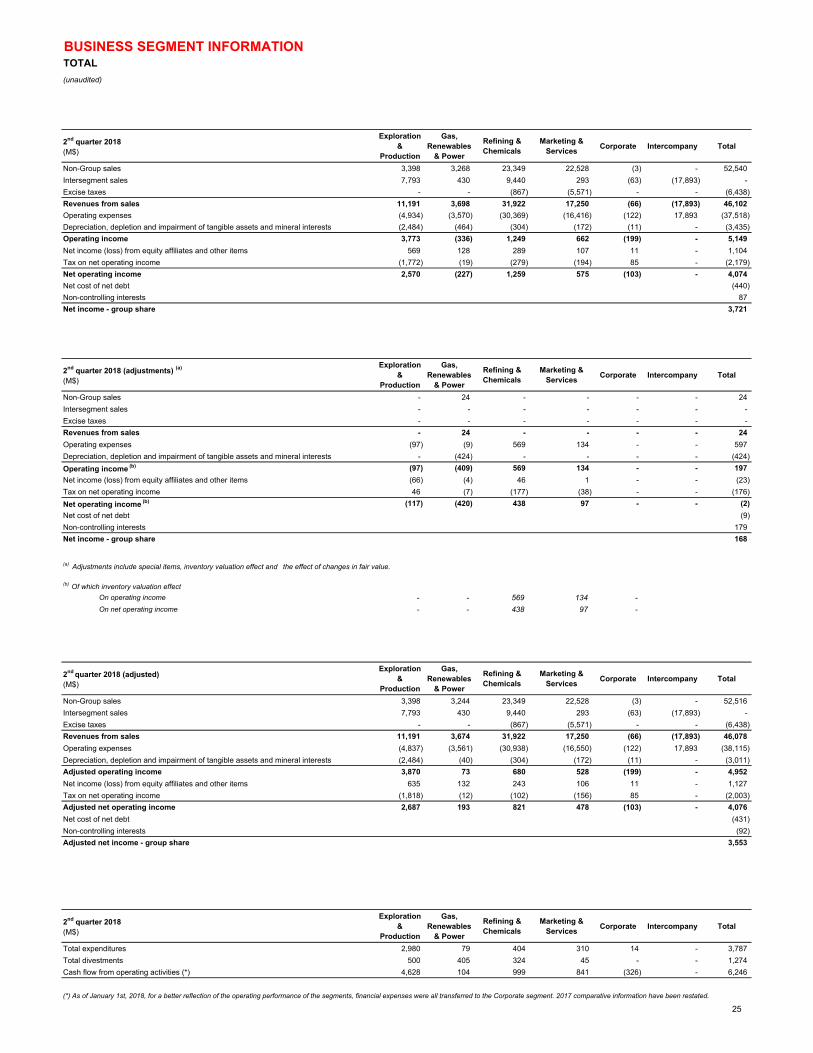
2nd quarter 2018(M$)
Exploration &
Production
Gas, Renewables
& Power
Refining & Chemicals
Marketing & Services
Corporate Intercompany Total
Non-Group sales 3,398 3,268 23,349 22,528 (3) - 52,540
Intersegment sales 7,793 430 9,440 293 (63) (17,893) -
Excise taxes - - (867) (5,571) - - (6,438)
Revenues from sales 11,191 3,698 31,922 17,250 (66) (17,893) 46,102
Operating expenses (4,934) (3,570) (30,369) (16,416) (122) 17,893 (37,518)
Depreciation, depletion and impairment of tangible assets and mineral interests (2,484) (464) (304) (172) (11) - (3,435)
Operating income 3,773 (336) 1,249 662 (199) - 5,149
Net income (loss) from equity affiliates and other items 569 128 289 107 11 - 1,104
Tax on net operating income (1,772) (19) (279) (194) 85 - (2,179)
Net operating income 2,570 (227) 1,259 575 (103) - 4,074
Net cost of net debt (440)
Non-controlling interests 87
Net income - group share 3,721
2nd quarter 2018 (adjustments) (a)
(M$)
Exploration &
Production
Gas, Renewables
& Power
Refining & Chemicals
Marketing & Services
Corporate Intercompany Total
Non-Group sales - 24 - - - - 24
Intersegment sales - - - - - - -
Excise taxes - - - - - - -
Revenues from sales - 24 - - - - 24
Operating expenses (97) (9) 569 134 - - 597
Depreciation, depletion and impairment of tangible assets and mineral interests - (424) - - - - (424)
Operating income (b) (97) (409) 569 134 - - 197
Net income (loss) from equity affiliates and other items (66) (4) 46 1 - - (23)
Tax on net operating income 46 (7) (177) (38) - - (176)
Net operating income (b) (117) (420) 438 97 - - (2)
Net cost of net debt (9)
Non-controlling interests 179
Net income - group share 168
On operating income - - 569 134 -
On net operating income - - 438 97 -
2nd quarter 2018 (adjusted)(M$)
Exploration &
Production
Gas, Renewables
& Power
Refining & Chemicals
Marketing & Services
Corporate Intercompany Total
Non-Group sales 3,398 3,244 23,349 22,528 (3) - 52,516
Intersegment sales 7,793 430 9,440 293 (63) (17,893) -
Excise taxes - - (867) (5,571) - - (6,438)
Revenues from sales 11,191 3,674 31,922 17,250 (66) (17,893) 46,078
Operating expenses (4,837) (3,561) (30,938) (16,550) (122) 17,893 (38,115)
Depreciation, depletion and impairment of tangible assets and mineral interests (2,484) (40) (304) (172) (11) - (3,011)
Adjusted operating income 3,870 73 680 528 (199) - 4,952
Net income (loss) from equity affiliates and other items 635 132 243 106 11 - 1,127
Tax on net operating income (1,818) (12) (102) (156) 85 - (2,003)
Adjusted net operating income 2,687 193 821 478 (103) - 4,076
Net cost of net debt (431)
Non-controlling interests (92)
Adjusted net income - group share 3,553
2nd quarter 2018(M$)
Exploration &
Production
Gas, Renewables
& Power
Refining & Chemicals
Marketing & Services
Corporate Intercompany Total
Total expenditures 2,980 79 404 310 14 - 3,787
Total divestments 500 405 324 45 - - 1,274
Cash flow from operating activities (*) 4,628 104 999 841 (326) - 6,246
(*) As of January 1st, 2018, for a better reflection of the operating performance of the segments, financial expenses were all transferred to the Corporate segment. 2017 comparative information have been restated.
(a) Adjustments include special items, inventory valuation effect and the effect of changes in fair value.
(b) Of which inventory valuation effect
25
BUSINESS SEGMENT INFORMATIONTOTAL
(unaudited)
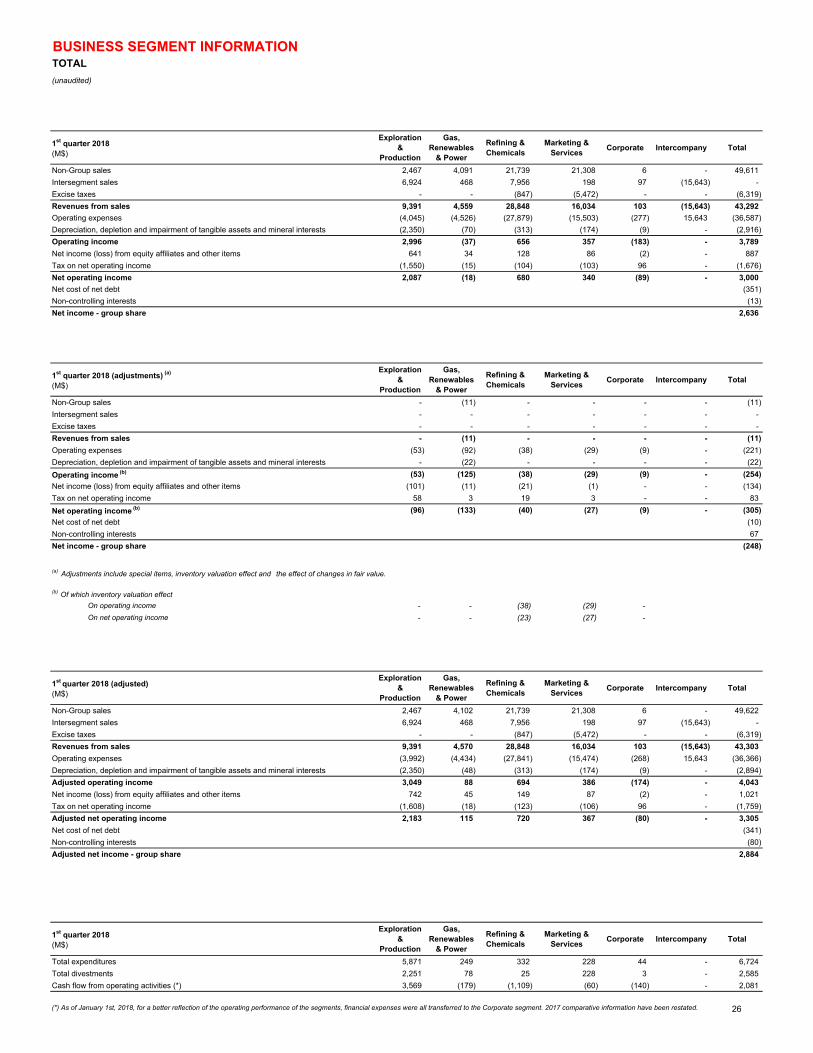
1st quarter 2018(M$)
Exploration &
Production
Gas, Renewables
& Power
Refining & Chemicals
Marketing & Services
Corporate Intercompany Total
Non-Group sales 2,467 4,091 21,739 21,308 6 - 49,611
Intersegment sales 6,924 468 7,956 198 97 (15,643) -
Excise taxes - - (847) (5,472) - - (6,319)
Revenues from sales 9,391 4,559 28,848 16,034 103 (15,643) 43,292
Operating expenses (4,045) (4,526) (27,879) (15,503) (277) 15,643 (36,587)
Depreciation, depletion and impairment of tangible assets and mineral interests (2,350) (70) (313) (174) (9) - (2,916)
Operating income 2,996 (37) 656 357 (183) - 3,789
Net income (loss) from equity affiliates and other items 641 34 128 86 (2) - 887
Tax on net operating income (1,550) (15) (104) (103) 96 - (1,676)
Net operating income 2,087 (18) 680 340 (89) - 3,000
Net cost of net debt (351)
Non-controlling interests (13)
Net income - group share 2,636
1st quarter 2018 (adjustments) (a)
(M$)
Exploration &
Production
Gas, Renewables
& Power
Refining & Chemicals
Marketing & Services
Corporate Intercompany Total
Non-Group sales - (11) - - - - (11)
Intersegment sales - - - - - - -
Excise taxes - - - - - - -
Revenues from sales - (11) - - - - (11)
Operating expenses (53) (92) (38) (29) (9) - (221)
Depreciation, depletion and impairment of tangible assets and mineral interests - (22) - - - - (22)
Operating income (b) (53) (125) (38) (29) (9) - (254)
Net income (loss) from equity affiliates and other items (101) (11) (21) (1) - - (134)
Tax on net operating income 58 3 19 3 - - 83
Net operating income (b) (96) (133) (40) (27) (9) - (305)
Net cost of net debt (10)
Non-controlling interests 67
Net income - group share (248)
On operating income - - (38) (29) -
On net operating income - - (23) (27) -
1st quarter 2018 (adjusted)(M$)
Exploration &
Production
Gas, Renewables
& Power
Refining & Chemicals
Marketing & Services
Corporate Intercompany Total
Non-Group sales 2,467 4,102 21,739 21,308 6 - 49,622
Intersegment sales 6,924 468 7,956 198 97 (15,643) -
Excise taxes - - (847) (5,472) - - (6,319)
Revenues from sales 9,391 4,570 28,848 16,034 103 (15,643) 43,303
Operating expenses (3,992) (4,434) (27,841) (15,474) (268) 15,643 (36,366)
Depreciation, depletion and impairment of tangible assets and mineral interests (2,350) (48) (313) (174) (9) - (2,894)
Adjusted operating income 3,049 88 694 386 (174) - 4,043
Net income (loss) from equity affiliates and other items 742 45 149 87 (2) - 1,021
Tax on net operating income (1,608) (18) (123) (106) 96 - (1,759)
Adjusted net operating income 2,183 115 720 367 (80) - 3,305
Net cost of net debt (341)
Non-controlling interests (80)
Adjusted net income - group share 2,884
1st quarter 2018(M$)
Exploration &
Production
Gas, Renewables
& Power
Refining & Chemicals
Marketing & Services
Corporate Intercompany Total
Total expenditures 5,871 249 332 228 44 - 6,724
Total divestments 2,251 78 25 228 3 - 2,585
Cash flow from operating activities (*) 3,569 (179) (1,109) (60) (140) - 2,081
(*) As of January 1st, 2018, for a better reflection of the operating performance of the segments, financial expenses were all transferred to the Corporate segment. 2017 comparative information have been restated.
(a) Adjustments include special items, inventory valuation effect and the effect of changes in fair value.
(b) Of which inventory valuation effect
26
BUSINESS SEGMENT INFORMATIONTOTAL
(unaudited)
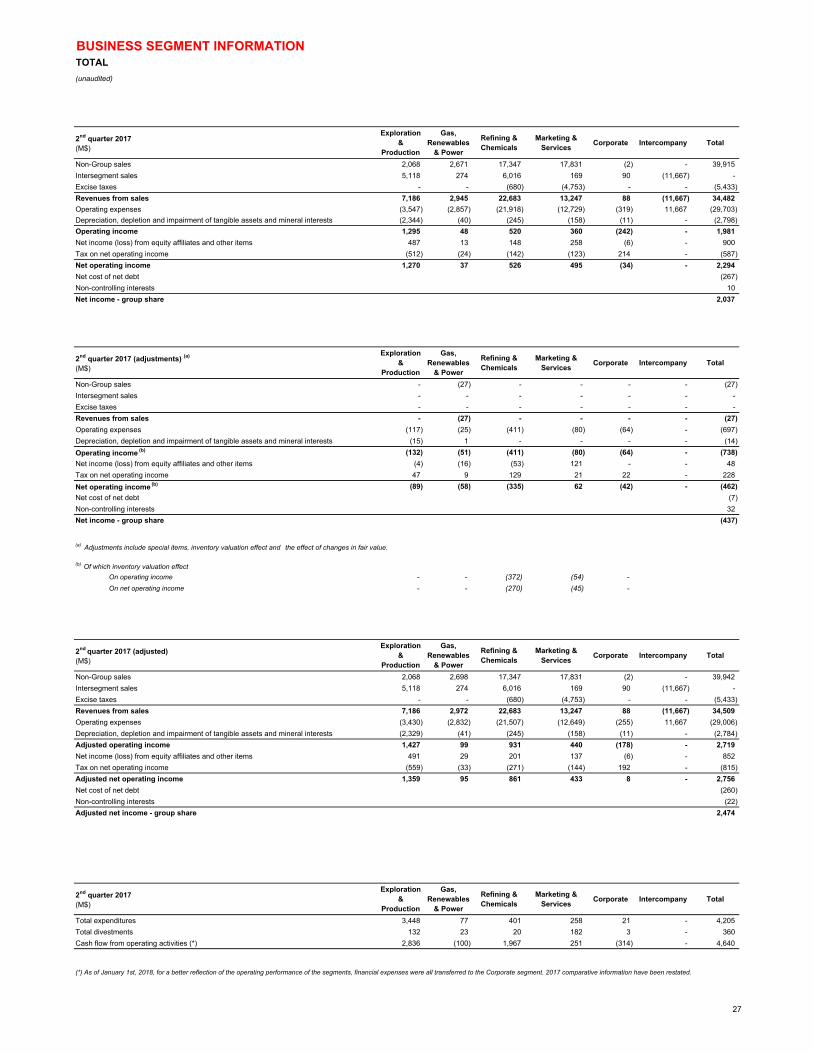
2nd quarter 2017(M$)
Exploration &
Production
Gas, Renewables
& Power
Refining & Chemicals
Marketing & Services
Corporate Intercompany Total
Non-Group sales 2,068 2,671 17,347 17,831 (2) - 39,915
Intersegment sales 5,118 274 6,016 169 90 (11,667) -
Excise taxes - - (680) (4,753) - - (5,433)
Revenues from sales 7,186 2,945 22,683 13,247 88 (11,667) 34,482
Operating expenses (3,547) (2,857) (21,918) (12,729) (319) 11,667 (29,703)
Depreciation, depletion and impairment of tangible assets and mineral interests (2,344) (40) (245) (158) (11) - (2,798)
Operating income 1,295 48 520 360 (242) - 1,981
Net income (loss) from equity affiliates and other items 487 13 148 258 (6) - 900
Tax on net operating income (512) (24) (142) (123) 214 - (587)
Net operating income 1,270 37 526 495 (34) - 2,294
Net cost of net debt (267)
Non-controlling interests 10
Net income - group share 2,037
2nd quarter 2017 (adjustments) (a)
(M$)
Exploration &
Production
Gas, Renewables
& Power
Refining & Chemicals
Marketing & Services
Corporate Intercompany Total
Non-Group sales - (27) - - - - (27)
Intersegment sales - - - - - - -
Excise taxes - - - - - - -
Revenues from sales - (27) - - - - (27)
Operating expenses (117) (25) (411) (80) (64) - (697)
Depreciation, depletion and impairment of tangible assets and mineral interests (15) 1 - - - - (14)
Operating income (b) (132) (51) (411) (80) (64) - (738)
Net income (loss) from equity affiliates and other items (4) (16) (53) 121 - - 48
Tax on net operating income 47 9 129 21 22 - 228
Net operating income (b) (89) (58) (335) 62 (42) - (462)
Net cost of net debt (7)
Non-controlling interests 32
Net income - group share (437)
On operating income - - (372) (54) -
On net operating income - - (270) (45) -
2nd quarter 2017 (adjusted)(M$)
Exploration &
Production
Gas, Renewables
& Power
Refining & Chemicals
Marketing & Services
Corporate Intercompany Total
Non-Group sales 2,068 2,698 17,347 17,831 (2) - 39,942
Intersegment sales 5,118 274 6,016 169 90 (11,667) -
Excise taxes - - (680) (4,753) - - (5,433)
Revenues from sales 7,186 2,972 22,683 13,247 88 (11,667) 34,509
Operating expenses (3,430) (2,832) (21,507) (12,649) (255) 11,667 (29,006)
Depreciation, depletion and impairment of tangible assets and mineral interests (2,329) (41) (245) (158) (11) - (2,784)
Adjusted operating income 1,427 99 931 440 (178) - 2,719
Net income (loss) from equity affiliates and other items 491 29 201 137 (6) - 852
Tax on net operating income (559) (33) (271) (144) 192 - (815)
Adjusted net operating income 1,359 95 861 433 8 - 2,756
Net cost of net debt (260)
Non-controlling interests (22)
Adjusted net income - group share 2,474
2nd quarter 2017(M$)
Exploration &
Production
Gas, Renewables
& Power
Refining & Chemicals
Marketing & Services
Corporate Intercompany Total
Total expenditures 3,448 77 401 258 21 - 4,205
Total divestments 132 23 20 182 3 - 360
Cash flow from operating activities (*) 2,836 (100) 1,967 251 (314) - 4,640
(*) As of January 1st, 2018, for a better reflection of the operating performance of the segments, financial expenses were all transferred to the Corporate segment. 2017 comparative information have been restated.
(a) Adjustments include special items, inventory valuation effect and the effect of changes in fair value.
(b) Of which inventory valuation effect
27
BUSINESS SEGMENT INFORMATIONTOTAL
(unaudited)
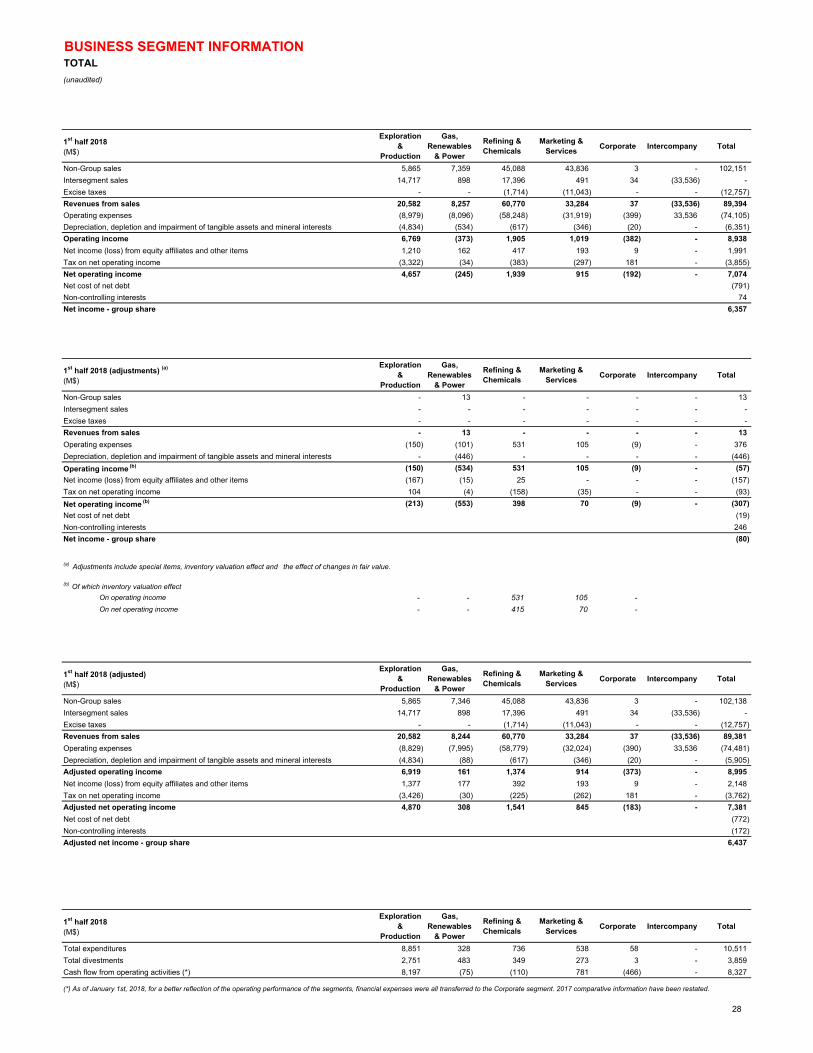
1st half 2018(M$)
Exploration &
Production
Gas, Renewables
& Power
Refining & Chemicals
Marketing & Services
Corporate Intercompany Total
Non-Group sales 5,865 7,359 45,088 43,836 3 - 102,151
Intersegment sales 14,717 898 17,396 491 34 (33,536) -
Excise taxes - - (1,714) (11,043) - - (12,757)
Revenues from sales 20,582 8,257 60,770 33,284 37 (33,536) 89,394
Operating expenses (8,979) (8,096) (58,248) (31,919) (399) 33,536 (74,105)
Depreciation, depletion and impairment of tangible assets and mineral interests (4,834) (534) (617) (346) (20) - (6,351)
Operating income 6,769 (373) 1,905 1,019 (382) - 8,938
Net income (loss) from equity affiliates and other items 1,210 162 417 193 9 - 1,991
Tax on net operating income (3,322) (34) (383) (297) 181 - (3,855)
Net operating income 4,657 (245) 1,939 915 (192) - 7,074
Net cost of net debt (791)
Non-controlling interests 74
Net income - group share 6,357
1st half 2018 (adjustments) (a)
(M$)
Exploration &
Production
Gas, Renewables
& Power
Refining & Chemicals
Marketing & Services
Corporate Intercompany Total
Non-Group sales - 13 - - - - 13
Intersegment sales - - - - - - -
Excise taxes - - - - - - -
Revenues from sales - 13 - - - - 13
Operating expenses (150) (101) 531 105 (9) - 376
Depreciation, depletion and impairment of tangible assets and mineral interests - (446) - - - - (446)
Operating income (b) (150) (534) 531 105 (9) - (57)
Net income (loss) from equity affiliates and other items (167) (15) 25 - - - (157)
Tax on net operating income 104 (4) (158) (35) - - (93)
Net operating income (b) (213) (553) 398 70 (9) - (307)
Net cost of net debt (19)
Non-controlling interests 246
Net income - group share (80)
On operating income - - 531 105 -
On net operating income - - 415 70 -
1st half 2018 (adjusted)(M$)
Exploration &
Production
Gas, Renewables
& Power
Refining & Chemicals
Marketing & Services
Corporate Intercompany Total
Non-Group sales 5,865 7,346 45,088 43,836 3 - 102,138
Intersegment sales 14,717 898 17,396 491 34 (33,536) -
Excise taxes - - (1,714) (11,043) - - (12,757)
Revenues from sales 20,582 8,244 60,770 33,284 37 (33,536) 89,381
Operating expenses (8,829) (7,995) (58,779) (32,024) (390) 33,536 (74,481)
Depreciation, depletion and impairment of tangible assets and mineral interests (4,834) (88) (617) (346) (20) - (5,905)
Adjusted operating income 6,919 161 1,374 914 (373) - 8,995
Net income (loss) from equity affiliates and other items 1,377 177 392 193 9 - 2,148
Tax on net operating income (3,426) (30) (225) (262) 181 - (3,762)
Adjusted net operating income 4,870 308 1,541 845 (183) - 7,381
Net cost of net debt (772)
Non-controlling interests (172)
Adjusted net income - group share 6,437
1st half 2018(M$)
Exploration &
Production
Gas, Renewables
& Power
Refining & Chemicals
Marketing & Services
Corporate Intercompany Total
Total expenditures 8,851 328 736 538 58 - 10,511
Total divestments 2,751 483 349 273 3 - 3,859
Cash flow from operating activities (*) 8,197 (75) (110) 781 (466) - 8,327
(*) As of January 1st, 2018, for a better reflection of the operating performance of the segments, financial expenses were all transferred to the Corporate segment. 2017 comparative information have been restated.
(a) Adjustments include special items, inventory valuation effect and the effect of changes in fair value.
(b) Of which inventory valuation effect
28
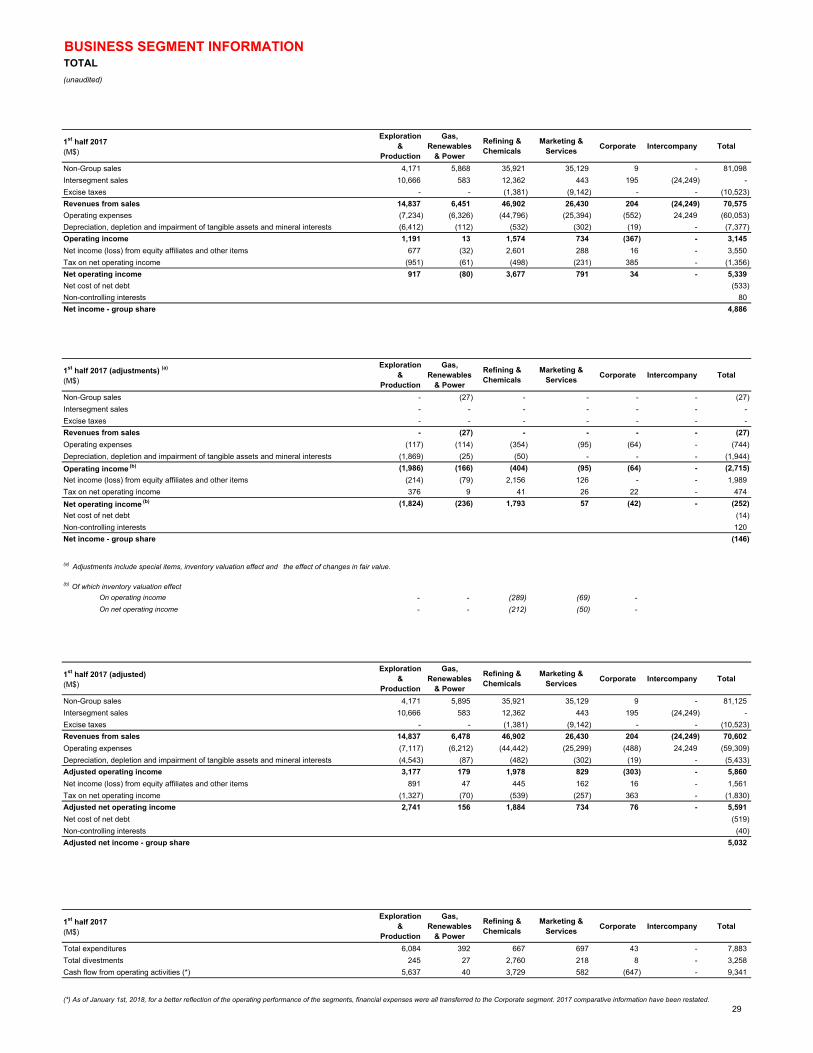
BUSINESS SEGMENT INFORMATIONTOTAL
(unaudited)
1st half 2017(M$)
Exploration &
Production
Gas, Renewables
& Power
Refining & Chemicals
Marketing & Services
Corporate Intercompany Total
Non-Group sales 4,171 5,868 35,921 35,129 9 - 81,098
Intersegment sales 10,666 583 12,362 443 195 (24,249) -
Excise taxes - - (1,381) (9,142) - - (10,523)
Revenues from sales 14,837 6,451 46,902 26,430 204 (24,249) 70,575
Operating expenses (7,234) (6,326) (44,796) (25,394) (552) 24,249 (60,053)
Depreciation, depletion and impairment of tangible assets and mineral interests (6,412) (112) (532) (302) (19) - (7,377)
Operating income 1,191 13 1,574 734 (367) - 3,145
Net income (loss) from equity affiliates and other items 677 (32) 2,601 288 16 - 3,550
Tax on net operating income (951) (61) (498) (231) 385 - (1,356)
Net operating income 917 (80) 3,677 791 34 - 5,339
Net cost of net debt (533)
Non-controlling interests 80
Net income - group share 4,886
1st half 2017 (adjustments) (a)
(M$)
Exploration &
Production
Gas, Renewables
& Power
Refining & Chemicals
Marketing & Services
Corporate Intercompany Total
Non-Group sales - (27) - - - - (27)
Intersegment sales - - - - - - -
Excise taxes - - - - - - -
Revenues from sales - (27) - - - - (27)
Operating expenses (117) (114) (354) (95) (64) - (744)
Depreciation, depletion and impairment of tangible assets and mineral interests (1,869) (25) (50) - - - (1,944)
Operating income (b) (1,986) (166) (404) (95) (64) - (2,715)
Net income (loss) from equity affiliates and other items (214) (79) 2,156 126 - - 1,989
Tax on net operating income 376 9 41 26 22 - 474
Net operating income (b) (1,824) (236) 1,793 57 (42) - (252)
Net cost of net debt (14)
Non-controlling interests 120
Net income - group share (146)
On operating income - - (289) (69) -
On net operating income - - (212) (50) -
1st half 2017 (adjusted)(M$)
Exploration &
Production
Gas, Renewables
& Power
Refining & Chemicals
Marketing & Services
Corporate Intercompany Total
Non-Group sales 4,171 5,895 35,921 35,129 9 - 81,125
Intersegment sales 10,666 583 12,362 443 195 (24,249) -
Excise taxes - - (1,381) (9,142) - - (10,523)
Revenues from sales 14,837 6,478 46,902 26,430 204 (24,249) 70,602
Operating expenses (7,117) (6,212) (44,442) (25,299) (488) 24,249 (59,309)
Depreciation, depletion and impairment of tangible assets and mineral interests (4,543) (87) (482) (302) (19) - (5,433)
Adjusted operating income 3,177 179 1,978 829 (303) - 5,860
Net income (loss) from equity affiliates and other items 891 47 445 162 16 - 1,561
Tax on net operating income (1,327) (70) (539) (257) 363 - (1,830)
Adjusted net operating income 2,741 156 1,884 734 76 - 5,591
Net cost of net debt (519)
Non-controlling interests (40)
Adjusted net income - group share 5,032
1st half 2017(M$)
Exploration &
Production
Gas, Renewables
& Power
Refining & Chemicals
Marketing & Services
Corporate Intercompany Total
Total expenditures 6,084 392 667 697 43 - 7,883
Total divestments 245 27 2,760 218 8 - 3,258
Cash flow from operating activities (*) 5,637 40 3,729 582 (647) - 9,341
(*) As of January 1st, 2018, for a better reflection of the operating performance of the segments, financial expenses were all transferred to the Corporate segment. 2017 comparative information have been restated.
(a) Adjustments include special items, inventory valuation effect and the effect of changes in fair value.
(b) Of which inventory valuation effect
* Reclassification of intercompany transactions between Upstream and Corporate for €823 million with no impact on the total of cash flow from operating activities
29
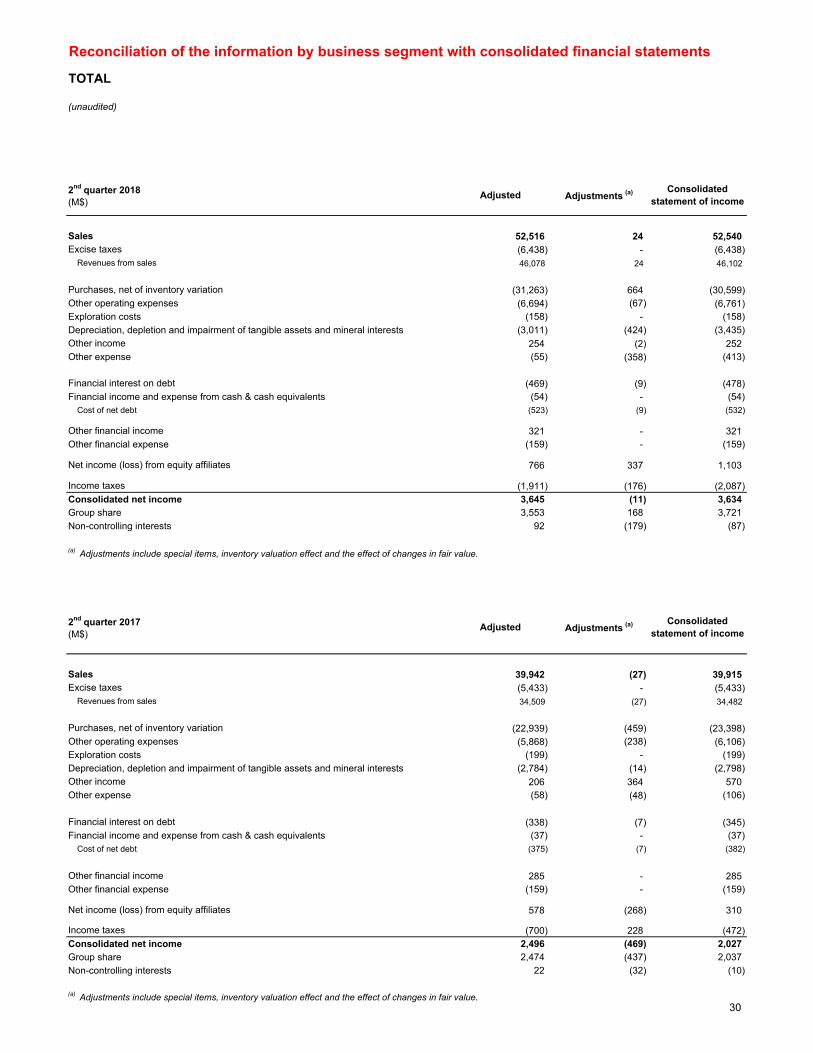
Reconciliation of the information by business segment with consolidated financial statements
TOTAL
2nd quarter 2018(M$)
Adjusted Adjustments (a) Consolidated statement of income
Sales 52,516 24 52,540Excise taxes (6,438) - (6,438)
Revenues from sales 46,078 24 46,102
Purchases, net of inventory variation (31,263) 664 (30,599)Other operating expenses (6,694) (67) (6,761)Exploration costs (158) - (158)
Depreciation, depletion and impairment of tangible assets and mineral interests (3,011) (424) (3,435)Other income 254 (2) 252Other expense (55) (358) (413)
Financial interest on debt (469) (9) (478)Financial income and expense from cash & cash equivalents (54) - (54)
Cost of net debt (523) (9) (532)
Other financial income 321 - 321Other financial expense (159) - (159)
Net income (loss) from equity affiliates 766 337 1,103
Income taxes (1,911) (176) (2,087)Consolidated net income 3,645 (11) 3,634Group share 3,553 168 3,721
Non-controlling interests 92 (179) (87)
(a) Adjustments include special items, inventory valuation effect and the effect of changes in fair value.
2nd quarter 2017(M$)
Adjusted Adjustments (a) Consolidated statement of income
Sales 39,942 (27) 39,915Excise taxes (5,433) - (5,433)
Revenues from sales 34,509 (27) 34,482
Purchases, net of inventory variation (22,939) (459) (23,398)Other operating expenses (5,868) (238) (6,106)Exploration costs (199) - (199)
Depreciation, depletion and impairment of tangible assets and mineral interests (2,784) (14) (2,798)Other income 206 364 570Other expense (58) (48) (106)
Financial interest on debt (338) (7) (345)Financial income and expense from cash & cash equivalents (37) - (37)
Cost of net debt (375) (7) (382)
Other financial income 285 - 285Other financial expense (159) - (159)
Net income (loss) from equity affiliates 578 (268) 310
Income taxes (700) 228 (472)Consolidated net income 2,496 (469) 2,027Group share 2,474 (437) 2,037
Non-controlling interests 22 (32) (10)
(a) Adjustments include special items, inventory valuation effect and the effect of changes in fair value.
(unaudited)
30
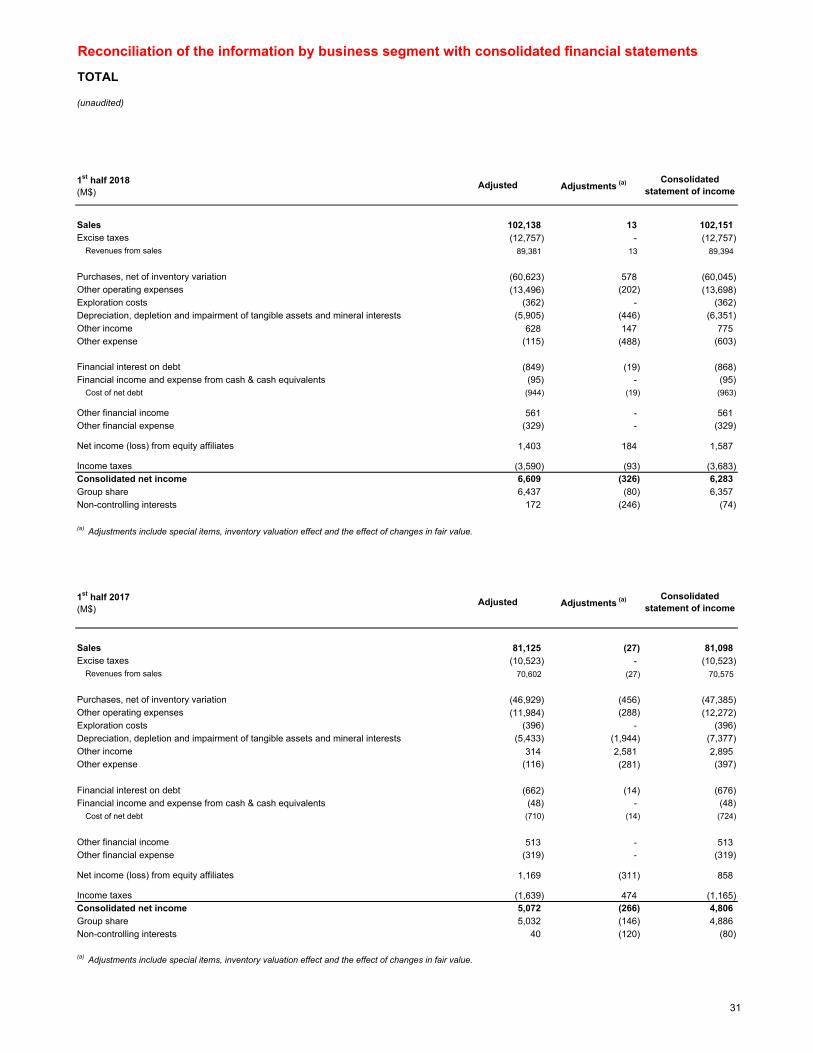
Reconciliation of the information by business segment with consolidated financial statements
TOTAL
(unaudited)
1st half 2018(M$)
Adjusted Adjustments (a) Consolidated statement of income
Sales 102,138 13 102,151Excise taxes (12,757) - (12,757)
Revenues from sales 89,381 13 89,394
Purchases, net of inventory variation (60,623) 578 (60,045)Other operating expenses (13,496) (202) (13,698)Exploration costs (362) - (362)
Depreciation, depletion and impairment of tangible assets and mineral interests (5,905) (446) (6,351)
Other income 628 147 775Other expense (115) (488) (603)
Financial interest on debt (849) (19) (868)Financial income and expense from cash & cash equivalents (95) - (95)
Cost of net debt (944) (19) (963)
Other financial income 561 - 561Other financial expense (329) - (329)
Net income (loss) from equity affiliates 1,403 184 1,587
Income taxes (3,590) (93) (3,683)Consolidated net income 6,609 (326) 6,283
Group share 6,437 (80) 6,357
Non-controlling interests 172 (246) (74)
(a) Adjustments include special items, inventory valuation effect and the effect of changes in fair value.
1st half 2017(M$)
Adjusted Adjustments (a) Consolidated statement of income
Sales 81,125 (27) 81,098Excise taxes (10,523) - (10,523)
Revenues from sales 70,602 (27) 70,575
Purchases, net of inventory variation (46,929) (456) (47,385)Other operating expenses (11,984) (288) (12,272)Exploration costs (396) - (396)
Depreciation, depletion and impairment of tangible assets and mineral interests (5,433) (1,944) (7,377)
Other income 314 2,581 2,895Other expense (116) (281) (397)
Financial interest on debt (662) (14) (676)Financial income and expense from cash & cash equivalents (48) - (48)
Cost of net debt (710) (14) (724)
Other financial income 513 - 513Other financial expense (319) - (319)
Net income (loss) from equity affiliates 1,169 (311) 858
Income taxes (1,639) 474 (1,165)Consolidated net income 5,072 (266) 4,806
Group share 5,032 (146) 4,886
Non-controlling interests 40 (120) (80)
(a) Adjustments include special items, inventory valuation effect and the effect of changes in fair value.
31