Embed Size (px)
Citation preview
Results for the first quarter 2003
April 2003
Contacts Paulo Roberto Cruz Cozza
Chief Financial Officer and Director of Investor Relations
Joana Dark Fonseca Serafim Investor Relations 55 (41) 9968-3685 / 312-6862 [email protected]
Rafael J. Caron Bósio Investor Relations 55 (41) 9976-0668 / 312-6862 [email protected]
Website http://tsu.infoinvest.com.br/
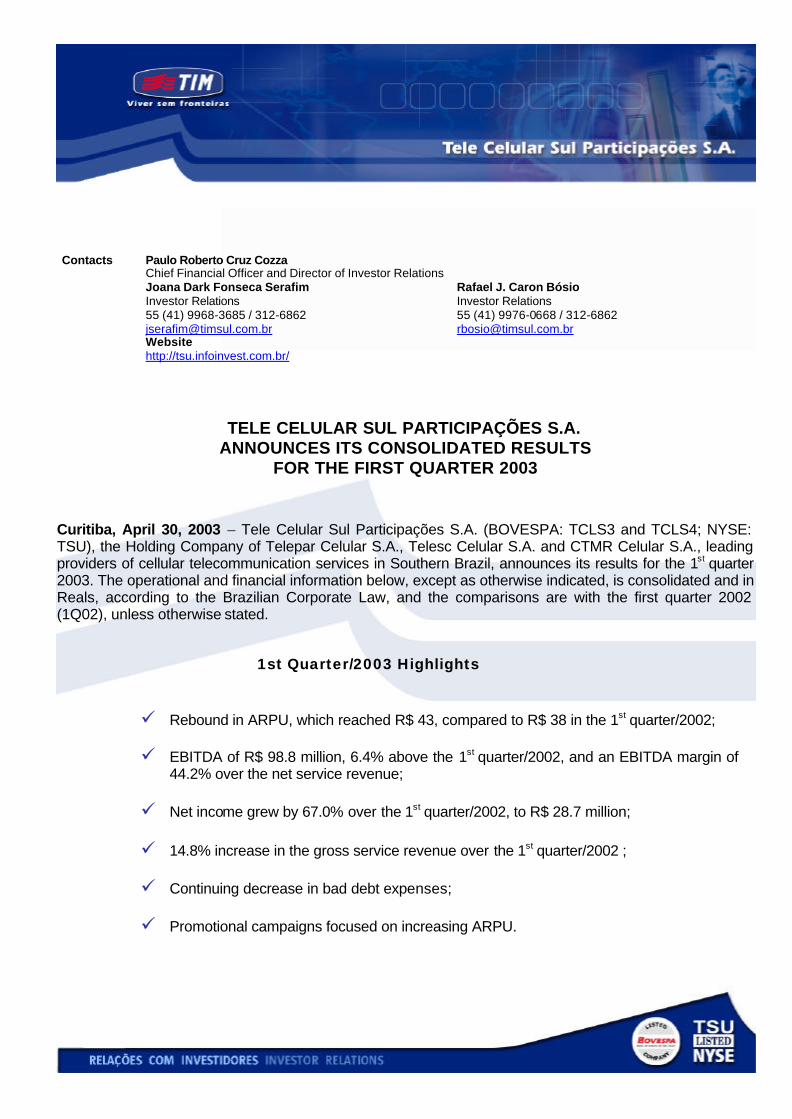
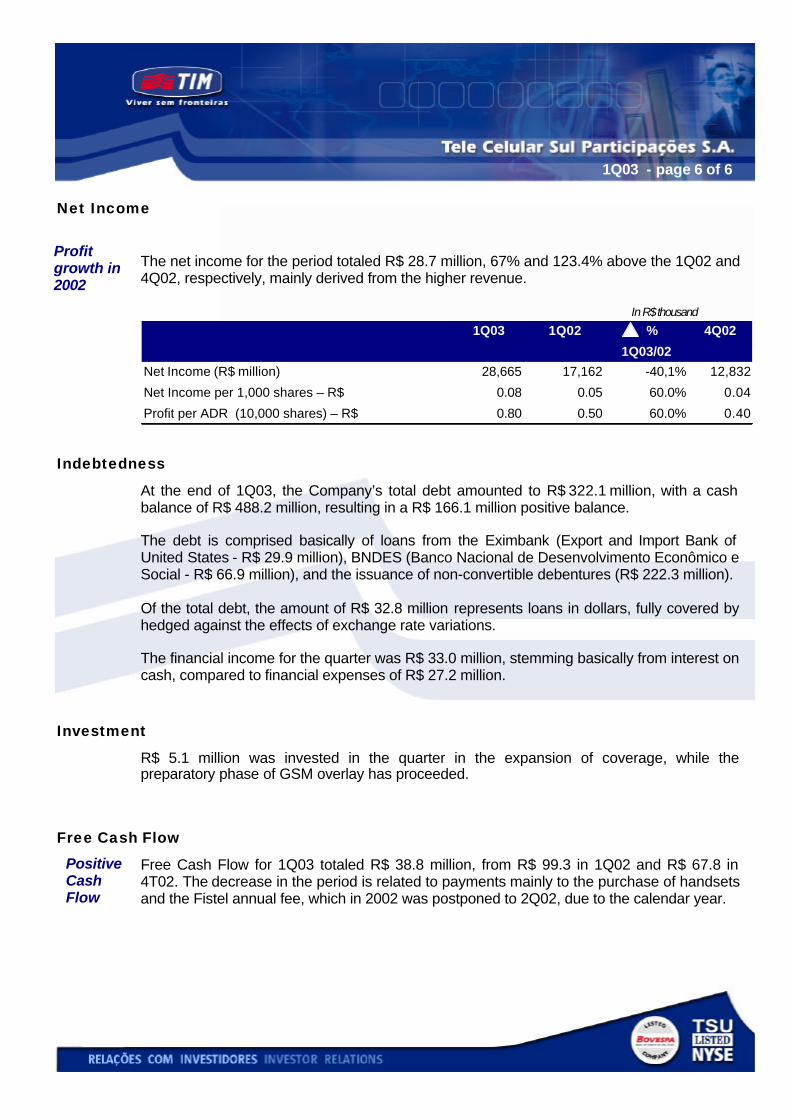
TELE CELULAR SUL PARTICIPAÇÕES S.A. ANNOUNCES ITS CONSOLIDATED RESULTS
FOR THE FIRST QUARTER 2003
Curitiba, April 30, 2003 – Tele Celular Sul Participações S.A. (BOVESPA: TCLS3 and TCLS4; NYSE: TSU), the Holding Company of Telepar Celular S.A., Telesc Celular S.A. and CTMR Celular S.A., leading providers of cellular telecommunication services in Southern Brazil, announces its results for the 1st quarter 2003. The operational and financial information below, except as otherwise indicated, is consolidated and in Reals, according to the Brazilian Corporate Law, and the comparisons are with the first quarter 2002 (1Q02), unless otherwise stated.
1st Quarter/2003 Highlights
ü Rebound in ARPU, which reached R$ 43, compared to R$ 38 in the 1st quarter/2002; ü EBITDA of R$ 98.8 million, 6.4% above the 1st quarter/2002, and an EBITDA margin of
44.2% over the net service revenue; ü Net income grew by 67.0% over the 1st quarter/2002, to R$ 28.7 million; ü 14.8% increase in the gross service revenue over the 1st quarter/2002 ;
ü Continuing decrease in bad debt expenses; ü Promotional campaigns focused on increasing ARPU.
1Q03 - page 2 of 2
Highlights In R$ thousand
Market The Company closed the quarter with 1,752,938 subscribers, of which 506,375 are postpaid service users and 1,246,563 are prepaid service users, representing 29% and 71%, respectively. As for gross additions, 123,835 new customers were acquired during 1Q03, 37% more than in 1Q02. Tele Celular Sul’s estimated market share of gross additions in the period was 53%. At period end, the market share was estimated at 60% and the total penetration rate at 20%. The Company covers 250 municipalities, an 8% increase over the 1Q02, making the services available to 81% of the total population of its region.
Var. %1Q03/02
Gross Handset Revenue 28,638 21,028 36.2% 70,996Gross Service Revenue 288,818 251,553 14.8% 248,053Total Gross Revenue 317,456 272,581 16.5% 319,049
Total Net Revenue 246,623 207,774 18.7% 251,921
EBITDA 1 98,777 92,836 6.4% 81,63
EBITDA Margin 40.1% 44.7% -4.6 p.p. 32.4%EBITDA Margin (w/o handset sales) 44.2% 48.6% -4.4 p.p. 42.1%
Net Income 28,665 17,162 67.0% 17,343Net Income per 1,000 shares – R$ 0.08 0.05 60.0% 0.05Profit per ADR (10,000 shares) – R$ 0.80 0.50 60.0% 0.51
Free Cash Flow 38,769 39,156 -1.0% 67,848(1) operating income before net financial expenses, taxes, excluding depreciation and amortization
1Q03 1Q02 4Q02
1Q03 - page 3 of 3
Operating Revenue
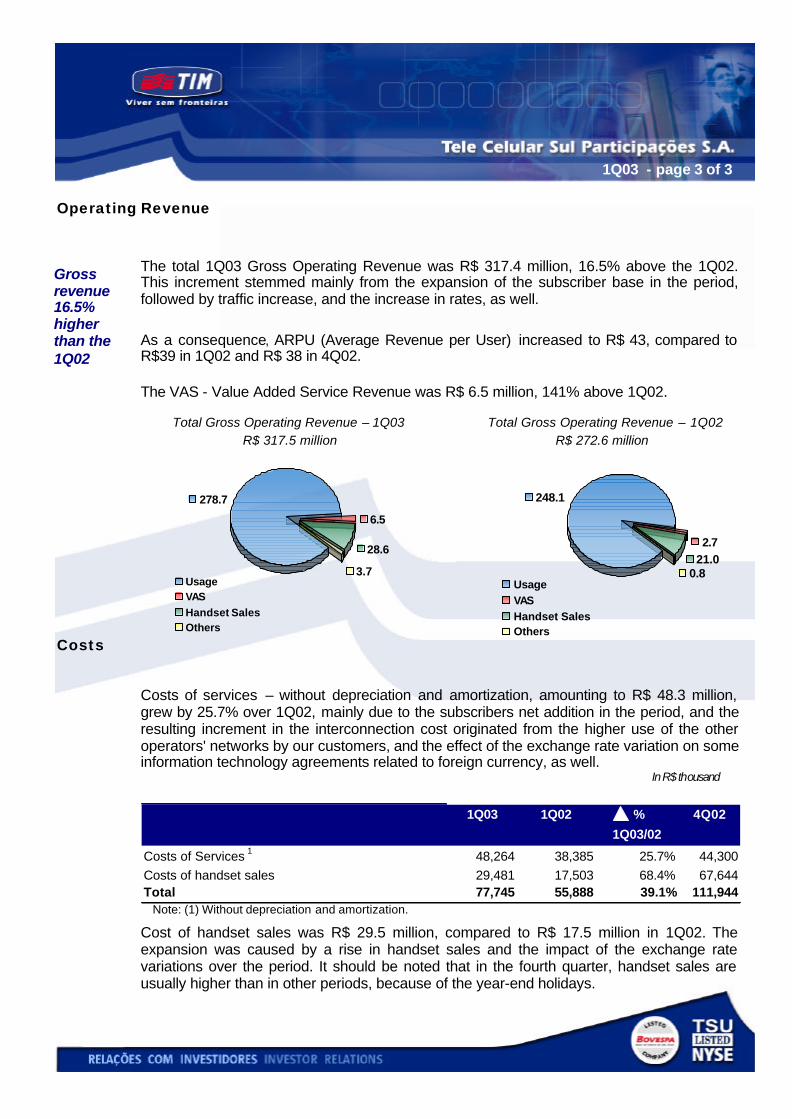
The total 1Q03 Gross Operating Revenue was R$ 317.4 million, 16.5% above the 1Q02. This increment stemmed mainly from the expansion of the subscriber base in the period, followed by traffic increase, and the increase in rates, as well.
As a consequence, ARPU (Average Revenue per User) increased to R$ 43, compared to R$39 in 1Q02 and R$ 38 in 4Q02. The VAS - Value Added Service Revenue was R$ 6.5 million, 141% above 1Q02.
Total Gross Operating Revenue – 1Q03 Total Gross Operating Revenue – 1Q02 R$ 317.5 million R$ 272.6 million
Costs
Costs of services – without depreciation and amortization, amounting to R$ 48.3 million, grew by 25.7% over 1Q02, mainly due to the subscribers net addition in the period, and the resulting increment in the interconnection cost originated from the higher use of the other operators' networks by our customers, and the effect of the exchange rate variation on some information technology agreements related to foreign currency, as well.
In R$ thousand
Note: (1) Without depreciation and amortization.
Cost of handset sales was R$ 29.5 million, compared to R$ 17.5 million in 1Q02. The expansion was caused by a rise in handset sales and the impact of the exchange rate variations over the period. It should be noted that in the fourth quarter, handset sales are usually higher than in other periods, because of the year-end holidays.
0.821.02.7
248.1
UsageVASHandset SalesOthers
3.7
28.6
6.5
278.7
UsageVASHandset SalesOthers
%
1Q03/02
Costs of Services 1 48,264 38,385 25.7% 44,300Costs of handset sales 29,481 17,503 68.4% 67,644Total 77,745 55,888 39.1% 111,944
1Q03 1Q02 4Q02
Gross revenue 16.5% higher than the 1Q02
1Q03 - page 4 of 4
Selling, General and Administrative Expenses
Selling expenses for the year - R$ 40.3 million, were 15.5% above 1Q02, mainly resulting from the higher sales volume for the period. In R$ thousand
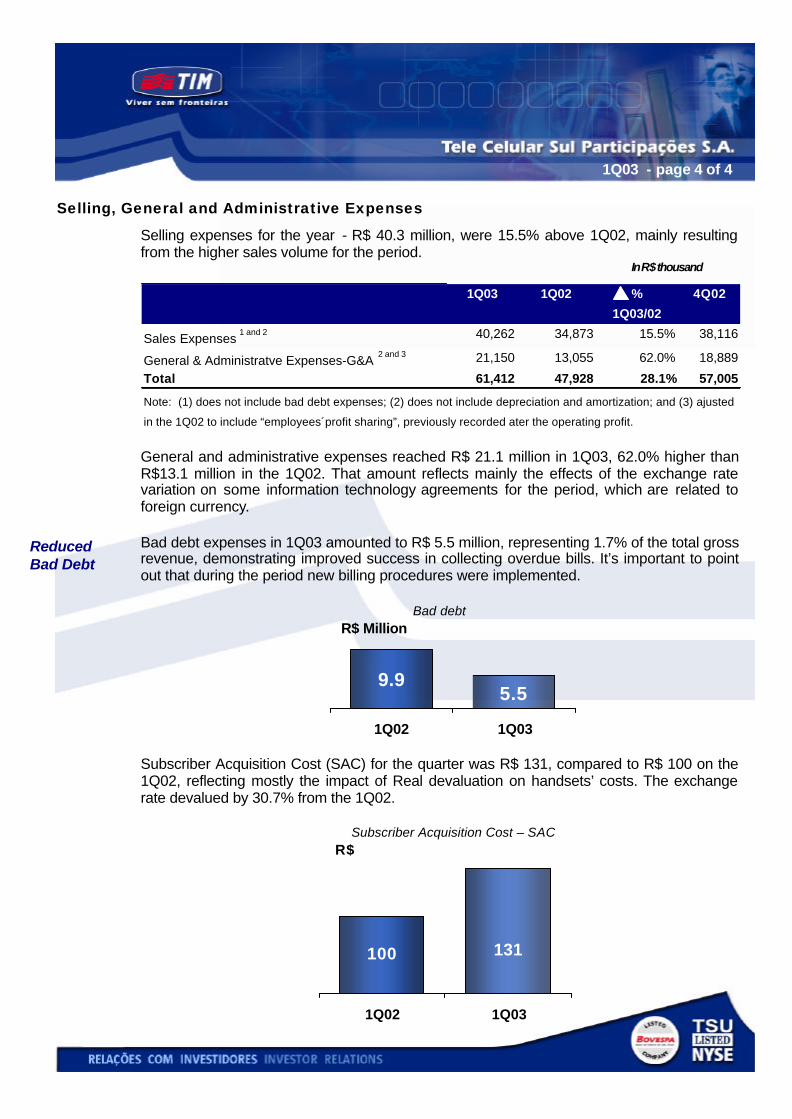
General and administrative expenses reached R$ 21.1 million in 1Q03, 62.0% higher than R$13.1 million in the 1Q02. That amount reflects mainly the effects of the exchange rate variation on some information technology agreements for the period, which are related to foreign currency. Bad debt expenses in 1Q03 amounted to R$ 5.5 million, representing 1.7% of the total gross revenue, demonstrating improved success in collecting overdue bills. It’s important to point out that during the period new billing procedures were implemented.
Bad debt
Subscriber Acquisition Cost (SAC) for the quarter was R$ 131, compared to R$ 100 on the 1Q02, reflecting mostly the impact of Real devaluation on handsets’ costs. The exchange rate devalued by 30.7% from the 1Q02.
Subscriber Acquisition Cost – SAC
Reduced Bad Debt
%
1Q03/02
Sales Expenses 1 and 2 40,262 34,873 15.5% 38,116
General & Administratve Expenses-G&A 2 and 3 21,150 13,055 62.0% 18,889
Total 61,412 47,928 28.1% 57,005
Note: (1) does not include bad debt expenses; (2) does not include depreciation and amortization; and (3) ajusted
in the 1Q02 to include “employees´profit sharing”, previously recorded ater the operating profit.
1Q03 1Q02 4Q02
R$ Million
5.59.9
1Q02 1Q03
R$
100 131
1Q02 1Q03
1Q03 - page 5 of 5
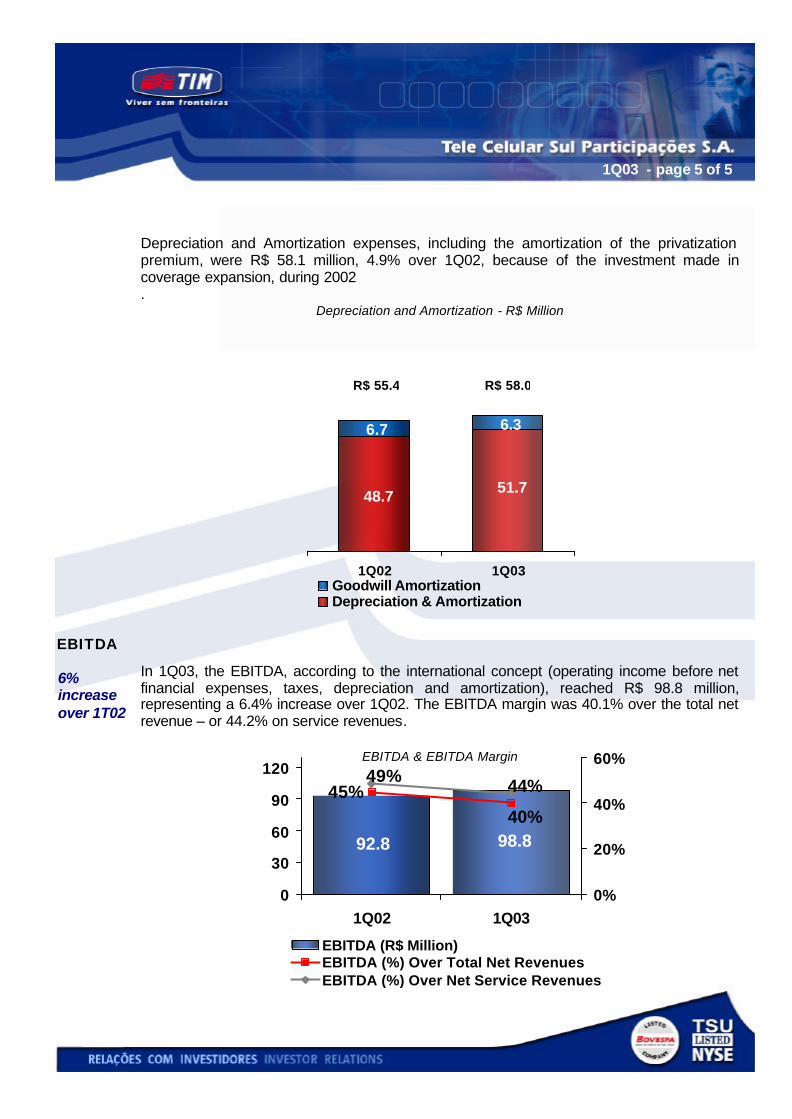
Depreciation and Amortization expenses, including the amortization of the privatization premium, were R$ 58.1 million, 4.9% over 1Q02, because of the investment made in coverage expansion, during 2002 .
Depreciation and Amortization - R$ Million
EBITDA
In 1Q03, the EBITDA, according to the international concept (operating income before net financial expenses, taxes, depreciation and amortization), reached R$ 98.8 million, representing a 6.4% increase over 1Q02. The EBITDA margin was 40.1% over the total net revenue – or 44.2% on service revenues.
EBITDA & EBITDA Margin
51.7 48.7
6.3 6.7
1Q02 1Q03Goodwill AmortizationDepreciation & Amortization
6% increase over 1T02
R$ 55.4 R$ 58.0
92.8 98.8
45%40%
49% 44%
0
30
60
90
120
1Q02 1Q030%
20%
40%
60%
EBITDA (R$ Million)EBITDA (%) Over Total Net RevenuesEBITDA (%) Over Net Service Revenues
1Q03 - page 6 of 6
Net Income
The net income for the period totaled R$ 28.7 million, 67% and 123.4% above the 1Q02 and 4Q02, respectively, mainly derived from the higher revenue.
In R$ thousand
Indebtedness
At the end of 1Q03, the Company’s total debt amounted to R$ 322.1 million, with a cash balance of R$ 488.2 million, resulting in a R$ 166.1 million positive balance. The debt is comprised basically of loans from the Eximbank (Export and Import Bank of United States - R$ 29.9 million), BNDES (Banco Nacional de Desenvolvimento Econômico e Social - R$ 66.9 million), and the issuance of non-convertible debentures (R$ 222.3 million). Of the total debt, the amount of R$ 32.8 million represents loans in dollars, fully covered by hedged against the effects of exchange rate variations. The financial income for the quarter was R$ 33.0 million, stemming basically from interest on cash, compared to financial expenses of R$ 27.2 million.
Investment
R$ 5.1 million was invested in the quarter in the expansion of coverage, while the preparatory phase of GSM overlay has proceeded.
Free Cash Flow
Free Cash Flow for 1Q03 totaled R$ 38.8 million, from R$ 99.3 in 1Q02 and R$ 67.8 in 4T02. The decrease in the period is related to payments mainly to the purchase of handsets and the Fistel annual fee, which in 2002 was postponed to 2Q02, due to the calendar year.
Profit growth in 2002
Positive Cash Flow
1Q02 %
1Q03/02
Net Income (R$ million) 28,665 17,162 -40,1% 12,832
Net Income per 1,000 shares – R$ 0.08 0.05 60.0% 0.04
Profit per ADR (10,000 shares) – R$ 0.80 0.50 60.0% 0.40
1Q03 4Q02
1Q03 - page 7 of 7
Events in the Period Capitalization The Tele Celular Sul Special General Meeting held on Mar/18/03 passed a capital increase of R$ 29.2 million by means of the capitalization of the 2002 tax benefit, derived from the amortization of the premium in the split-up of Bitel Participações S.A. (“Bitel”), as provided in article 7, paragraph 1 of CVM Instruction nº 319/99 and the provision of clause 8ª of the Split-Up Protocol. A R$ 15.3 million capital increase from the surplus reserve was also approved, with no issuance of shares. Consequently, our capital stock was adjusted to R$ 369.1 million, represented by 134.4 billion common shares and 222.0 billion preferred shares. Bitel, a TIM Brasil S.A. subsidiary, controls 52.5% of Tele Celular Sul (22.2% of the total capital stock). Payment of Dividends The Meeting of Mar/18/03, also approved the payment of dividends and interest on capital – JSCP, for fiscal year 2002, to be distributed on May 19, 2003. The amount corresponds to R$ 0.0765 per lot of 1,000 preferred and common shares, net of income tax, representing a payout of 38.9% over the net income.
_________________________________________________________________________ "This press release contains forward-looking statements and estimates. Such expectations are based on a series of assumptions, and subject to the risks and uncertainties inherent to forward-looking projections and/or estimates. The results may differ materially from the expectations expressed in the forward-looking statements or estimates if one or more of the assumptions and expectations prove to be incorrect or are not realized."
1Q03 - page 8 of 8
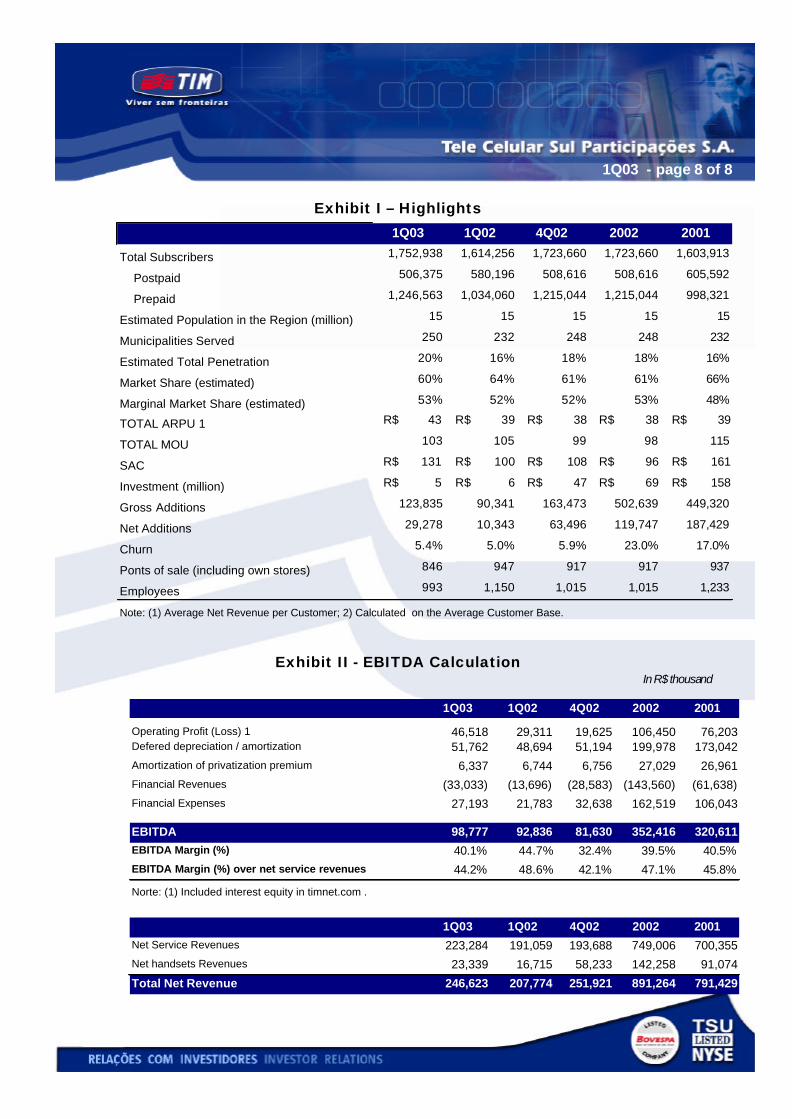
Exhibit I – Highlights
Exhibit II - EBITDA Calculation In R$ thousand
1Q03 1Q02 4Q02 2002 2001
Operating Profit (Loss) 1 46,518 29,311 19,625 106,450 76,203 Defered depreciation / amortization 51,762 48,694 51,194 199,978 173,042 Amortization of privatization premium 6,337 6,744 6,756 27,029 26,961 Financial Revenues (33,033) (13,696) (28,583) (143,560) (61,638)Financial Expenses 27,193 21,783 32,638 162,519 106,043
EBITDA 98,777 92,836 81,630 352,416 320,611 EBITDA Margin (%) 40.1% 44.7% 32.4% 39.5% 40.5%EBITDA Margin (%) over net service revenues 44.2% 48.6% 42.1% 47.1% 45.8%
Norte: (1) Included interest equity in timnet.com .
1Q03 1Q02 4Q02 2002 2001Net Service Revenues 223,284 191,059 193,688 749,006 700,355 Net handsets Revenues 23,339 16,715 58,233 142,258 91,074
Total Net Revenue 246,623 207,774 251,921 891,264 791,429
1Q03 1Q02 4Q02 2002 2001
Total Subscribers 1,752,938 1,614,256 1,723,660 1,723,660 1,603,913
Postpaid 506,375 580,196 508,616 508,616 605,592
Prepaid 1,246,563 1,034,060 1,215,044 1,215,044 998,321
Estimated Population in the Region (million) 15 15 15 15 15
Municipalities Served 250 232 248 248 232
Estimated Total Penetration 20% 16% 18% 18% 16%
Market Share (estimated) 60% 64% 61% 61% 66%
Marginal Market Share (estimated) 53% 52% 52% 53% 48%
TOTAL ARPU 1 R$ 43 R$ 39 R$ 38 R$ 38 R$ 39
TOTAL MOU 103 105 99 98 115
SAC R$ 131 R$ 100 R$ 108 R$ 96 R$ 161
Investment (million) R$ 5 R$ 6 R$ 47 R$ 69 R$ 158
Gross Additions 123,835 90,341 163,473 502,639 449,320
Net Additions 29,278 10,343 63,496 119,747 187,429
Churn 5.4% 5.0% 5.9% 23.0% 17.0%
Ponts of sale (including own stores) 846 947 917 917 937
Employees 993 1,150 1,015 1,015 1,233
Note: (1) Average Net Revenue per Customer; 2) Calculated on the Average Customer Base.
1Q03 - page 9 of 9
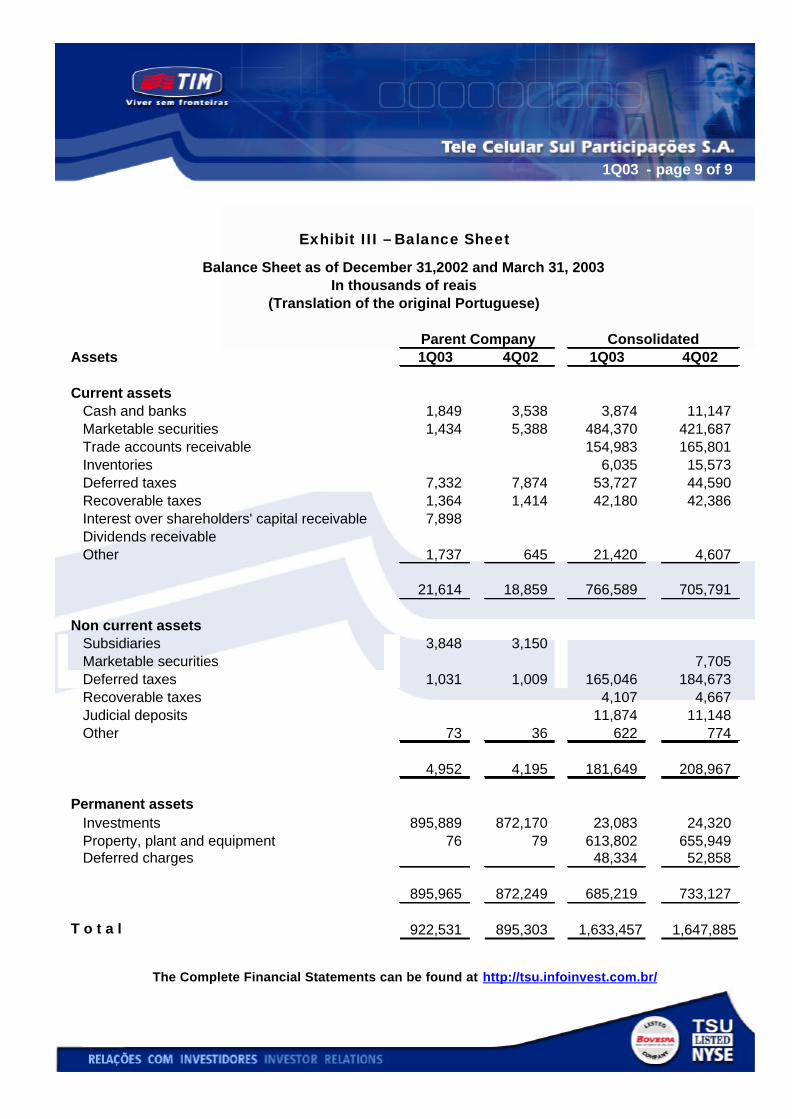
Exhibit III – Balance Sheet
The Complete Financial Statements can be found at http://tsu.infoinvest.com.br/
Balance Sheet as of December 31,2002 and March 31, 2003In thousands of reais
(Translation of the original Portuguese)
Parent Company ConsolidatedAssets 1Q03 4Q02 1Q03 4Q02
Current assets Cash and banks 1,849 3,538 3,874 11,147 Marketable securities 1,434 5,388 484,370 421,687 Trade accounts receivable 154,983 165,801 Inventories 6,035 15,573 Deferred taxes 7,332 7,874 53,727 44,590 Recoverable taxes 1,364 1,414 42,180 42,386 Interest over shareholders' capital receivable 7,898 Dividends receivable Other 1,737 645 21,420 4,607
21,614 18,859 766,589 705,791
Non current assets Subsidiaries 3,848 3,150 Marketable securities 7,705 Deferred taxes 1,031 1,009 165,046 184,673 Recoverable taxes 4,107 4,667 Judicial deposits 11,874 11,148 Other 73 36 622 774
4,952 4,195 181,649 208,967
Permanent assets Investments 895,889 872,170 23,083 24,320 Property, plant and equipment 76 79 613,802 655,949 Deferred charges 48,334 52,858
895,965 872,249 685,219 733,127
T o t a l 922,531 895,303 1,633,457 1,647,885
1Q03 - page 10 of 10
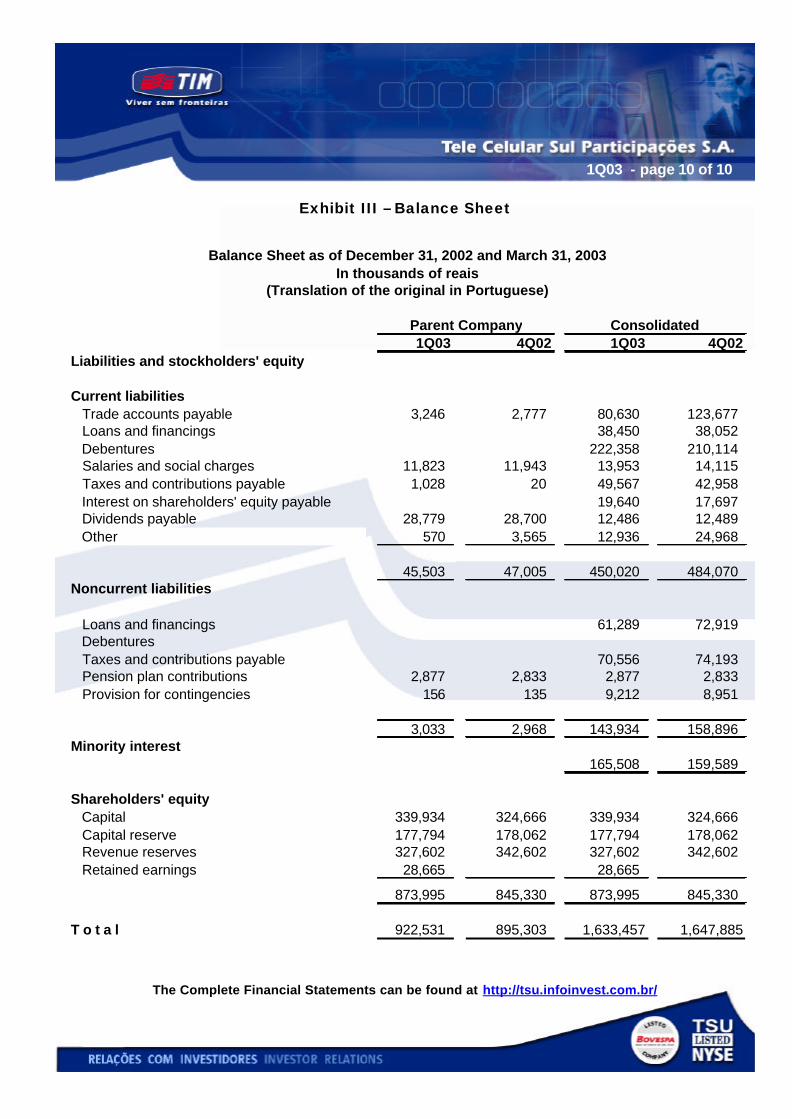
Exhibit III – Balance Sheet
The Complete Financial Statements can be found at http://tsu.infoinvest.com.br/
Balance Sheet as of December 31, 2002 and March 31, 2003In thousands of reais
(Translation of the original in Portuguese)
Parent Company Consolidated1Q03 4Q02 1Q03 4Q02
Liabilities and stockholders' equity
Current liabilities Trade accounts payable 3,246 2,777 80,630 123,677 Loans and financings 38,450 38,052 Debentures 222,358 210,114 Salaries and social charges 11,823 11,943 13,953 14,115 Taxes and contributions payable 1,028 20 49,567 42,958 Interest on shareholders' equity payable 19,640 17,697 Dividends payable 28,779 28,700 12,486 12,489 Other 570 3,565 12,936 24,968
45,503 47,005 450,020 484,070Noncurrent liabilities
Loans and financings 61,289 72,919 Debentures Taxes and contributions payable 70,556 74,193 Pension plan contributions 2,877 2,833 2,877 2,833 Provision for contingencies 156 135 9,212 8,951
3,033 2,968 143,934 158,896Minority interest
165,508 159,589
Shareholders' equity Capital 339,934 324,666 339,934 324,666 Capital reserve 177,794 178,062 177,794 178,062 Revenue reserves 327,602 342,602 327,602 342,602 Retained earnings 28,665 28,665
873,995 845,330 873,995 845,330
T o t a l 922,531 895,303 1,633,457 1,647,885
1Q03 - page 11 of 11
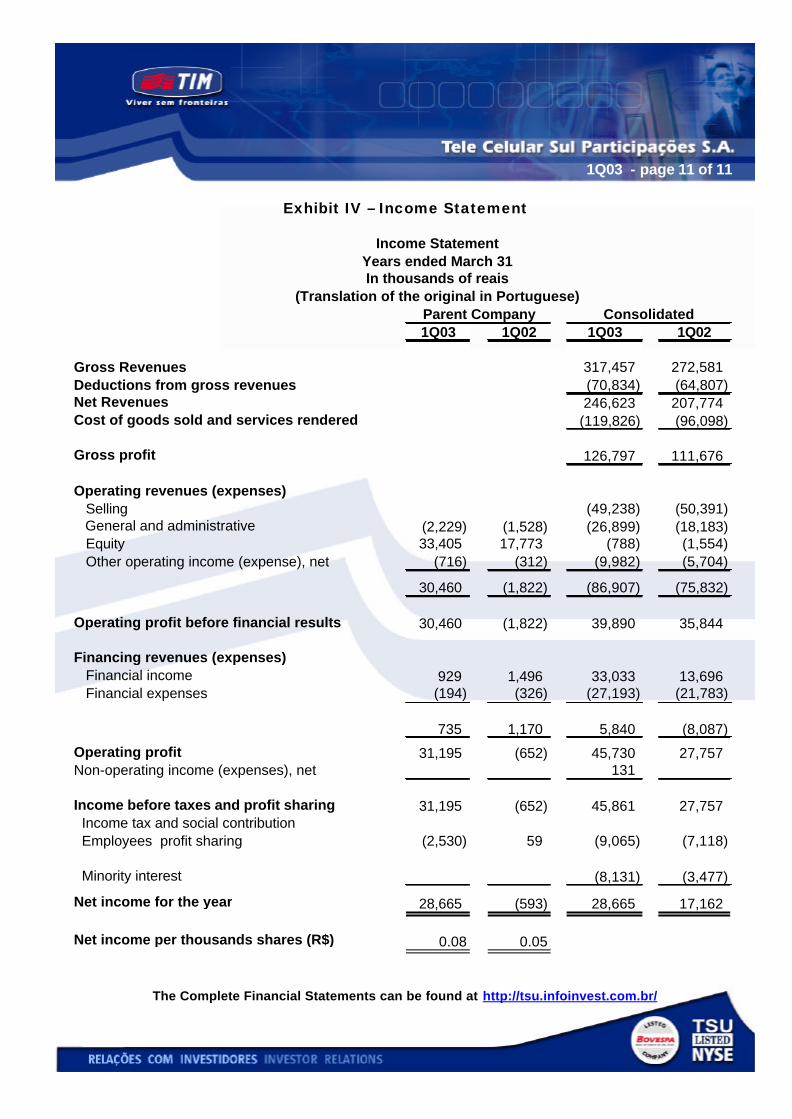
Exhibit IV – Income Statement
The Complete Financial Statements can be found at http://tsu.infoinvest.com.br/
Income StatementYears ended March 31In thousands of reais
Consolidated1Q03 1Q02 1Q03 1Q02
Gross Revenues 317,457 272,581Deductions from gross revenues (70,834) (64,807)Net Revenues 246,623 207,774Cost of goods sold and services rendered (119,826) (96,098)
Gross profit 126,797 111,676
Operating revenues (expenses) Selling (49,238) (50,391) General and administrative (2,229) (1,528) (26,899) (18,183) Equity 33,405 17,773 (788) (1,554) Other operating income (expense), net (716) (312) (9,982) (5,704)
30,460 (1,822) (86,907) (75,832)
Operating profit before financial results 30,460 (1,822) 39,890 35,844
Financing revenues (expenses) Financial income 929 1,496 33,033 13,696 Financial expenses (194) (326) (27,193) (21,783)
735 1,170 5,840 (8,087)
Operating profit 31,195 (652) 45,730 27,757Non-operating income (expenses), net 131
Income before taxes and profit sharing 31,195 (652) 45,861 27,757 Income tax and social contribution Employees profit sharing (2,530) 59 (9,065) (7,118)
Minority interest (8,131) (3,477)
Net income for the year 28,665 (593) 28,665 17,162
Net income per thousands shares (R$) 0.08 0.05
(Translation of the original in Portuguese)Parent Company