Embed Size (px)
Citation preview

Press presentation
Wiebe Draijer & Bas Brouwers16 February 2017
Annual results 2016

Investor Relations
Rabobank has taken important steps towards realising its strategic objectives
The implementation of our strategy…
• Customer satisfaction improved across the board
• Balance sheet reduction due to RWA relief transactions
• Underlying operating expenses down 2%
…combined with benign economic environment…
• Loan impairment charges at historically low level
2
Rabobank is delivering on its promises as set out in the Strategic Framework 2016-2020
…led to significant improvement of underlying results…
• Underlying operating profit before tax up 14%
• All business segments posted higher underlying operating profit before tax
• Reported net profit pressured by several exceptional items
…and a solid growth of capital ratios
• Capital targets for 2020 have already been met

Investor Relations
Rabobank is a client centered cooperative bank
Strategy
Make a substantial contribution to welfare and prosperity in the Netherlands
Make a substantial contribution to feeding the world sustainably
Vision
Mission
Banking for Food
Banking for the
Netherlands
1. Excellent customer
focus
2. Flexibility and balance sheet
reduction
3.Improving
performance
• Rabobank is a cooperative bank with its roots in the Dutch Food & Agri sector
• The Strategic Framework 2016-2020 enables Rabobank to strengthen its cooperative mission
• Rabobank’s mission stems from its cooperative heritage and agricultural roots
• Banking for the Netherlands: make a substantial contribution to welfare and prosperity as a leading cooperative and customer-oriented domestic bank
• Banking for Food: make a substantial contribution to feeding the world sustainably as a leader in Food & Agri in selected countries
3

Investor Relations
Profile of Rabobank
• Simplified, focused top structure
• Dedicated Fintech & Development team
• Centralised Portfolio Management unit
• Shared back-offices
• Integration of FGH Bank into Rabobank; non-core CRE portfolio managed separately
Organisational changes support our strategy
A+/Stable/A-1
Aa2/Negative/P-1
AA-/Stable/F1+
AA/Stable/R-1(high)
Ratings unchanged and at a high level in 2016
One Rabobank as the basis
Market shares 2016 2015
Mortgages 21% 20%
Savings 34% 35%
Trade, Industry & Services (TIS) 43% 42%
Food & Agri 84% 84%
Commanding domestic market shares
New governance:• One legal entity: local Rabobanks + central organisation• One banking license• One balance sheet
Active in 40 countries8.7 million customers worldwide
7.3 million local Rabobank customers1.9 million members
Specialised Rabobank subsidiaries
4
Investor Relations
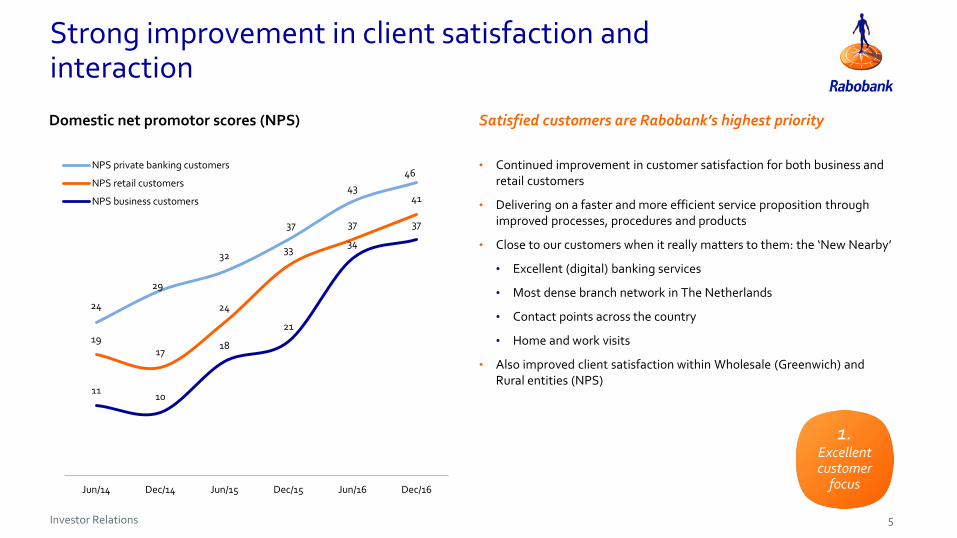
Strong improvement in client satisfaction and interaction
Satisfied customers are Rabobank’s highest priority
• Continued improvement in customer satisfaction for both business and retail customers
• Delivering on a faster and more efficient service proposition through improved processes, procedures and products
• Close to our customers when it really matters to them: the ‘New Nearby’
• Excellent (digital) banking services
• Most dense branch network in The Netherlands
• Contact points across the country
• Home and work visits
• Also improved client satisfaction within Wholesale (Greenwich) and Rural entities (NPS)
Domestic net promotor scores (NPS)
24
29
32
37
43
46
1917
24
33
37
41
1110
18
21
34
37
Jun/14 Dec/14 Jun/15 Dec/15 Jun/16 Dec/16
NPS private banking customers
NPS retail customers
NPS business customers
1. Excellent customer
focus
5

Investor Relations
In line with Rabobank’s strategy RWAs are managed down
2. Flexibility and balance sheet
reduction
Athlon Car Lease
Residential mortgages
Commercial Real Estate
Robeco Equity stake
Balance sheet reduction
transactions
Van Lanschot Equity stake
6
Rabobank is using its balance sheet more efficiently, while continuing serving its core clients
• Rabobank prepares itself for an increase in RWAs due to the possible Basel IV regulation
• In line with its Strategic Framework 2016-2020, Rabobank will reduce its balance sheet, and make it more flexible in order to remain a rock-solid bank
• The final outcome of Basel IV will ultimately determine the extent of the balance sheet reduction
• In 2016 Rabobank focused on setting up the infrastructure to be able to reduce its balance sheet through:
• portfolio sales
• risk participations
• securitisations
• Initial steps taken in 2016 contributed to a decline of the balance sheet by ca. € 13bn

Investor Relations
Rabobank is rationalising its business
Number of staff (in FTEs, incl. external hires)
1,969
5,191
1,255
53,982
52,013
45,567
38,500
2014 Realised 2015 Realised Athlon 2016 Planned YE 2018forecast
3. Improving
performance
7
2016: A year of accelerated change• Rabobank made good progress in executing its cost reduction programme,
aimed at:
• implementing more efficient processes
• centralising middle and back-office functions
• simplifying structures and delayering
• Targeted reduction of staff: 12,000 FTEs (excluding impact of Athlon sale) for the 2016-2018 period
• Headcount reduction of ~5,200 FTEs, versus target of 4,000 FTEs
• At the same time, initiatives were launched to increase revenues:
• margins in business lending are being attuned to the risk profile
• growth in rural lending
• performing in-depth sector reviews to target clients with attractive risk/return profiles
• increasing focus on fee and commission income
Investor Relations
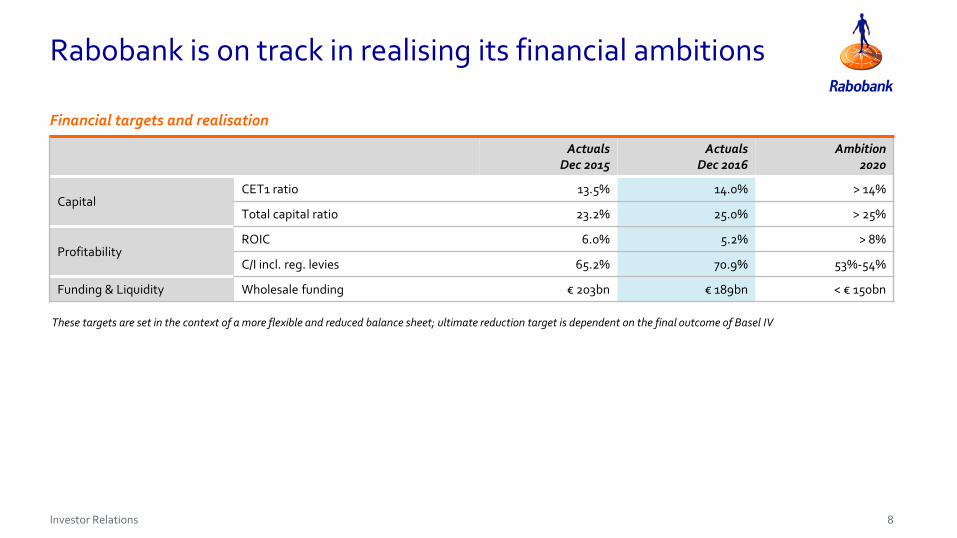
These targets are set in the context of a more flexible and reduced balance sheet; ultimate reduction target is dependent on the final outcome of Basel IV
Rabobank is on track in realising its financial ambitions
Financial targets and realisation
8
Actuals Dec 2015
ActualsDec 2016
Ambition2020
CapitalCET1 ratio 13.5% 14.0% > 14%
Total capital ratio 23.2% 25.0% > 25%
ProfitabilityROIC 6.0% 5.2% > 8%
C/I incl. reg. levies 65.2% 70.9% 53%-54%
Funding & Liquidity Wholesale funding € 203bn € 189bn < € 150bn

Investor Relations
Solid net profit, especially considering several exceptional items
Profit & Loss account Net profit (in € mn)
in € mn 2015 2016
Net interest income 9,139 8,743
Net fee and commission income 1,892 1,918
Other income 1,983 2,143
Total income 13,014 12,805
Operating expenses -8,145 -8,594
Regulatory levies -344 -483
Impairment losses on goodwill and investments in associates
-623 -700
Loan impairment charges -1,033 -310
Operating profit before tax 2,869 2,718
Tax -655 -690
Net profit 2,214 2,024
1,086
1,110 1,080
1,522
924
897762
692
1,100
2,007
1,842
2,214
2,024
2013 2014 2015 2016
H2
H1
9
Investor Relations
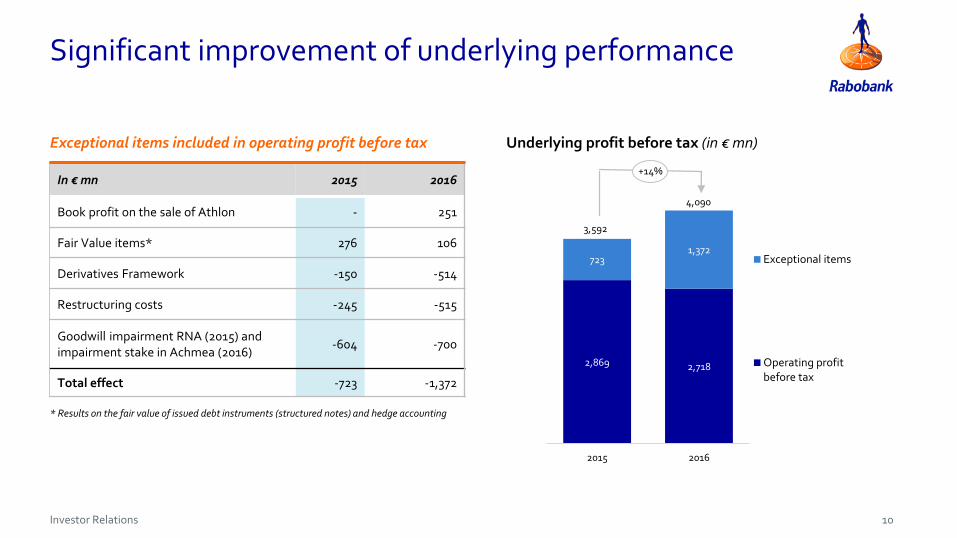
Significant improvement of underlying performance
Exceptional items included in operating profit before tax Underlying profit before tax (in € mn)
* Results on the fair value of issued debt instruments (structured notes) and hedge accounting
In € mn 2015 2016
Book profit on the sale of Athlon - 251
Fair Value items* 276 106
Derivatives Framework -150 -514
Restructuring costs -245 -515
Goodwill impairment RNA (2015) andimpairment stake in Achmea (2016)
-604 -700
Total effect -723 -1,372
2,869 2,718
7231,372
3,592
4,090
2015 2016
Exceptional items
Operating profitbefore tax
+14%
10

Investor Relations
Underlying performance improvement in all business segments
Leasing
247
389
2015
+62%
Operating profit before tax
404
Exceptional items
2016
250
15
3
Real Estate
(in € mn)
11
689
-241
937
+1%
Operating profit before tax
Exceptional items
2016
696
2015
6901
(172)
938
608
+118%
Operating profit before tax
Exceptional items
2016
95214
2015
436
Wholesale, Rural & Retail
1,766 1,527
332 838
+13%
Operating profit before tax
Exceptional items
2016
2,365
2015
2,098
Domestic Retail Banking

Investor Relations
9,1398,743
1,892 1,918
1,707 1,788
251276
106
2015 2016
Net interest income
Net fee & commission income
Other income excl. exceptionals
Gain on sale Athlon
FV items
Total income reflects lower net interest income andlower income from associates
12
Total income (in € mn)
12,44912,738
13,072 12,889 13,014 12,805
2013 2014 2015 2016
Investor Relations
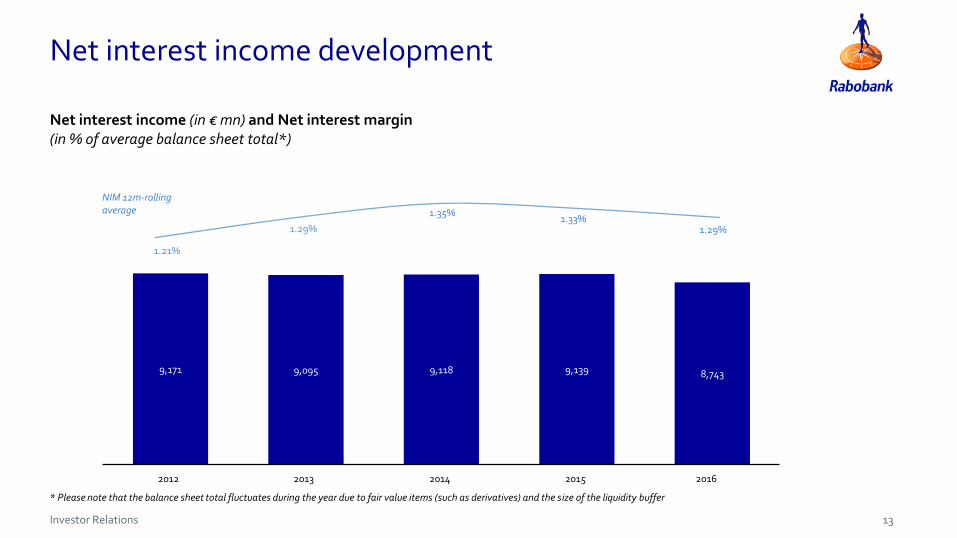
Net interest income development
Net interest income (in € mn) and Net interest margin(in % of average balance sheet total*)
NIM 12m-rolling average
13
9,171 9,095 9,118 9,139 8,743
20162014 201520132012
1.21%
1.29%1.33%
1.35%
1.29%
* Please note that the balance sheet total fluctuates during the year due to fair value items (such as derivatives) and the size of the liquidity buffer
Investor Relations
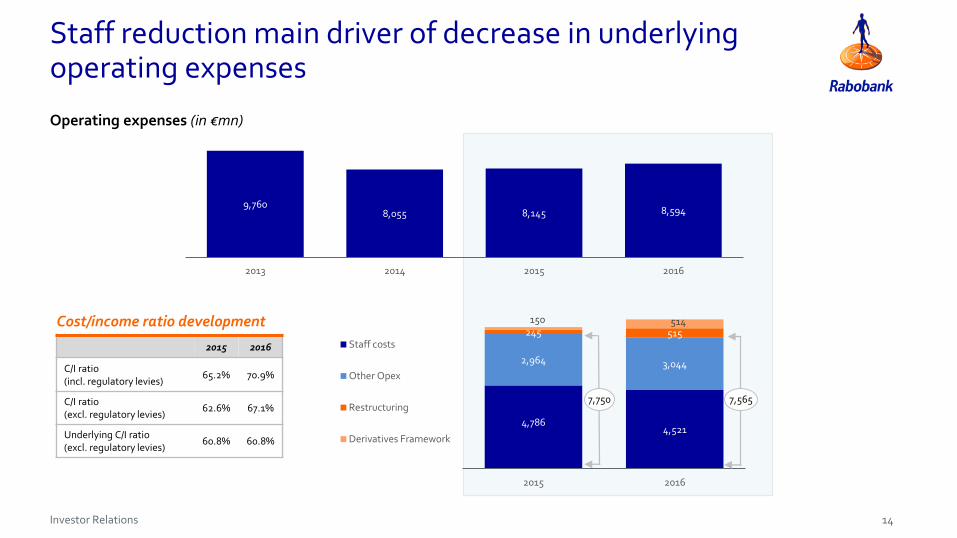
4,7864,521
2,964 3,044
245 515
150 514
2015 2016
Staff costs
Other Opex
Restructuring
Derivatives Framework
Staff reduction main driver of decrease in underlyingoperating expenses
Cost/income ratio development
2015 2016
C/I ratio (incl. regulatory levies)
65.2% 70.9%
C/I ratio (excl. regulatory levies)
62.6% 67.1%
Underlying C/I ratio (excl. regulatory levies)
60.8% 60.8%
9,7608,055 8,145 8,594
2013 2014 2015 2016
Operating expenses (in €mn)
14
7,750 7,565
Investor Relations
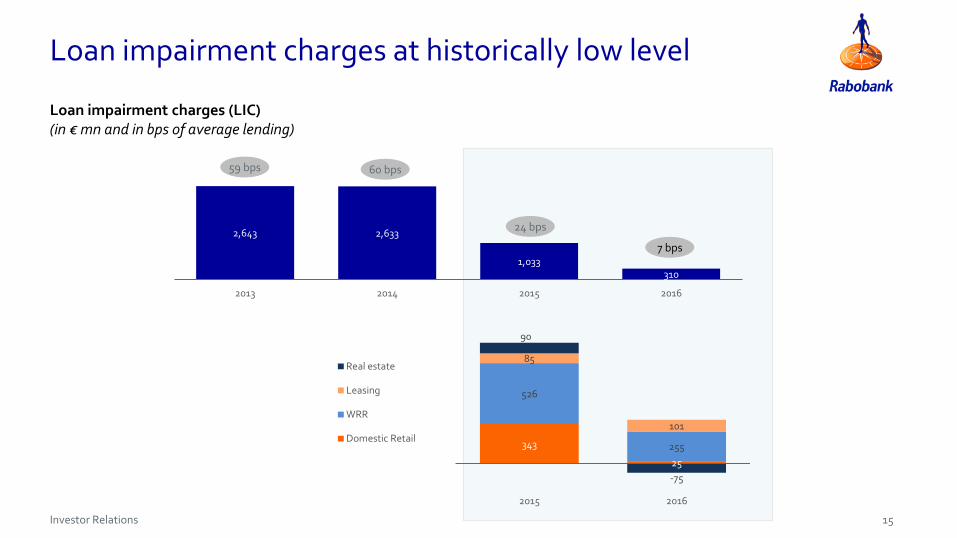
Loan impairment charges at historically low level
2,643 2,633
1,033310
2013 2014 2015 2016
343
25
526
255
85
101
90
-75
2015 2016
Real estate
Leasing
WRR
Domestic Retail
Loan impairment charges (LIC)(in € mn and in bps of average lending)
59 bps 60 bps
24 bps
7 bps
15
Investor Relations
-5.2
-6.1
+2.6
+1.7-4.0
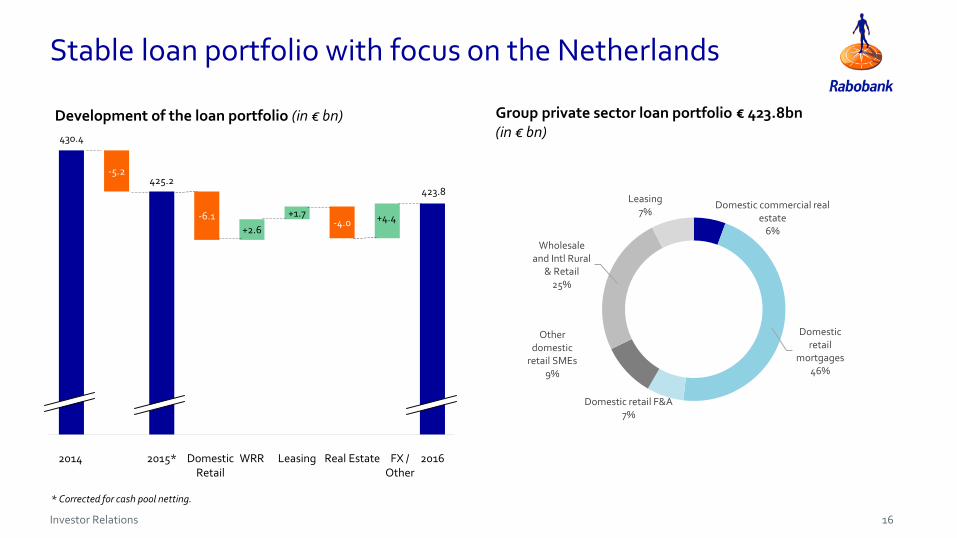
Stable loan portfolio with focus on the Netherlands
Development of the loan portfolio (in € bn) Group private sector loan portfolio € 423.8bn(in € bn)
2014
425.2
+4.4
WRRDomestic Retail
2015*
423.8
2016Leasing Real Estate FX / Other
430.4
Domestic commercial real estate
6%
Domestic retail
mortgages46%
Domestic retail F&A7%
Other domestic
retail SMEs9%
Wholesale and Intl Rural
& Retail25%
Leasing7%
16
* Corrected for cash pool netting.
Investor Relations
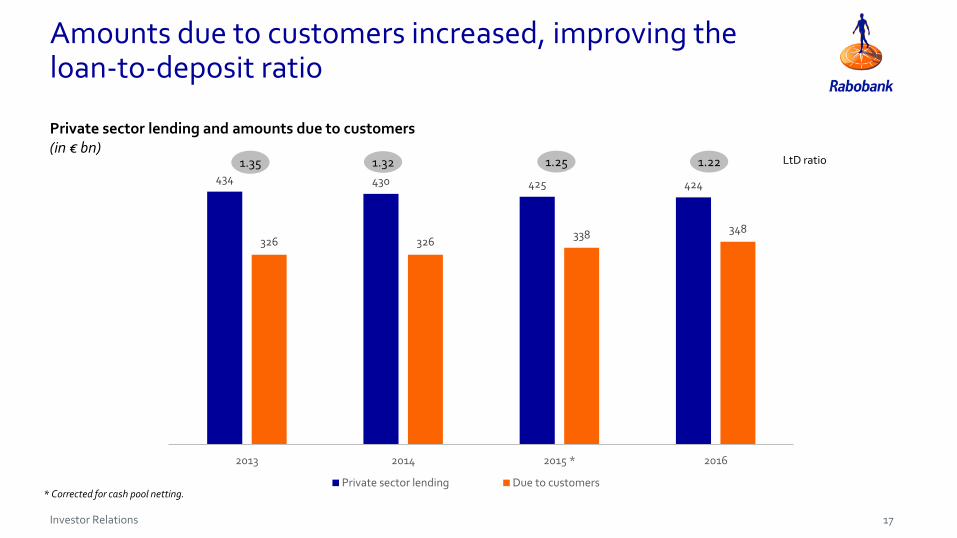
Amounts due to customers increased, improving theloan-to-deposit ratio
434 430 425 424
326 326338 348
2013 2014 2015 * 2016
Private sector lending Due to customers
Private sector lending and amounts due to customers (in € bn)
* Corrected for cash pool netting.
17
LtD ratio1.25 1.221.321.35

Investor Relations
Solid growth of common equity tier 1-ratio (I)
13.5%
0.3%0.4% 0.2%
14.0%
0.4%0.3%
2015 CRD IV phase in2016
Profit minusdividend
Sale of Athlon Other 2016 CRD IV phase in2017
RabobankCertificates
issuance
Pro forma Jan2017
Transitional CET1 development
14.5%
18
0.8%
Investor Relations
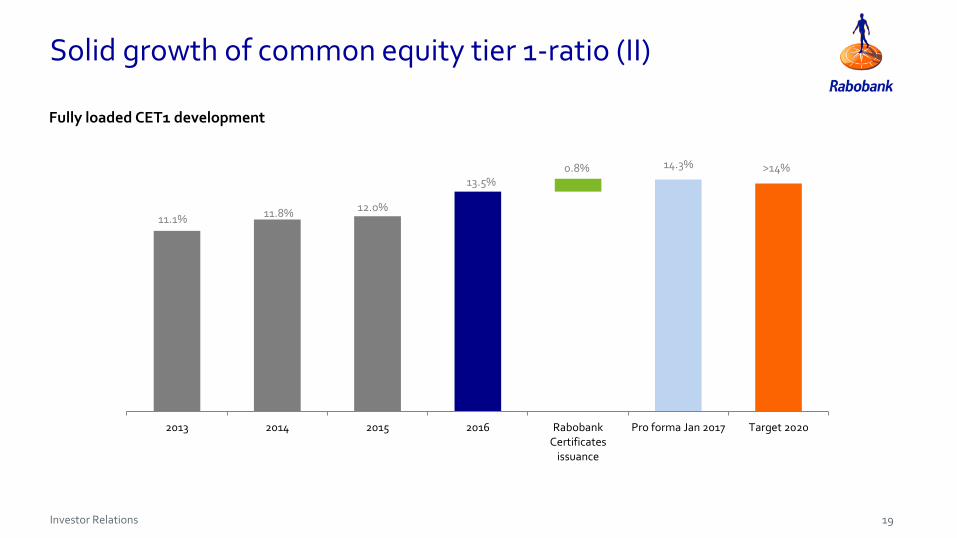
Solid growth of common equity tier 1-ratio (II)
Fully loaded CET1 development
0.8%
2013 2014 2015 2016 RabobankCertificates
issuance
Pro forma Jan 2017 Target 2020
11.1% 11.8% 12.0%
13.5%
14.3% >14%
19
Investor Relations
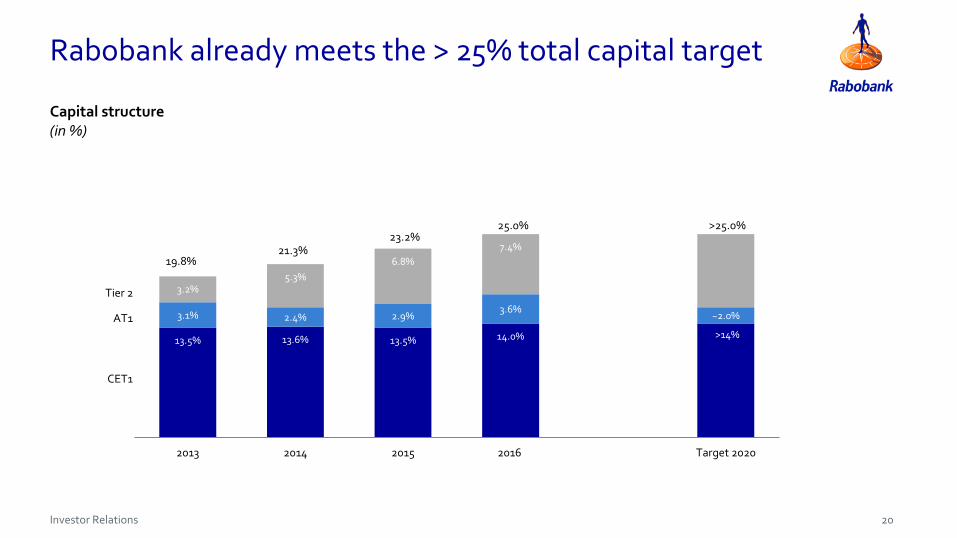
13.5% 13.6% 13.5% 14.0%
>25.0%
3.1% 2.4% 2.9%3.6%
~2.0%
3.2%5.3%
6.8%
7.4%
0.0%2013 2014 2015 2016 Target 2020
23.2%25.0%
>14%
Rabobank already meets the > 25% total capital target
19.8%21.3%
CET1
AT1
Tier 2
Capital structure(in %)
20

Investor Relations
Rabobank and the SDGs
21
More information
Press office Rabobank
Telephone: +31 30 216 2758E-mail [email protected] www.rabobank.com/pers
Q&A