Embed Size (px)
Citation preview

Presidential Greatness: The Historical Consensus and Its Psychological SignificanceAuthor(s): Dean Keith SimontonSource: Political Psychology, Vol. 7, No. 2 (Jun., 1986), pp. 259-283Published by: International Society of Political PsychologyStable URL: http://www.jstor.org/stable/3791125Accessed: 05/03/2010 13:50
Your use of the JSTOR archive indicates your acceptance of JSTOR's Terms and Conditions of Use, available athttp://www.jstor.org/page/info/about/policies/terms.jsp. JSTOR's Terms and Conditions of Use provides, in part, that unlessyou have obtained prior permission, you may not download an entire issue of a journal or multiple copies of articles, and youmay use content in the JSTOR archive only for your personal, non-commercial use.
Please contact the publisher regarding any further use of this work. Publisher contact information may be obtained athttp://www.jstor.org/action/showPublisher?publisherCode=ispp.
Each copy of any part of a JSTOR transmission must contain the same copyright notice that appears on the screen or printedpage of such transmission.
JSTOR is a not-for-profit service that helps scholars, researchers, and students discover, use, and build upon a wide range ofcontent in a trusted digital archive. We use information technology and tools to increase productivity and facilitate new formsof scholarship. For more information about JSTOR, please contact [email protected].
International Society of Political Psychology is collaborating with JSTOR to digitize, preserve and extendaccess to Political Psychology.
http://www.jstor.org

Political Psychology, Vol. 7, No. 2, 1986
Presidential Greatness: The Historical Consensus and Its Psychological Significance Dean Keith Simonton'
Two interconnected questions are addressed. One, does a historical consensus exist concerning the differential "greatness" of the American presidents? Two, what do these ratings imply about presidential leadership? A factor analysis of 16 assessments indicated the presence of a primary "greatness" dimension and a bipolar "dogmatism" dimension. The three most recent measures were then singled out for an analysis aimed at identifying the antecedents of presidential greatness. Hundreds of potential predictors were operationalized, including family background, personality traits, occupational and political experiences, and administration events. Five predictors replicated across the greatness mea- sures and survived tests for transhistorical invariance. In descending order of predictive generality, these are the number of years in office, the number of years as a wartime commander-in-chief, administration scandal, assassination, and having entered office as a national war hero. The theoretical meaning of these predictors is explored in further empirical analysis and discussion.
KEY WORDS: presidential greatness; historical consensus; political attitudes; leadership; biogra- phy; history.
INTRODUCTION
As soon as Americans have had two or more presidents to compare, the occupants of the nation's highest political office have had their performance repeatedly evaluated. Although the United States chief executive may be judged on the basis of many specific and objective criteria, such as success in getting administration-sponsored bills through congress (Hammond and Fraser, 1984), scholars, and laypersons alike have frequently indulged in more global and
'Department of Psychology, University of California, Davis, California 95616.
259
0162-895X/86/0600-0259$05.00/1 ? 1986 International Society of Political Psychology
subjective estimates of presidential "greatness." In 1948, Arthur Schlesinger, Sr., introduced the practice of polling experts concerning the greatness of past presidents (Schlesinger, 1949). This endeavor has continued, both by Schles-
inger (1962) himself and numerous others, including, most notably, Maranell (1970) and Murray and Blessing (1983). Because each decade provides one or more new former presidents, the assignment of greatness ratings will likely persist in the future.
Yet from the standpoint of political psychology, two things are lacking in this rating enterprise. First of all, insufficient attention has been paid to gauging the magnitude of the consensus among historians concerning the supposed differ- ential greatness of the presidents. Is there a single "greatness" dimension under-
lying all these ratings? If so, how much variance in the whole set of ratings is accounted for by that single factor? And how respectable are the reliability coefficients for such measures? The first task of this article is to establish the factoral coherence and reliability of presidential ratings. Second, not enough work has been published on what these presidential ratings signify. There are two
principal alternatives. On the one hand, it may be that the attitudes of the historians toward past presidents tell us most about how political attributions are made about leaders. On the other hand, the "greatness" assessments may gauge verifiable differences in the actual behaviors of American chief executives. So the second objective is to evaluate these two interpretations: Are greatness rat- ings more in the observer or in the observed?
HISTORICAL CONSENSUS
Past Research
Kynerd (1971) made a systematic quantitative comparison of the two rank- ings from the 1948 and 1962 Schlesinger polls along with some ratings based on the more qualitative statements of individual authors, namely, Bailey (1966), Rossiter (1956), and Sokolsky (1964). The correlation coefficients range from 0.73 to 0.95, with an average at a respectable 0.84. The mean correlation is 0.93 if we set aside the ratings of Bailey, whose book was explicitly directed at criticizing the rating game.
About the same time that Kynerd was proving that past assessments agreed, Maranell (1970) was conducting a wholly new survey of 571 historians. Mar- anell had his respondents gauge the presidents on seven distinct dimensions, namely, general prestige, strength of action, activeness, idealism (versus prac- ticality), flexibility, administration accomplishments, and the amount of infor- mation the respondents had about the president. When Maranell calculated the correlation coefficients among the seven dimensions, five dimensions were
260 Simonton

Presidential Greatness
found to correlate very highly with one another, yielding coefficients between 0.79 and 0.98. These were prestige, strength, activeness, accomplishment, and information. With the exception of the last dimension we can argue that these all concern various aspects of presidential "greatness." Indeed, the inclusion of the information dimension with the other four probably reflects the fact that histo- rians tend to learn more about the greater presidents. If we omit the information scale, the intercorrelations among the remaining four dimensions range from 0.91 to 0.98. On the other hand, two dimensions, namely, idealism and flexibil- ity, have very little to do with presidential greatness, though they do display a relationship with each other: The more idealistic presidents tend to be the more inflexible.
We thus have reason to suspect the existence of two factors in the Maranell evaluations, and such is in fact the case (Simonton, 1981b; Wendt and Light, 1976). The most important factor is a "greatness" dimension consisting of general prestige, strength of action, activeness, administration accomplishments, and, to a lesser degree, information. The loadings on Factor I range from 0.84 to over 0.99, and the factor explains about 71% of the total variation (or 85% of the explained variance). The second factor accounts for only 14% of the total vari- ance (or 16% of the explained variance), and it is bipolar, containing a variable with a positive loading (idealism) and one with a negative loading (flexibility). This factor clearly represents the contrast between idealistic inflexibility and pragmatic flexibility, or what has been styled a dogmatism factor (Simonton, 1983a).
How does the Maranell greatness factor relate to the previous ratings and rankings considered by Kynerd (1971)? On the basis of the factor analytic re- sults, Simonton (1981b) generated a single composite score resulting in a great- ness measure with an internal consistency reliability coefficient (alpha) of 0.98. This composite estimate of Factor I correlates 0.94 with the 1948 Schlesinger poll, 0.93 with the 1962 Schlesinger poll, 0.88 with Rossiter's ratings, 0.94 with Sokolsky's, and 0.72 with Bailey's. These figures compare quite favorably with reliability coefficients reported for well-established measures in the behavioral and social sciences (Simonton, 1981c, 1984a, chap. 1). Besides this patent agreement among the experts, the consensus is in accord with popular acclaim. Factor I extracted from the Maranell survey correlates with having a portrait on Mount Rushmore (r = 0.52), a monument in Washington, D.C. (r = 0.52), internment in the Hall of Fame (r = 0.48), how early a coin was struck with the presidential profile (r = 0.57), and on how small the denomination of a bill on which the president's portrait may be found (r = 0.40) (Simonton, 1981a).
Most recently, Murray and Blessing (1983) surveyed 846 Ph.D.-holding historians in American academic departments. All presidents between Wash- ington and Carter were evaluated, with the usual exceptions of W. Harrison and Garfield, thus lengthening the list of rated presidents to 36. In a qualitative way,
261

Simonton
Murray and Blessing compared their new ratings with the two Schlesinger polls as well as with two more recent surveys, one published in the Chicago Tribune Magazine in 1982 and another an unpublished work by Porter in 1981. Further- more, Murray and Blessing provide scores on how controversial each president turned out to be. Finally, the investigators examined how the ratings were af- fected by various characteristics of the respondents, including the historian's age, sex, geographical region, specialty area, academic affiliation, and profes- sional status. Murray and Blessing demonstrated that these various demographic and scholastic factors normally account for between 1 and 5% of the variance in each president's rating. With only one exception (Cleveland), over 90% of the variance in a president's rating is free of the most obvious kinds of rater bias. In addition, Murray and Blessing proved that the professional status of the re- spondent has no impact on a president's evaluation; the scores given by the "top" historians are virtually identical with the scores given by the remaining 771. I calculated the correlation coefficient between the elite and hoi poloi as 0.996 (df = 34, p <0.001).
Current Evaluation
Murray-Blessing did not validate their ratings against the remaining dozen alternative measures (see Appendix). To do this, the first question to ask is how the Murray-Blessing ratings fit in with the two nearly contemporary surveys by the Chicago Tribune and Porter. The correlations are very high, namely, 0.96 and 0.98, respectively and the Chicago Tribune and Porter ratings correlate 0.98 with each other (p < 0.001). At the very minimum 92% of the variance is shared among these measures. Furthermore, the Murray-Blessing rating correlates 0.95 with the Schlesinger 1948 poll, 0.94 with the Schlesinger 1962 poll, 0.85 with Rossiter, 0.89 with Sokolsky, 0.81 with Bailey, and respectively, 0.94, 0.94, 0.86, 0.96, and 0.79 with prestige, strength, activeness, accomplishments, and information dimensions of Maranell. The only low correlations are those with the Maranell dimensions of idealism and flexibility (0.11 and 0.22, respectively) and with Murray and Blessing's own controversiality scores (-0.14). The corre- sponding correlations for the Chicago Tribune and the Porter surveys are prac- tically identical.
The size of the overall historical consensus can be better appreciated if we perform a factor analysis of all measures at once. One difficulty, however, is that the 16 measures do not concern the same presidents. There are two routes around these missing values. One is to employ "listwise" deletion, that is, to treat only those presidents who have received scores on all 16 measures. This decision would leave us with only 28 presidents. The alternative is to utilize "pairwise" deletion in which for any given bivariate correlation all observations are retained
262

Presidential Greatness
for which there are no missing values for that particular pair of variables. This procedure allows all the information to be used, yet also means that the different correlations will not always be based on the same cases. The number of presi- dents for each correlation may vary from 28 to 36.
The analysis was run under both strategies. In each case the common factor model was employed, and the initial factor matrix was extracted using principal factors. The communality estimates for the listwise deletion case were the squared multiple correlations, but the largest off-diagonal correlations were used for the pairwise deletion case. All factors with eigenvalues larger than or equal to one were retained. Though a Varimax rotation was applied, the factor matrix that resulted was virtually the same as the original principal axes matrix. In fact, any common rotational scheme extracts the same outcome. The two results are shown in Table I, which gives the factor loadings along with the final commu- nalities after iteration (h2) for each measure and, for each factor, the eigenvalues and the percentage of explained and total variance accounted for.
The manner of handling the missing-values problem had no consequence. In both cases just two factors appeared, the first accounting for at least 85% of the explained variance and 72% of the total variance, the second factor accounting for at least 13 and 4%. Factor I defines a clear "greatness" factor, for virtually all ratings have very large loadings on this factor. Only presidential idealism, flexibility, and controversiality can be said to have negligible correlations with
Table I. Common Factors after Varimax Rotation
List-wise Deletion Pair-wise Deletion
Rating I II h2 I II h2 Schlesinger 1948 poll 0.97 0.03 0.95 0.98 0.02 0.96 Schlesinger 1962 poll 0.98 0.02 0.99 0.97 0.03 0.93 Rossiter (1956) 0.91 0.16 0.96 0.90 0.16 0.84 Sokolsky (1964) 0.96 0.15 0.98 0.95 0.15 0.93 Bailey (1966) via Kynerd (1971) 0.79 -0.37 0.92 0.80 -0.40 0.80 Maranell (1970)
Prestige 0.97 -0.03 0.97 0.96 -0.02 0.93 Strength 0.98 0.06 0.99+ 0.98 0.11 0.97 Activeness 0.94 0.17 0.98 0.93 0.23 0.91 Idealism 0.16 0.50 0.54 0.14 0.39 0.17 Flexibility 0.08 -0.85 0.81 0.12 -0.65 0.44 Accomplishments 0.98 -0.06 0.99 0.98 -0.03 0.96 Information 0.80 0.12 0.92 0.80 0.15 0.67
Porter (1981) 0.98 -0.05 0.99 0.97 -0.08 0.96 Chicago Tribune (1982) 0.98 -0.06 0.99 0.96 -0.11 0.94 Murray-Blessing (1983) 0.98 -0.11 0.98 0.98 -0.14 0.97
Controversality -0.08 0.86 0.84 -0.00 0.87 0.76 Eigenvalue (X) 11.6 2.0 11.5 1.7 Percentage of common variance 85 15 87 13 Percentage of total variance 72 4 72 11
i i i i i i i iii i i i i i iiiii
263

this first dimension. With just two exceptions, the remaining 13 loadings are in the 0.90s, and often approach the maximum value of unity. The information dimension of Maranell has a loading of "only" 0.80, which implies that the amount of information a respondent has about the president in question is at best an indirect indicator of presidential greatness. The second exception reveals Bailey's refusal to conform absolutely with the historical consensus, yet his loadings are still around 0.80.
The Bailey rating is the only measure putatively assessing "greatness" that loads to any noteworthy degree on Factor II, a dimension that looks like the dogmatism factor found in factor analyses of the Maranell data. Appended to this factor is, however, the Bailey assessments and the recent Murray-Blessing con- troversiality rating. At the one pole of Factor II we have those presidents who are idealistic, inflexible, highly controversial, and unfavorably perceived by Bailey; at the other pole we have presidents who are pragmatic, flexible, not very controversial at all, and positively valued by Bailey. The foundation of Bailey's dissent seems to be that he prefers to "play it safe" by refusing to highly regard any president who might be a subject of debate among other historians. Howev- er, we should not focus too much attention on Bailey when interpreting Factor II, for the highest loadings involve flexibility and controversiality, followed by idealism. Thus, Factor II pertains to presidents who are very controversial be- cause they "stuck by their guns come hell or high water" (i.e., were very inflexible), a rigidity often motivated by an excessive idealism.
To return to Factor I, it is evident that certain ratings have almost perfect loadings on the greatness dimension. The highest are the Maranell indicators of strength and accomplishment, and the Murray-Blessing assessment (i.e., the loadings are always 0.98). Because the Murray-Blessing ratings are the most current, we can infer that they constitute the best presently available, yet the Chicago Tribune and Porter ratings are not far behind.
PSYCHOLOGICAL SIGNIFICANCE
Although the consensus on presidential greatness is quite strong, only a handful of studies have tried to determine the psychological basis of these ratings. Virtually all of these inquiries strove to link differences in greatness with person- ality. Most commonly, content analysis has been applied to inaugural addresses to show how the power, achievement, and affiliation motives relate to global performance indicators (Wendt and Light, 1976; Winter, 1973; Winter and Stewart, 1977). These analyses have indicated, for example, that power motivated chief executives tend to earn higher assessments. An alternative method is some form of biographical analysis. Thus, Wendt and Light (1976) assessed 15 presi- dents on numerous biographical factors, including objective performance indica-
Simonton 264

Presidential Greatness
tors, to determine what specific behaviors or events are associated with greatness. Some years later Simonton (198 1b) elaborated this line of attack by adding many more potential predictors and by subjecting these variables to multivariate analy- ses. In particular, just five variables accounted for about three quarters of the variance in greatness: how long the president served, how long the nation was at war during his tenure in office, whether he survived an assassination attempt, whether a major scandal occurred during his administration, and his prepresiden- tial publication record.
The current study builds upon previous work in two main ways. First, a much more massive array of potential predictors is scrutinized, increasing the number of variables into the hundreds. Second, the most recent presidential ratings are utilized, enlarging the sample size and providing a new basis for replicating and extending earlier results.
The Data
The 38 former presidents were assessed on about 300 variables, which can be subdivided into two groups, namely, biographical antecedents and presiden- tial factors.
Biographical Antecedents
There were well over 100 variables that tapped various aspects of the pre- presidential character and experience:
1. Over three dozen variables had something to do with various aspects of a president'sfamily background. Included were such things as birth order, family size, orphanhood and parental loss, father's occupation and socioeconomic sta- tus, father's involvement in local, state, and national politics, and so on.
2. The amount of formal education was assessed using scales devised by Simonton (1976, 1983a). In addition, dichotomous variables noted such discrete attributes as attending college, graduating from college, attending law school, graduating from law school, obtaining higher degree, earning scholastic honors, participating in debating, and so forth.
3. A collection of personal characteristics were defined, involving such physical characteristics as height and age at inauguration (incorporating a quad- ratic term for curvilinear functions). Several personality variables were expropri- ated from previous studies, namely, measures of interpersonal dominance and extroversion (versus introversion) from Etheredge (1978) and measures of power, achievement, and affiliation motives from Winter and Stewart (1977) and from Wendt and Light (1976). Finally, a dogmatism measure was extracted from
265
the Maranell (1970) ratings that scaled 33 presidents on their degree of idealistic inflexibility versus pragmatic flexibility.
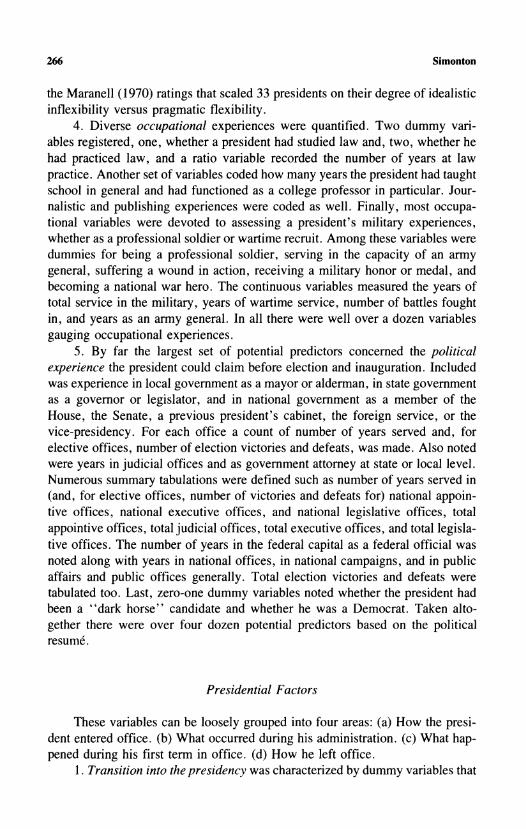
4. Diverse occupational experiences were quantified. Two dummy vari- ables registered, one, whether a president had studied law and, two, whether he had practiced law, and a ratio variable recorded the number of years at law practice. Another set of variables coded how many years the president had taught school in general and had functioned as a college professor in particular. Jour- nalistic and publishing experiences were coded as well. Finally, most occupa- tional variables were devoted to assessing a president's military experiences, whether as a professional soldier or wartime recruit. Among these variables were dummies for being a professional soldier, serving in the capacity of an army general, suffering a wound in action, receiving a military honor or medal, and becoming a national war hero. The continuous variables measured the years of total service in the military, years of wartime service, number of battles fought in, and years as an army general. In all there were well over a dozen variables gauging occupational experiences.
5. By far the largest set of potential predictors concerned the political experience the president could claim before election and inauguration. Included was experience in local government as a mayor or alderman, in state government as a governor or legislator, and in national government as a member of the House, the Senate, a previous president's cabinet, the foreign service, or the vice-presidency. For each office a count of number of years served and, for elective offices, number of election victories and defeats, was made. Also noted were years in judicial offices and as government attorney at state or local level. Numerous summary tabulations were defined such as number of years served in (and, for elective offices, number of victories and defeats for) national appoin- tive offices, national executive offices, and national legislative offices, total appointive offices, total judicial offices, total executive offices, and total legisla- tive offices. The number of years in the federal capital as a federal official was noted along with years in national offices, in national campaigns, and in public affairs and public offices generally. Total election victories and defeats were tabulated too. Last, zero-one dummy variables noted whether the president had been a "dark horse" candidate and whether he was a Democrat. Taken alto- gether there were over four dozen potential predictors based on the political resume.
Presidential Factors
These variables can be loosely grouped into four areas: (a) How the presi- dent entered office. (b) What occurred during his administration. (c) What hap- pened during his first term in office. (d) How he left office.
1. Transition into the presidency was characterized by dummy variables that
266 Simonton

Presidential Greatness
noted whether a president came into office by defeating an incumbent president, whether he was of a different party than his predecessor, and whether an "acci- dental president" who succeeded to office upon the death or resignation of his predecessor. The percentages of the electoral and popular votes were also re- corded. Last, as a possible control variable, the date that the president entered office was defined.
2. Administration events represented the largest single cluster of potential predictors. The majority of these variables have to do with the president's rela- tionship with congress. Included are the number of cabinet and Supreme Court nominees rejected by the Senate, total number of bills signed, number of vetoes (pocket and regular both combined and separately tabulated), and number of vetoes overturned. The president's support in each house of congress was as- sessed both absolutely (i.e., was the house organized by his party) and relatively (viz. percentage representation) and counted and averaged, respectively, across consecutive congresses. Changes in control, whether gains or losses, from first to second congress were recorded also. In addition, several variables focused more on the president's capacity as commander-in-chief, especially whether he delivered a war message to congress, the number of congressional war declara- tions, war years, military actions (mostly battles), and military interventions. Finally, a host of other variables entailed such events as unsuccessful assassina- tion attempts, financial panics or depressions, and administration scandals, just to name a few.
3. First term events were essentially operationalized in the same manner as administration events except that the tabulations only went as far as the general election at the close of the first term of office.
4. Transition out of the presidency was mainly tapped by a series of dummy variables that coded whether a president left office by voluntary retirement, defeat for nomination or renomination, defeat in the general election, natural death in office, or assassination in office.
Data Sources
The foregoing variables were operationalized using a large number of refer- ence works, among them broad biographies of the presidents (e.g., Armbruster, 1982; Whitney, 1982), detailed presidential factbooks (Kane, 1974, 1977; Tay- lor, 1972), extensive chronologies of American history (Carruth, 1979; Kull and Kull, 1952; Morris, 1976; Webster's Guide to American History, 1971), and other general reference works (e.g., Encyclopaedia Britannica, 1974). Gathered over a 5-year period, all this information was consolidated in the form of around 20 thousand index cards to facilitate final reduction to computer disk files. Additionally, more specialized sources were employed as required. For example, counts of the number of acts were drawn from the United States Statutes at Large
267

Simonton
(1845-1982), while the veto record was based on Presidential Vetoes, 1789-1971
by Kimmitt and Haley (1978), as updated by data kindly supplied by the Li- brarian of the U.S. Senate, Mr. Roger K. Haley. Various volumes of Current Biography (1940-1983) were valuable for obtaining information about the more recent presidents, especially those since Nixon.
Correlates and Predictors of Greatness
To make the presentation of the analyses that follow more concise, Pearson product-moment correlation coefficients (rs), unstandardized regression coeffi- cients (bs), and standardized regression coefficients (ps) will all be given without their corresponding t or F tests and levels of statistical significance. In all instances it can be assumed that the results satisfy the 0.05 probability or better, by conservative two-tailed tests. Also, unless stated otherwise, all decimal frac- tions given in parentheses are correlation coefficients.
Correlations
Are there any variables that correlate with all 13 greatness measures? The response is affirmative, though most of these correlations all concern the same thing, namely, how long the president served. However measured, greatness is positively related to how many years the president spent in office, how many congresses he had dealings with, the total number of days the congress was in session during his administration, and whether he was elected to a second term of office. Years in office, for instance, exhibited correlations ranging between 0.43 and 0.59, with a correlation of 0.57 with the Murray-Blessing rating.
The only other robust predictor was the number of years the nation was at war during the president's tenure in office (cf. Nice, 1984). This factor corre- lated between 0.38 and 0.65, correlating 0.50 with the rating given by Murray and Blessing. A couple of other variables barely missed identification as general predictors. Most notably, the occurrence of a major administration scandal was negatively related to every one of the several greatness measures except one, the Maranell information dimension (-0.02). Recognizing that this dimension has only a very indirect connection with greatness (and that historians would be expected to study scandals in some detail), the existence of this one exception is not at all problematic. Consequently, three correlates appear as particularly strong condidates as predictors of greatness: years in office, war years, and scandals.
These same three predictors were among the five isolated in the Simonton
268

Presidential Greatness
(1981b) investigation. The fourth predictor was the prepublication record, that is, how many books the president published prior to assuming the position of chief executive. The presence of this predictor was interpreted as evidence for a certain bias in the historians' assessments, for the publication record correlates most highly with the information dimension of the Maranell survey. Nonethe- less, book publication does not emerge as a universal predictor given that this variable does not correlate with the ratings of Rossiter, Bailey, and the Schles- inger 1948 poll.
The fifth and final predictor in Simonton's study was unsuccessful as- sassination attempts. Even though it correlates positively with greatness (as gauged by Maranell Factor I), it is by no means a consistently useful correlate. Indeed, of the 13 greatness measures, an unsuccessful assassination attempt correlates only with the Maranell measures and Rossiter's ratings. Further confu- sion is provided by the close relation between successful and unsuccessful as- sassination attempts. Simonton discovered that once control is provided for years in office, death by assassination emerges as a significant correlate of greatness. Implementation of such control makes sense given the connection between great- ness and a long tenure in the White House. If assassinated presidents serve less long, then their ratings will be hurt. Yet if we take those presidents who served an equal length of time, those assassinated are rated more highly. As it happens, once we partial out the impact of years in office from all the greatness measures currently available to us, it is the successful assassination, not the failure, that appears to be the best predictor. The first-order partial between successful as- sassination and the 13 greatness indicators is significant in every case but one (Rossiter, 0.30), whereas in unsuccessful assassination attempts it is nonsignifi- cant in every case but one (the Maranell activeness dimension, 0.39).
Multiple Regressions
Let us from this point forward concentrate on the three most current ratings. I will try to derive a single multiple regression equation that adequately predicts scores on all three measures, thereby assuring predictors with the most robustness. Also, because all three surveys assess the same presidents, including all the most recent past presidents, the data base is as broad as possible at this time-36 cases total. I commenced by entering the four most likely candidates as predictors, namely, years in office, war years, scandal, and assassination. All four variables proved to be statistically significant predictors according to each criterion. This part of the analysis largely confirms Simonton's results, with the qualification that actual assassination has been substituted for attempted assassination.
Next I took the residuals from the three regression equations and correlated
269

Simonton
them with the over 200 variables that remained as possible predictors. Only one variable had a statistically significant correlation with the residuals of all three equations: Entering office as a national war hero-such as Washington, Jackson, Grant, and Eisenhower did-is a fairly good predictor of greatness, this despite the fact that being a war hero displayed not one zero-order correlation with any of the 13 greatness indices; its relevance only emerges when the other four predic- tors serve as suppressor variables. In any case, this variable was inserted into the equation as a fifth predictor, new residuals were calculated, and the correlations were again computed.
No other variable exhibited a significant relationship, with a single quasi- exception. The number of books published was a significant predictor of the Murray-Blessing rating (p <0.05), but was of only marginal significance for the Porter and Chicago Tribune ratings (p <0.1). Because a robust prediction equa- tion was sought this variable was not added. Still, the addition of the president's publication record did not affect in any substantial degree the direction, magni- tude, or significance of the effects for the five variables that were retained.
We thus end up with three five-variable prediction equations. The unstan- dardized and standardized regression coefficients are shown in Table II. These equations account for between 77 and 78% of the variance in greatness (or if we use the adjusted-R2, between 73 and 74). Equally noteworthy is the similarity in the regression coefficients in sign and in magnitude. The intercept averages around -1.2 across the four equations. Recalling that these ratings have all been standardized, this means that the typical president starts out with a score about 1.2 standard deviations below the mean. For each year he serves, about 0.17 points are added, so that a president who serves 4 full years earns a score still below mediocrity (-0.52). Two full terms in office puts the president above the average, but not by much of a margin (0.16). Yet for each year that the United States is at war the corresponding president accrues about a quarter point, and if
Table II. Final Predictors of Three Recent Greatness Ratings
Presidential rating Porter Chicago Tribune Murray-Blessing
Predictor b 3 b 3 b P Years in office 0.16 0.37a 0.17 0.41b 0.17 0.40b Years of war 0.27 0.45b 0.22 0.37a 0.26 0.44b Scandal -1.76 -0.49b -1.76 -0.49b -1.70 -0.48b Assassinated 0.90 0.25a 1.15 0.32a 0.89 0.25a War hero 0.81 0.31a 0.84 0.32a 0.82 0.31a Intercept -1.17 -1.24 -1.24 R2 0.77 0.78 0.78 Adjusted R2 0.73 0.74 0.74
ap < 0.01. bp < 0.001.
270

Presidential Greatness
he suffers the misfortune of assassination almost a whole point is granted. The president can also accumulate credit from status as a national war hero-almost as many points as being assassinated. Nearly two points are removed, however, if a scandal tarnishes the president's administration.
The coefficients in Table II can be applied to any president, even ones not rated by the historians. Such an application can be studied in Table III in which
Table III. Predicted Greatness Ratings from Three Equations
Predicted
President Porter Chicago
Washington J. Adams Jefferson Madison Monroe J. Q. Adams Jackson Van Buren W. Harrison Tyler Polk Taylor Fillmore Pierce Buchanan Lincoln A. Johnson Grant Hayes Garfield Arthur Cleveland B. Harrison McKinley T. Roosevelt Taft Wilson Harding Coolidge Hoover F. D. Roosevelt Truman Eisenhower Kennedy L. B. Johnson Nixon Ford Carter Reagana
0.87 0.26 1.15 0.88 0.08
-0.54 0.90
-0.54 -0.35 -0.56
0.26 -0.15 -0.75 -0.54 -0.54
1.44 -0.56 -0.86 -0.54 -0.18 -0.62
0.08 -0.54
0.71 0.82
-0.54 0.62
-2.55 -0.29 -0.54
1.79 1.12 0.90 0.17 0.98
-1.00 -0.78 -0.54
0.11
0.96 0.11 1.03 0.81 0.16
-0.54 1.00
-0.54 -0.38 -0.56
0.11 -0.17 -0.77 -0.54 -0.54
1.49 -0.56 -0.76 -0.54
0.01 -0.63
0.16 -0.54
0.91 0.91
-0.54 0.59
-2.58 -0.26 -0.54
1.75 0.99 1.00 0.39 0.76
-1.17 -0.80 -0.54
0.12
Murray-Blessing
Predicted Residual
0.90 0.97 0.22 0.36 1.16 0.36 0.90 -0.67 0.11 0.08
-0.56 0.69 0.93 0.09
-0.56 0.25 -0.39 -0.58 -0.25
0.22 0.20 -0.19 -0.51 -0.78 -0.08 -0.56 -0.55 -0.56 -0.71
1.39 0.59 -0.58 -0.65 -0.77 -0.59 -0.56 0.18 -0.26 -0.65 0.11
0.11 0.01 -0.56 -0.10
0.67 -0.83 0.85 0.49
-0.56 0.33 0.63 0.59
-2.53 0.92 -0.30 -0.57 -0.56 0.20
1.85 0.06 1.13 -0.21 0.93 -0.45 0.12 0.24 0.95 -0.38
-0.96 -0.34 -0.82 0.22 -0.56 -0.07
0.12
aAssuming 8 full years in office, no wars, scandals, or assassination.
1. 2. 3. 4. 5. 6. 7. 8. 9.
10. 11. 12. 13. 14. 15. 16. 17. 18. 19. 20. 21. 22. 23. 24. 25. 26. 27. 28. 29. 30. 31. 32. 33. 34. 35. 36. 37. 38. 39.
271

the predicted greatness ratings are given for all 39 presidents. Two points are worth noting. To begin with, the three sets of predictions are in substantial agreement. In particular, the three prediction equations yield similar predictions for the three unrated presidents, W. Harrison, Garfield, and Reagan (the latter only under the assumption of no wars, no scandals, no assassination, and 8 full years in the White House).
The second matters to examine are the residual scores, or errors of predic- tion. These have been provided for the equation abstracted from the Murray- Blessing data since they are founded on the most extensive and most recent
survey. Two residuals stand out as indicating that two presidents are somewhat overrated: Washington and Harding. Thus Harding may have been the worst president in history, yet judged by the standards applied to the whole group of chief executives, matters could be worse. Washington is overappreciated by a slightly larger margin, a fact that was noted in the Simonton (1981b) study, when it was ascribed to Washington's role as the "father of our country" and as the precedent-setting first president. Even so, because the current predictions have taken into consideration the impact of being a war hero, the residual error has been reduced.
Interestingly, Simonton also pointed to Kennedy as another overrated presi- dent, but the residual seen in Table III shows that this is no longer the case. One reason is that Kennedy's status has declined appreciably since the Marranell (1970) survey, just as Simonton had predicted would happen. Another reason is that the current prediction equations allot credit for assassinations, a "tragedy effect" that may have partially accounted for Kennedy's high rating over a decade ago (also see Simonton, 1976, 1984a).
The preceding discussion is definitely based on the premise that historians apply certain consistent standards to all presidents. And yet, conceivably, the criteria could have gradually altered over time so that the earlier presidents are tested against a different touchstone than are the later presidents (see, e.g., Bailey, 1966). The plausibility of this hypothesis notwithstanding, a scan of the residuals in Table III reveals no systematic tendency for the prediction errors to increase or decrease in absolute value. The average error for 19th-century presi- dents is 0.40, for 20th-century presidents 0.36, a difference not only negligible but in the opposite direction from what we might expect if historians really were applying a richer set of criteria to the more recent presidents.
Even more critically, I replicated Simonton's (1981b) test for the trans- historical invariance of the five predictors for each of the three equations. This test entailed checking if the effect of each variable varied according to the historical time of the president (i.e., Predictor x Date Interaction effects). None of the tests proved to be statistically or substantively significant. Historical period does not even exhibit a main effect, that is, there is no tendency for the greatness ratings to increase or decrease with time (also see Nice, 1984).
272 Simonton

Presidential Greatness
Predicting the Predictors
The implications of the above results might be better appreciated if we had some knowledge of the antecedents of the predictors. Actually, we will focus on just the years in office variable. Of the five variables, only three can claim secure status as predictors of greatness, namely, years in office, war years, and scan- dals. These three alone exhibited respectable zero-order correlations with all greatness measures and emerged as predictors in regression equations both in the Simonton (1981b) study and in the present replication.
Of these three firm factors, years in office has the most optimal statistical properties, with an approximately normal distribution and a large variance, rang- ing from 1 month to over a dozen years, with a mean of a bit over one term. In contrast, both war years and scandals exhibit highly skewed distributions with modal scores of zero. Needless to say, no data transformation can undo the happy fact that the overwhelming majority of chief executives preside over administrations that are free of both war and corruption.
Still another asset of years in office is that this same factor has also been shown to be a significant predictor of the historical standing of other kinds of leaders, such as hereditary monarchs (Simonton, 1984b; Sorokin, 1925). Thus its influence on assessments of political leaders appears to be exceptionally general. Finally, in the case of tenure duration we need not have to resort to the blind application of exploratory analyses, for past research and common sense can guide the selection of antecedents. The analysis reported below is based on all 38 former presidents, including W. Harrison and Garfield.
For a president to have a long stay in the White House he must be reelected, and, in fact, the zero-order correlation between these two variables is 0.75. Now if we assume that a president is reelected, the next logical determinant is whether he is forced to leave office prior to completing his second term, either by assassination or by resignation. The third determinant recognizes that even those who are not reelected to office nonetheless may serve for varying lengths of time. Some serve less than 4 years due to natural death or assassination, and others due to being accidental presidents. Accordingly, a third predictor is the number of days the president served out his first term. If years in office is regressed on these three predictors, we obtain an equation that accounts for 87% of the variance. Reelection, as we anticipate, emerges as the best predictor by far (b = 4.15, 3 = 0.81), followed by the number of days in the first term (b = 0.003, 3 = 0.47) and whether the president failed to finish out his second term (b = -3.72, 3 = 0.48).
To get reelected a president must first be renominated, and, reelection correlates 0.62 with renomination. Furthermore, control of the congress, es- pecially of the House of Representatives, should predict success on election day for a president seeking another term. Simonton (1981b) found, for example, that
273

Simonton
long-tenured presidents were more likely to have enjoyed administration control for the largest proportion of congresses. Also, one of the prime predictors of reelection is presidential popularity (Brody and Sigelman, 1983; Sigelman, 1979), and the lower house, consisting of members all up for reelection every 2
years, is most prone to directly mirror the popularity of the president's party and, indirectly, the president's own standing with the populace. Concerning the third
predictor, it is reasonable to expect that the American people will reelect a
president when the nation is at war during election time-that they will not "change horses midstream." If popularity is one of the best predictors of elec- tion success, one of the best predictors of popularity is whether the nation is facing an international crisis, in which case a "rally around the flag" effect occurs (Kernell, 1978; Mueller, 1973).
If we regress reelection on these three predictors we obtain an equation that accounts for 54% of the variance. Reelection is positively associated with re- nomination (b = 0.47, p = 0.45), control of the lower house (b = 0.29, 3 =
0.29), and going up for a second term when the nation is at war (b = 0.39, 3 = 0.27). A stepwise procedure added another variable to the equation, namely, whether the president's father was also involved in politics, nationally or locally (b = -0.30, 3 = -0.27). Simonton (1981b) found earlier that a long tenure in office is connected with not having a father who was active in local or national politics.
The predictors of reelection that are the most general (in the sense of applying to all presidents) are renomination and control of the House. Control over the lower house of congress at election time has but one plausible predictor, namely, the proportion of the House represented by the president's party when he first entered office (b = 0.028, 1 = 0.58), and only 34% of the variance is so explained. This initial control of the House is, in turn, a positive function of being a Democratic president (b = 7.8, 1 = 0.38), an edge of almost eight percentage points. This last outcome is consistent with the fact that Democrats tend, on the average, to be longer tenured (Simonton, 1981b).
Given that renomination is the central predictor of reelection, this analysis ends by determining why some presidents are asked to serve another term. Logic dictates two factors: First, a president may simply decline to run; second a president may die during his first term, whether naturally or by assassination. Hence, renomination was regressed on these two predictors and then other vari- ables were allowed to enter the equation by a stepwise procedure. The resulting regression equation accounted for 77% of the variance in nomination. As pre- dicted, presidents were not nominated if they declined to run (b = -0.74, p =
-0.53) or if they died in office (b = -0.70, P = -0.42). In addition, presidents are more prone to be renominated if a great quantity of legislation is passed during their first term (b = 0.0002, 1 = 0.19) and if the president enjoyed a large margin of party control in the House at convention time (b = 0.01, B =
274

Presidential Greatness
0.34). Besides these legislative factors, presidents are more likely to be renomi- nated if they were considered presidential material prior to entering the White House in the first place (b = 0.24, ,B = 0.24). By "presidential material" I mean that the president had run for president before, whether in the primaries or in the general election, or had at least been put up for nomination at party conventions or caucusses. This factor also is similar to Simonton's (1981b) finding that dark horse candidates are less likely to have long tenures in office.
To sum up, though the primary predictor of years in office is reelection, and reelection depends mostly on renomination, other factors feed into this sequence. Most significantly, reelection is affected by having control over the House and
being a wartime president at the time of the election, and renomination is influ- enced by riding a large margin of control over the House, signing an impressive number of bills, and having been considered presidential material before entering the presidency.
Individual/Situational Interactions
Though the emphasis has been on identifying the antecedents of a single predictor of the presidential ratings, an attempt was made to check whether the other four greatness predictors had any antecedents of interest. As anticipated, the result was not very enlightening. Status as a war hero was predictably associated with the other indicators of military experience, but the other great- ness predictors had less definite results. Of special note is that fact that none of the measures of presidential motivation-the power, achievement, and affilia- tion needs as assessed by Winter and Stewart (1977) and Wendt and Light (1976)-proved of predictive value. This outcome is surprising given their sug- gestions that the power motive should be linked with the president's tendency to engage in military activity and to become the target of assassination attempts and that the affiliation motive should be connected with the president's tendency to have a major scandal in his administration.
Speaking more generally, it is curious how little of presidential greatness can be rooted, whether directly or indirectly, in the president's personal attri- butes. Family background, formal education, personality traits, occupational origin, and political experience have minimal predictive utility. The diminuative role played by the president's political resume is particularly striking, for politi- cal experience has been assessed over four dozen ways.
One interpretation may be that individual factors do not operate as main effects, but only in interaction with situational factors. Theories of leadership often emphasize that if individual variables participate at all, it is largely in interaction with situational constraints and opportunities (e.g., Simonton, 1985a). So far, we have not inspected the data for Individual x Situational interaction
275

effects. The problem with doing so, of course, is that the number of possible two-
way interactions is astronomical. Because we have at our disposal literally hundreds of potential predictors about equally divided between individual and situational variables, thousands of interaction terms can be generated by simple permutation. Rather than even attempt such a prohibitive task, I have confined attention to a couple of hypotheses that seem most plausible.
The first hypothesis ensues from Stewart's (1977) model of the connection between birth order and the political zeitgeist. Stewart argued that certain kinds of political situations favor leaders with a specific interpersonal disposition and that this disposition is a product of birth order. Now one of the most reliable predictors of presidential greatness was the number of war years, and Stewart suggests that first borns are best equipped for that context. Accordingly, statis- tical tests were run for Birth Order by War Years interactions, where birth order was operationalized 25 distinct ways (e.g., all siblings versus male siblings only, maternal versus paternal siblings or all siblings together, special terms for first borns and middle children, etc.). No interactions were found. Hence, there is no evidence that the impact of birth order is moderated by whether the nation is at war.
The second hypothesis is that the president's prior occupational and political experiences may only be useful if his party has control of congress. Conceivably, the same trait that is an asset when the president and congress are of the same party might become a liability when Capitol Mall is a "no man's land" between a White House of one persuasion and a Capitol Hill of another. Therefore, nearly a dozen interaction terms were scrutinized that concerned how a president's attributes may depend on his party's control of congress. The latter was gauged by the proportion of the Senate and the House represented by the president's party. The individual factors were whether the president practiced law as a profession, how many years he served in the Senate and in the House, the total years he had in public office prior to his election, whether he was a dark horse candidate, and the percentage of the electoral vote that he received on election day (a "mandate from the people" measure). Not one of these two-way interac- tion effects was statistically or substantively significant.
Admittedly, even if I have inspected some of the more obvious Individual x Situational effects, a crucial interaction term may have been inadvertently ig- nored. But we can conclude that so far such an Individual x Situational effect has yet to be isolated.
DISCUSSION
Beyond any doubt there exists a substantial consensus on the relative merits of American presidents. Further, a president's greatness score can be successful-
276 Simonton

Presidential Greatness
ly predicted via a mere handful of predictors. This prediction equation accounts for about three quarters of the variance, is transhistorically invariant, and con- tains at least three or four predictors that replicate across all greatness indicators. Thus, in a quantitative sense, this inquiry has been quite successful. But what do the predictors actually tell us about the meaning of these greatness assessments?
On the one hand, ratings of presidential greatness may truly reflect the differential quality of political leadership displayed by American chief execu- tives. This interpretation, naturally, is the one assumed by the experts and laypersons who engage in such ratings. Further, the early content analytical research suggested that several predictors of greatness may result from underly- ing motivational dispositions (Wendt and Light, 1976; Winter, 1973; Winter and Stewart, 1977). If the power motive can be held responsible for a president becoming a wartime commander-in-chief and even for being assassinated, and if the affiliation motive is a hidden cause of administration corruption, then presi- dential greatness may indeed be the ultimate outcome of a constellation of personality traits. Even the war hero predictor may only serve as a proxy index of power motivation. In this view, a highly successful presidency is one founded on a high need for power and a low need for affiliation.
To be sure, only four of the five predictors can be explicated in these terms, for no one to date has shown how personality may provide the basis for a long tenure in office. Even so, it may be argued that the predictive value of years in office may merely indicate that great presidents are more prone to get reelected. In fact, given that wartime chief executives are reelected, and if the power motive creates a proclivity for entering the United States into a war, then tenure duration may be a result of a personalty trait-though this positive repercussion is partly counterbalanced by the supposed tendency of power-driven presidents to get themselves assassinated. All in all, it is possible to make a case that the five predictors of greatness reveal the quality of political leadership exhibited by a president. Chief executives who serve many years, lead the nation through many years of war, avoid scandals, are assassinated, and who entered office as national war heroes may really be better leaders.
On the other hand, we can counterpose several facts that do not live comfort- ably with the foregoing interpretation. In the present inquiry, which exploited multivariate methods, none of the personality variables contributed to the predic- tion of assessed greatness, whether directly or indirectly. Specifically, the power, achievement, and affiliation motives, interpersonal dominance and extroversion orientations, and dogmatism (idealistic inflexibility) predicted neither greatness nor the predictors of greatness. Even biographical factors, including items drawn from the president's political resume, had very little predictive worth. Tests for Individual x Situational Interactions did not improve this state of affairs.
Moreover, a detailed analysis of the predictors divulges some pecularities that do not dovetail well with a dispositional attribution. Why is it that the
277

number of years of war is a primary predictor rather than whether the president delivered a war message to congress? Certainly the president has more control over the latter event than the former, and thus delivery of a war message should more accurately mirror any power inclination.
In a similar vein, if years in office just reflects the fact that good presidents are reelected while bad presidents fail to be returned to office, then why is it that reelection did not emerge as a direct predictor of presidential greatness? An indicator (years in office) cannot replace the underlying construct (reelection) so
long as both are measured with equal reliability coefficients, and the reliabilities for these two variables are both unity.
Such puzzles inspire the alternative suggestion that assessments of presiden- tial greatness inform us more about how people make political attributions than about how well presidents actually performed in office (Simonton, 1981b, 1984a). Several findings can be cited in support of this rival hypothesis.
Historiometric research on the eminence of political leaders tends to endorse an eponymic position (Simonton, 1984b). That is, the place of political figures in the eyes of posterity is primarily determined by their value as names for epochs of history. Leaders are essentially symbols-convenient names for the events of the past. For example, long-tenured leaders tend to be more famous than short- tenured leaders, for the longer a leader serves the more events can be tallied under his or her name. Further, war tends to generate the sort of events most favored by historians who like to spice up narratives with invasions, battles, sieges, and the like.
Although a leader's personal qualities may enter into the determination of his or her eponymic value, these attributes operate in a peculiar fashion. For instance, a leader's morality bears not a positive linear relationship with histor- ical distinction but rather a curvilinear inverted-U relation: Eminence is attained by being either famously moral or infamously immoral (Simonton, 1984b). What is crucial is that the leader's personal traits, like the events of the leader's reign, make him or her stand out in the crowd, against the backdrop of nondescript nonentities.
In light of this finding it is valuable to report an incidental discovery in the present investigation. Though the dogmatism measure derived from the Maranell (1970) measures of idealism and flexibility did not correlate with the greatness measures in a linear manner, dogmatism does feature a curvilinear relationship. If Maranell Factor I (greatness) is regressed on the linear and quadratic functions of Maranell Factor II (idealistic inflexibility versus pragmatic flexibility), the quadratic term has a positive and statistically significant regression coefficient (b = 0.33, P = 0.51). The same outcome ensues when any of the three most recent greatness measures (Porter, Chicago Tribune, and Murray-Blessing) are re- gressed on the bipolar dogmatism measure. Uniformly, across all measures, those presidents with the highest assessed greatness tend to be either the most dogmatic (idealistically inflexible) or the least dogmatic (pragmatically flexible).
278 Simonton

Presidential Greatness
Research on a president's approval rating in polls of the American people implies that presidential popularity is not always dependent upon personal at- tributes and behaviors (Kernell, 1978; Mueller, 1973). International crises, as an example, instantaneously heighten a president's standing with survey respon- dents, this despite his often very tenuous causal connection with the events. Likewise, the state of the economy, particularly if recession sets in, affects the president's approval rating even if his personal control over the economic fluctu- ations is minimal (Kenski, 1977). Indeed, as Van Buren and Hoover both sadly learned, the incumbent may have to pay for the economic sins of his predecessor. Leaders are symbols that focus credit or blame for events (Brody and Page, 1975). As Leo Tolstoy expressed it in his War and Peace, "the so-called great men are labels giving names to events, and like labels they have but the smallest connection with the event itself."
Naturally, if historians rating past presidents and if survey respondents rating incumbents were both fully objective in their evaluations, their judgments would not be based on events that are poor indicators of the president's lead- ership qualities. Yet investigations into the attribution process have indicated that we are all inclined to commit the "fundamental attribution error" (Ross, 1977). When evaluating another we tend to focus on the individual, overlook the situa- tional constraints, and attribute acts to the person's dispositional characteristics. The masses and historians alike may be guilty of this attributional bias. Whatever happens may be ascribed to the president apart from any causal relevance he may actually have, while the situational factors largely if not entirely responsible for the events may be utterly ignored.
Aggravating this bias all the more is the role of salience (McArthur, 1981). Salient events carry far more weight in attributions than those less so, yet sali- ence may bear little relation with causal importance. We consequently can com- prehend why the factors that best predict greatness all concern conspicuous, even dramatic events. The five predictors uniformly regard characteristics of the presi- dent that are likely to be known to any American historian willing to assess presidential greatness. Salience singles these facts out, while the attribution error misleads the historian to assume that such facts imply something immediate about the president's disposition, as a leader.
To illustrate how this might work, we can refer to an investigation em- ploying the semantic differential which has shown that "leadership" connotes goodness, strength, and activity (Jenkins et al., 1958). Conceivably, salient events are taken as signs of how a president stacks up on these criteria: A long- tenured president, having more events to his credit regardless of what he may actually do, may be viewed as active; a wartime president and a former war hero may look strong; a scandal-ridden administration must have a bad person at the helm, whereas assassinated presidents must be good. When making these attribu- tions, historians are functioning as people, falling into the same psychological traps that ensnare respondents to the pollsters.
279

The theoretical interpretation just sketched can be discounted if research can
prove that assessments of presidential greatness are in the last analysis grounded in the personal qualities of the chief executive. There are several directions that investigators may go to establish a dispositional basis for greatness, but two avenues may stand out. In the first place, a wider range of personality attributes may need to be considered. For instance, a number of studies have indicated how the Gough Adjective Check List may be usefully applied to the assessment of leaders, historical and otherwise (Constantini and Craik, 1980; Simonton, 1983b). Hitherto the emphasis has been on content analytical measures of motives, so perhaps this alternative will better tease out the personological antecedents of greatness.
Second, further investigations might constructively narrow attention to spe- cific acts of leadership rather than global evaluations of "greatness." A presi- dent's success as a legislator may be most promising in this respect. As noted earlier, the volume of bills signed in a president's first term emerged as a direct predictor of renomination, and hence in causal sequence, reelection, a long tenure in office, and high greatness evaluations. Additionally, Alker (1981) has pointed out that legislative behavior may provide a clue about political creativity, a potential attribute of greatness. Analysis of legislative leadership may most advantageously proceed by changing the unit of analysis from the individual to some unit of time, such as congresses or even congressional sessions. Such time- series units have already been successfully applied to the analysis of a president's veto behavior (Copeland, 1983; Lee, 1975; Simonton, 1985b).
Until these methodological modifications are adopted and prove fruitful, we are left with this (albeit tentative) interpretation: The presidential greatness rat- ings reveal how people make attributions about political leadership, attributions that are predicated on facts that have relatively little to do with a president's true performance.
ACKNOWLEDGMENTS
The computer analyses reported in this paper were made possible by a generous grant from the University of California. I thank Melisse Bouziane and Jon Landsworth for their assistance.
APPENDIX
Table A-I presents standardized scores for 16 distinct measures from Schlesinger's 1948 poll to the Murray-Blessing 1983 survey. When necessary scores have also been inverted so that all go in the same direction. A positive
280 Simonton

Table A-I, Assessments of Former Presidents from 1948 to 1983
Schlesinger Maranell Murray-Blessing
Number President 1948 1962 Bailey Rossiter Sokolsky Prestige Strength Activeness Idealism Flexibility Accomplish Information Porter Chicago Rating Controversial
1 Washington 1.53 1.54 1.65 1.22 2 J. Adams 0.70 0.66 -0.55 0.50 3 Jefferson 1.17 1.21 1.21 1.22 4 Madison 0.12 0.44 -0.66 -0.93 5 Monroe 0.35 -022 0.88 -0.93 6 J. Q. Adams 0.47 0.33 -1.54 0.22 7 Jackson 1.06 1.10 0.99 1.22 8 Van Buren 0.00 -0.11 0.55 -0.22 9 W. Harrison - -
10 Tyler -0.82 -0.99 -0.22 -0.22 11 Polk 0.59 0.88 -0.11 0.50 12 Taylor -1.17 -0.88 -0.77 13 Fillmore -1.06 -1.10 -0.33 -0.93 14 Pierce 1.41 -1.32 -1.10 -1.65 15 Buchanan 1.29 -1.43 -1.21 1.65 16 Lincoln 1.64 1.65 1.54 1.22 17 A. Johnson -0.47 -0.77 -1.65 0.50 18 Grant -1.53 -1.54 -0.88 -1.65 19 Hayes 0.23 0.22 0.77 0.50 20 Garfield -
21 Arthur -0.23 -0.55 0.22 0.22 22 Cleveland 0.82 0.55 0.11 0.50 23 B. Harrison -0.70 -0.44 -0.44 -0.93 24 McKinley -0.35 0.11 0.66 -0.22 25 T. Roosevelt 0.94 0,99 1.32 1.22 26 Taft -0.12 0.00 0.00 -0.22 27 Wilson 1.29 1.32 1.10 1.22 28 Harding 1.64 -1.65 -1.43 1.65 29 Coolidge -0.94 -1.21 -0.99 -0.93 30 Hoover -0.59 -0.33 -1.32 -0.22 31 F. D. Roosevelt 1.41 1.43 1.43 1.22 32 Truman - 0.77 0.44 1.22 33 Eisenhower - -0.66 0.33 0.50 34 Kennedy - -
35 L B. Johnson - -
36 Nixon - -
37 Ford - -
38 Carter -
0.60 1.78 0.89 0.60 0.61 0.41 1.44 1.47 1.18
-0.23 023 0.05 -0.23 0.17 -0.02 -0.23 0.16 -0.22
1.44 0.87 1.37 -0.23 -0.37 -0.34
-0.23 -0.78 -0.72 0.60 0.30 0.55
-1.07 -0.96 -0.72 - 1.07 -1.19 -1.22 -1.07 -1.29 -1.33 -1.07 -1.28 -1.19
1.44 2.10 1.74 -0.23 -0.30 -040 -1.90 -1.50 -1.36 -0.23 0.59 -0.69
-0.23 -0.52 -0.68 0.60 0.25 0.18
-1.07 -0.89 -0.97 -023 -0.39 -0.30
1.44 1.18 1.36 -0.23 -0.05 -0.17
1.44 1.01 1.35 -1.90 -1.84 -1.66 -1.07 -0.99 -1.17 -0.23 -0.09 -0.23
1.44 1.57 1.98 0.60 0.94 1.06
-0.23 -0.29 -0.43 1.44 0.63 0.68
0.06 1.00
0.44 0.34 0.91 0.03
-0.06 0.01 1.51
-0.24
-0.56 0.59
-0.86 -1.22 -1.29 -1.26
0.93 0.12
-1.37 -0.74
-0.69 0.20
-0.95 -0.34
1.61 -0.16
1.05 -1.66 -1.37 -0.14
2.06 1.25
-0.59 1.06 1.39
-0.41 -0.20
0.81 0.55 0.40 1.18
-0.74 -0.47
0.09 -1.44
0.01 0.36
-0.17 -0.02 -0.61
0.66 -0.55 -0.29
-0.45 0.08
-0.33 -0.25 -0.57 -0.04 4.23
-0.81 -1.41
1.00 -0.62 -0.44 0.13 1.14
-1.01
0.57 -0.85
1.35 0.58 1.03
-1.15 -1.40
0.19
-1.09 -0.19 -0.76
0.27 0.16 0.01 1.50
-2.18 0.59 0.14
0.18 -0.88 0.19 0.49 0.19 0.01
-2.23 1.71
-0.83 -1.01
1.31 0.31 1.21 1.61
-0.47
1.72 0.37 1.31 0.10 0.13
-0.24 0.83
-0.46
-0.80 0.50
-0.99 -1.14 -1.25 -1.14
2.07 -0.40 -1.38 -0.64
-0.52 0.11
-0.86 -0.21
1.26 -0.01
1.11 -1.61 -1.20 -0.29
1.91 1.12
-0.32 0.36 0.53
0.86 1.57 1.57 1.87 0.26 0.81 0.33 0.59 1.11 1.38 1.28 1,52 0.02 0.52 0.14 0.23
-0.31 0.14 0.24 0.19 -0.14 .05 -0.05 0.13
1.08 1.09 1.09 1.02 -0.56 -0.05 0.05 -0.32
- 1.29 -0.90 -0.90 -0.83 -0.26 0.90 0,81 0.42 -1.38 -0.81 -0.71 -0.70 -1.72 -1.00 -1.19 -0.86 -1.73 -1.38 -1.38 -1.11 -0.98 -1.57 -1.47 -1.27
1.42 1.66 1.66 1.99 0.03 -1.19 -1.09 -1.23
-0.05 -1.28 -1.28 -1.35 -1.06 -0.14 -0.33 -0.38
-1.32 -0.52 -0.52 -0.53 -0.29 0.33 0.52 0.12 -1.52 -0.62 -0.62 -0.66 -0.33 0.24 0.71 -0.16
1.20 1.28 1.38 1.34 0.09 -0.24 -0.14 -0.23 1.42 1.19 1.19 1.22
-0.15 -1.66 -1.66 -1.60 -0.37 -1.09 -1.00 -0.87 0.24 -0.33 -0.24 -036 1.52 1.47 1.47 1.91 1.08 1.00 1.00 0.92 0.82 0.62 0.90 0.48 1.18 0.43 0.43 0.36 1.12 0.71 0.62 0.58
--1.47 -1.57 -1.30 - -0.71 -0.43 -0.60 - -0.43 -0.81 -0.63
-1.38 0.31 0.11 0.52
-0.57 1.19 1.33
-0.84
-0.36 0.99
-0.70 -0.36 -0.77 -0.23 -2.40
1.12 0.11
-1.04
-0.57 0.18
-1.04 -0.50 -0.36 -0.50
0.99 -0.64 -0.43
1.53 -1.65
1.06 0.24 0.58 1.60 2.00
-0.50 0.99
""

score signifies that the president is above the mean, a negative score below the mean, and a score near zero indicates relative mediocrity. Missing ratings are noted for those presidents prior to Reagan.
REFERENCES
Alker, H. A. (1981). Political creativity. In Wheeler, L. (ed.), Review of Personality and Social Psychology, Vol. 1, Sage Publications, Beverly Hills, Calif., pp. 167-188.
Armbruster, 1. E. (1982). The Presidents of the United States and Their Administrations from Washington to Reagan, 7th ed., Horizon Press, New York.
Bailey, T. A. (1966). Presidential Greatness, Wiley, New York. Brody, R. A., and Page, B. I. (1975). The impact of events on presidential popularity: The Johnson
and Nixon administrations. In Wildavsky, A. (ed.), Perspectives on the Preisdency, Little, Brown, Boston, pp. 136-148.
Brody, R., and Sigelman, L. (1983). Presidential popularity and presidential elections: An update and extension. Public Opinion Quart. 47: 325-328.
Carruth, G. (ed.) (1979). The Encyclopedia of American Facts and Dates, 7th ed., Crowell, New York.
Constantini, E., and Craik, K. H. (1980). Personality and politicians: California party leaders, 1960-1976. J. Personal. Social Psychol. 38: 641-661.
Copeland, G. W. (1983). When congress and the president collide: Why presidents veto legislation. J. Politics 45: 696-710.
Current Biography (1940-83). Wilson, New York. Encyclopaedia Britannica (1974). 15th ed., Encyclopaedia Britannica, Chicago. Etheredge, L. S. (1978). Personality effects on American foreign policy, 1898-1968: A test of
interpersonal generalization theory. Am. Pol. Sci. Rev. 78: 434-451. Hammond, T. H., and Fraser, J. M. (1984). Judging presidential performance on House and Senate
roll calls. Polity 16: 624-646. Jenkins, J. J., Russell, W. A., and Suci, G. (1958). An atlas of semantic profiles for 360 words. Am.
J. Psychol. 71: 688-699. Kane, J. N. (1974). Facts about the Presidents, 3rd ed., Wilson, New York. Kane, J. N. (1977). Facts about the Presidents: Supplement to the Third Edition, Wilson, New York. Kenski, H. C. (1977). The impact of economic conditions on presidential popularity. J. Politics 39:
764-773. Kernell, S. (1978). Explaining presidential popularity: How ad hoc theorizing, misplaced emphasis,
and insufficient care in measuring one's variables refuted common sense and led conventional wisdom down the path of anomalies. Am. Pol. Sci. Rev. 72: 506-522.
Kimmitt, J. S., and Haley, R. K. (1978). Presidential Vetoes, 1789-1971, U. S. Government Printing Office, Washington, D. C.
Kull, I. S., and Kull, N. M. (1952). A Short Chronology of American History 1492-1950, Rutgers University Press, New Brunswick, N.J.
Kynerd, T. (1971). An analysis of presidential greatness and "presidential rating." Southern Quart. 9: 309-329.
Lee, J. R. (1975). Presidential vetoes from Washington to Nixon. J. Politics 37: 522-546. Maranell, G. M. (1970). The evaluation of presidents: An extension of the Schlesinger polls. J. Am.
Hist. 57: 104-113. McArthur, L. Z. (1981). What grabs you? The role of attention in impression formation and causal
attribution. In Higgins, E. T., Herman, C. P., and Zanna, M. P. (eds.), Social Cognition, Erlbaum, Hillsdale, N.J.
Morris, R. B. (1976). Encyclopedia of American History, Bicentennial ed., Harper and Row, New York.
Mueller, J. E. (1973). War, Presidents and Public Opinion, Wiley, New York.
Simonton 282

Presidential Greatness
Murray, R. K., and Blessing, T. H. (1983). The presidential performance study: A progress report. J. Am. Hist. 70: 535-555.
Nice, D. C. (1984). The influence of war and party system aging on the ranking of presidents. Western Pol. Quart. 37: 443-455.
Ross, L. (1977). The intuitive psychologist and his shortcomings: Distortions in the attribution process. In L. Berkowitz (ed.), Advances in Experimental Social Psychology, Vol. 10, Academic Press, New York.
Rossiter, C. (1956). The American Presidency, Harcourt, Brace, New York. Schlesinger, A. M. (1949). Paths to the Present, Macmillan, New York. Schlesinger, A. M. (1962). Our presidents: A rating by 75 historians. New York Times Magazine July
29, 12-13. Sigelman, L. (1979). Presidential popularity and presidential elections. Public Opinion Quart. 43:
532-534. Simonton, D. K. (1976). Biographical determinants of achieved eminence: A multivariate approach
to the Cox data. J. Personal. Social Psychol. 33: 218-226. Simonton, D. K. (1981a). Predicting presidential greatness with historical data: Challenges and
difficulties. In Alker, H. A. (chair), Testing the Limits of Measurement in Political Psychol- ogy, Symposium presented at the meeting of the International Society of Political Psychol- ogy, Mannheim.
Simonton, D. K. (1981b). Presidential greatness and performance: Can we predict leadership in the White House? J. Personality 49: 306-323.
Simonton, D. K. (1981c). The library laboratory: Archival data in personality and social psychology. In Wheeler, L. (ed.), Review of Personality and Social Psychology, Vol. 2, Sage Publica- tions, Beverly Hills, Calif., pp. 217-243.
Simonton, D. K. (1983a). Formal education, eminence, and dogmatism: The curvilinear rela- tionship. J. Creative Behav. 17: 149-162.
Simonton, D. K. (1983b). Intergenerational transfer of individual differences in hereditary monarchs: Genes, role-modeling, cohort, or sociocultural effects? J. Personal. Social Psychol. 44: 354-364.
Simonton, D. K. (1984a). Genius, Creativity, and Leadership, Harvard University Press, Cambridge, Mass.
Simonton, D. K. (1984b). Leaders as eponyms: Individual and situational determinants of monarchal eminence. J. Personality 52: 1-21.
Simonton, D. K. (1985a). Intelligence and personal influence in groups: Four nonlinear models. Psychological Review 92: 532-547.
Simonton, D. K. (1985b). The vice-presidential succession effect: Individual or situational determi- nants? Political Behav. 7: 79-99.
Sokolsky, E. (1964). Our Seven Greatest Presidents, Exposition Press, New York. Sorokin, P. A. (1925). Monarchs and rulers: A comparative statistical study. I Social Forces 4:
22-35. Stewart, L. H. (1977). Birth order and political leadership. In Hermann, M. G. (ed.), The Psycholog-
ical Examination of Political Leaders, Free Press, New York, pp. 205-236. Taylor, T. (1972). The Book of Presidents, Aro Press, New York. United States Statutes at Large, Vols. 1-95. (1845-1982). Little, Brown, Boston, and U.S. Govern-
ment Printing Office, Washington, D. C. Webster's Guide to American History. (1971). Merriam, Springfield, Mass. Wendt, H. W., and Light, P. C. (1976). Measuring "greatness" in American presidents: Model case
for international research on political leadership? European J. Social Psychol. 6: 105-109. Whitney, D. C. (1982). The American Presidents, 5th ed., Doubleday, Garden City. Winter, D. G. (1973). The Power Motive, Free Press, New York. Winter, D. G., and Stewart, A. J. (1977). Content analysis as a technique for assessing political
leaders. In Hermann, M. G. (ed.), The Psychological Examination of Political Leaders, Free Press, New York, pp. 27-61.
283