Embed Size (px)
Citation preview

Presenting with Power:
Effectively and Dynamically
Communicating Your Work
Christina Bourgeois
Georgia Institute of Technology
School of Electrical and Computer Engineering
March 28, 2013
80% of Your Presentation
Will Be Forgotten
• People tend to remember
– Tone
– Pace
– Nonverbal expressions
Planning Your Presentation
• What key points do you want your
audience to remember?
• Structure your talk around the points and
find ways to illustrate them.
• Have a clear beginning, middle, and end
to your talk.

Common Types of
Presentations
• Research
• Design
• Instructive / Demonstrative (How To)
• Informative

What? Why? How?
• The purpose of a research presentation is
to summarize
• WHAT you have been working on
• WHY it is important
• HOW you conducted your research
• Focus is usually on the
Results!
Content Guidelines for a
Research Presentation
• Title slide (Highly descriptive title)
• Acknowledgements / Sponsors
• Research Question or Objectives/Goals
• Background
• Methodology (or Technical Approach)
• Results
• Discussion of Results
• Conclusions
• Future Work
The Design Process
• The purpose of a design presentation is to
summarize
• The design process
• What you did
• Why you did it that way
• How you did it
• Focus is on the process (your methods,
how you implemented the design)
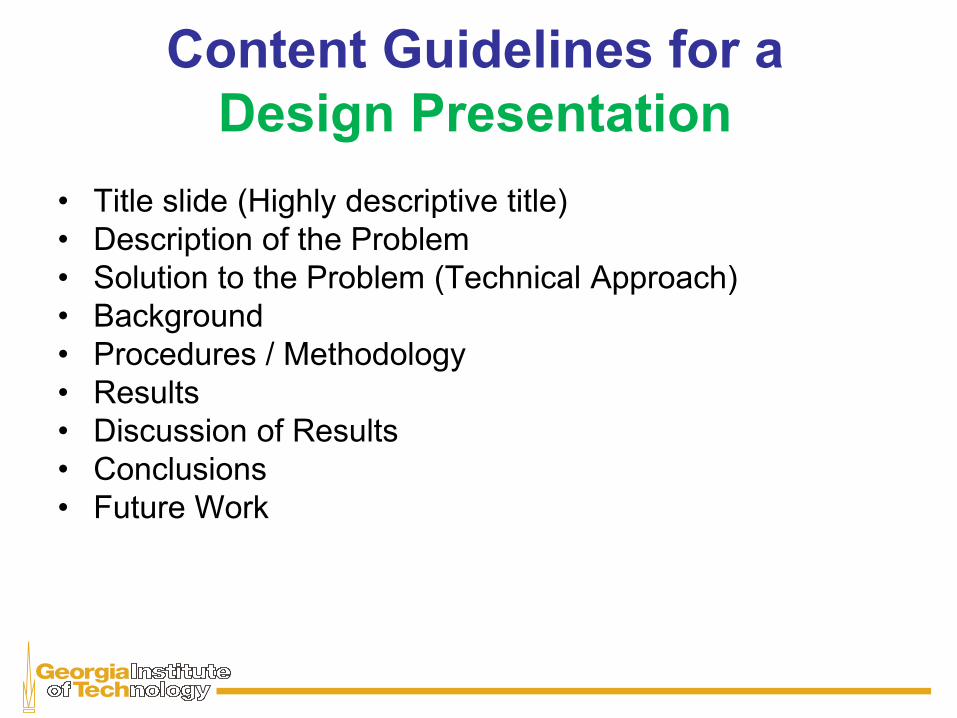
Content Guidelines for a
Design Presentation
• Title slide (Highly descriptive title)
• Description of the Problem
• Solution to the Problem (Technical Approach)
• Background
• Procedures / Methodology
• Results
• Discussion of Results
• Conclusions
• Future Work

How To…?
• The purpose of an instructive/
demonstrative presentation is to explain
• How to do something
• Why it should be done
• When it should be done
• Focus is always on the user
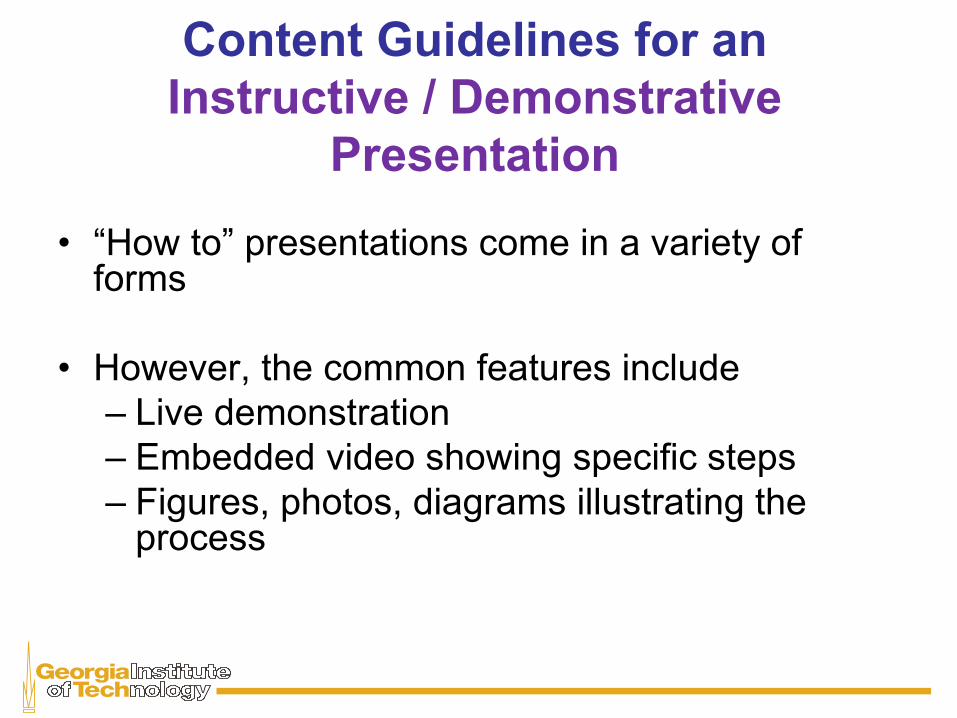
Content Guidelines for an
Instructive / Demonstrative
Presentation
• “How to” presentations come in a variety of forms
• However, the common features include
– Live demonstration
– Embedded video showing specific steps
– Figures, photos, diagrams illustrating the process
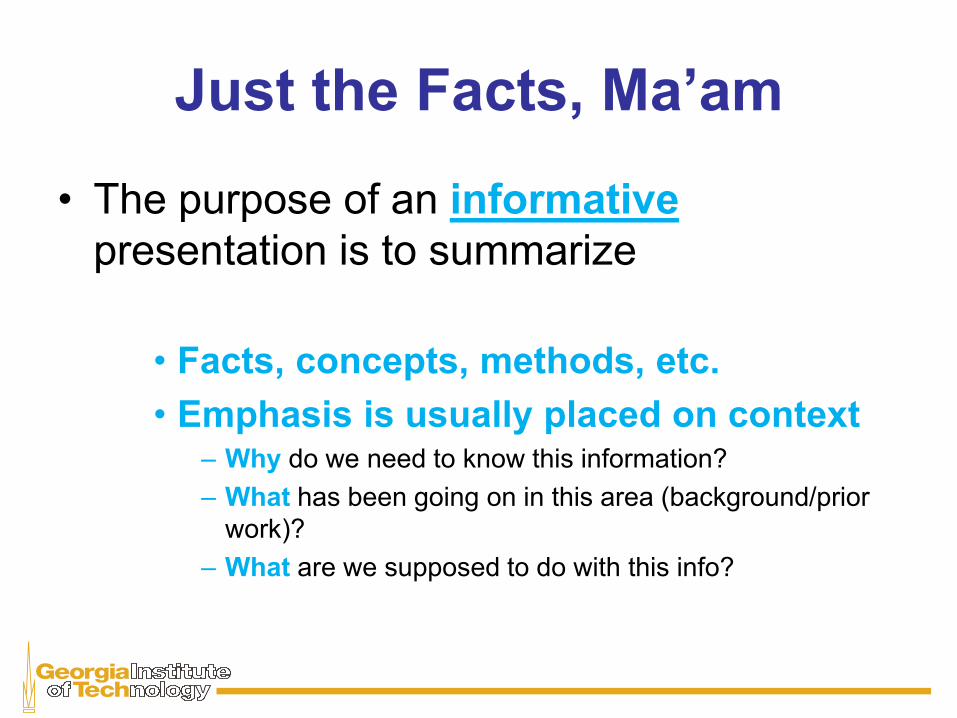
Just the Facts, Ma’am
• The purpose of an informative
presentation is to summarize
• Facts, concepts, methods, etc.
• Emphasis is usually placed on context – Why do we need to know this information?
– What has been going on in this area (background/prior
work)?
– What are we supposed to do with this info?
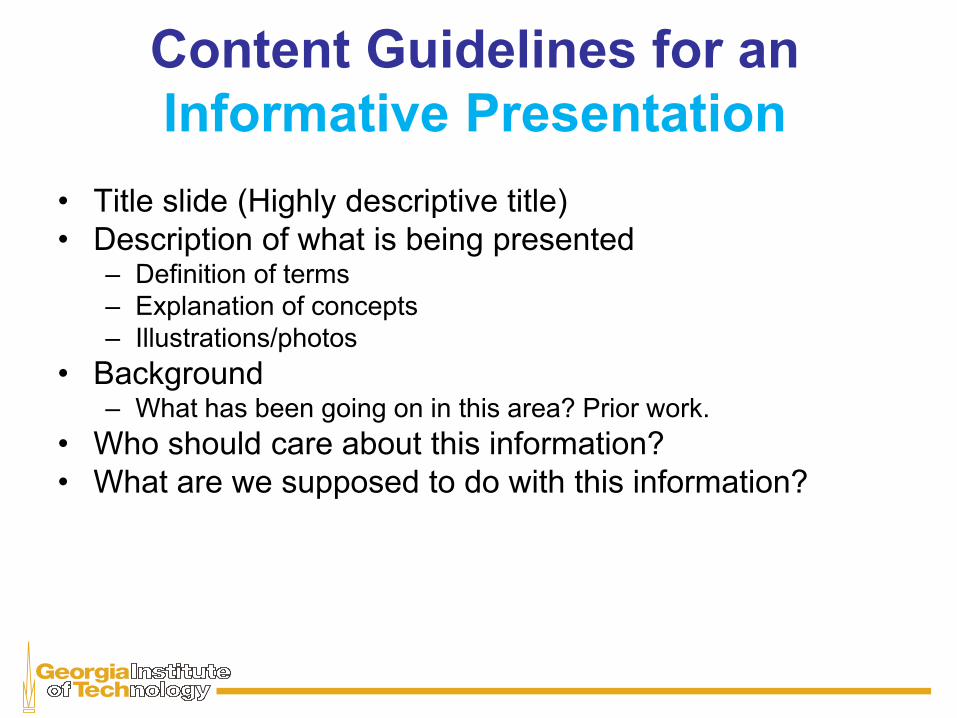
Content Guidelines for an
Informative Presentation
• Title slide (Highly descriptive title)
• Description of what is being presented – Definition of terms
– Explanation of concepts
– Illustrations/photos
• Background – What has been going on in this area? Prior work.
• Who should care about this information?
• What are we supposed to do with this information?
Customize Content for
the Audience
• Who will be in the audience?
• What are their expectations?
• Are you presenting new material or building upon prior knowledge?
• How many attendees?
• Will the talk be interactive?
• How much time is allotted for the talk?
PowerPoint Do’s
• Include a descriptive title/heading line on every slide.
• Keep slides simple and uncluttered by using short phrases, not long sentences.
• Use consistent capitalization and punctuation on all slides.
• Use consistent verb tense on all bullet items.
• Number your slides.
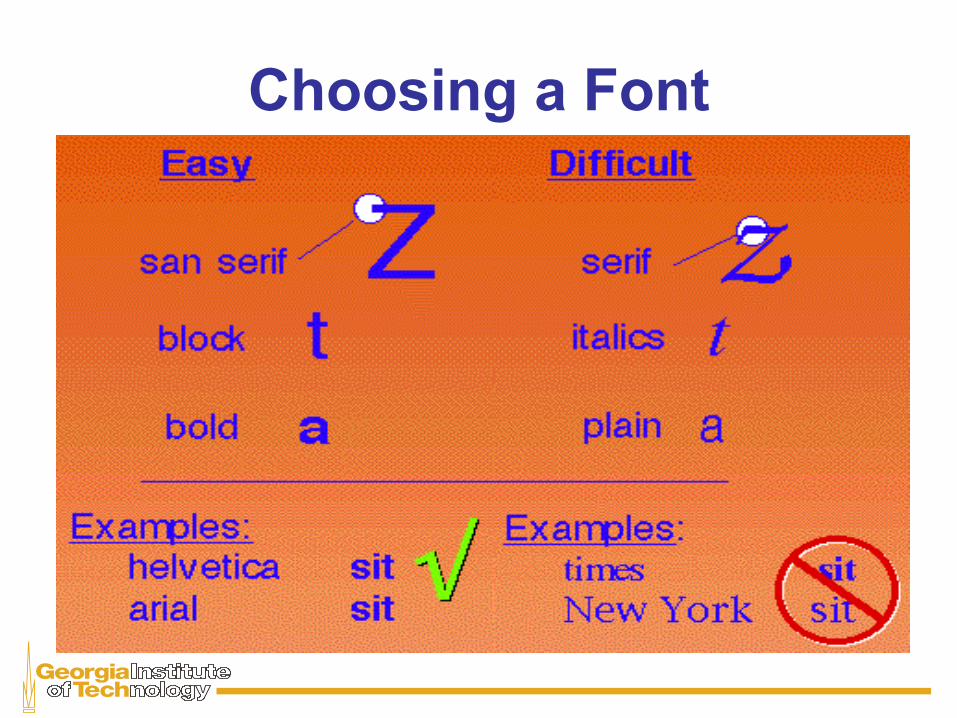
Choosing a Font
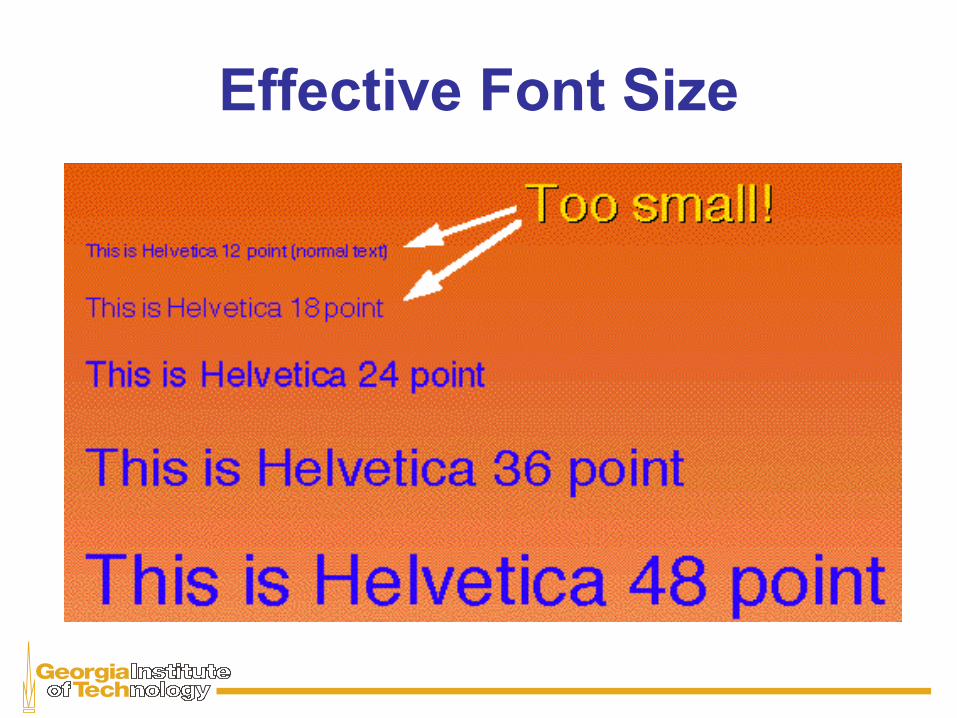
Effective Font Size
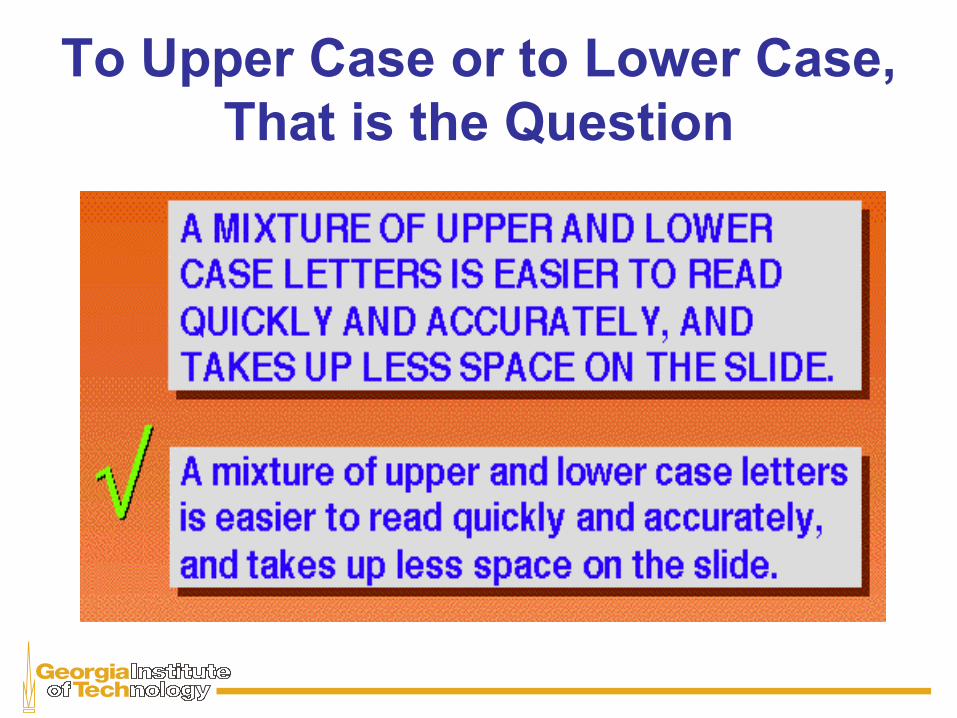
To Upper Case or to Lower Case,
That is the Question
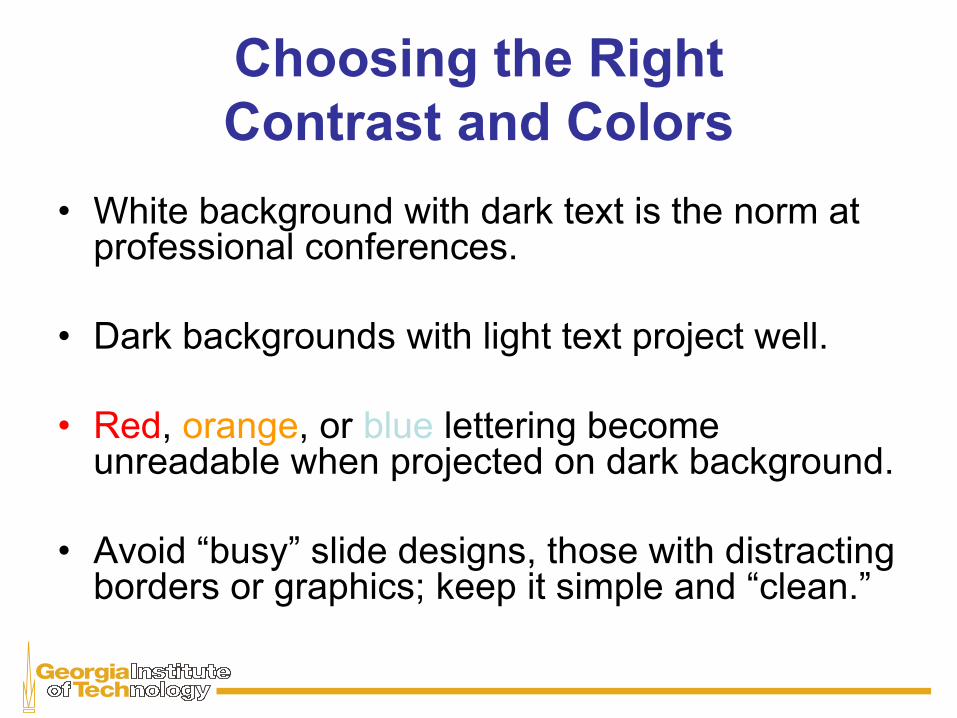
Choosing the Right
Contrast and Colors
• White background with dark text is the norm at professional conferences.
• Dark backgrounds with light text project well.
• Red, orange, or blue lettering become unreadable when projected on dark background.
• Avoid “busy” slide designs, those with distracting borders or graphics; keep it simple and “clean.”
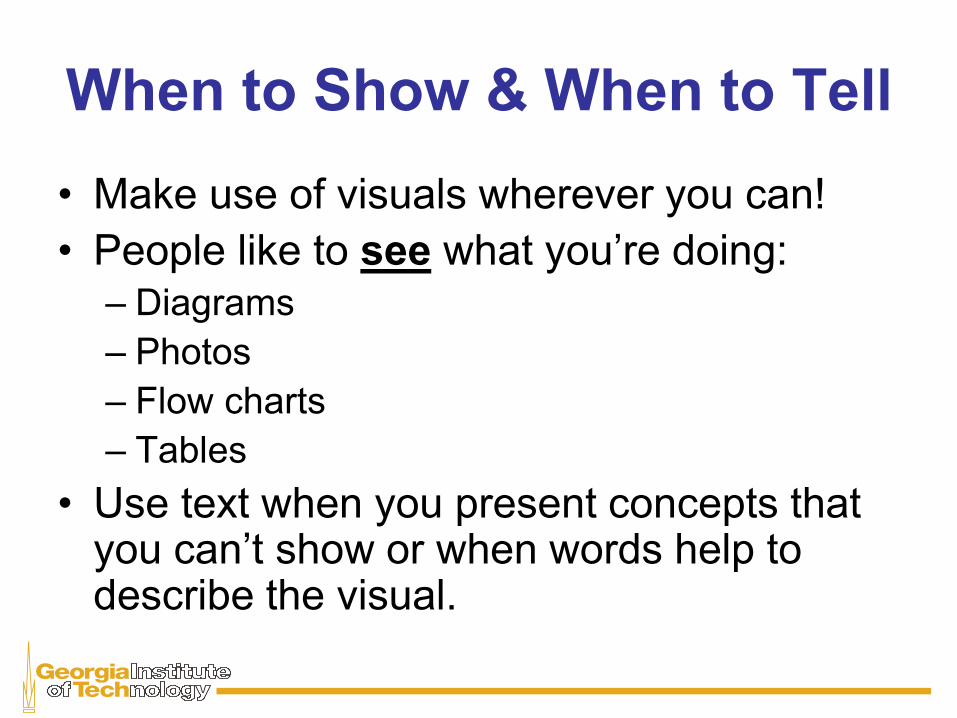
When to Show & When to Tell
• Make use of visuals wherever you can!
• People like to see what you’re doing:
– Diagrams
– Photos
– Flow charts
– Tables
• Use text when you present concepts that you can’t show or when words help to describe the visual.
Let’s look at some
examples of
effective use of graphics
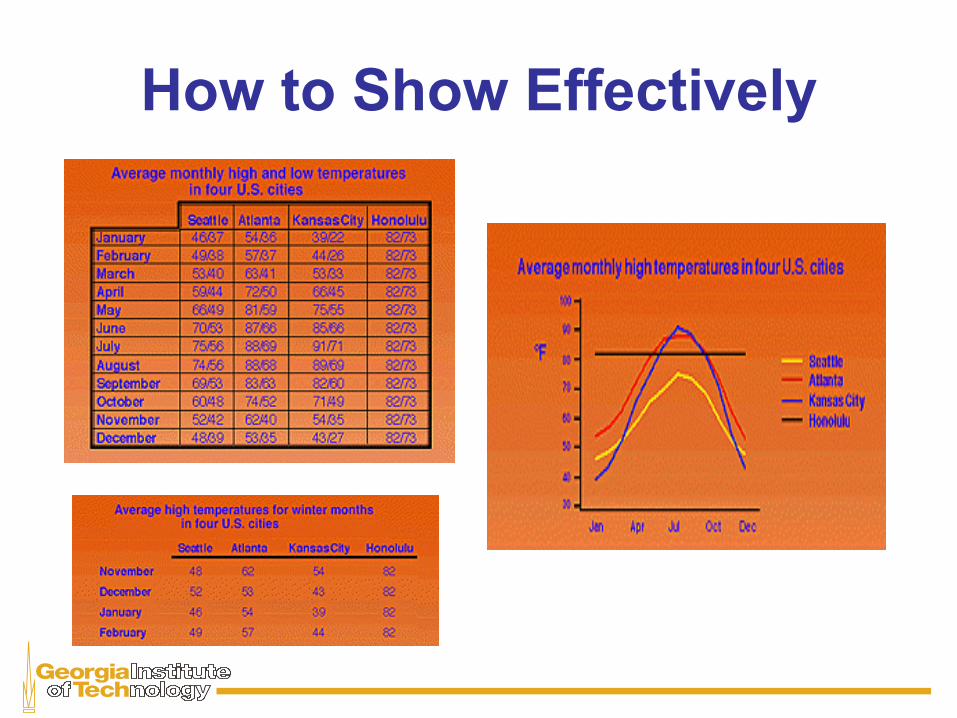
How to Show Effectively
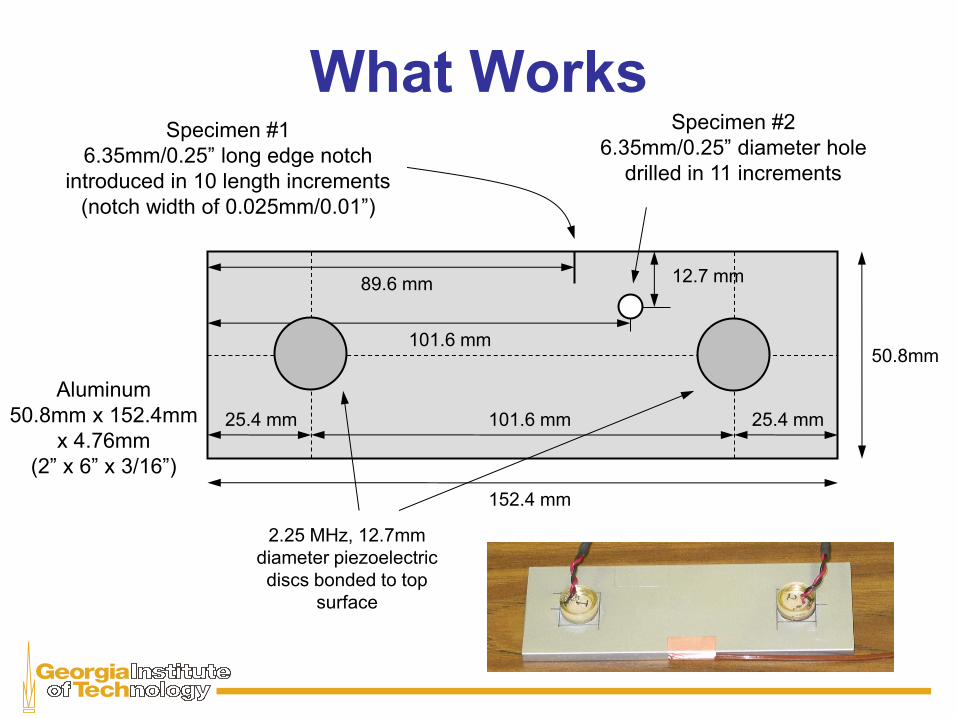
What Works
Aluminum
50.8mm x 152.4mm
x 4.76mm
(2” x 6” x 3/16”)
Specimen #2
6.35mm/0.25” diameter hole
drilled in 11 increments
152.4 mm
50.8mm
25.4 mm 25.4 mm 101.6 mm
2.25 MHz, 12.7mm
diameter piezoelectric
discs bonded to top
surface
89.6 mm
Specimen #1
6.35mm/0.25” long edge notch
introduced in 10 length increments
(notch width of 0.025mm/0.01”)
101.6 mm
12.7 mm

“High Level” Flow Chart
Start
Define channel
sequence and
parameters
Ready to
acquire?
Acquire/store single
measurement from
all channels
Done?
No
No Stop
Yes
Yes
Parameters for
each channel are
transmitter,
receiver, P/R setup
file, and TDS5034
setup file
Initiated
either by
keystroke or
timed
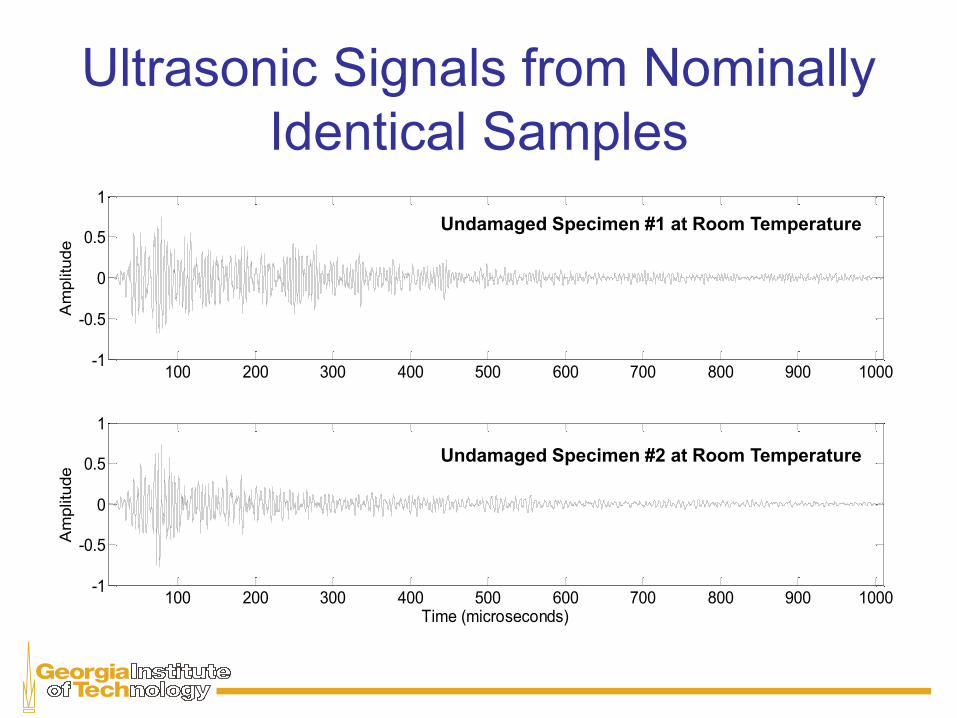
Ultrasonic Signals from Nominally
Identical Samples
100 200 300 400 500 600 700 800 900 1000-1
-0.5
0
0.5
1
Am
plitu
de
100 200 300 400 500 600 700 800 900 1000-1
-0.5
0
0.5
1
Time (microseconds)
Am
plitu
de
Undamaged Specimen #1 at Room Temperature
Undamaged Specimen #2 at Room Temperature

Robot Interface
Sonar Measurements
Wall-following Side (-1 or 1) Program State
SW2: Enable IR
SW0: Wall-following Side
KEY3: Start
KEY0: Reset
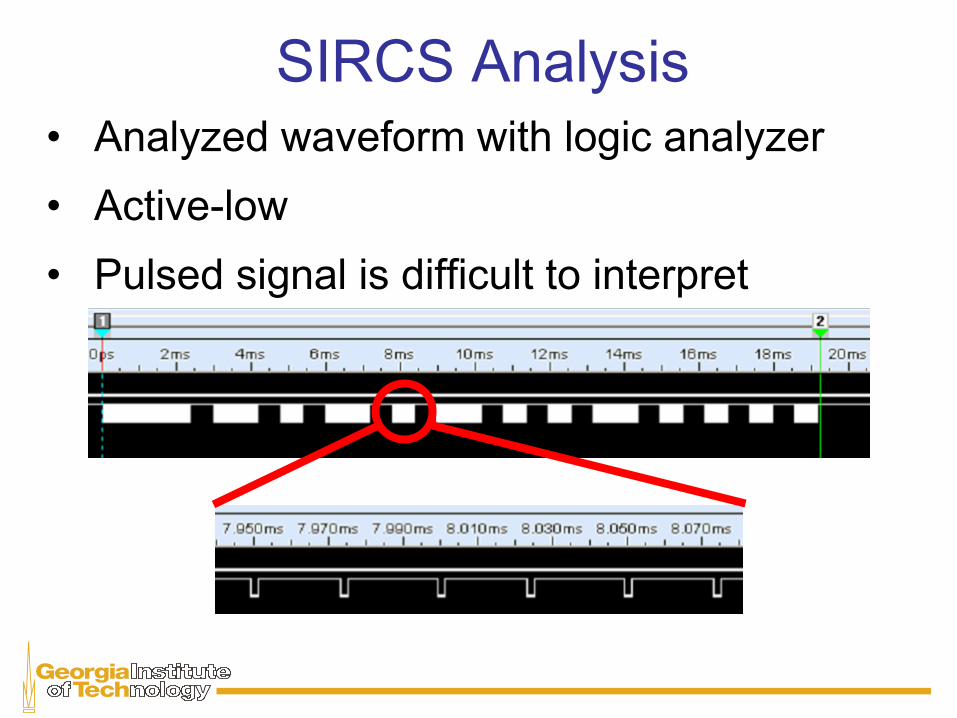
SIRCS Analysis
• Analyzed waveform with logic analyzer
• Active-low
• Pulsed signal is difficult to interpret

SIRCS Interpretation
Source: http://www.kucher.org/projects/tvcontrol/
Cite all figures, data, tables that
are not your own creation
And here’s what
doesn’t work
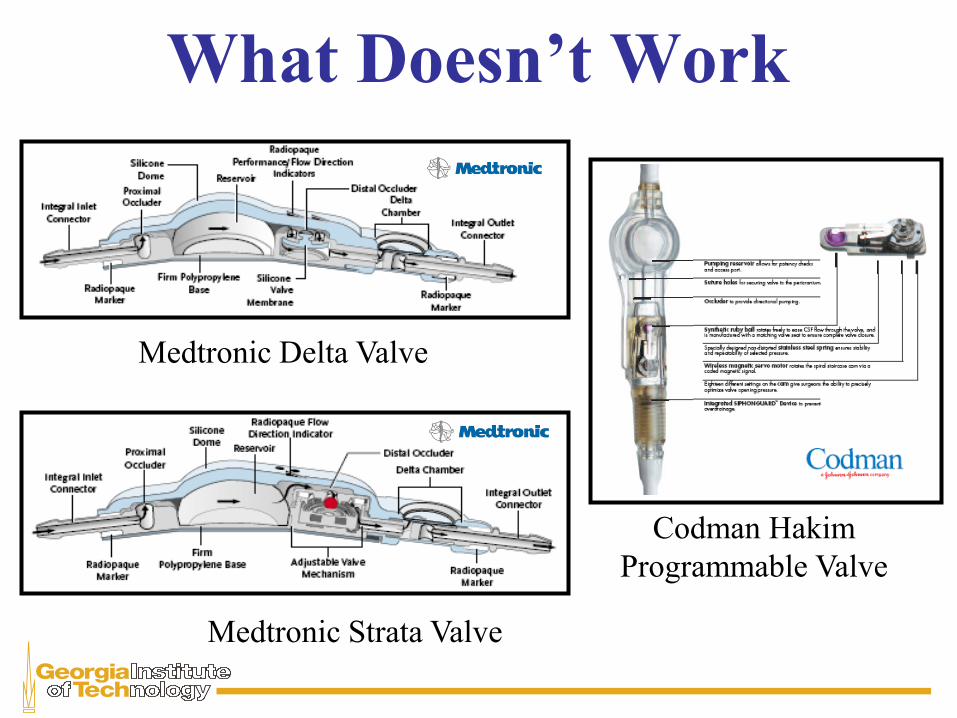
What Doesn’t Work
Medtronic Delta Valve
Medtronic Strata Valve
Codman Hakim
Programmable Valve

Company
Logo
Company Name

Mechanical Assembly Drawing
Now let’s look at some
Before and After examples
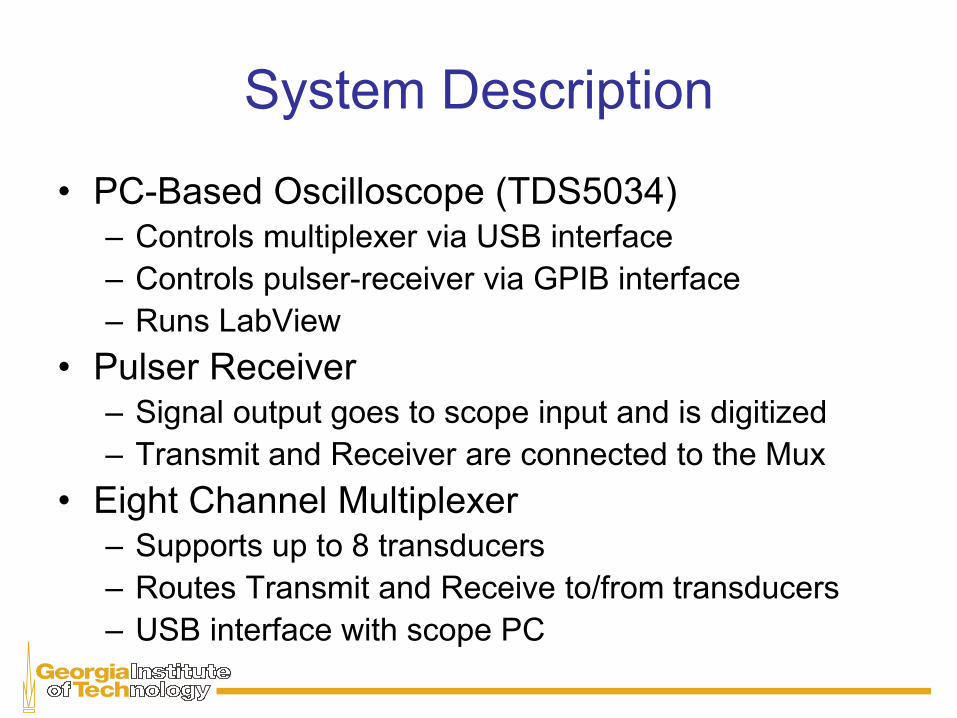
System Description
• PC-Based Oscilloscope (TDS5034) – Controls multiplexer via USB interface
– Controls pulser-receiver via GPIB interface
– Runs LabView
• Pulser Receiver – Signal output goes to scope input and is digitized
– Transmit and Receiver are connected to the Mux
• Eight Channel Multiplexer – Supports up to 8 transducers
– Routes Transmit and Receive to/from transducers
– USB interface with scope PC
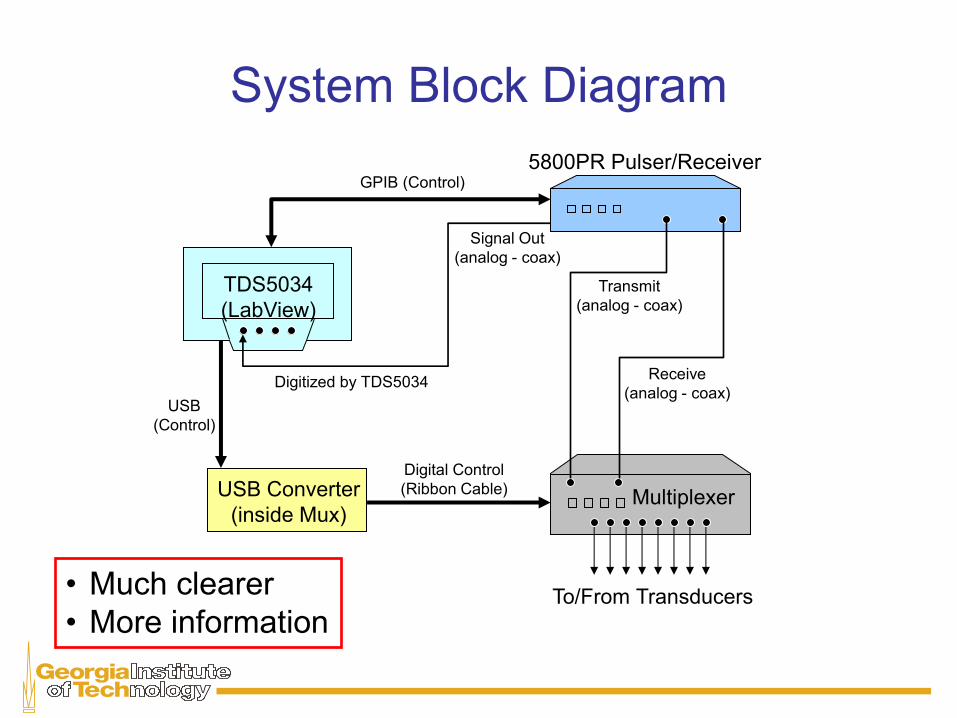
System Block Diagram
TDS5034
(LabView)
5800PR Pulser/Receiver
Multiplexer USB Converter
(inside Mux)
To/From Transducers
Transmit
(analog - coax)
Receive
(analog - coax)
GPIB (Control)
USB
(Control)
Digital Control
(Ribbon Cable)
Signal Out
(analog - coax)
Digitized by TDS5034
• Much clearer
• More information
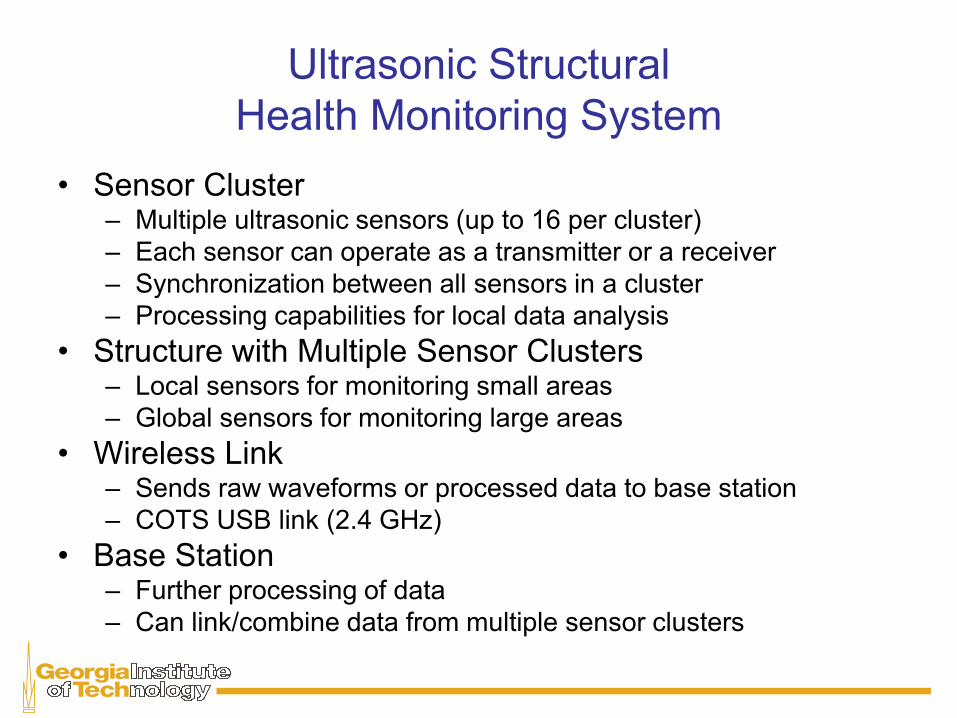
Ultrasonic Structural
Health Monitoring System
• Sensor Cluster – Multiple ultrasonic sensors (up to 16 per cluster)
– Each sensor can operate as a transmitter or a receiver
– Synchronization between all sensors in a cluster
– Processing capabilities for local data analysis
• Structure with Multiple Sensor Clusters – Local sensors for monitoring small areas
– Global sensors for monitoring large areas
• Wireless Link – Sends raw waveforms or processed data to base station
– COTS USB link (2.4 GHz)
• Base Station – Further processing of data
– Can link/combine data from multiple sensor clusters
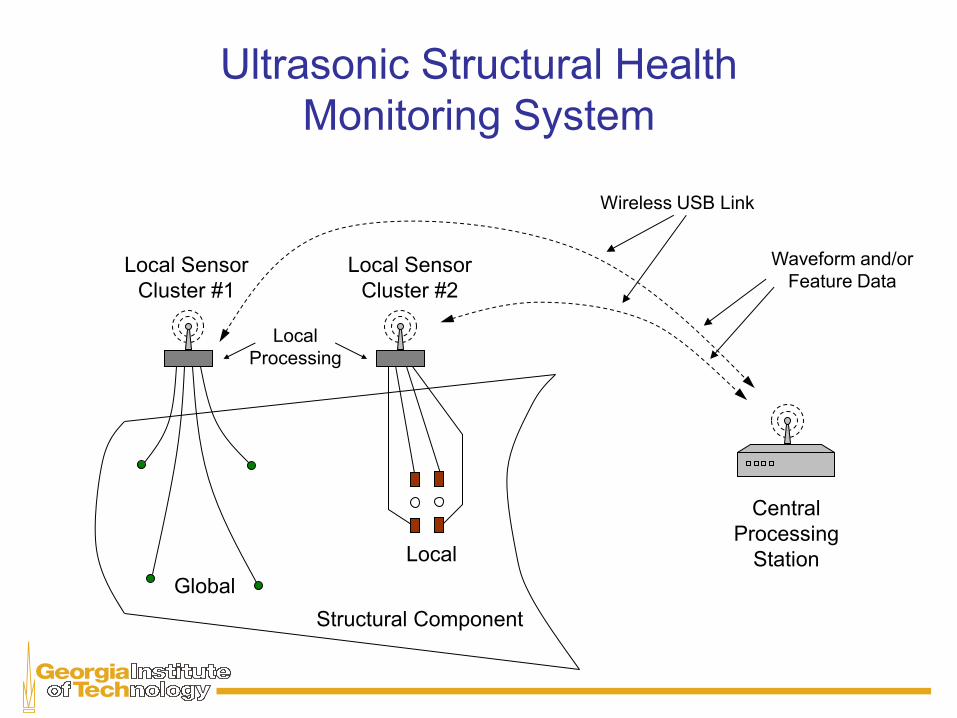
Local Sensor
Cluster #1
Local Sensor
Cluster #2
Central
Processing
Station
Waveform and/or
Feature Data
Structural Component
Global
Local
Wireless USB Link
Ultrasonic Structural Health
Monitoring System
Local
Processing
Let’s look at a few more examples of
what works and
what doesn’t

Methods for Quantifying Changes in
Diffuse Ultrasonic Signals with Applications
to Structural Health Monitoring
Yinghui Lu
Jennifer E. Michaels
Thomas E. Michaels
Georgia Institute of Technology
School of Electrical and Computer Engineering
10th SPIE International Symposium
Nondestructive Evaluation for Health Monitoring and Diagnostics
March 6-10, 2005
Project Overview
• Monitor continuously integrity of critical structures, using permanently attached ultrasonic sensors.
• Apply technology for monitoring commercial airliners, bridges, and buildings. Primary client is Air Force.
• Estimate development costs at $3 million; initial cost of a deployed system, including instrumentation and wiring, should be less than $150,000.

Design Objectives: Weak
• Monitor structures
• Have attached ultrasonic sensors
• Read sensors
• Record waveforms
• Determine condition of structure

Design Objectives: Better
Structural Component
Being Monitored
1
4
3
2
Ultrasonic Sensor
• Monitor continuously health of critical structures (airplanes, buildings) in real-time
• Attach permanent ultrasonic sensors near, on, or in structure
• Interrogate sensors, record waveforms
• Analyze waveforms to determine if structure has developed internal flaws or pre-flaw conditions
Technical Approach: Weak
• Pulse with transducer
• Flood with energy and look for diffuse
waves
• Introduce temp. changes and defects
• Goal is to detect minimum flaw in the
presence of temp. changes.
Technical Approach: Better • Pulse with one transducer and receive with
other
• Flood structure with energy, record response until energy has substantially died out (diffuse waves)
• Introduce temperature changes and artificial defects (separately and simultaneously)
• Goal is to discriminate between temperature changes and defects and to quantify minimum detectable flaw size in the presence of temperature changes
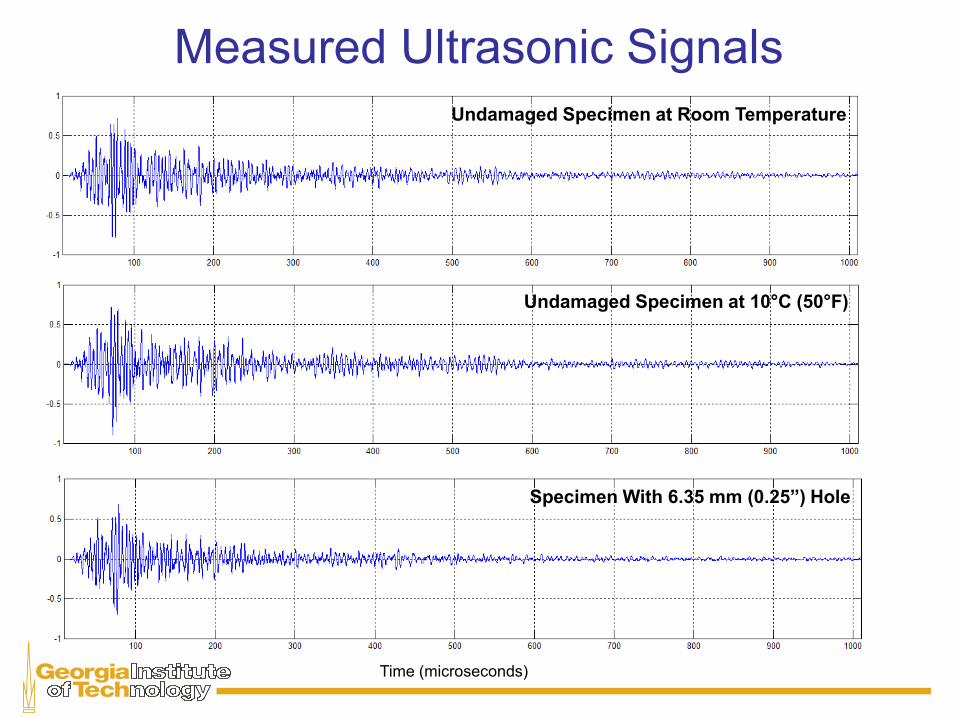
Measured Ultrasonic Signals
Undamaged Specimen at Room Temperature
Undamaged Specimen at 10°C (50°F)
Specimen With 6.35 mm (0.25”) Hole
Time (microseconds)
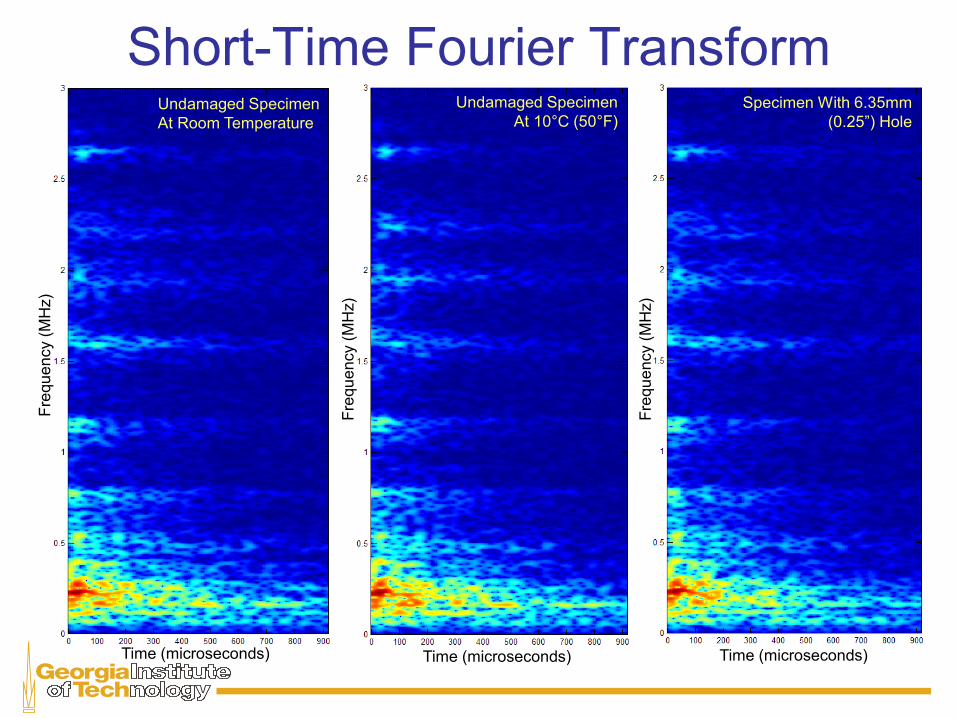
Short-Time Fourier Transform F
requ
en
cy (
MH
z)
Time (microseconds) Time (microseconds) Time (microseconds)
Fre
qu
en
cy (
MH
z)
Fre
qu
en
cy (
MH
z)
Undamaged Specimen
At Room Temperature
Undamaged Specimen
At 10°C (50°F)
Specimen With 6.35mm
(0.25”) Hole
Data: Weak
• Waveforms were recorded at various
temperatures.
• Waveforms were recorded at various
temperatures as notch was enlarged.
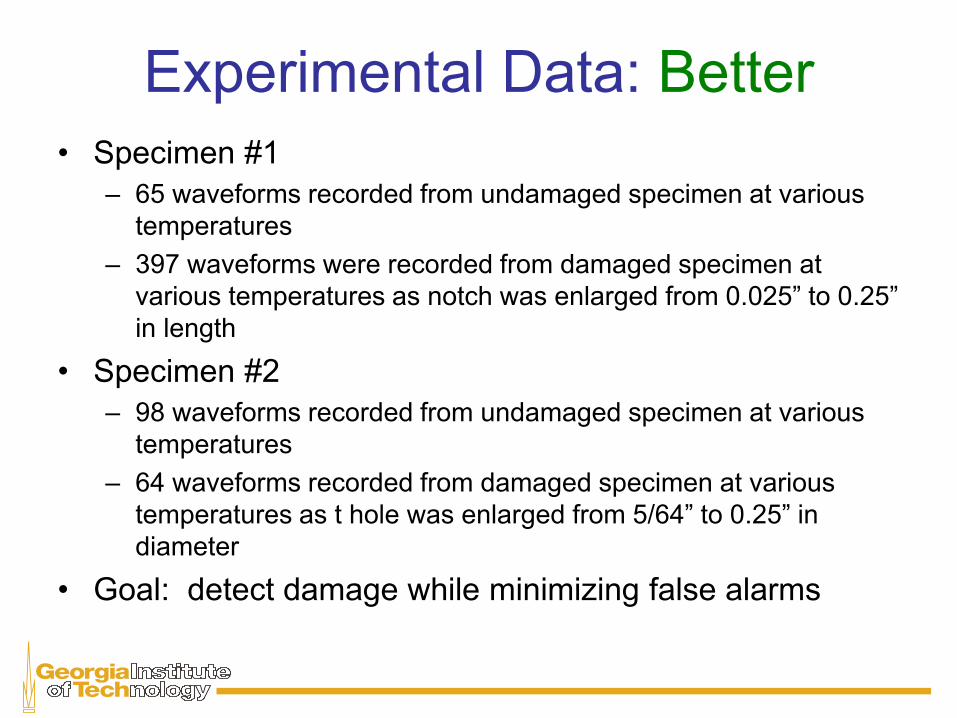
Experimental Data: Better
• Specimen #1
– 65 waveforms recorded from undamaged specimen at various
temperatures
– 397 waveforms were recorded from damaged specimen at
various temperatures as notch was enlarged from 0.025” to 0.25”
in length
• Specimen #2
– 98 waveforms recorded from undamaged specimen at various
temperatures
– 64 waveforms recorded from damaged specimen at various
temperatures as t hole was enlarged from 5/64” to 0.25” in
diameter
• Goal: detect damage while minimizing false alarms
Future Work
• Implement data fusion at feature level to improve
detection performance
• Develop, implement methods for estimating flaw
sizes
• Investigate effect of flaw type and location on
detection sensitivity
• Consider more complicated specimens with real
defects
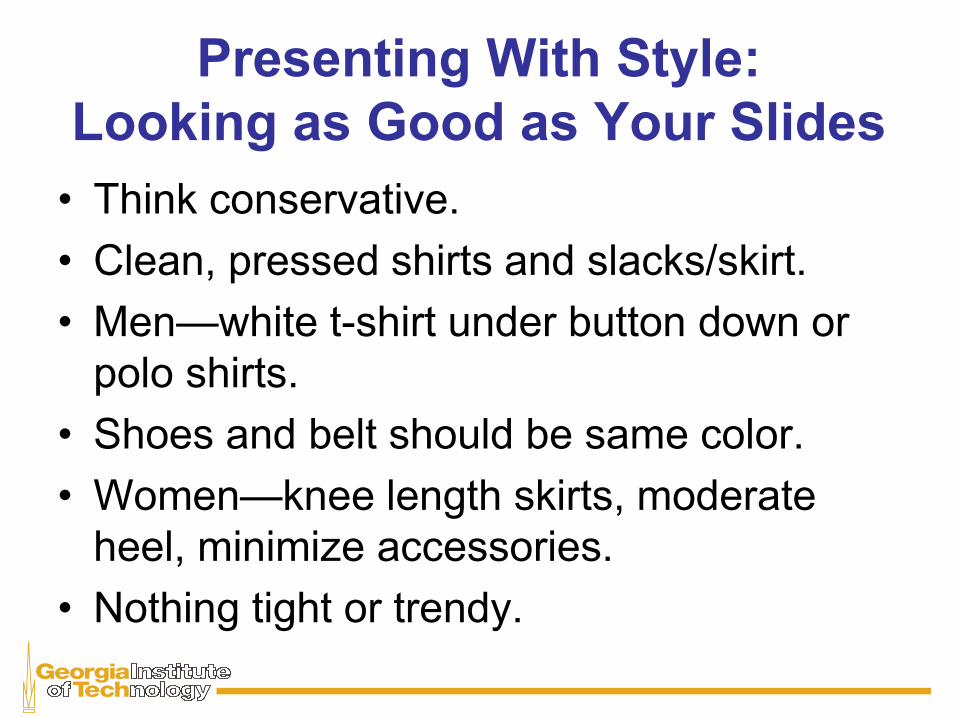
Presenting With Style:
Looking as Good as Your Slides
• Think conservative.
• Clean, pressed shirts and slacks/skirt.
• Men—white t-shirt under button down or
polo shirts.
• Shoes and belt should be same color.
• Women—knee length skirts, moderate
heel, minimize accessories.
• Nothing tight or trendy.

Unprofessional Business Attire:
What Not to Wear

Fine for “Going Out”
NOT for Going to Work

Fine for “Going Out”
NOT for Going to Work
Too short
Denim is
too casual
Too revealing
Too high

Sloppy, ill-fitting clothes are
unprofessional
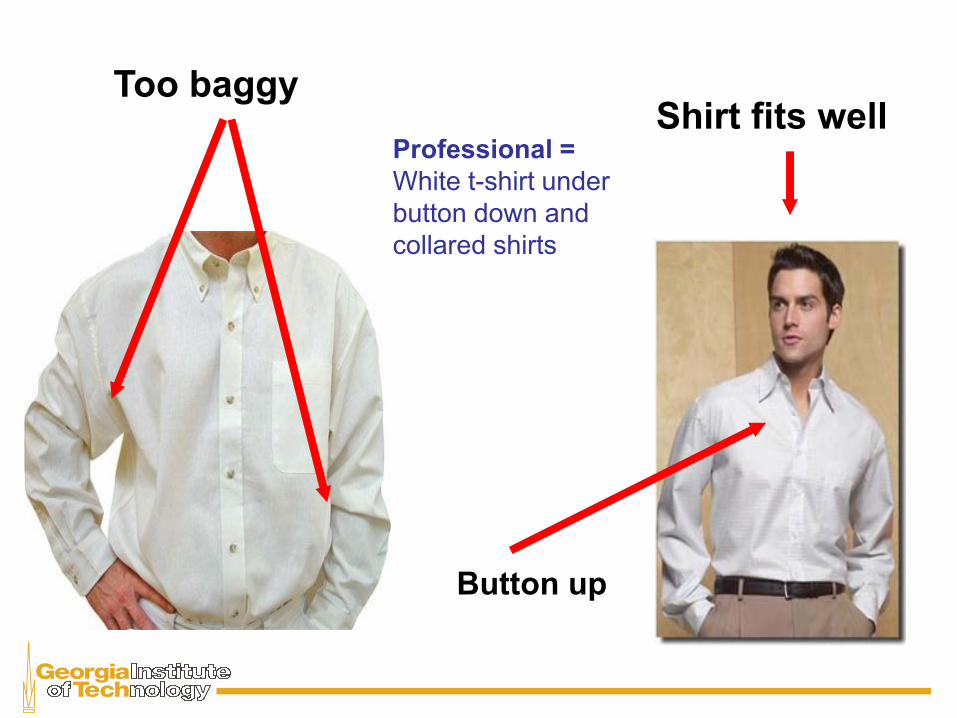
Too baggy Shirt fits well
Professional =
White t-shirt under
button down and
collared shirts
Button up

What Business Casual Looks Like: Men
Belt and shoes
are same color
Tie hits
belt line Light colored shirt
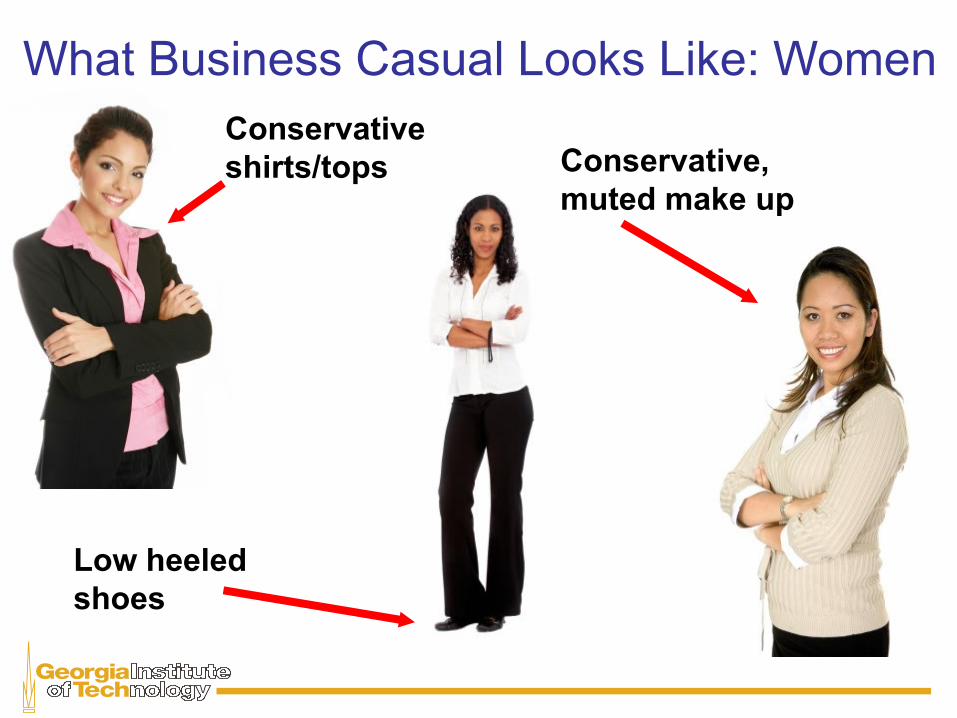
What Business Casual Looks Like: Women
Low heeled
shoes
Conservative,
muted make up
Conservative
shirts/tops

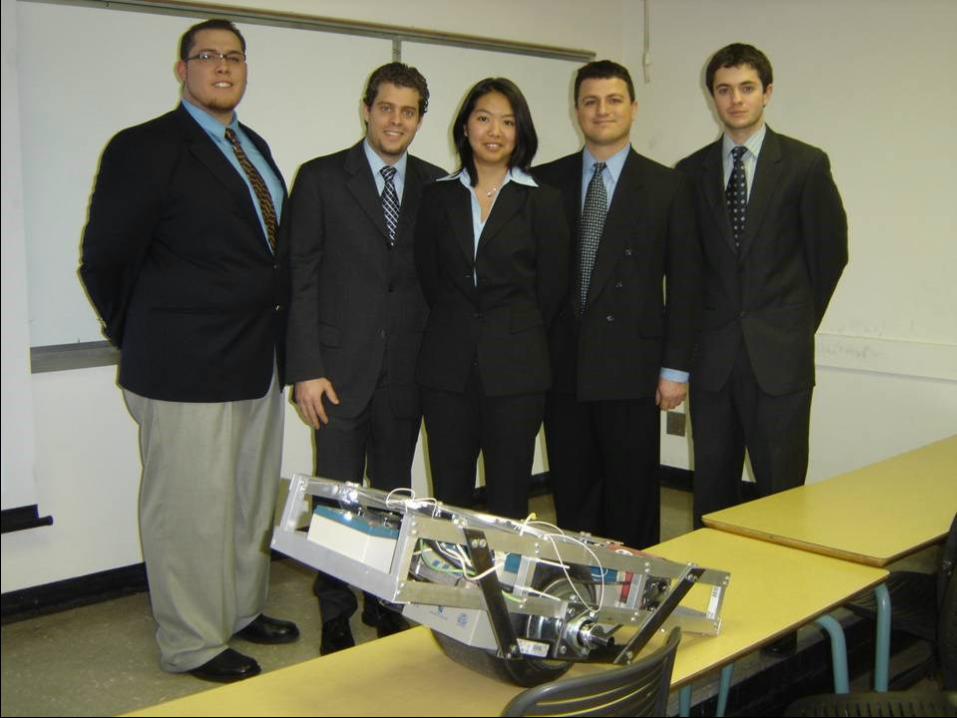
Business Formal
Giving Your Talk
• 10 minutes is a short, formal talk. • Not enough time to say everything about your topic
• Must plan your comments for each slide
• Stick to your slides—don’t digress
• Don’t read the slides to the audience—slides should be used as prompts, not as a script.
• Remember to project your voice, maintain eye contact, and avoid filler words (um, ah, like).
• Be prepared to answer questions.
Performance Techniques:
Bringing Your “A” Game • Take several deep breaths.
• Stand up straight—pay attention to your posture.
• Make eye contact with your audience.
• Project your voice.
• Pace the rate of your speech so that it is natural and moderate.
• Monitor your gestures and avoid habitual behaviors (hands in pocket, playing with your hair, pacing).
Presentation Never’s
• Never run over your time limit. Ever!
• Never apologize for any aspect of your presentation. If you have to apologize, you aren’t prepared.
• Never respond aggressively to a question or comment. Even if you are right, the whole audience will resent you for picking on that poor questioner.
Top 5 Secrets of the Pros
5. Tour the space you’ll be presenting in prior to your talk.
4. Make sure the room’s technology is compatible with yours.
3. Stand to one side of the projection screen instead of behind the podium.
2. Use the “meteorologist chop” instead of a laser pointer or a cursor.
And the #1 Secret…
Practice!
A lot!

Questions?