Embed Size (px)
Citation preview

Presenting and communicating statistics: Presenting and communicating statistics: principles, components, and their quality principles, components, and their quality
assessment. assessment. A proposalA proposal
Filomena Maggino & Marco Trapani
Università degli Studi di Firenze, Italy

1. Communication: integral component of statistical work
2. Communicating statistics
3. Assessing statistical communication
Contents
4. The way forward

1. Communication: integral component of statistical work
2. Communicating statistics
3. Assessing statistical communication
Contents
4. The way forward

Communication in statistics: From DATA to MESSAGE
DATA PRODUCTION objective observation
transformed in
aseptic data
DATA ANALYSIS,
RESULTS AND INTERPRETATION
data information
PRESENTATION information message

1. Communication: integral component of statistical work
2. Communicating statistics
3. Assessing statistical communication
Contents
4. The way forward

1. Fundamental aspects
Aspects ofstatistical
presentations
Correspondingdiscipline
Content EthicsAppeal Aesthetics
Persuasion Rhetoric
Theory of presentation

2. Main components
T RCODE
CODE
Message
Channel
Context - setting
FEEDBACK
Noise

in statistical communication
A. Outline telling statisticsB. tools Depicting statisticsC. cloths Dressing statistics
3. Codes

INVENTIO
DISPOSITIO
ELOCUTIO
ACTIO
3a. Outline telling statistics
START

1- Inventio (invention)
•Who the subject of telling•What the fact •When the time location•Where the field location•Why the causes
3a. Outline telling statistics
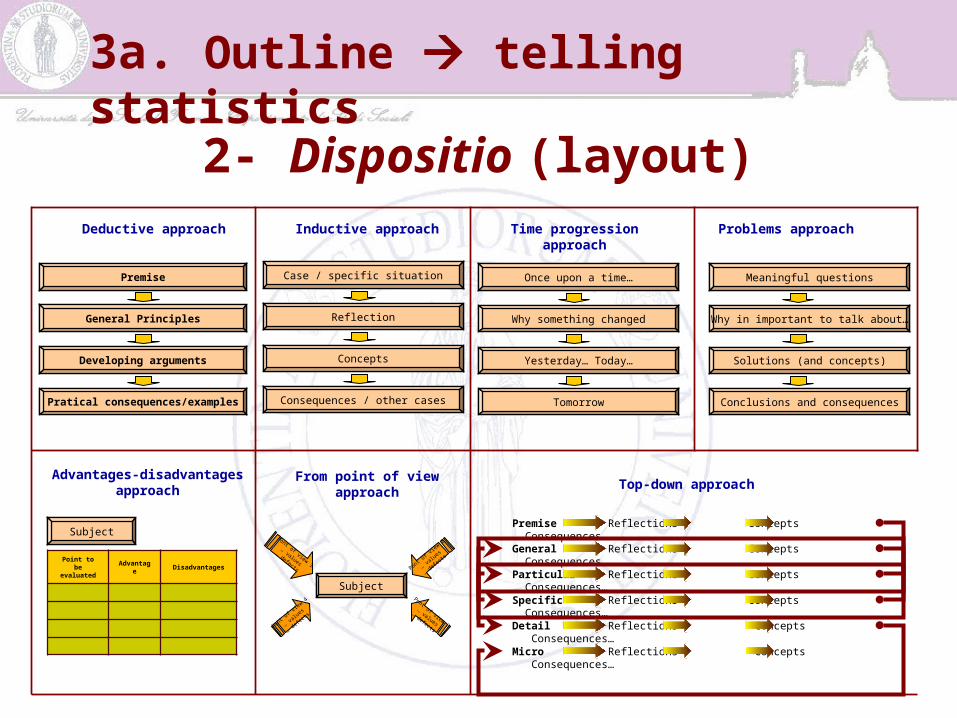
2- Dispositio (layout)
Premise
General Principles
Developing arguments
Pratical consequences/examples
Deductive approach
Case / specific situation
Reflection
Concepts
Consequences / other cases
Inductive approach
Once upon a time…
Why something changed
Yesterday… Today…
Tomorrow
Time progression approach
Meaningful questions
Why in important to talk about…
Solutions (and concepts)
Conclusions and consequences
Problems approach
Subject
Advantages-disadvantages approach
Point to be evaluated
Advantage
Disadvantages
Subject
From point of view approach
Pont of view 1
… values
… defects
Pont of v
iew 4
… va
lues
… defe
cts
Pont of view 3
… values
… defects
Pont o
f view 2
… va
lues
… de
fects
Top-down approach
General Reflections Concepts Consequences…
Particular Reflections Concepts Consequences…
Specific Reflections Concepts Consequences…
Detail Reflections Concepts Consequences…
Micro Reflections Concepts Consequences…
Premise Reflections Concepts Consequences…
3a. Outline telling statistics

3- Elocutio (expression)
Figures of Definition
Thinkingchange in words’ or propositions’ invention and imaginative shape
Meaning (or tropes) change in words’ meaning
Diction change in words’ shape
Elocutionchoice of the most suitable or convenient words
Constructionchange in words’ order inside a sentence
Rhythm phonic effects
3a. Outline telling statistics
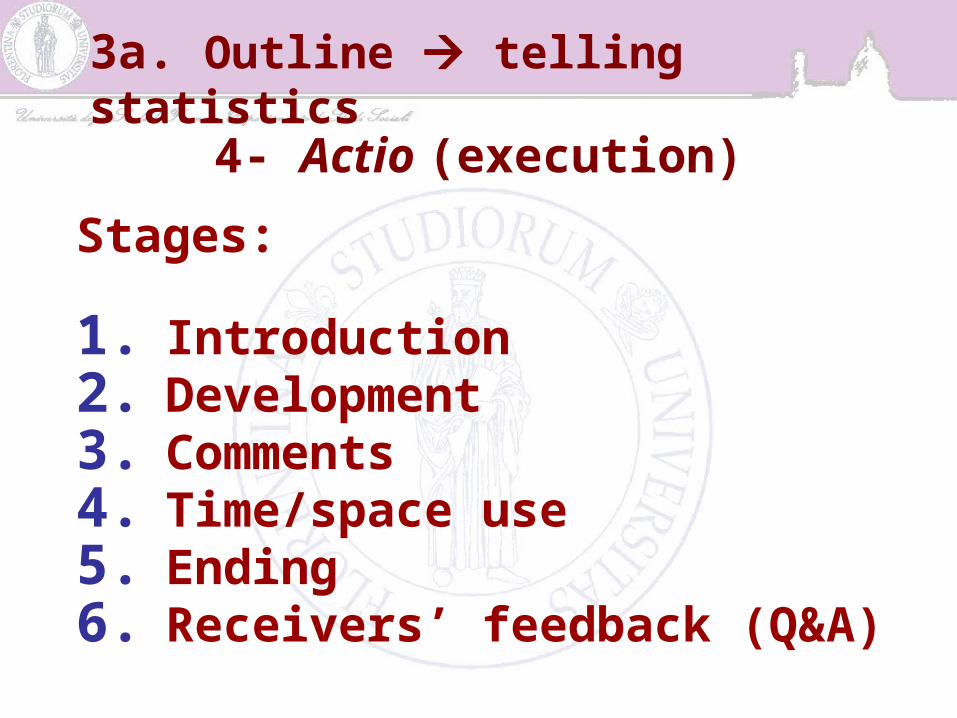
4- Actio (execution)
Stages:
1. Introduction2. Development3. Comments4. Time/space use5. Ending6. Receivers’ feedback (Q&A)
3a. Outline telling statistics

functions
Supporting attention
Activating and building prior knowledge
Minimizing cognitive load
Building mental models
Supporting transfer of learning
Supporting motivation
3b. Tools Depicting statistics

Perception of statistical Graph
Recognizing the codeRecognizing regularities
Carrying out comparisions and identify differences
3b. Tools Depicting statistics

(i) Choosing a graph …… by taking into account
• number of involved variables• nature of data (level of measurement)• statistical information to be represented
… by preferring
• a simple graph with reference to the audience• a clear graph instead of an attractive one• a correct graph with reference to data
3b. Tools Depicting statistics

(ii) Preparing a graph
Scale definition correctly defining and showing scale/s
Dimensionalityreducing dimensionality as much as possible by showing few variables for each graph using no meaningless axis
Colours as statistical codes
using colours consistently with statistical information
Rounding off values
rounding up and down through standard criteria
Dynamics presentation
dynamic perspective should reflect a dynamic phenomenon
Legibilityfew elements as possible. Wise use of legends and captions
3b. Tools Depicting statistics

Different aspects: Text arrangementCharacters and fontsColoursOther aspect
With reference to:BalanceHarmonyProportionEleganceStyle
3c. Cloths dressing statistics

1. Communication: integral component of statistical work
2. Communicating statistics
3. Assessing statistical communication
Contents
4. The way forward

aspects allowing the assessing
1.1 the dimensions to evaluate1.2 the evaluating criteria1.3 the components of the transmission process
1. Conceptual Framework

1.1 the dimensions to evaluate
(i) Outline(ii) Tools(iii) Cloths
1. Conceptual Framework

1.2 the evaluating criteria
(A) Suitability / consistency(B) Correctness(C) Clarity
1. Conceptual Framework
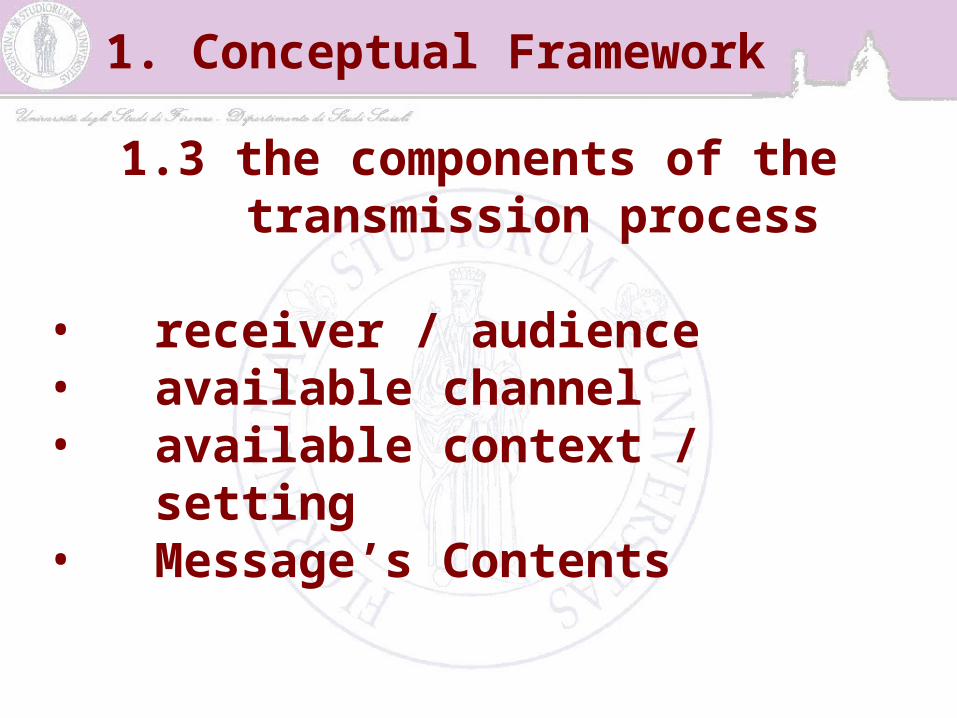
1.3 the components of the transmission process
• receiver / audience• available channel• available context / setting• Message’s Contents
1. Conceptual Framework
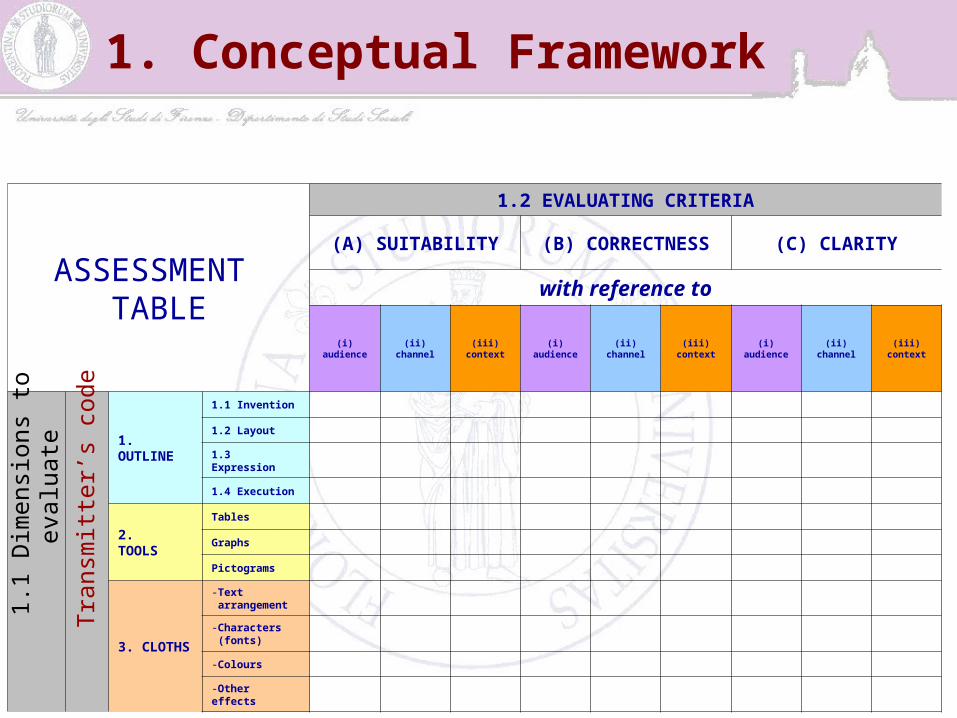
ASSESSMENT TABLE
1.2 EVALUATING CRITERIA
(A) SUITABILITY (B) CORRECTNESS (C) CLARITY
with reference to
(i)audience
(ii)channel
(iii)context
(i)audience
(ii)channel
(iii)context
(i)audience
(ii)channel
(iii)context
1. OUTLINE
1.1 Invention
1.2 Layout
1.3 Expression
1.4 Execution
2. TOOLS
Tables
Graphs
Pictograms
3. CLOTHS
-Text arrangement
-Characters (fonts)
-Colours
-Other effects
1.1
Dim
ensi
ons
to
evalu
ate
Tra
nsm
itte
r’s
code
1. Conceptual Framework

2. Need of standarded codes
Communication of statistics needs to be assessed through standardized methods and techniques in order to improve its impact
Developing and adopting standardized codes allow transmitters to warrant:
objectivity of data presentation, by avoiding introduction of any subjective component
comparability between different presentations and along time,
economicity and efficiency
in preparing presentation,
generalization by avoiding any kind of “adaptability” of codes to “subjective” messages,
understanding
of data structure.
1. Communication: integral component of statistical work
2. Communicating statistics
3. Assessing statistical communication
Contents
4. The way forward

The way forward …
Emphasizing communicative aspects does not aim at exasperating the importance of
communication with respect to the rest of statistical activities.
ICT societies increasingly require statistical information.
In order to attribute more value to statistics and to increase impact of statistics on reality, two processes need to be assessed:
data production and analysis communication
The presented work summarizes the first stage of our study, aimed at
defining the framework for quality assessment of communication in
statistics.
The goal is to define the assessment technology by discussing with all the
willing colleagues.
The way forward …