Embed Size (px)
Citation preview

PRESENTER:ANDY BILSON, PROFESSOR OF SOCIAL WORK, SCHOOL OF SOCIAL WORK, UNIVERSITY OF CENTRAL LANCASHIRE AND
ADJUNCT PROFESSOR, UNIVERSITY OF WESTERN AUSTRALIA
WHY WE NEED TO THINK AGAIN ABOUT HOW TO PROTECT CHILDREN. LESSONS FROM 20 YEARS OF
MONITORING PRACTICE

INTRODUCTION AND OVERVIEW
This presentation will introduce 1 system study & 3 pieces of action research:•Analysis of 20 years monitoring of child protection in Western Australia
• Prevalence of reports, investigations and substantiations for all Western Australian children born in 1990 or 1991
• Prevalence rates for each type of maltreatment• Prevalence of maltreatment for Aboriginal children cf. other
Australians• Changes in prevalence over time
•System study in English Local Authority in the North West•Study of social work with children in Moldova•Appreciative research in Bulgaria

SOME INITIAL NOTES
“Although caution is necessary in interpretation of findings, trends in six developed countries show no consistent evidence for a decrease in all types of indicators of reported child maltreatment” - Gilbert et al, 2012
“The low prevalence of child abuse combined with even the most optimistic estimates of screening effectiveness implies that any child abuse screening program will yield large numbers of false positives—non-abusing families labelled as abusing or potentially abusing. The large social cost of this type of labelling makes such an approach unacceptable.” - Daniel et al 1978 :258

SOME STATISTICS ON CHILDREN IN CARE IN ENGLAND ON 31ST MARCH
2013• 68,110 children 60/10,000 in population • 7,520 (10.9%) had 3 or more placements in 2013-14• Poor educational attainment (many different measures) • Emotional and behavioural health of children looked
after continuously for 12 months measured using SDQ, 50.1% have a score that is considered normal and 37.5% have a score that is considered cause for concern
• Offending: 14.1% of boys and 7.2% girls aged 16-17 convicted or subject to a final warning or reprimand during the year. Children in care who make up 0.57% of the 10-17 population are 5.08% of all the children convicted or subject to a final warning or reprimand during the year (9 times more likely)
• Substance misuse: 10.5% of 16 to 17 year-olds have substance misuse problem

RELATIONSHIP OF CHILD PROTECTION PLANS AND CHILDREN LOOKED AFTER TO DEPRIVATION IN
THEIR LOCAL COMMUNITY IN ENGLAND
Rate of Children looked after and on Child Protection Plans on 31.03.2012 per 10,000 aged 0 to 17 by deprivation decileSource: Bywaters, P., Brady, G., Sparks, T., & Bos, E. (2014)

ANALYSIS OF 20 YEARS MONITORING OF CHILD PROTECTION
Data and method•WA child protection department de-identified data on all reports of child maltreatment and child concerns 1990-2009•Study analyses reports for:
• all reports of concerns, investigations and substantiation 1990 to 2007
• cohort of children born in 1990 or 1991 followed until 18th birthday
• cohorts of children born in calendar years 1990 to 2008
Note: The rate of children investigated per 1000 aged 0 to 17 was:•7.95 statutorily investigated in England in 2009-10•8.4 in Western Australia 2009


50,630 Childrenborn 1990-91 100%
6,795 (49.1%) reports and 2,006 (29.8%)children not investigated
13,828 Reportson 6,726 Children 13.3%
4,386 (62.4%) investigations and 2,456 (57.5%) investigated children with no substantiated maltreatment
7,033 Investigations on 4,270 Children
8.4%
11,181 (80.9%) reports, and 4,801 (71.4%) children reported with no substantiated maltreatment and 5,639 (83.8%) children reported not found to be “harmed”
2,647 Substantiationson 1925 Children1491 “Harmed”1087 Children
3.8%
% o
f chi
ldre
n bo
rn in
199
0-91
rea
chin
g ea
ch s
tage
Child Protection Careers in WA All Children born in 90 and 91

NUMBERS AND RATES OF ABORIGINAL AND NON-ABORIGINAL INDIVIDUALS EVER REPORTED, INVESTIGATED OR
SUBSTANTIATED AND PREVALENCE RATES OF SUBSTANTIATED MALTREATMENT.
Non-Aboriginals Aboriginals
Risk RatioNumber Rate / 1000 Number Rate / 1000
Reported 5175 110 1551 417 3.8
Investigated 3230 68 1040 280 4.1
Substantiated
1355 29 570 154 5.3
Emotional 133 3 49 13 4.3
Neglect 377 8 284 77 9.6
Physical 508 11 202 54 4.9
Sexual 530 11 163 44 4.0

RATE OF CHILDREN RECEIVING 1ST REPORTBEFORE 1ST, 5TH & 10TH BIRTHDAYS
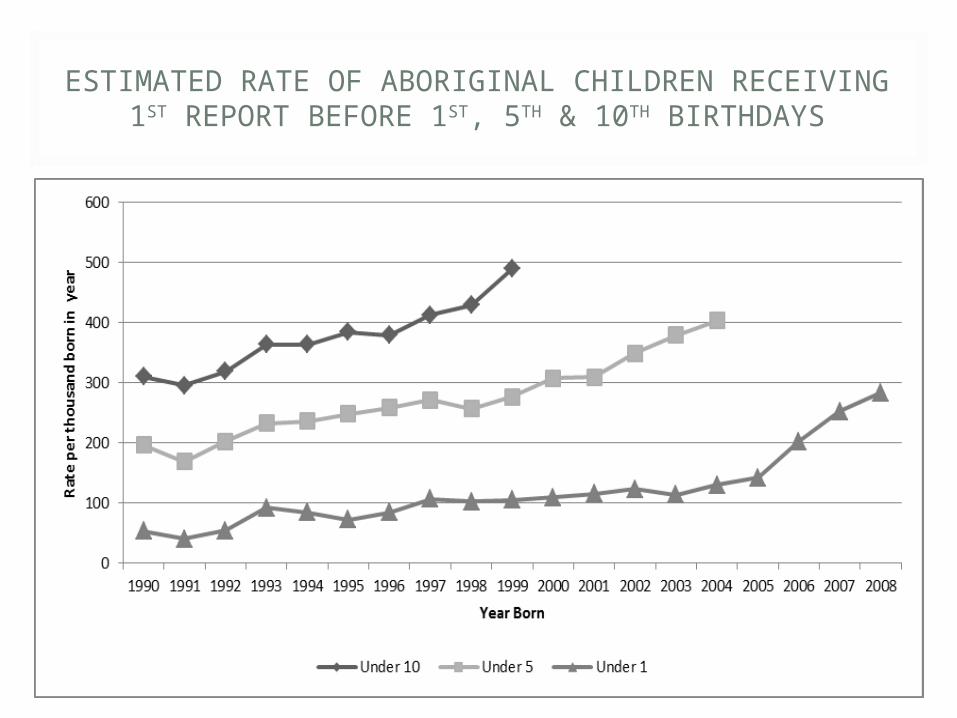
ESTIMATED RATE OF ABORIGINAL CHILDREN RECEIVING 1ST REPORT BEFORE 1ST, 5TH & 10TH
BIRTHDAYS

RATE OF CHILDREN REPORTED, INVESTIGATED, SUBSTANTIATED AND ‘HARMED’ BEFORE THEIR
FIRST BIRTHDAY BY ABORIGINALITY
Non Aboriginal Aboriginal
1990 2008 1990 2008
Rate reported 7.0 14.4 54 284
Rate investigated 6.6 6.9 51 136
Rate substantiated 1.6 3.5 26 75
Rate harmed 1.0 1.1 15 24
Rate not harmed 0.6 2.4 10 51

RATE PER THOUSAND OF CHILDREN HAVING A CARE EPISODE AND THOSE HAVING A CARE
EPISODE LASTING MORE THAN A YEAR

RISK FACTORS FOR SUBSTANTIATED MALTREATMENT
Western Australian study using subset of this data linked to disability and health data found strongest risk factors:
• child intellectual disability• parental socio-economic disadvantage (poverty)• parents under 20 years at birth• parental hospital admissions – mental health,
substance misuse and assault • in Aboriginal families socio-economic disadvantage
not shown as risk factor but likely that due to proportion in poverty risk is uniformly high
(O’Donnell et al 2010)

100%
85%
152 children87 families Referrals
83 children37 families
100%
79%
23 children18 families
30%
Child in Need
Child Concern report
32 families
Child Protection46 children
37%

100%
85%
Type of Referral and Initial Social Work ActionType of Referral and Initial Social Work Action
152 children87 families Referrals
83 children37 families
100%
79%
23 children18 families
30%
Child in Need s17
Child Concern report
32 families
Child ProtectionS.47 46 children
37%
NeedInvestigative
OtherN/K
37631
234
1-
Families Children
InvestigativeN/K
451
311
Families Children
NeedN/K
221
171
Families Children

100%
85%
Type of Referral and whether Service ReceivedType of Referral and whether Service Received152 children87 families Referrals
83 children37 families
100%
79%
23 children18 families
30%
Child in Need
Child Concern report
32 families
Child Protection46 children
37%
Service 3 (4%)3 (8%)Families Children
Service 22 (48%)13 (41%)Families Children
Service 10 (43%)9 (50%)Families Children

SERVICE PROVISION
• 61 (40%) not known at referral
• ‘Service’ Offered in 35 (23%) cases
• Empty assessments• Search for reason to
close• 23 domestic violence
• 1 CP Monitoring• 1 Support
Services ProvidedAccommodation 12
34%Monitoring 11
31%Support 3 9%ADL/OT 3 9%CAMHS 2 6%Play scheme 1 3%Counselling 1 3%Psychiatric
treatment 1 3%Financial payment 1 3%Total 35

100%
85%
152 children87 families Referrals
83 children37 families
100%
79%
23 children18 families
30%
Child in Need s17
Child Concern report
32 families
Child ProtectionS.47 46 children
37%
Type of Referral and Possible CAFType of Referral and Possible CAF
CAF 38 (46%)20 (54%)Families Children
CAF 4 (9%)4 (13%)Families Children
CAF 7 (30%)5 (28%)Families Children

INITIAL RESULTS
Referrals accepted and progressed.Week ending 28.9.07 83 referrals acceptedWeek ending 5.10.07 85 referrals acceptedWeek ending 12.10.07 74 referrals acceptedWeek ending 19.10.07 71 referrals acceptedWeek ending 2.11.07 61 referrals acceptedWeek ending 9.11.07 58 referrals accepted 30.1% reduction in referrals accepted.


SOCIAL DEVELOPMENT IN MOLDOVA
Key features of social development relevant to child protection are:•Strengths-basis acknowledging and focussing on family and community assets and aiming to promote resilience•Social investments that enhance capabilities including: “employment placement, childcare, adult literacy, micro-enterprise, and asset savings accounts” (Midgley & Conley, 2010: xii–xiv)•Interdisciplinary focus including promoting access to housing, medical care, education, and recreational facilities•Community focussed working with communities to combat social exclusion•Advocacy based rather than a narrow preoccupation with practice with families and children

ACTIVE ASSESSMENT
Workers assess family strengths and needs across six wellbeing domains: •living conditions, •family and social relationships, •behaviour, •physical and mental health, •education, •employment •household economy

REPORTED OUTCOMES OF ACTIVE APPROACH, MOLDOVA 2014
Results for 127 children completing prevention programme in Moldova and 67 with post completion follow up. Similar results for larger group in Bulgaria:
•Better relationships: Decreases in risks due to poor relationships between mother and child (33.9% falls to 3.1%); Father and child (67.7% falls to 33.9%); and between parents (85.8% falls to 37.8%)
•Employment and household economy: The number of households where no-one worked fell from 78.0% to 24.4% and by the end of the programme only 11% had no stable monthly income compared to 81.8% at the initial assessment.
•Improved Housing: 5 risk factors, fall from 45.7% to 12.6% in temporary housing and from 75.6% to 14.2% without basic utilities/furniture. For 67 with follow up increase from 7 (10.4%) to 41(61.2%) with no risks
•Safer Environment: E.g. number of children living in families with verbally and/or physically aggressive behaviour fell from 67.7% to 7.1% for the 127 who completed the programme.
•Less alcohol and illegal drug problems: Still a problem for some children but excessive alcohol use fell from 55.1% to 16.5% and illegal drugs fell from 5.5% to 1.6%
•Improved health and development: Fall from 33.9% with health problem to 14.2% and developmental delay fell from 49.6% to 11.8%
•Education: more attended preschool care and better attendance at school or kindergarten, more children received support for school work and less struggled with academic skills

WHAT MIGHT A CHILD PROTECTION SYSTEM STRIVE TO ACHIEVE
• Take a social development approach to support families and communities and combat social exclusion and poverty
• Limit child protection investigations to cases with indications of serious harm
• Create a virtuous spiral reducing use of looked after system
• Provide support and counselling to victims of maltreatment

THE VIRTUOUS CYCLESIncreased and improved levels of cooperation
and coordination of services by Health, Education, Social Care and other “Mainstream”
agencies
Increased ability of all services to assess and meet children’s needs leading to reduced levels
of unnecessary child protection investigation
Improved focus on most vulnerable children andincreased levels of diversion from substitute
care
More resources released and made available for intensive family support
More resources released and made available for children in need services

REFERENCES
• Bilson, A., Cant, R. L., Harries, M., & Thorpe, D. H. (2013). A longitudinal study of children reported to the child protection department in Western Australia. British Journal of Social Work, bct164.
• Bilson, A., & Larkins, C. (2013). Providing alternatives to infant institutionalisation in Bulgaria: How gatekeeping can benefit from a social development orientation. Children and Youth Services Review, 35(9), 1566-1575.
• Bywaters, P., Brady, G., Sparks, T., & Bos, E. (2014). Child welfare inequalities: new evidence, further questions. Child & Family Social Work.
• Bywaters, P., Brady, G., Sparks, T., & Bos, E. (2014). Inequalities in child welfare intervention rates: the intersection of deprivation and identity. Child & Family Social Work.
• Daniel, J., Newberger, E., Reed, R. and Kotelchuk, M. (1978) ‘Child abuse screening: Implications of the limited predictive power of abuse discriminants from a controlled family study of pediatric social illness’, Child Abuse and Neglect, 2, pp. 247–59.
• Gilbert, R., Fluke, J., O'Donnell, M., Gonzalez-Izquierdo, A., Brownell, M., Gulliver, P., ... & Sidebotham, P. (2012). Child maltreatment: variation in trends and policies in six developed countries. The Lancet, 379(9817), 758-772
• Harries, M., Cant, R. L., Bilson, A., & Thorpe, D. (2014). Responding to information about children in adversity: ten years of a differential response model in Western Australia. Child abuse & neglect.
• O’Donnell, M., Nassar, N., Leonard, H., Jacoby, P., Mathews, R., Patterson, Y., & Stanley, F. (2010). Characteristics of non-Aboriginal and Aboriginal children and families with substantiated child maltreatment: a population-based study. International journal of epidemiology, 39(3), 921-928.