Embed Size (px)
Citation preview

Transit Agency StatusCounty of Carbon
Presented on January 20, 2012

2
CCCT Overview
◦ Services
3 fixed routes, 1 bus
23 vans, 19 daily vehicle runs

3
Transit Agency Status CCCT
FY2011 Financial Position

4
Current Financial Position
Note: Does not include fixed assets (cost of $1.5M). These assets are included on the books of the County.
(in 000s) FY2011
Total assets $1,289
Total liabilities $1,412
Total net assets (deficit) $(123)
46%
50%
4%
AssetsLiabilitiesNet Assets

5
Current Financial Position
Current assets includes no receivables outstanding longer than 90 days
All accounts payable are current Restricted deficit is the result of
cumulative operating losses in the CCCT Van division
6
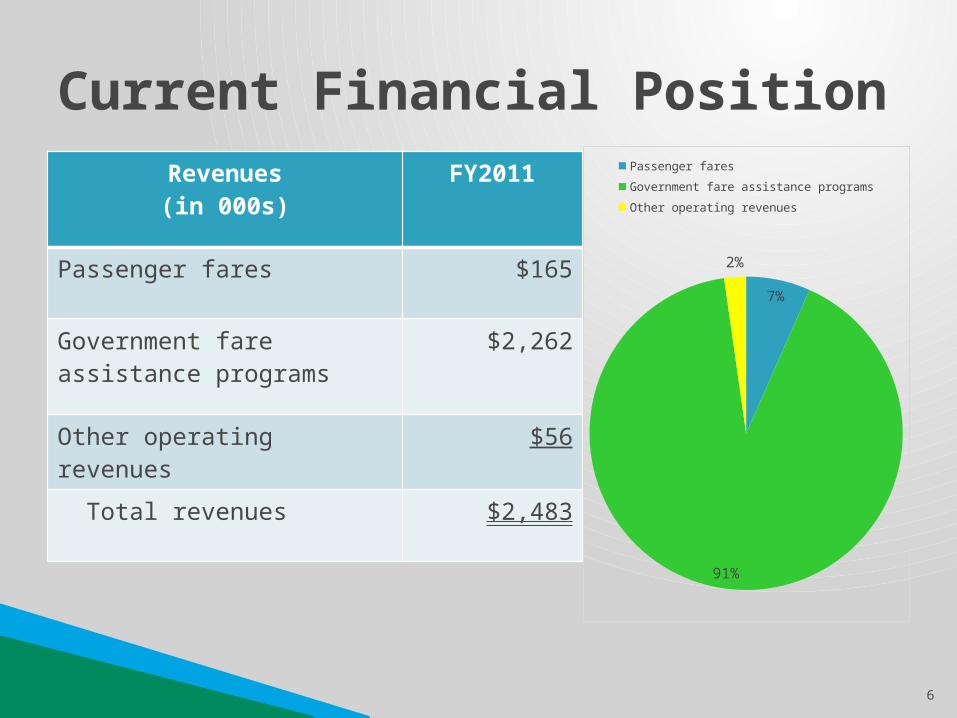
Current Financial PositionRevenues(in 000s)
FY2011
Passenger fares $165
Government fare assistance programs
$2,262
Other operating revenues $56
Total revenues $2,483
7%
91%
2%
Passenger fares
Government fare assistance programs
Other operating revenues

7
Current Financial PositionOperating Expenses
(in 000s)FY2011
Purchased transportation $2,467
Services $249
Other expenses $37
Total operating expenses $2,753
90%
9%
1%
Purchased transportation
Services
Other operating expenses

8
Transit Agency Status CCCT
FY2011 Current Operations

9
An organization chart is provided as Handout #1
All management and administration activates are provided by LANta staff
All transportation services, including trip reservation, scheduling, and provision of service are subcontracted to Easton Coach Company
Staffing Level/Org Chart

10
Important Contract Provisions
All drivers are employees of Easton Coach Company
ECC employs an equal number of full-and part-time drivers
Average wage is $10.75 ECC handles wage and benefit
administration for its employees

11
Fuel
Current Cost per Gallon◦ Contract rate or market rate? Market –
purchased at the pump because there are no fuel facilities on the property
Projected Cost per Gallon and Basis for Projection◦ Contract rate or market rate? Market – no plans
to install fuel tank on the property

12
Fixed Route FaresFare Type
Date of Last
IncreaseCurren
t Amoun
t
Date of Planned Increase
Amount After
Planned Increase
Zone Fare 04/01/2007 $1.50 N/A N/A
In-county $1.50 N/A N/A
Out-of-county $2.50 N/A N/A
13
Shared Ride Fares Date of Last Fare Increase – 10/01/2008
Current ◦ Average fare - $19.61◦ CCCT has sponsorship arrangements with the County
Area Agencies on Aging and MH/MR agencies
Planned Changes◦ Date of planned increase - 10/01/2012◦ Estimated average fare - $21.50◦ There are no planned changes to the existing
sponsorship arrangements

14
Other Major Factors Producing Cost Increases Beyond Inflation
Factors Current Amount
Projected Future Amount
Explanation
Fuel costs $76K (Included in
purchased transportation
)
? Costs are controlled by market factors at time of purchase
Service demand
$2,467K $2,590K Costs are controlled by contract rates and demand for services

15
Cost Savings InitiativesInitiative Current
CostPlanned Action and
Implementation DateProjecte
d Savings
Providing MATP services on normal working days
N/A 1/1/12 $100K
Operations needs Assessment
N/A FY12 $ value unknown; should result in improved service efficiency

16
Quality Control/ProductivityInitiative Cost Planned Action and
Implementation DateProjected Benefit
MDT/AVL $1.5M FY13 Using data to streamline system
Operations needs Assessment
$120K FY12 Providing service more efficiently to meet demand

17
Transit Agency Status CCCT
FY2011 Service Statistics/ Trends

18
Fixed Route Service Statistics/ Trends(in 000s)
Describe Any Proposed Changes
Fixed Route FY 2010-11
FY 2011-12
FY 2012-13
FY 2013-14
FY 2014-15
Rev. Veh. Miles 34 34 34 34 34
Rev. Veh. Hours 2 2 2 2 2
Passenger Trips 7 7 8 8 8
ACT 44 PERFORMANCE MEASURES
Pass. Trips/Hour 3.5 3.5 4 4 4
Op. Cost/Hour $46.07 $47.91 $49.35 $51.08 $52.61
Op. Rev./Hour $0.80 $0.80 $0.80 $0.80 $0.80
Op. Cost/Trip $13.16 $13.69 $12.34 $12.77 $13.15

19
Shared Ride Statistics/Trends (in 000s)
Shared-Ride FY 2010-11
FY 2011-12
FY 2012-13
FY 2013-14
FY 2014-15
Total Veh. Miles
899 926 954 982 1,012
Cost per Mile $2.96 $2.98 $3.00 $3.01 $3.03
Total Veh. Hours
42 43 44 45 46
Cost per Hour $63.26 $64.26 $64.99 $65.46 $66.59
Total Pass. Trips
72 74 76 78 80
Cost per Trip $36.90 $37.34 $37.63 $37.76 $38.29
Rev. per Trip $34.46 $33.79 $35.55 $35.69 $35.86
Trips per Hour 1.71 1.72 1.73 1.73 1.74

20
Transit Agency Status CCCT
FY2011 Funding Statistics/ Trends

21
Fixed Route Funding(in 000s)
FY 2010-
11
FY 2011-
12
FY 2012-
13
FY 2013-
14
FY 2014-
15
Total Operating Expenses 92 96 99 102 105
Total Operating Revenue 2 2 2 2 2
Total Operating Deficit 90 94 97 100 103
Subsidies:
Federal 0 0 0 0 0
State 87 91 94 97 100
Local 3 3 3 3 3
Total Funding 90 94 97 100 103
Balance (Cumulative) $0 $0 $0 $0 $0

22
Shared Ride Funding(in 000s)
FY 2010-
11
FY 2011-
12
FY 2012-
13
FY 2013-
14
FY 2014-
15
Operating Expense $2,657 $2,763 $2,860 $2,946 $3,063
Passenger Revenue $163 $228 $186 $192 $199
Lottery $610 $616 $684 $705 $726
MATP $1,577 $1,524 $1,684 $1,735 1,787
Other (Includes ADA charges)
$131 $133 $148 $152 $157
Subsidies:
Federal 70 107 107 107 107
State 195 190 187 186 188
Local 37 37 37 37 37
Balance (Cumulative) $(123) $(51) $122 $290 $428

23
Transit Agency Status CCCT
FY2011 Other Information/ Assumptions

24
Other Information
LANta and PennDOT are working together on an Operations Needs Assessment for CCCT as a whole
It will be a comprehensive study of the existing fixed-route and shared ride services combined with an analysis of the transportation needs within the County

25
Transit Agency Status CCCT
Capital Status Review

26
Capital Status Review
Current Fixed-Route Projects◦ No current projects
Current Shared Ride Projects◦ Purchase 7 cut-away buses

27
Capital Status Review
Short-term Future Fixed-Route Projects◦ Replacement of LYNX vehicle◦ Shelter/sign program (in conjunction with
Operations Needs Assessment)
Short-term Future Shared Ride Projects◦ Replacement of 16 cut-away buses (existing
fleet)◦ Replacement of paratransit scheduling software◦ Implementation of MDT/AVL system