Embed Size (px)
Citation preview
Presented by
Dileep K. Birur
Based on joint work with Robert H. Beach
RTI International
Analyzing the Impacts of U.S. Biofuels Production and Trade Policies in a CGE
Framework
Forestry and Agriculture Greenhouse Gas Modeling Forum
Workshop #6 Forestry, Agriculture and Climate Change: Modeling to Support Policy Analyses
September 26-29, 2011. National Conservation Training CenterShepherdstown, WV.
3040 Cornwallis Road ■ P.O. Box 12194 ■ Research Triangle Park, NC 27709Phone 919-485-5527 E-mail [email protected] 919-541-6683
2
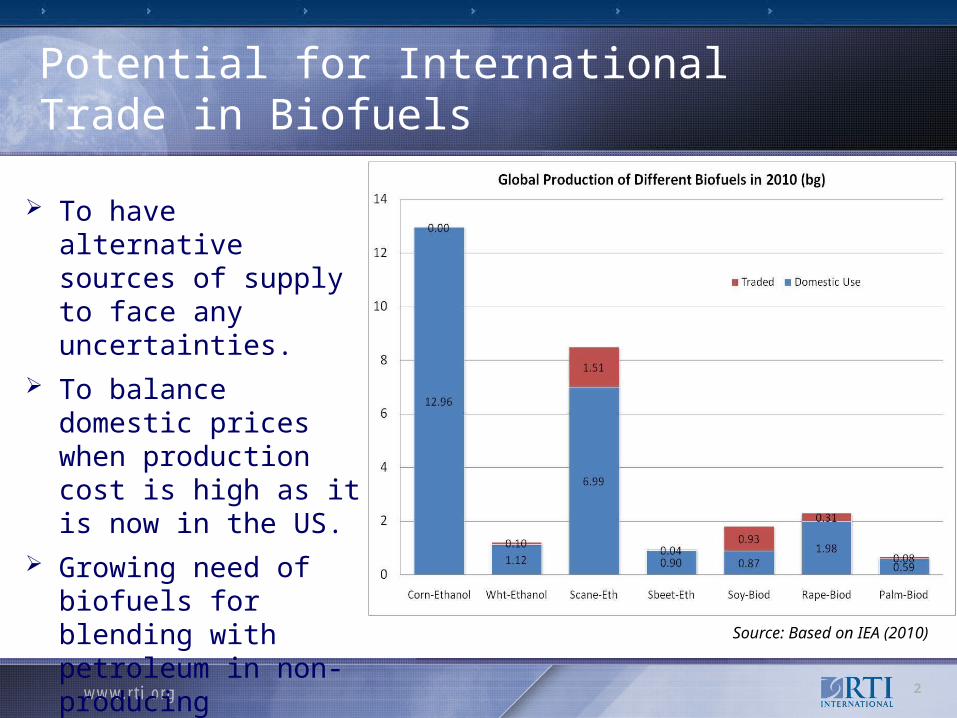
Potential for International Trade in Biofuels
To have alternative sources of supply to face any uncertainties.
To balance domestic prices when production cost is high as it is now in the US.
Growing need of biofuels for blending with petroleum in non-producing countries.
Source: Based on IEA (2010)
3
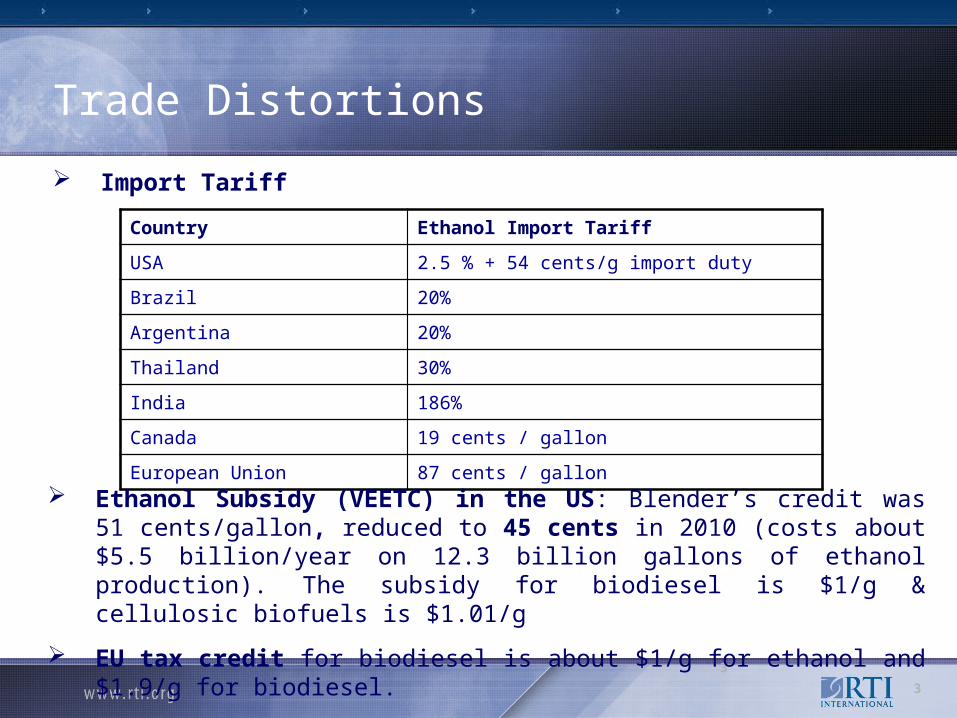
Country Ethanol Import Tariff
USA 2.5 % + 54 cents/g import duty
Brazil 20%
Argentina 20%
Thailand 30%
India 186%
Canada 19 cents / gallon
European Union 87 cents / gallon
Ethanol Subsidy (VEETC) in the US: Blender’s credit was 51 cents/gallon, reduced to 45 cents in 2010 (costs about $5.5 billion/year on 12.3 billion gallons of ethanol production). The subsidy for biodiesel is $1/g & cellulosic biofuels is $1.01/g
EU tax credit for biodiesel is about $1/g for ethanol and $1.9/g for biodiesel.
Trade Distortions
Import Tariff
3
4
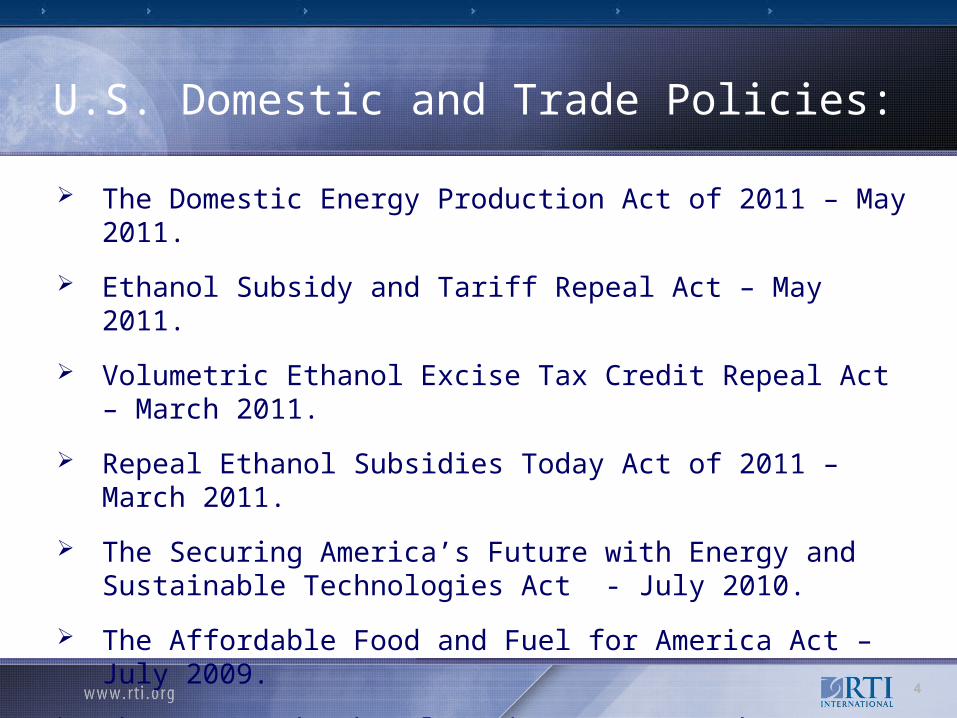
U.S. Domestic and Trade Policies:
The Domestic Energy Production Act of 2011 – May 2011.
Ethanol Subsidy and Tariff Repeal Act – May 2011.
Volumetric Ethanol Excise Tax Credit Repeal Act – March 2011.
Repeal Ethanol Subsidies Today Act of 2011 – March 2011.
The Securing America’s Future with Energy and Sustainable Technologies Act - July 2010.
The Affordable Food and Fuel for America Act – July 2009.
The Imported Ethanol Parity Act – March 2009.
The US Food, Conservation and Energy Act 2008.
5
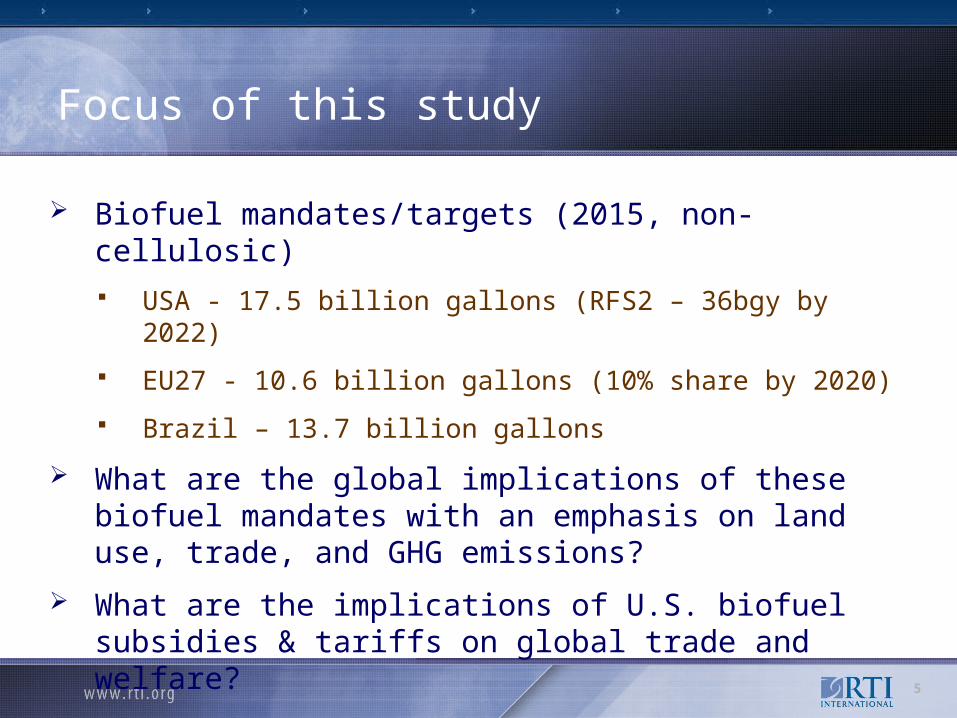
Focus of this study
Biofuel mandates/targets (2015, non-cellulosic) USA - 17.5 billion gallons (RFS2 – 36bgy by 2022)
EU27 - 10.6 billion gallons (10% share by 2020)
Brazil – 13.7 billion gallons
What are the global implications of these biofuel mandates with an emphasis on land use, trade, and GHG emissions?
What are the implications of U.S. biofuel subsidies & tariffs on global trade and welfare?
Interaction of biofuel mandates and incentive policies.
6
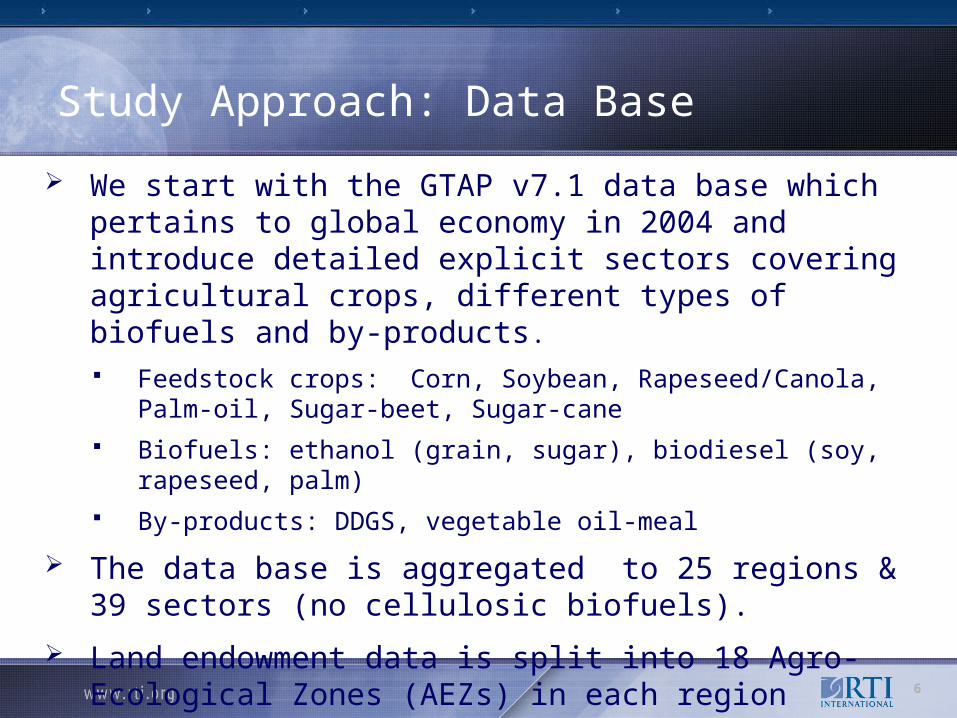
Study Approach: Data Base
We start with the GTAP v7.1 data base which pertains to global economy in 2004 and introduce detailed explicit sectors covering agricultural crops, different types of biofuels and by-products.
Feedstock crops: Corn, Soybean, Rapeseed/Canola, Palm-oil, Sugar-beet, Sugar-cane
Biofuels: ethanol (grain, sugar), biodiesel (soy, rapeseed, palm)
By-products: DDGS, vegetable oil-meal
The data base is aggregated to 25 regions & 39 sectors (no cellulosic biofuels).
Land endowment data is split into 18 Agro-Ecological Zones (AEZs) in each region (Avetisyan et al. 2011).
7
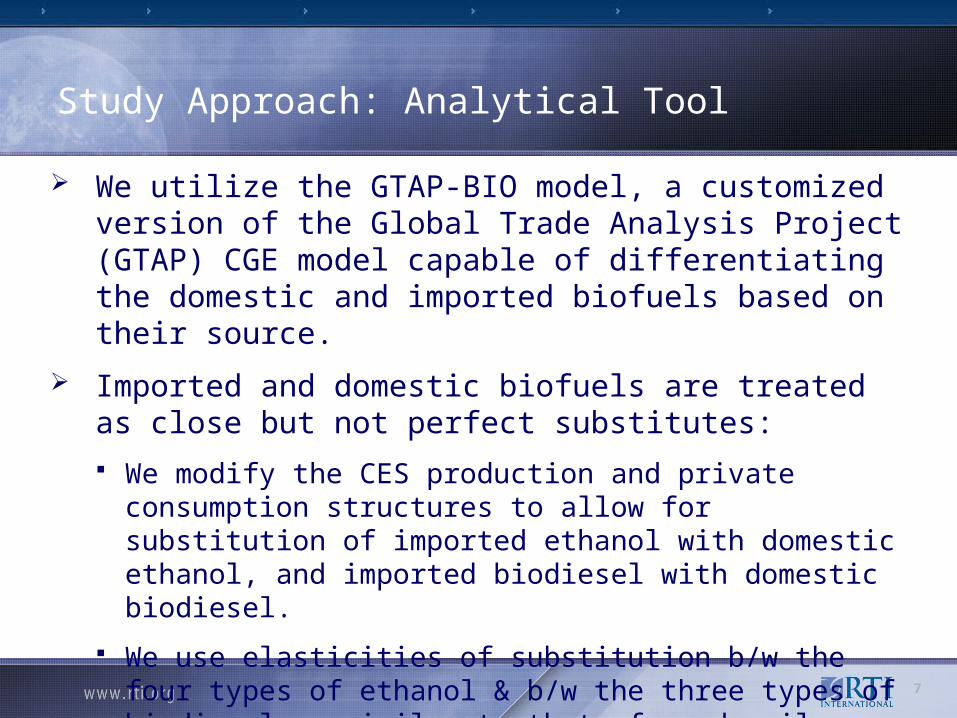
Study Approach: Analytical Tool
We utilize the GTAP-BIO model, a customized version of the Global Trade Analysis Project (GTAP) CGE model capable of differentiating the domestic and imported biofuels based on their source.
Imported and domestic biofuels are treated as close but not perfect substitutes: We modify the CES production and private consumption
structures to allow for substitution of imported ethanol with domestic ethanol, and imported biodiesel with domestic biodiesel.
We use elasticities of substitution b/w the four types of ethanol & b/w the three types of biodiesel – similar to that of crude oil.
8
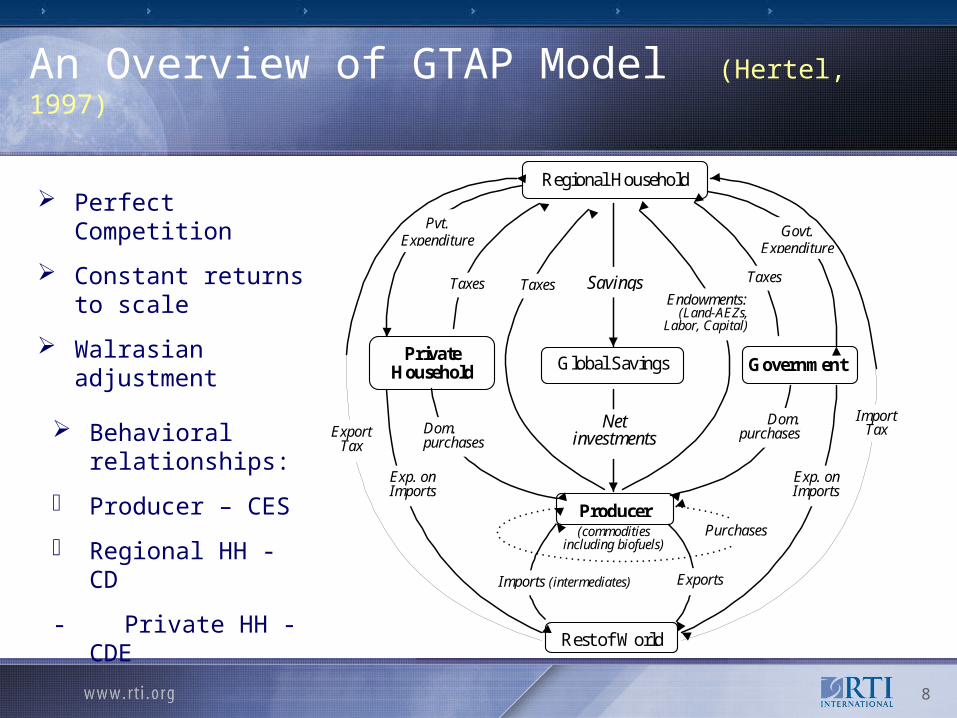
An Overview of GTAP Model (Hertel, 1997)
Rest of World
Savings
Net investments
Global Savings
Regional Household
Producer
Government Private
Household
Exports Imports (intermediates)
Govt. Expenditure
Import Tax
Pvt. Expenditure
Export Tax
Exp. on Imports
Exp. on Imports
Dom. purchases Dom.
purchases
Taxes Taxes Taxes Endowments:
(Land-AEZs, Labor, Capital)
Purchases (commodities including biofuels)
Perfect Competition
Constant returns to scale
Walrasian adjustment
Behavioral relationships:
- Producer – CES
- Regional HH - CD
- Private HH - CDE
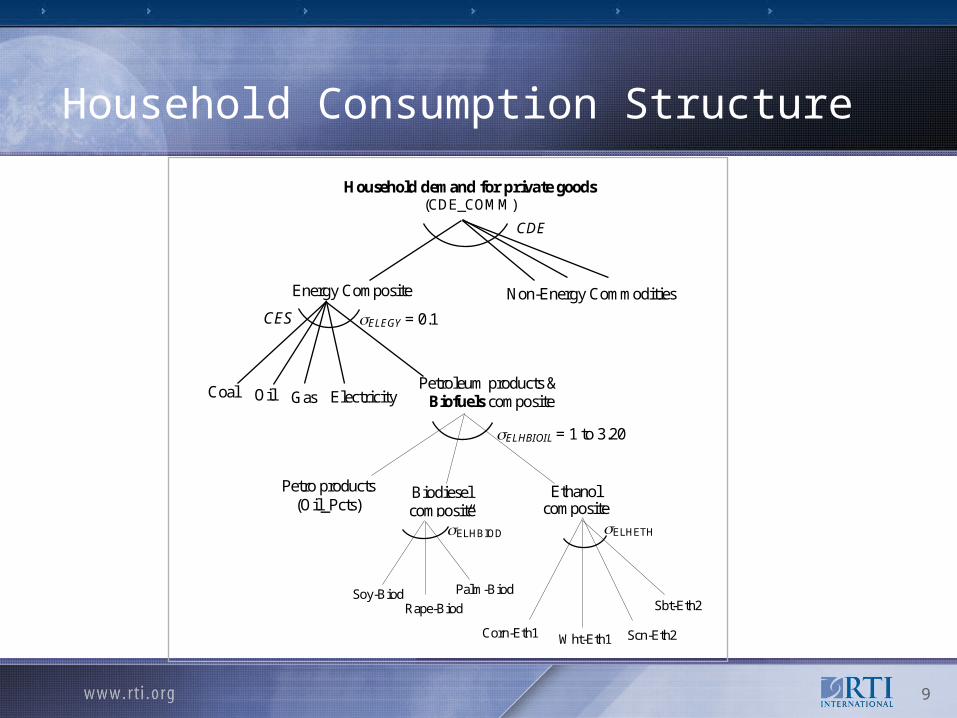
Household Consumption Structure
9
Household demand for private goods (CDE_COMM)
Energy Composite
CDE
Non-Energy Commodities
Coal Petroleum products & Biofuels composite
ELEGY = 0.1
Petro products (Oil_Pcts)
ELHBIOIL = 1 to 3.20
Oil Gas Electricity
CES
Biodiesel composite (“heths”)
Ethanol composite
Corn-Eth1 Wht-Eth1
ELHETH
Scn-Eth2
Sbt-Eth2
ELHBIOD
Palm-Biod
Rape-Biod Soy-Biod
10
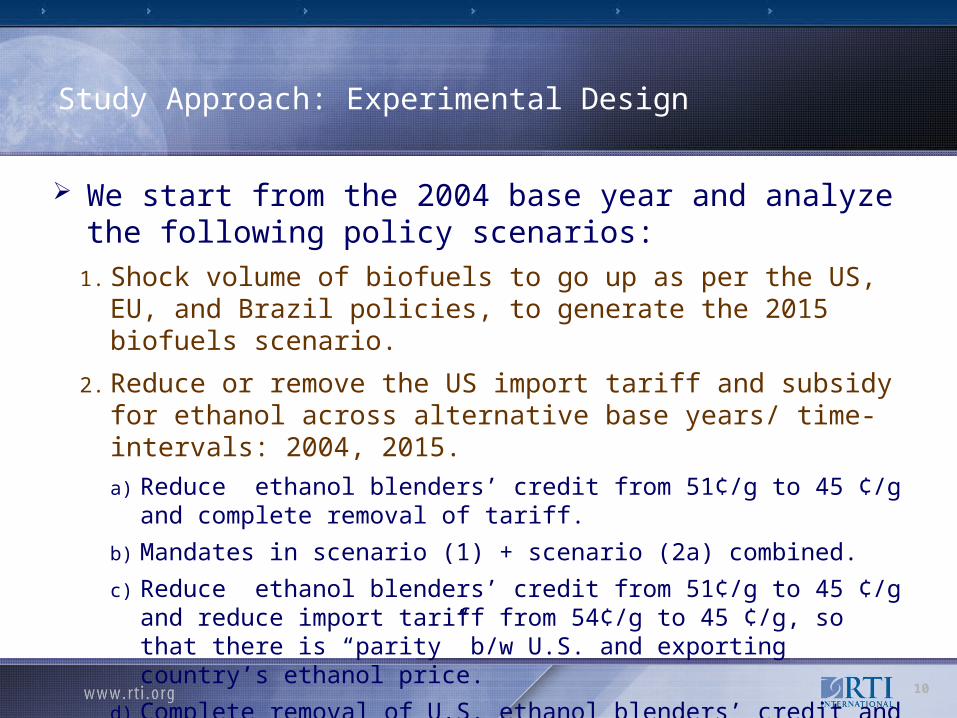
Study Approach: Experimental Design
We start from the 2004 base year and analyze the following policy scenarios:
1. Shock volume of biofuels to go up as per the US, EU, and Brazil policies, to generate the 2015 biofuels scenario.
2. Reduce or remove the US import tariff and subsidy for ethanol across alternative base years/ time-intervals: 2004, 2015.a) Reduce ethanol blenders’ credit from 51¢/g to 45 ¢/g and
complete removal of tariff.
b) Mandates in scenario (1) + scenario (2a) combined.
c) Reduce ethanol blenders’ credit from 51¢/g to 45 ¢/g and reduce import tariff from 54¢/g to 45 ¢/g, so that there is “parity” b/w U.S. and exporting country’s ethanol price.
d) Complete removal of U.S. ethanol blenders’ credit and import tariff.
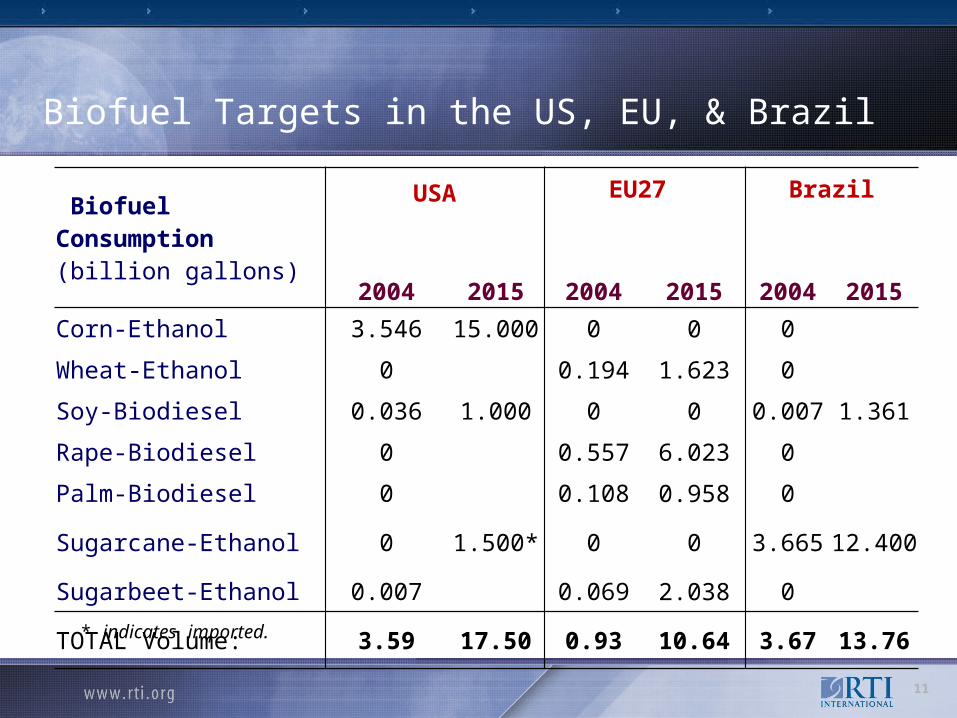
Biofuel Targets in the US, EU, & Brazil
Biofuel Consumption (billion gallons)
USA EU27 Brazil
2004 2015 2004 2015 2004 2015
Corn-Ethanol 3.546 15.000 0 0 0
Wheat-Ethanol 0 0.194 1.623 0
Soy-Biodiesel 0.036 1.000 0 0 0.007 1.361
Rape-Biodiesel 0 0.557 6.023 0
Palm-Biodiesel 0 0.108 0.958 0
Sugarcane-Ethanol 0 1.500* 0 0 3.665 12.400
Sugarbeet-Ethanol 0.007 0.069 2.038 0
TOTAL Volume: 3.59 17.50 0.93 10.64 3.67 13.76* indicates imported.
11
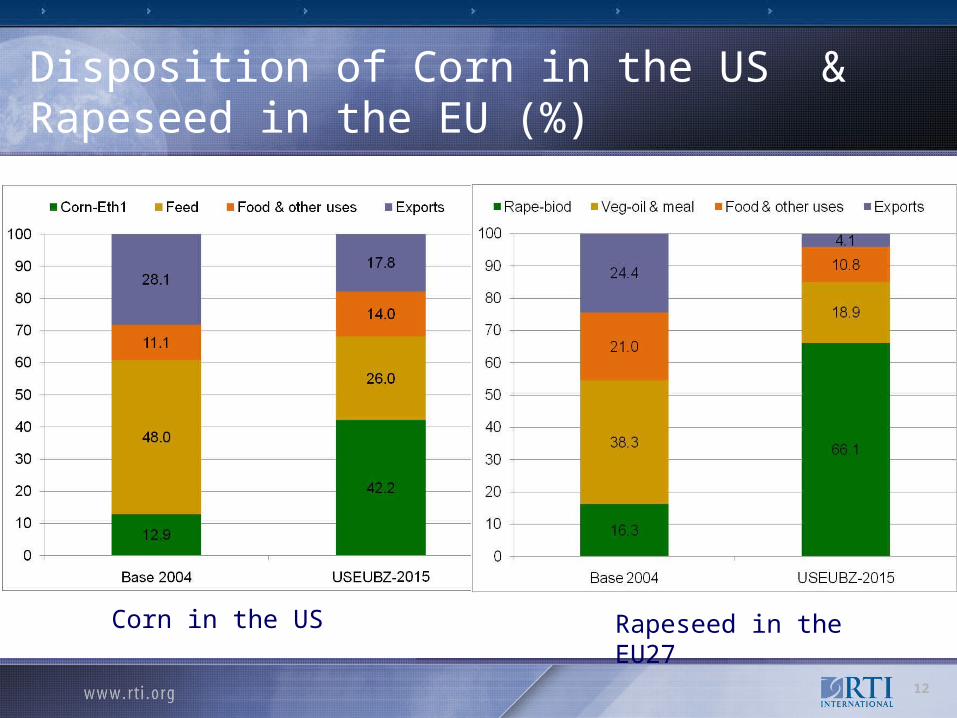
Disposition of Corn in the US & Rapeseed in the EU (%)
Corn in the US Rapeseed in the EU27
12
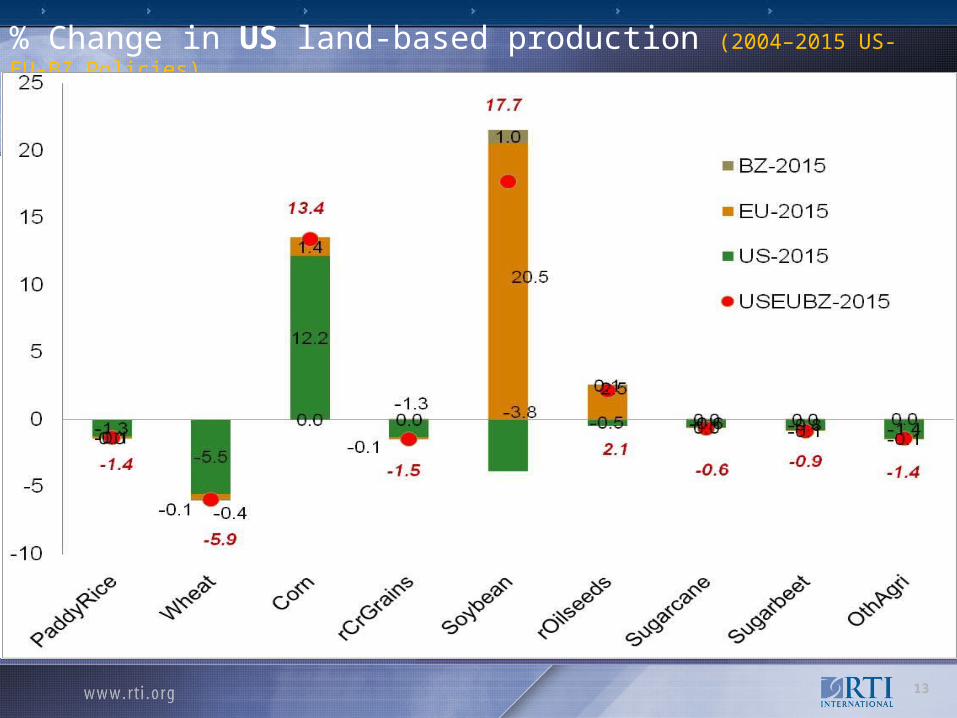
% Change in US land-based production (2004–2015 US-EU-BZ Policies)
13
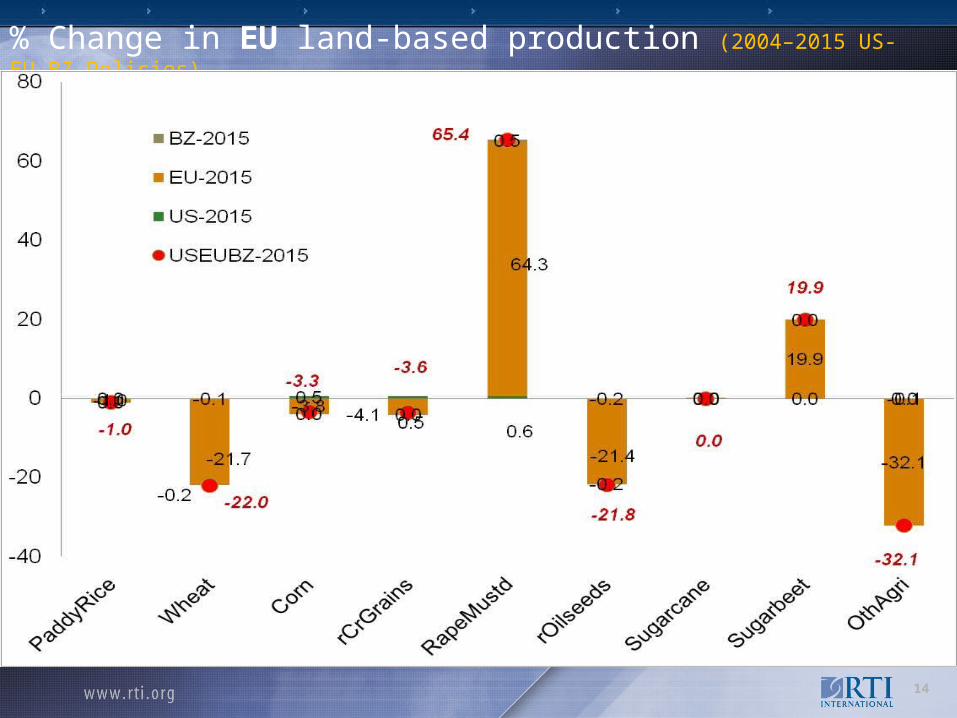
% Change in EU land-based production (2004–2015 US-EU-BZ Policies)
14
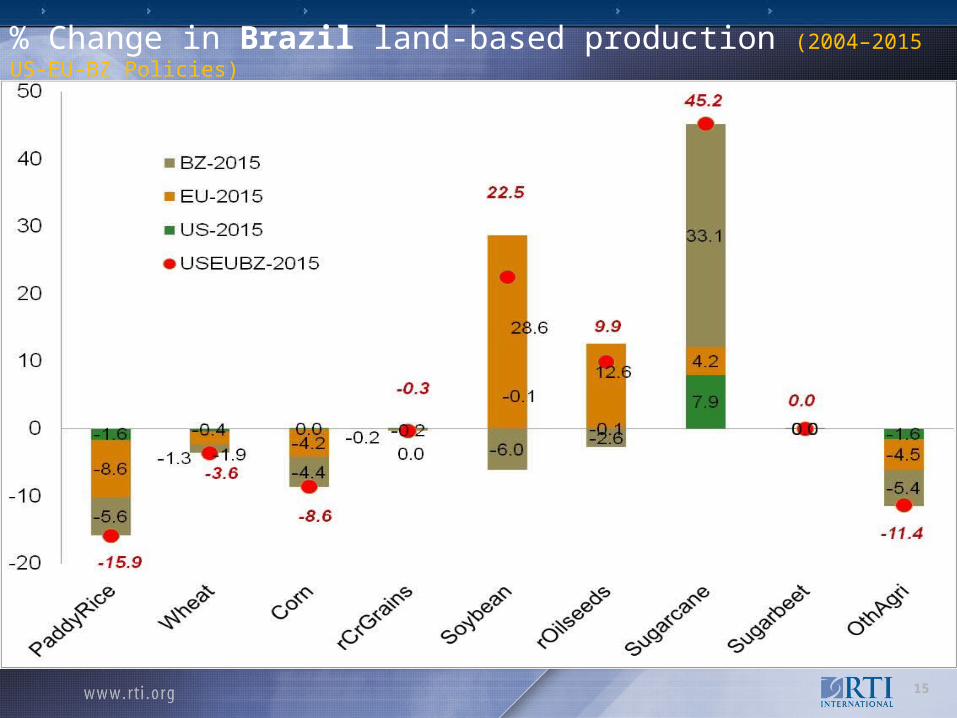
% Change in Brazil land-based production (2004–2015 US-EU-BZ Policies)
15
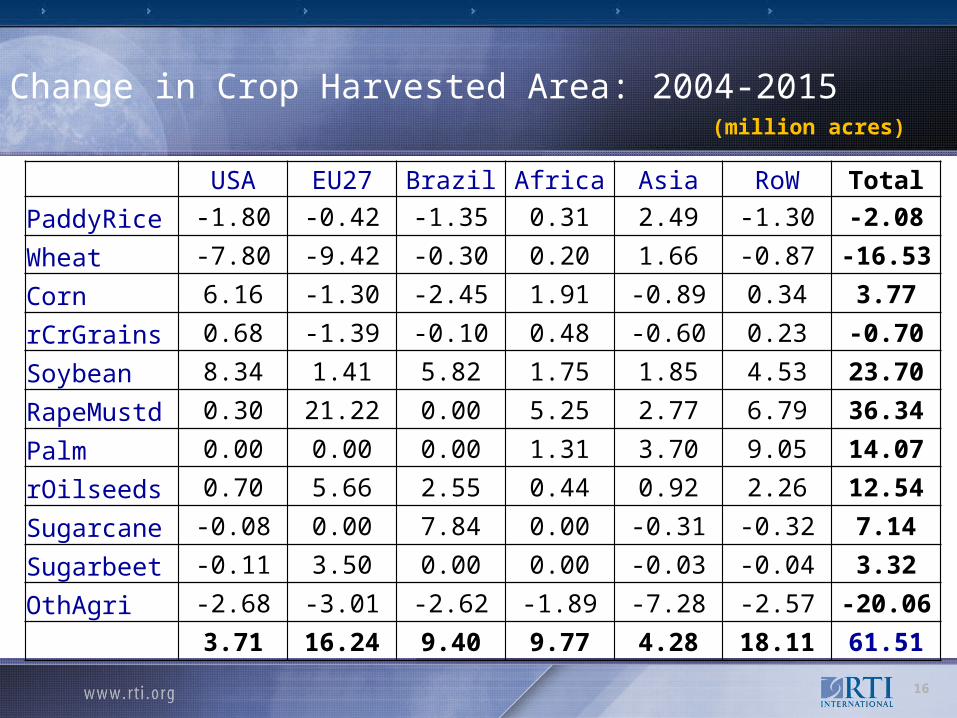
Change in Crop Harvested Area: 2004-2015 (million acres)
USA EU27 Brazil Africa Asia RoW Total
PaddyRice -1.80 -0.42 -1.35 0.31 2.49 -1.30 -2.08
Wheat -7.80 -9.42 -0.30 0.20 1.66 -0.87 -16.53
Corn 6.16 -1.30 -2.45 1.91 -0.89 0.34 3.77
rCrGrains 0.68 -1.39 -0.10 0.48 -0.60 0.23 -0.70
Soybean 8.34 1.41 5.82 1.75 1.85 4.53 23.70
RapeMustd 0.30 21.22 0.00 5.25 2.77 6.79 36.34
Palm 0.00 0.00 0.00 1.31 3.70 9.05 14.07
rOilseeds 0.70 5.66 2.55 0.44 0.92 2.26 12.54
Sugarcane -0.08 0.00 7.84 0.00 -0.31 -0.32 7.14
Sugarbeet -0.11 3.50 0.00 0.00 -0.03 -0.04 3.32
OthAgri -2.68 -3.01 -2.62 -1.89 -7.28 -2.57 -20.06
3.71 16.24 9.40 9.77 4.28 18.11 61.51
16
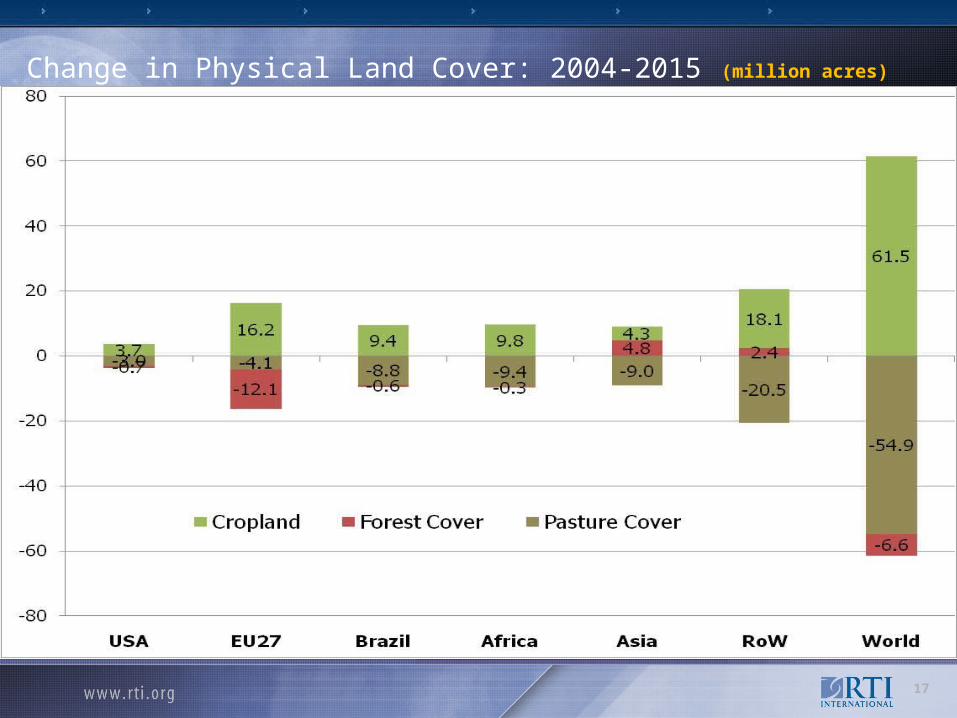
Change in Physical Land Cover: 2004-2015 (million acres)
17
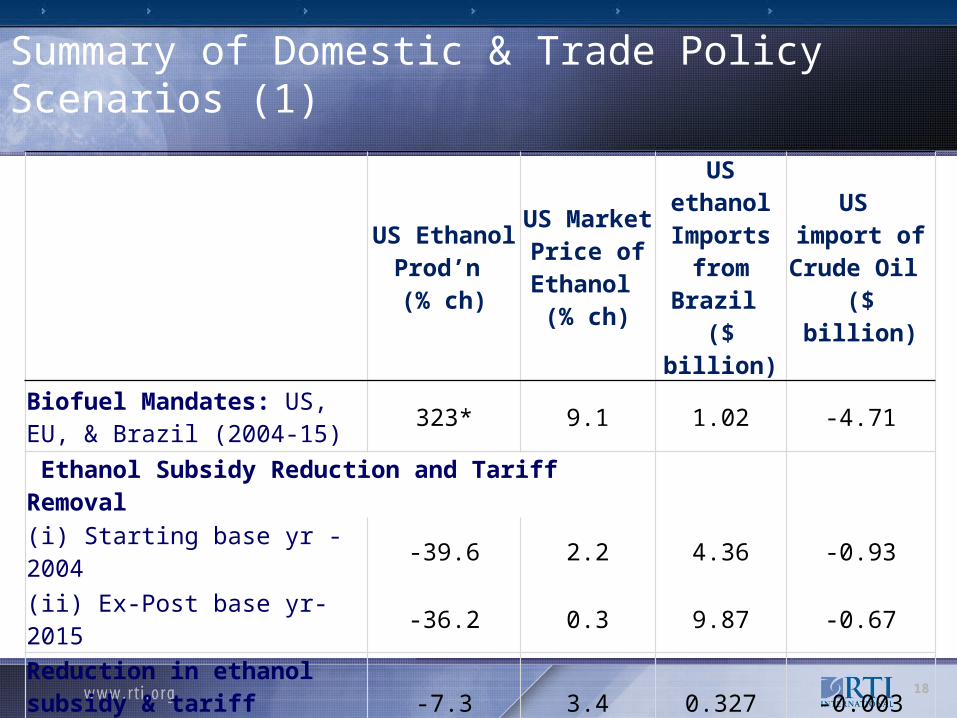
Summary of Domestic & Trade Policy Scenarios (1)
US Ethanol Prod’n (% ch)
US Market Price of Ethanol (% ch)
US ethanol Imports
from Brazil ($ billion)
US import of Crude Oil ($ billion)
Biofuel Mandates: US, EU, & Brazil (2004-15)
323* 9.1 1.02 -4.71
Ethanol Subsidy Reduction and Tariff Removal
(i) Starting base yr -2004 -39.6 2.2 4.36 -0.93
(ii) Ex-Post base yr-2015 -36.2 0.3 9.87 -0.67
Reduction in ethanol subsidy & tariff (parity) – base yr 2004
-7.3 3.4 0.327 -0.003
Removal of ethanol subsidy & tariff - base yr 2004
-67.1 46.5 5.91 -1.82
18
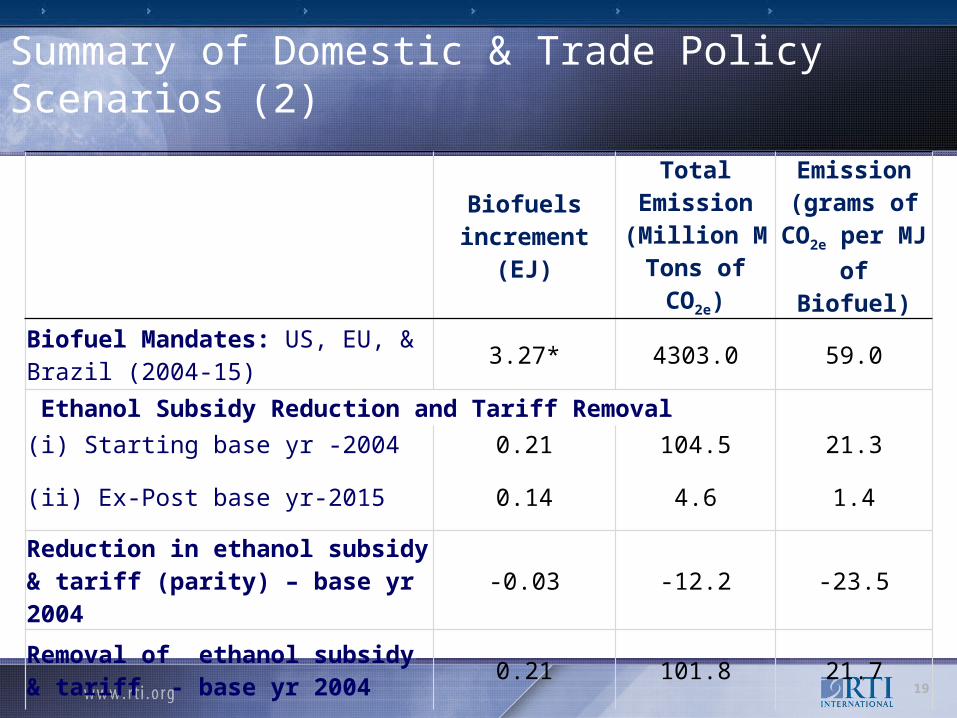
Summary of Domestic & Trade Policy Scenarios (2)
Biofuels increment (EJ)
Total Emission (Million M
Tons of CO2e)
Emission (grams of
CO2e per MJ of Biofuel)
Biofuel Mandates: US, EU, & Brazil (2004-15)
3.27* 4303.0 59.0
Ethanol Subsidy Reduction and Tariff Removal
(i) Starting base yr -2004 0.21 104.5 21.3
(ii) Ex-Post base yr-2015 0.14 4.6 1.4
Reduction in ethanol subsidy & tariff (parity) – base yr 2004
-0.03 -12.2 -23.5
Removal of ethanol subsidy & tariff - base yr 2004
0.21 101.8 21.7
19
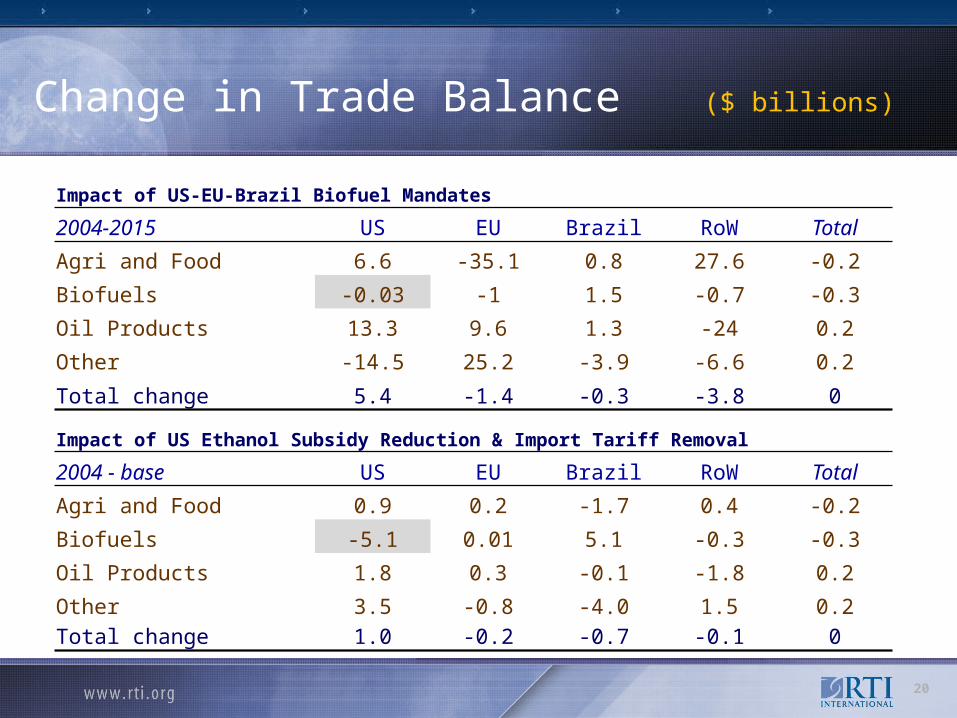
Change in Trade Balance ($ billions)
Impact of US-EU-Brazil Biofuel Mandates
2004-2015 US EU Brazil RoW Total
Agri and Food 6.6 -35.1 0.8 27.6 -0.2
Biofuels -0.03 -1 1.5 -0.7 -0.3
Oil Products 13.3 9.6 1.3 -24 0.2
Other -14.5 25.2 -3.9 -6.6 0.2
Total change 5.4 -1.4 -0.3 -3.8 0
Impact of US Ethanol Subsidy Reduction & Import Tariff Removal
2004 - base US EU Brazil RoW Total
Agri and Food 0.9 0.2 -1.7 0.4 -0.2
Biofuels -5.1 0.01 5.1 -0.3 -0.3
Oil Products 1.8 0.3 -0.1 -1.8 0.2
Other 3.5 -0.8 -4.0 1.5 0.2Total change 1.0 -0.2 -0.7 -0.1 0
20
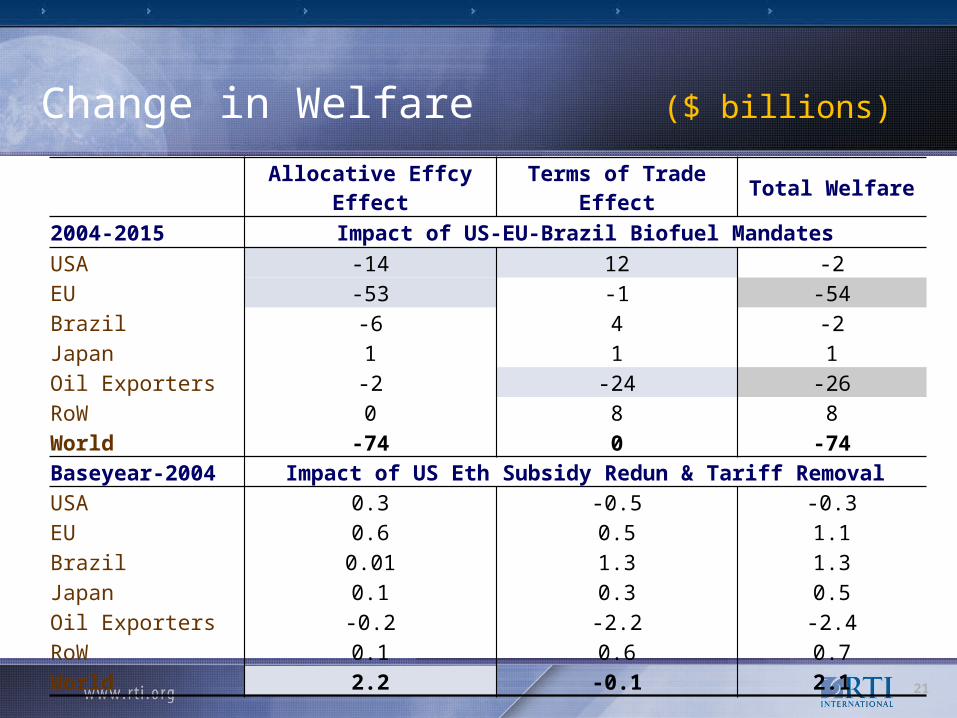
Change in Welfare ($ billions)
Allocative Effcy Effect Terms of Trade Effect Total Welfare
2004-2015 Impact of US-EU-Brazil Biofuel MandatesUSA -14 12 -2EU -53 -1 -54Brazil -6 4 -2Japan 1 1 1Oil Exporters -2 -24 -26RoW 0 8 8World -74 0 -74Baseyear-2004 Impact of US Eth Subsidy Redun & Tariff RemovalUSA 0.3 -0.5 -0.3EU 0.6 0.5 1.1Brazil 0.01 1.3 1.3Japan 0.1 0.3 0.5Oil Exporters -0.2 -2.2 -2.4RoW 0.1 0.6 0.7World 2.2 -0.1 2.1
21
22
Conclusions
Simultaneous implementation of biofuel targets in US, EU and Brazil, lead to rise in crop cover in all regions; leading to release of carbon sequestered in pasture and forests (4303 Pg of CO2e).
Reduction in US ethanol Subsidy and removal of tariff, if implemented along with Biofuel Mandates has no significant impact on land use.
With Mandates, US import of sugar-ethanol from Brazil increases by $1 billion. When ethanol subsidy and import tariff are removed, US imports rise by $5.9 billion (oil imports decline by $1.9billion).
US & EU oil imports fall about $4.7 & $1.8 billions respectively, due to mandates.
The import tariff “parity” experiment has very little impact on biofuel market & trade.
The land use emissions due to removal of subsidy and tariff is only 102 Pg of CO2e.
23
Further Work
Introducing cellulosic feedstock and biofuels.
To expand the model to include marginal lands module (pasture-crop and CRP lands) as they offer potential sectoral competition for land.
Improve the land supply to allow for proper interaction between marginal lands, regular crops, & dedicated energy crops.
24
Thank you
Questions and Comments ?