Embed Size (px)
DESCRIPTION
Standing Committee on Appropriation Programme 4 th Quarter Financial Performance - 2011/12 Financial year 05 September 2012. Presented by: Acting Director-General Mandisa Fatyela --Lindie. Presentation Outline. 1. Budget outcome for 2011/12 will include: - PowerPoint PPT Presentation
Citation preview
Standing Committee on Appropriation Programme
4th Quarter Financial Performance- 2011/12 Financial year
05 September 2012
Presented by:Acting Director-General
Mandisa Fatyela --Lindie
1DPW Briefing to SCOA – 05 September 2012
2
Presentation Outline1. Budget outcome for 2011/12 will include:
Expenditure summary and programmes Monthly expenditure trend Notes to expenditure Monthly expenditure analysis
2.Infrastructure Performance3.EPWP Performance
DPW Briefing to SCOA –05 September 2012
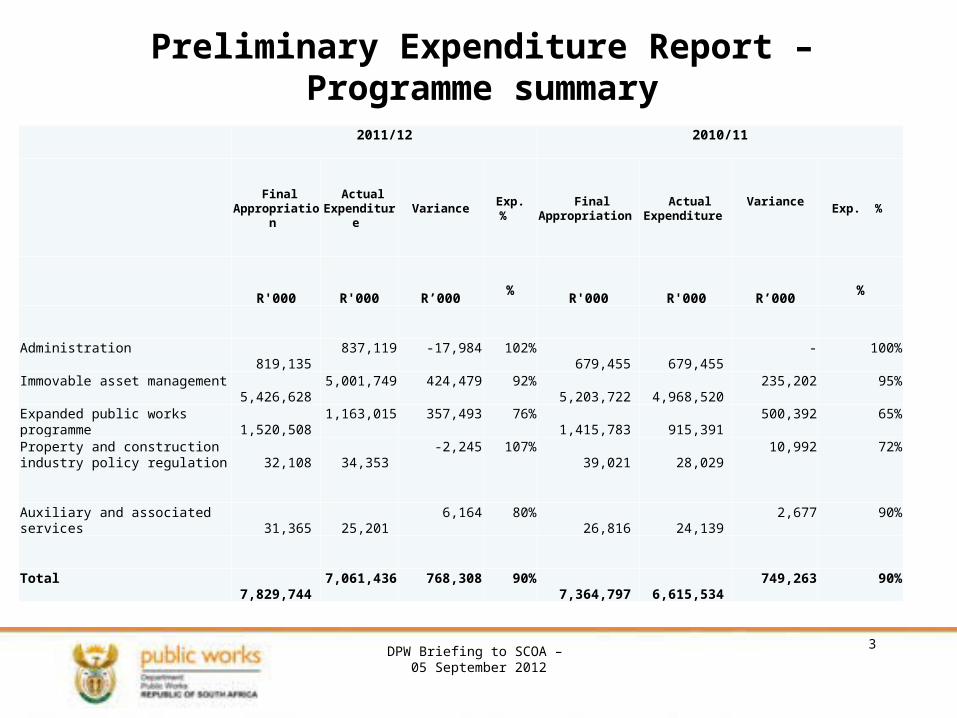
Preliminary Expenditure Report – Programme summary
2011/12 2010/11
FinalAppropriatio
n
ActualExpenditur
e Variance
Exp. %
FinalAppropriation
ActualExpenditure
Variance Exp. %
R'000 R'000 R’000 %
R'000 R'000 R’000 %
Administration 819,135
837,119 -17,984 102% 679,455 679,455 - 100%
Immovable asset management 5,426,628
5,001,749 424,479 92% 5,203,722 4,968,520 235,202 95%
Expanded public works programme
1,520,508
1,163,015 357,493 76% 1,415,783 915,391 500,392 65%
Property and construction industry policy regulation
32,108
34,353 -2,245 107% 39,021 28,029 10,992 72%
Auxiliary and associated services
31,365
25,201 6,164 80% 26,816 24,139 2,677 90%
Total 7,829,744
7,061,436
768,308 90% 7,364,797
6,615,534
749,263 90%
3DPW Briefing to SCOA – 05 September 2012
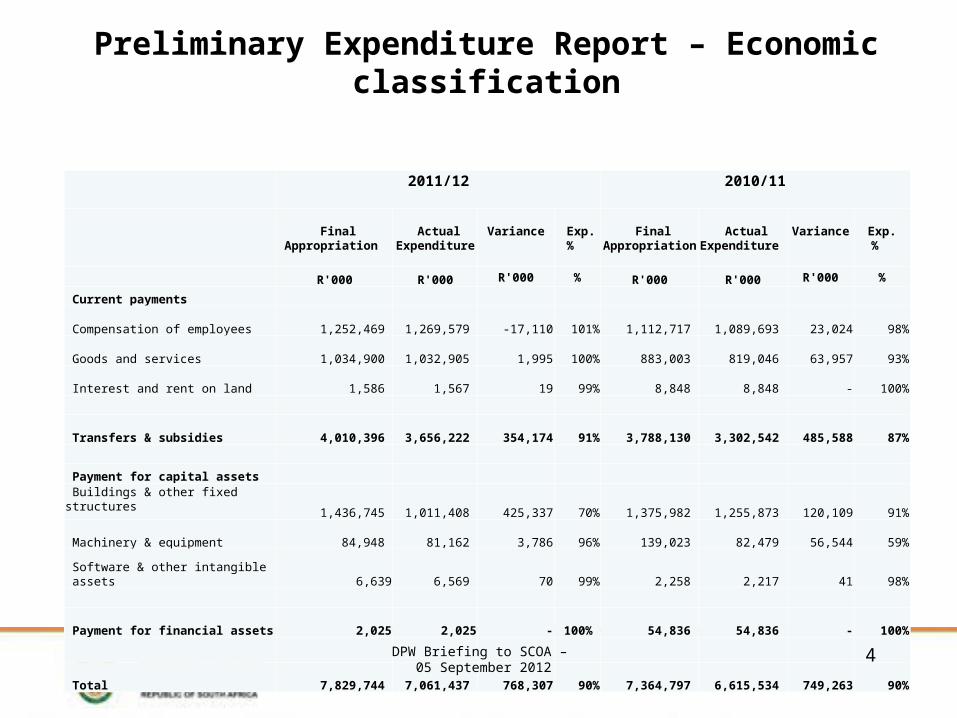
Preliminary Expenditure Report – Economic classification
2011/12 2010/11
Final
Appropriation Actual
Expenditure Variance Exp.
% Final
Appropriation Actual
Expenditure Variance Exp. %
R'000 R'000 R'000 % R'000 R'000 R'000 %
Current payments
Compensation of employees 1,252,469 1,269,579 -17,110 101% 1,112,717 1,089,693 23,024 98%
Goods and services 1,034,900 1,032,905 1,995 100% 883,003 819,046 63,957 93%
Interest and rent on land 1,586 1,567 19 99% 8,848 8,848 - 100%
Transfers & subsidies 4,010,396
3,656,222 354,174 91% 3,788,130 3,302,542 485,588 87%
Payment for capital assets Buildings & other fixed structures
1,436,745 1,011,408 425,337 70% 1,375,982 1,255,873 120,109 91%
Machinery & equipment 84,948 81,162 3,786 96% 139,023 82,479 56,544 59%
Software & other intangible assets 6,639 6,569 70 99% 2,258 2,217 41 98%
Payment for financial assets 2,025 2,025 - 100% 54,836 54,836 - 100%
Total 7,829,744
7,061,437 768,307 90% 7,364,797 6,615,534 749,263 90%
4DPW Briefing to SCOA – 05 September 2012
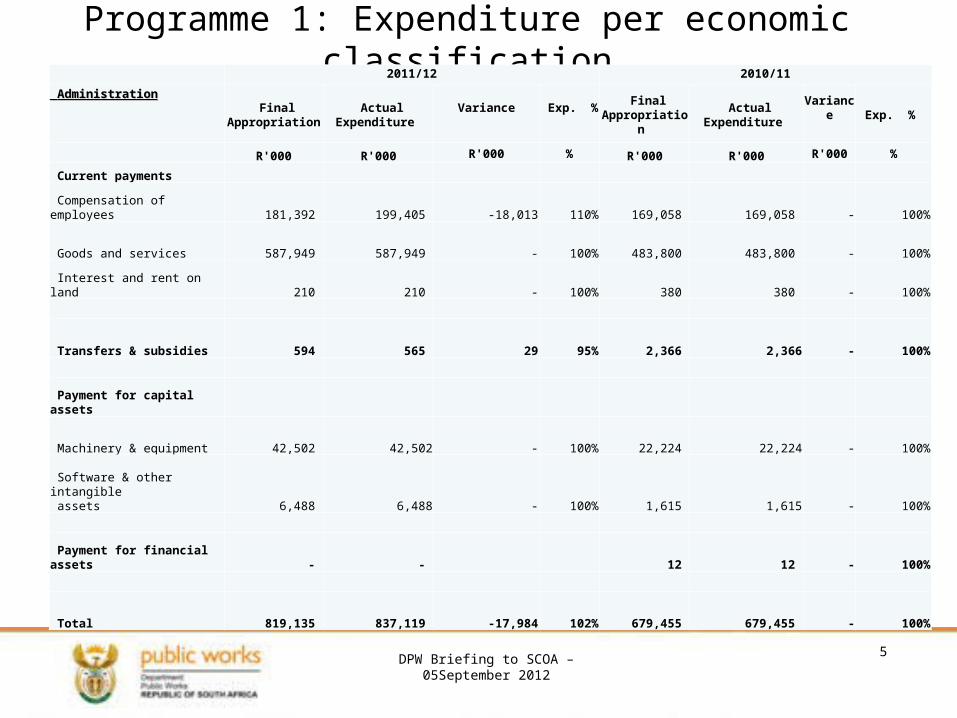
Programme 1: Expenditure per economic classification 2011/12 2010/11
AdministrationAdministration Final
Appropriation Actual
Expenditure Variance
Exp. % Final
Appropriation
ActualExpenditure
Variance Exp. %
R'000 R'000 R'000 % R'000 R'000 R'000 %
Current payments
Compensation of employees 181,392 199,405 -18,013 110% 169,058 169,058 - 100%
Goods and services 587,949 587,949 - 100% 483,800 483,800 - 100%
Interest and rent on land 210 210 - 100% 380 380 - 100%
Transfers & subsidies 594 565 29 95% 2,366 2,366 - 100%
Payment for capital assets
Machinery & equipment 42,502 42,502 - 100% 22,224 22,224 - 100%
Software & other intangible
assets 6,488 6,488 - 100% 1,615 1,615 - 100%
Payment for financial assets - - 12 12 - 100%
Total 819,135 837,119 -17,984 102%
679,455 679,455 - 100%
5DPW Briefing to SCOA –05September 2012
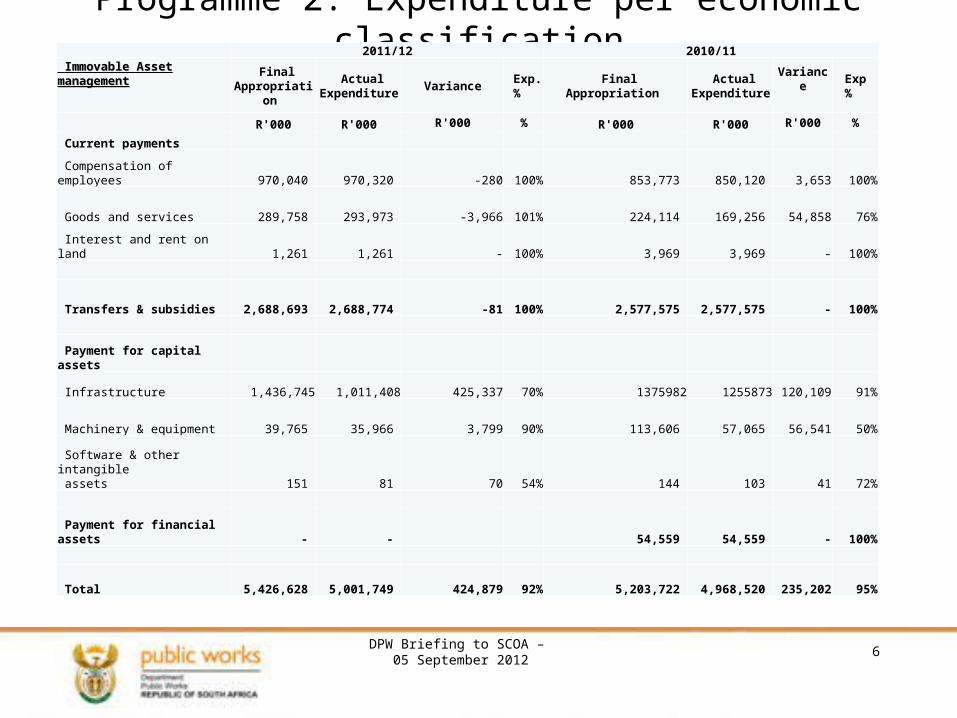
Programme 2: Expenditure per economic classification 2011/12 2010/11
Immovable Asset Immovable Asset managementmanagement
FinalAppropriati
on
ActualExpenditure
Variance Exp. %
FinalAppropriation
ActualExpenditure
Variance Exp %
R'000 R'000 R'000 % R'000 R'000 R'000 %
Current payments
Compensation of employees
970,040 970,320 -280 100% 853,773 850,120 3,653 100%
Goods and services
289,758 293,973 -3,966 101% 224,114 169,256 54,858 76%
Interest and rent on land
1,261 1,261 - 100% 3,969 3,969 - 100%
Transfers & subsidies
2,688,693
2,688,774 -81 100% 2,577,575
2,577,575 - 100%
Payment for capital assets
Infrastructure 1,436,745 1,011,408 425,337 70% 1375982 1255873 120,109 91%
Machinery & equipment
39,765 35,966 3,799 90% 113,606 57,065 56,541 50%
Software & other intangible
assets
151 81 70 54% 144 103 41 72%
Payment for financial assets
- - 54,559 54,559 - 100%
Total
5,426,628
5,001,749 424,879 92% 5,203,722
4,968,520 235,202 95%
6DPW Briefing to SCOA – 05 September 2012
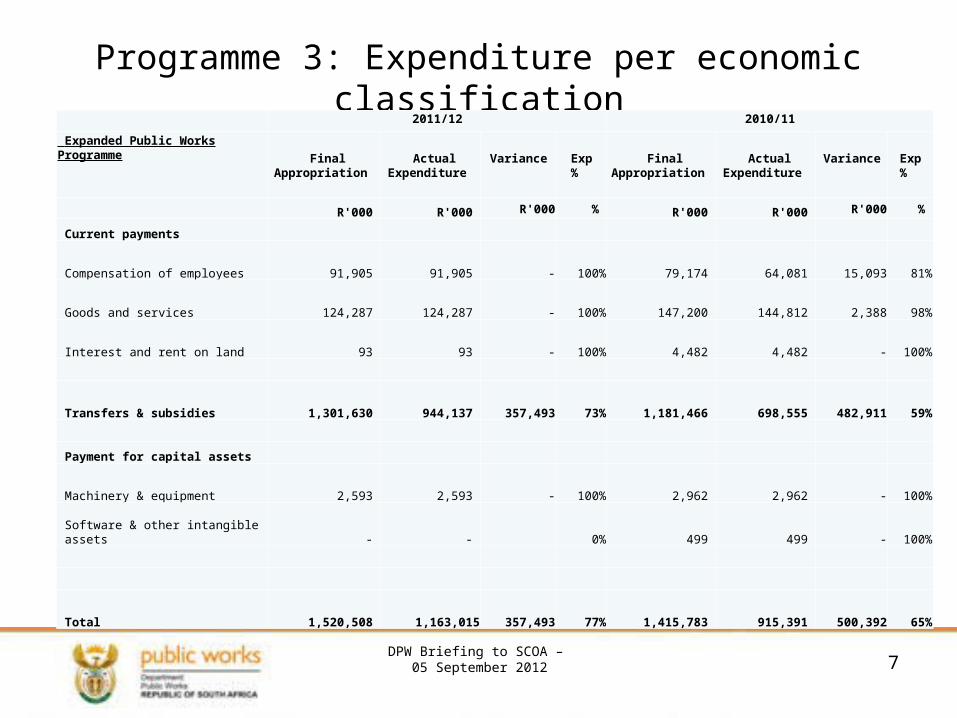
Programme 3: Expenditure per economic classification
2011/12 2010/11
Expanded Public Works Programme Final
Appropriation Actual
Expenditure Variance Exp
% Final
Appropriation Actual
Expenditure Variance Exp
%
R'000 R'000 R'000 % R'000 R'000 R'000 %
Current payments
Compensation of employees 91,905 91,905 - 100% 79,174 64,081 15,093 81%
Goods and services 124,287 124,287 - 100% 147,200 144,812 2,388 98%
Interest and rent on land 93 93 - 100% 4,482 4,482 - 100%
Transfers & subsidies 1,301,630 944,137 357,493 73% 1,181,466 698,555 482,911 59%
Payment for capital assets
Machinery & equipment 2,593 2,593 - 100% 2,962 2,962 - 100%
Software & other intangible assets - - 0% 499 499 - 100%
Total 1,520,508 1,163,015 357,493 77% 1,415,783 915,391 500,392 65%
7DPW Briefing to SCOA –
05 September 2012
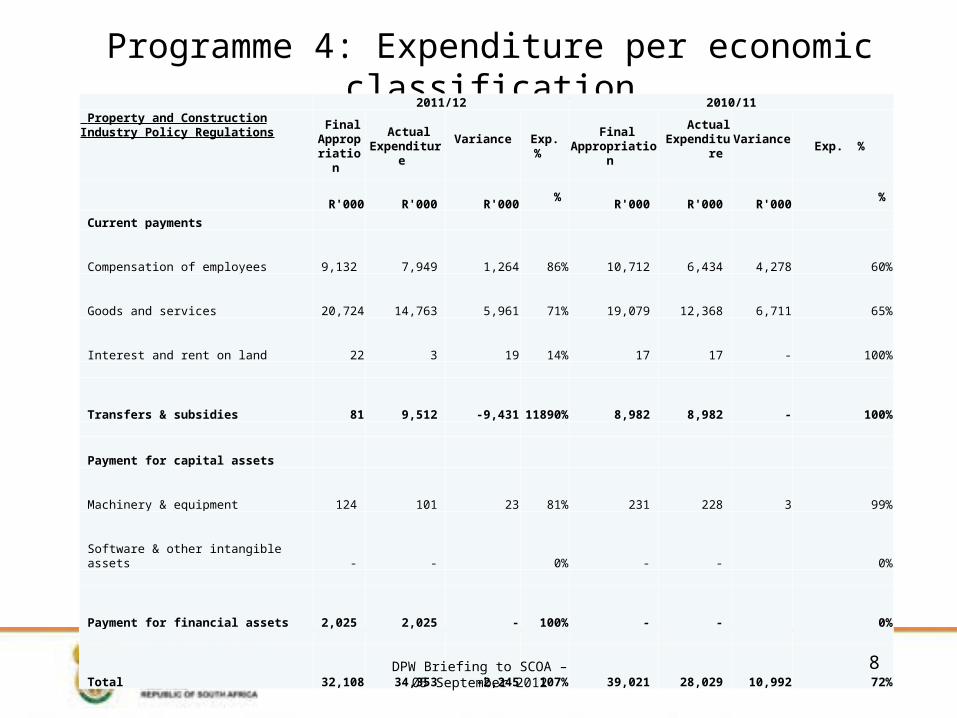
Programme 4: Expenditure per economic classification
2011/12 2010/11 Property and Construction Industry Policy Regulations Final
Appropriation
ActualExpenditur
e
Variance Exp. %
FinalAppropriatio
n
ActualExpenditu
re
Variance Exp. %
R'000 R'000 R'000
% R'000 R'000 R'000
%
Current payments
Compensation of employees
9,132 7,949 1,264 86% 10,712 6,434 4,278 60%
Goods and services
20,724 14,763 5,961 71% 19,079
12,368 6,711 65%
Interest and rent on land
22 3 19 14% 17
17 - 100%
Transfers & subsidies
81
9,512 -9,43111890
% 8,982
8,982 - 100%
Payment for capital assets
Machinery & equipment
124 101 23 81% 231
228 3 99%
Software & other intangible assets
- - 0% - - 0%
Payment for financial assets 2,025
2,025 - 100%
-
- 0%
Total
32,108
34,353 -2,245 107%
39,021
28,029 10,992 72%
8DPW Briefing to SCOA –05 September 2012
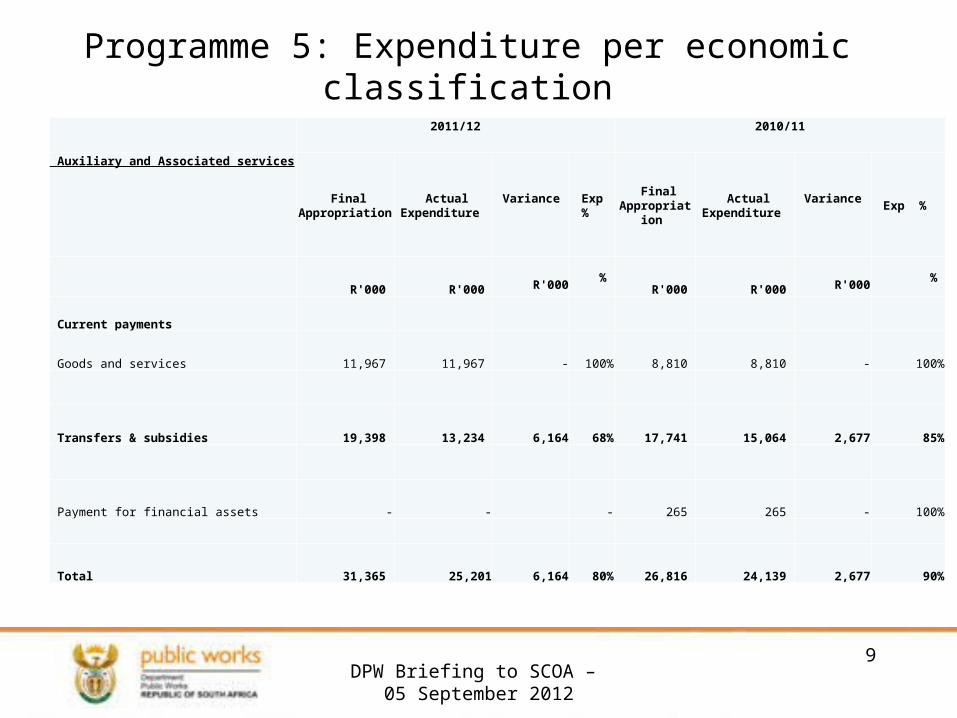
Programme 5: Expenditure per economic classification
2011/12 2010/11
Auxiliary and Associated services
FinalAppropriation
ActualExpenditure
Variance Exp %
FinalAppropriati
on
ActualExpenditure
Variance Exp %
R'000 R'000 R'000 %
R'000 R'000 R'000 %
Current payments
Goods and services 11,967 11,967 - 100%
8,810 8,810 - 100%
Transfers & subsidies 19,398 13,234 6,164 68%
17,741 15,064 2,677 85%
Payment for financial assets - - -
265 265 - 100%
Total 31,365 25,201 6,164 80%
26,816 24,139 2,677 90%
9DPW Briefing to SCOA –
05 September 2012
10
Notes to expenditure - 2011/12
Compensation of employees•Expenditure for the year ended March 2012 is R1.270 billion and expenditure is equivalent to 101% of the total allocation of R1.253 billion.•Overspending on compensation of employees is R17 million and overspending is on both Programme 1 and 2. •Overspending in Programme 1 has been disclosed as unauthorised expenditure in the annual report and unauthorised expenditure has been reported to both National Treasury and Office of the Auditor General.
DPW Briefing to SCOA – 05 Septemeber2012
11
Notes to expenditure - 2011/12
Goods and services•Goods and services for the financial year ended March 2012 is R1.035 billion and expenditure is equivalent to 100% of the total allocation of R1.033 billion.•Programme two is overspending on goods and services and overspending relates to energy efficiency project.•Overspending of goods and services is due to advance payment for payment made to Independent Development Trust (IDT) during 2010/11 financial year with the roll over not being approved by National Treasury.•With the project continuing during 2011/12 financial year expenditure incurred was included with no allocation and therefore leading to overspending.
DPW Briefing to SCOA – 05 September 2012
12
Notes to expenditure - 2011/12
Transfers and subsidies•Expenditure on transfers and subsidies for the financial year ended March 2012 is R3.656 billion and expenditure is equivalent to 91% of the total allocation of R4.010 billion.•Under spending on transfers and subsidies relates conditional grant allocation to provinces and municipalities for EPWP infrastructure. •Programme 4 is over spending on transfers and subsidies and expenditure relate to payment made to Agrement South Africa.
DPW Briefing to SCOA – 05 September 2012
13
Notes to expenditure - 2011/12
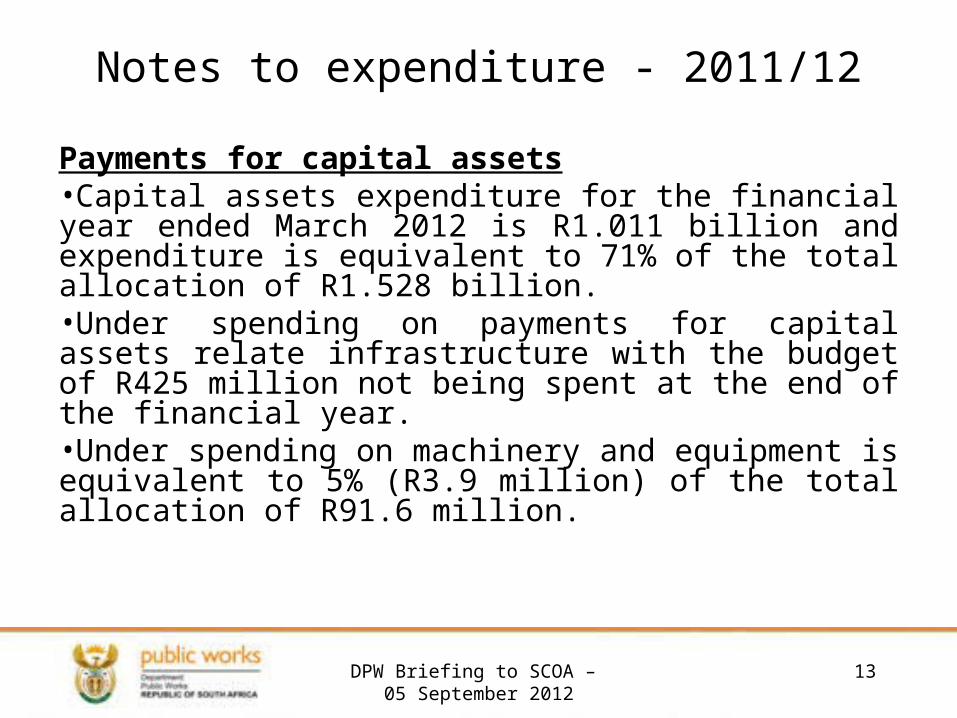
Payments for capital assets•Capital assets expenditure for the financial year ended March 2012 is R1.011 billion and expenditure is equivalent to 71% of the total allocation of R1.528 billion.•Under spending on payments for capital assets relate infrastructure with the budget of R425 million not being spent at the end of the financial year. •Under spending on machinery and equipment is equivalent to 5% (R3.9 million) of the total allocation of R91.6 million.
DPW Briefing to SCOA – 05 September 2012
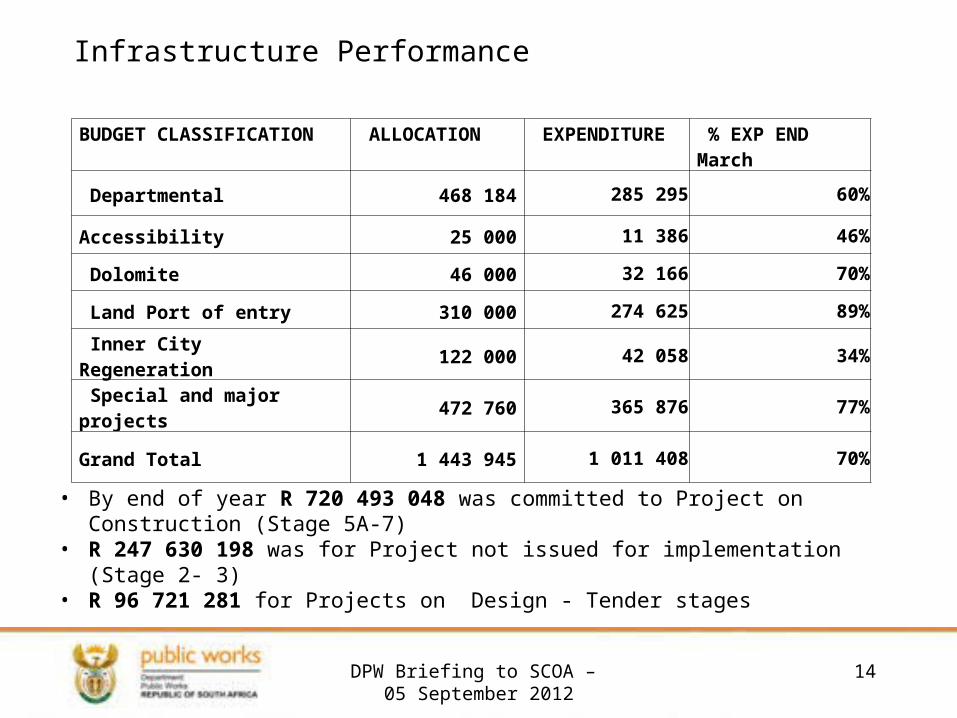
BUDGET CLASSIFICATION
ALLOCATION EXPENDITURE
% EXP END March
Departmental 468 184 285 295 60%
Accessibility 25 000 11 386 46%
Dolomite 46 000 32 166 70%
Land Port of entry 310 000 274 625 89%
Inner City Regeneration 122 000 42 058 34%
Special and major projects
472 760 365 876 77%
Grand Total 1 443 945 1 011 408 70%
14
Infrastructure Performance
• By end of year R 720 493 048 was committed to Project on Construction (Stage 5A-7)
• R 247 630 198 was for Project not issued for implementation (Stage 2- 3)• R 96 721 281 for Projects on Design - Tender stages
DPW Briefing to SCOA – 05 September 2012
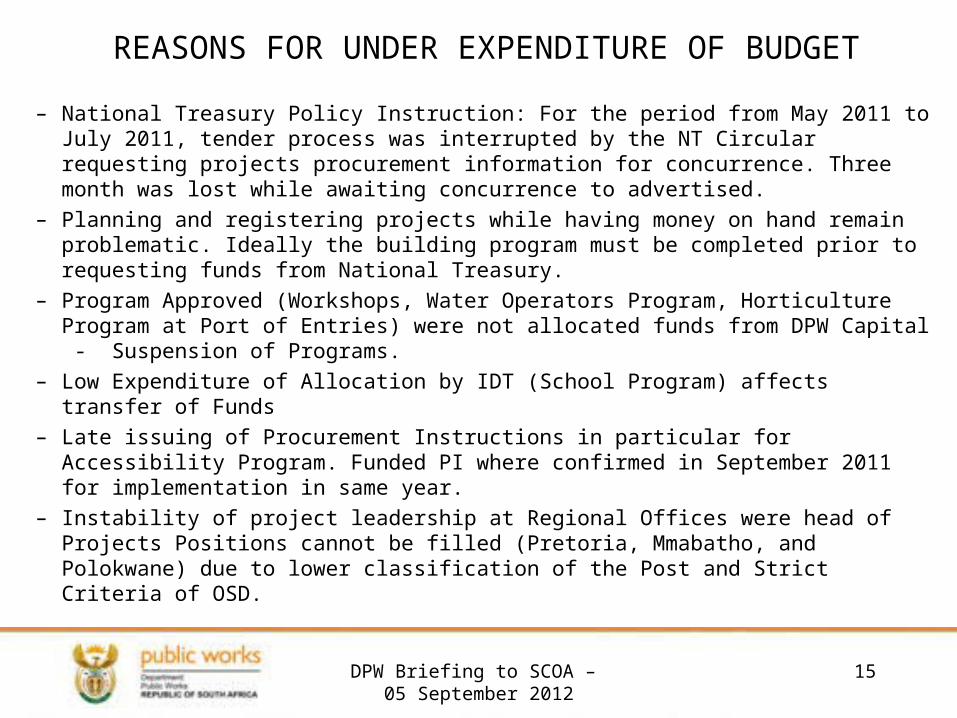
REASONS FOR UNDER EXPENDITURE OF BUDGET
– National Treasury Policy Instruction: For the period from May 2011 to July 2011, tender process was interrupted by the NT Circular requesting projects procurement information for concurrence. Three month was lost while awaiting concurrence to advertised.
– Planning and registering projects while having money on hand remain problematic. Ideally the building program must be completed prior to requesting funds from National Treasury.
– Program Approved (Workshops, Water Operators Program, Horticulture Program at Port of Entries) were not allocated funds from DPW Capital - Suspension of Programs.
– Low Expenditure of Allocation by IDT (School Program) affects transfer of Funds
– Late issuing of Procurement Instructions in particular for Accessibility Program. Funded PI where confirmed in September 2011 for implementation in same year.
– Instability of project leadership at Regional Offices were head of Projects Positions cannot be filled (Pretoria, Mmabatho, and Polokwane) due to lower classification of the Post and Strict Criteria of OSD.
15DPW Briefing to SCOA – 05 September 2012
16
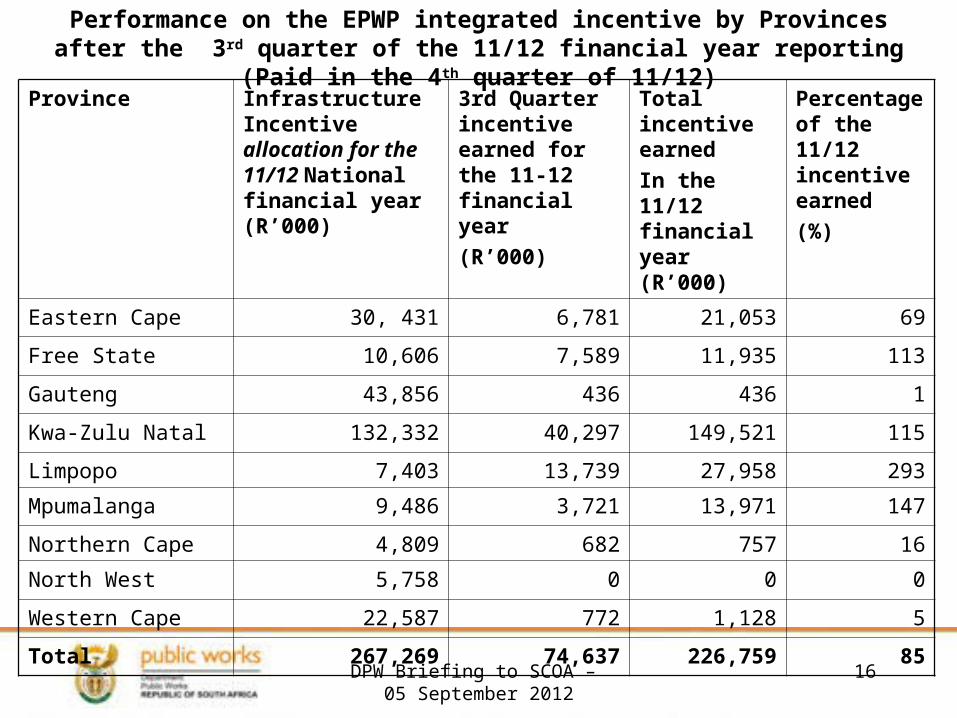
Performance on the EPWP integrated incentive by Provinces after the 3rd quarter of the 11/12 financial year reporting (Paid in the 4th quarter of 11/12)
Province Infrastructure Incentive allocation for the 11/12 National financial year (R’000)
3rd Quarter incentive earned for the 11-12 financial year
(R’000)
Total incentive earned
In the 11/12 financial year (R’000)
Percentage of the 11/12 incentive earned
(%)
Eastern Cape 30, 431 6,781 21,053 69
Free State 10,606 7,589 11,935 113
Gauteng 43,856 436 436 1
Kwa-Zulu Natal 132,332 40,297 149,521 115
Limpopo 7,403 13,739 27,958 293
Mpumalanga 9,486 3,721 13,971 147
Northern Cape 4,809 682 757 16
North West 5,758 0 0 0
Western Cape 22,587 772 1,128 5
Total 267,269 74,637 226,759 85
DPW Briefing to SCOA – 05 September 2012
17
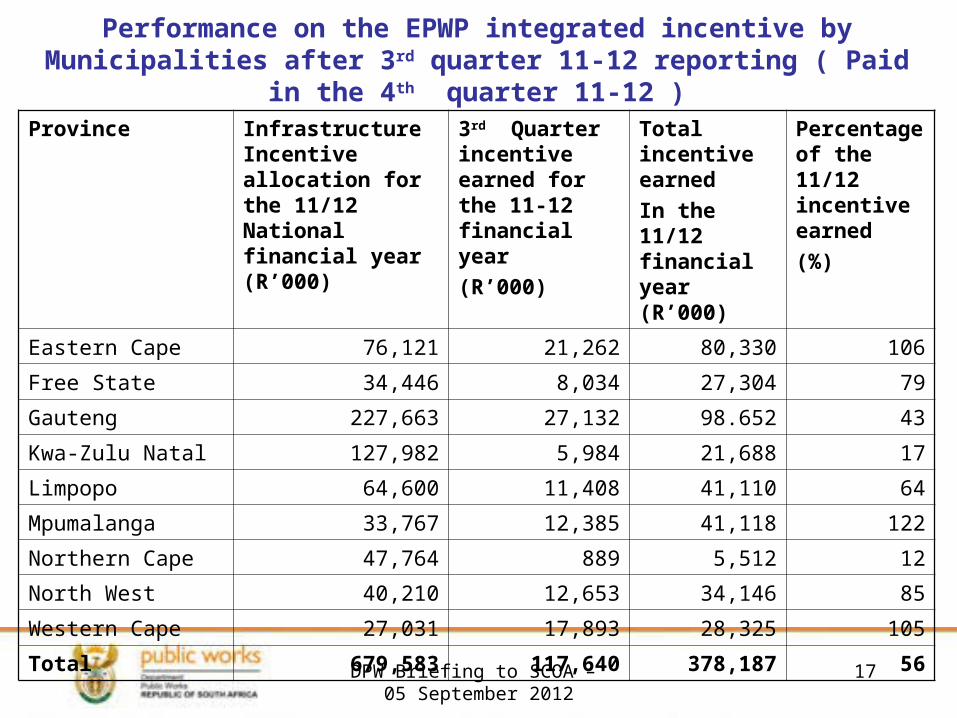
Performance on the EPWP integrated incentive by Municipalities after 3rd quarter 11-12 reporting ( Paid in the 4th quarter 11-12 )
Province Infrastructure Incentive allocation for the 11/12 National financial year (R’000)
3rd Quarter incentive earned for the 11-12 financial year(R’000)
Total incentive earnedIn the 11/12 financial year (R’000)
Percentage of the 11/12 incentive earned(%)
Eastern Cape 76,121 21,262 80,330 106
Free State 34,446 8,034 27,304 79
Gauteng 227,663 27,132 98.652 43
Kwa-Zulu Natal 127,982 5,984 21,688 17
Limpopo 64,600 11,408 41,110 64
Mpumalanga 33,767 12,385 41,118 122
Northern Cape 47,764 889 5,512 12
North West 40,210 12,653 34,146 85
Western Cape 27,031 17,893 28,325 105
Total 679,583 117,640 378,187 56DPW Briefing to SCOA – 05 September 2012
18
Causes of low Incentive draw-down
• Poor or under reporting on EPWP work opportunities created on projects. The amount of incentive paid to Public bodies is dependent on reporting by Public bodies.
• Low Labour-intensity of projects being implemented by Public bodies.
• Poor technical capacity at Public bodies to design and implement projects labour-intensively.
DPW Briefing to SCOA – 05 September 2012
19
Measures taken to improve performance • EPWP unit officials and Data Capturers are helping Public bodies collect EPWP
information for reporting.
• Municipal Officials are being trained in Labour-intensive methods of construction. Over 1,000 officials had been trained in this regard in the 11/12 financial year.
• Public body officials are being trained on reporting, so that they have improved capacity to report.
• EPWP incentive grant has been revised from a schedule 8 grant to a schedule 5 and 6 grant for Provincial Departments and Municipalities respectively. 40% of the incentive is being upfront to Public bodies. It enables better planning by Public bodies.
DPW Briefing to SCOA – 05 September 2012
20
Thank you
DPW Briefing to SCOA – 05 September 2012


![[Type the - SAASTA science olympiad... · [Type the document subtitle] Lindie Brazer [Pick the date] ... The inherited traits of an organism are controlled by… A RNA molecules B](https://img.pdfslide.us/doc/110x75/5ac23c427f8b9a5a4e8e0c3f/type-the-science-olympiadtype-the-document-subtitle-lindie-brazer-pick.jpg)