Embed Size (px)
Citation preview
WP2 – LAB-SCALE: INFLUENCE OF
POLLUTANTS ON SOFC ANODES, FUEL
PROCESSING REACTIONS, AND GAS
CLEANING
D2.4 EFFECT OF POLLUTANTS ON
SHORT STACKS. SCIENTIFIC ADVANCES
IN POISONING MECHANISMS
SOFCOM – M24
Politecnico di Torino
1
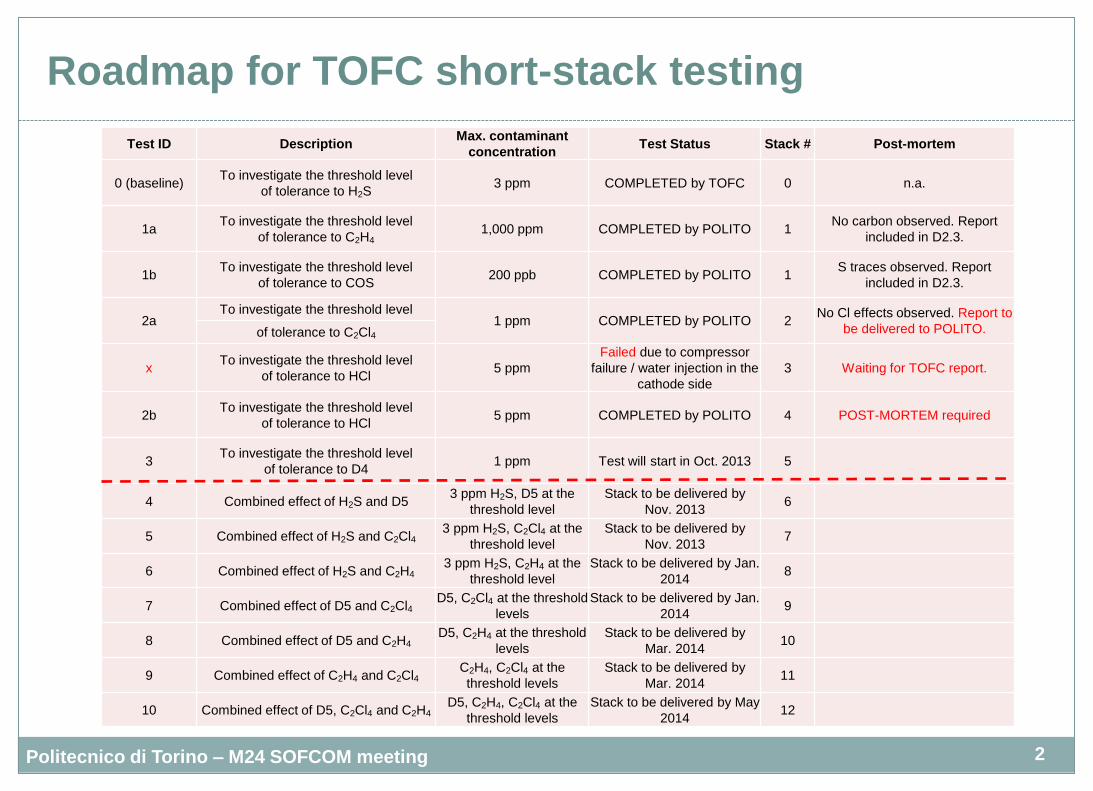
Roadmap for TOFC short-stack testing
2 Politecnico di Torino – M24 SOFCOM meeting
Test ID Description Max. contaminant
concentration Test Status Stack # Post-mortem
0 (baseline) To investigate the threshold level
of tolerance to H2S 3 ppm COMPLETED by TOFC 0 n.a.
1a To investigate the threshold level
of tolerance to C2H4 1,000 ppm COMPLETED by POLITO 1
No carbon observed. Report
included in D2.3.
1b To investigate the threshold level
of tolerance to COS 200 ppb COMPLETED by POLITO 1
S traces observed. Report
included in D2.3.
2a To investigate the threshold level
1 ppm COMPLETED by POLITO 2 No Cl effects observed. Report to
be delivered to POLITO. of tolerance to C2Cl4
x To investigate the threshold level
of tolerance to HCl 5 ppm
Failed due to compressor
failure / water injection in the
cathode side
3 Waiting for TOFC report.
2b To investigate the threshold level
of tolerance to HCl 5 ppm COMPLETED by POLITO 4 POST-MORTEM required
3 To investigate the threshold level
of tolerance to D4 1 ppm Test will start in Oct. 2013 5
4 Combined effect of H2S and D5 3 ppm H2S, D5 at the
threshold level
Stack to be delivered by
Nov. 2013 6
5 Combined effect of H2S and C2Cl4 3 ppm H2S, C2Cl4 at the
threshold level
Stack to be delivered by
Nov. 2013 7
6 Combined effect of H2S and C2H4 3 ppm H2S, C2H4 at the
threshold level
Stack to be delivered by Jan.
2014 8
7 Combined effect of D5 and C2Cl4 D5, C2Cl4 at the threshold
levels
Stack to be delivered by Jan.
2014 9
8 Combined effect of D5 and C2H4 D5, C2H4 at the threshold
levels
Stack to be delivered by
Mar. 2014 10
9 Combined effect of C2H4 and C2Cl4 C2H4, C2Cl4 at the
threshold levels
Stack to be delivered by
Mar. 2014 11
10 Combined effect of D5, C2Cl4 and C2H4 D5, C2H4, C2Cl4 at the
threshold levels
Stack to be delivered by May
2014 12
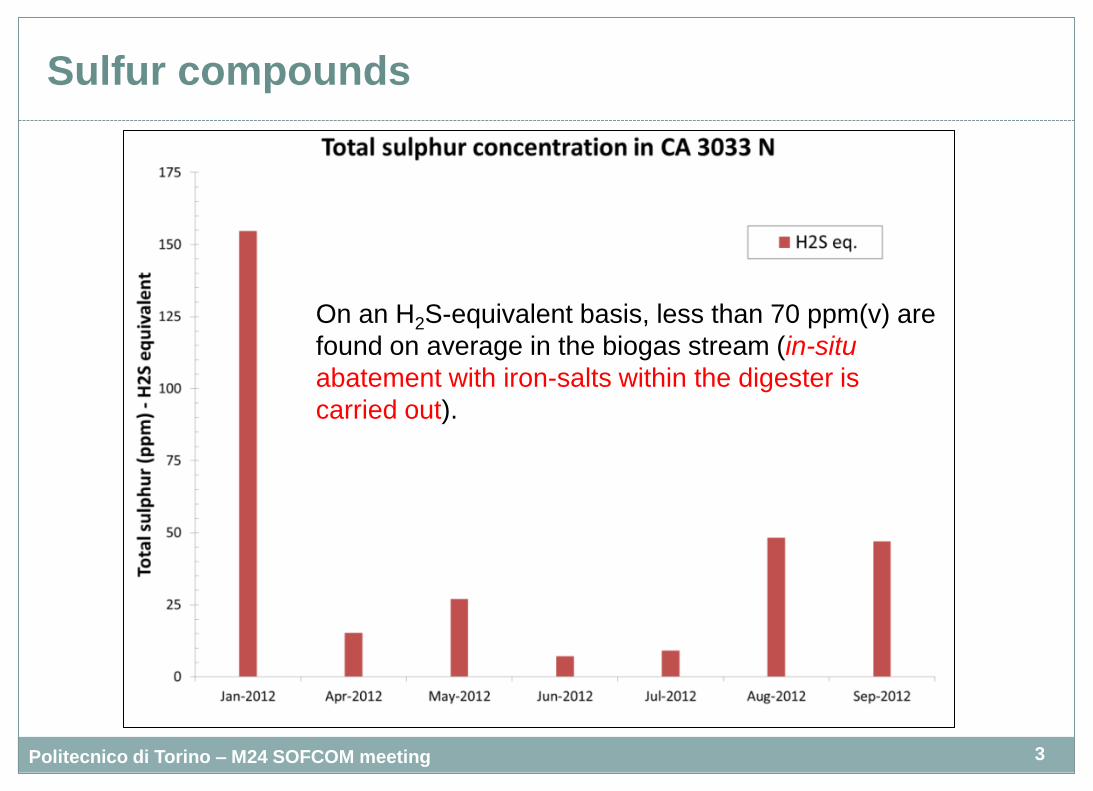
Sulfur compounds
3 Politecnico di Torino – M24 SOFCOM meeting
On an H2S-equivalent basis, less than 70 ppm(v) are
found on average in the biogas stream (in-situ
abatement with iron-salts within the digester is
carried out).
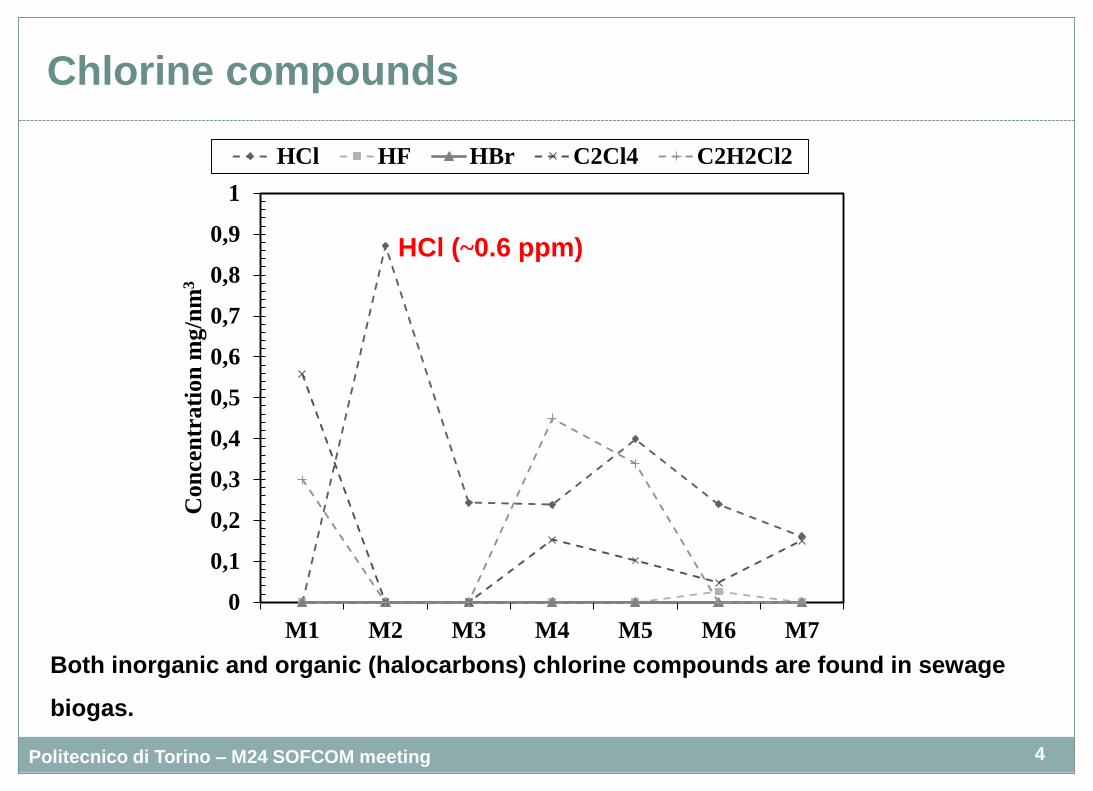
Chlorine compounds
4 Politecnico di Torino – M24 SOFCOM meeting
Both inorganic and organic (halocarbons) chlorine compounds are found in sewage
biogas.
0
0,1
0,2
0,3
0,4
0,5
0,6
0,7
0,8
0,9
1
M1 M2 M3 M4 M5 M6 M7
Con
cen
trati
on
mg/n
m3
HCl HF HBr C2Cl4 C2H2Cl2
HCl (~0.6 ppm)
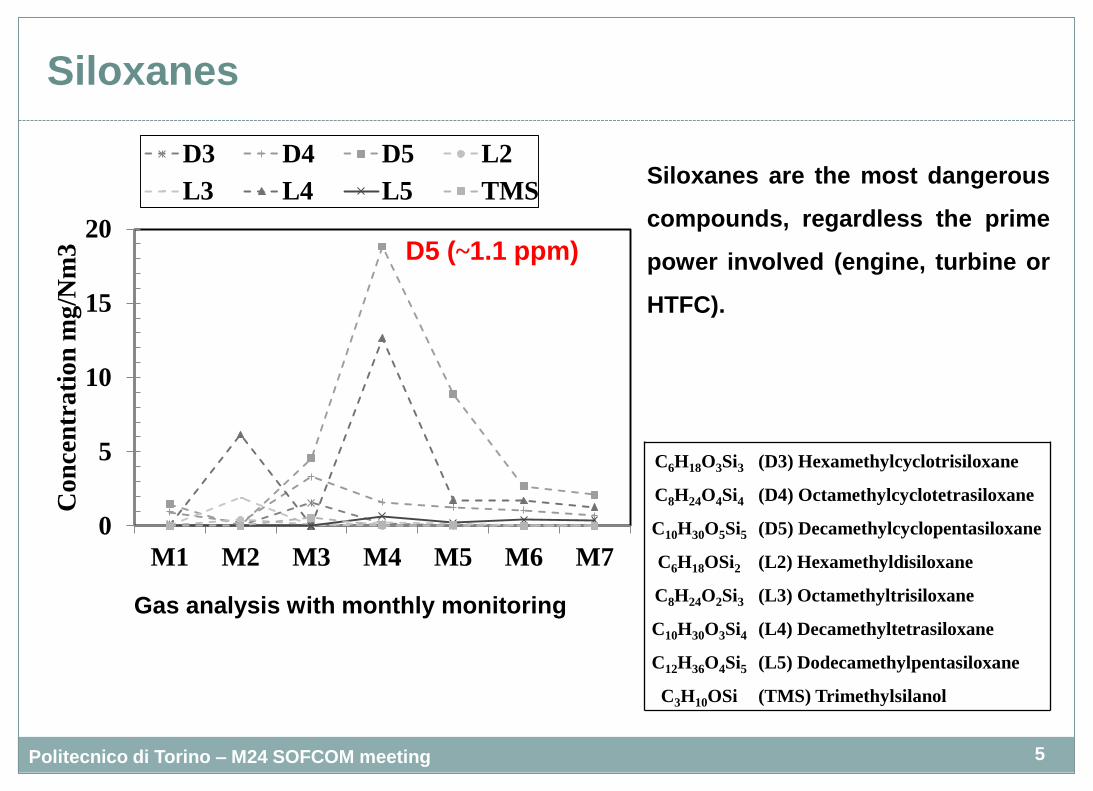
Siloxanes
5 Politecnico di Torino – M24 SOFCOM meeting
0
5
10
15
20
M1 M2 M3 M4 M5 M6 M7
Co
nce
ntr
ati
on
mg/N
m3
D3 D4 D5 L2
L3 L4 L5 TMSSiloxanes are the most dangerous
compounds, regardless the prime
power involved (engine, turbine or
HTFC).
C6H18O3Si3 (D3) Hexamethylcyclotrisiloxane
C8H24O4Si4 (D4) Octamethylcyclotetrasiloxane
C10H30O5Si5 (D5) Decamethylcyclopentasiloxane
C6H18OSi2 (L2) Hexamethyldisiloxane
C8H24O2Si3 (L3) Octamethyltrisiloxane
C10H30O3Si4 (L4) Decamethyltetrasiloxane
C12H36O4Si5 (L5) Dodecamethylpentasiloxane
C3H10OSi (TMS) Trimethylsilanol
Gas analysis with monthly monitoring
D5 (~1.1 ppm)
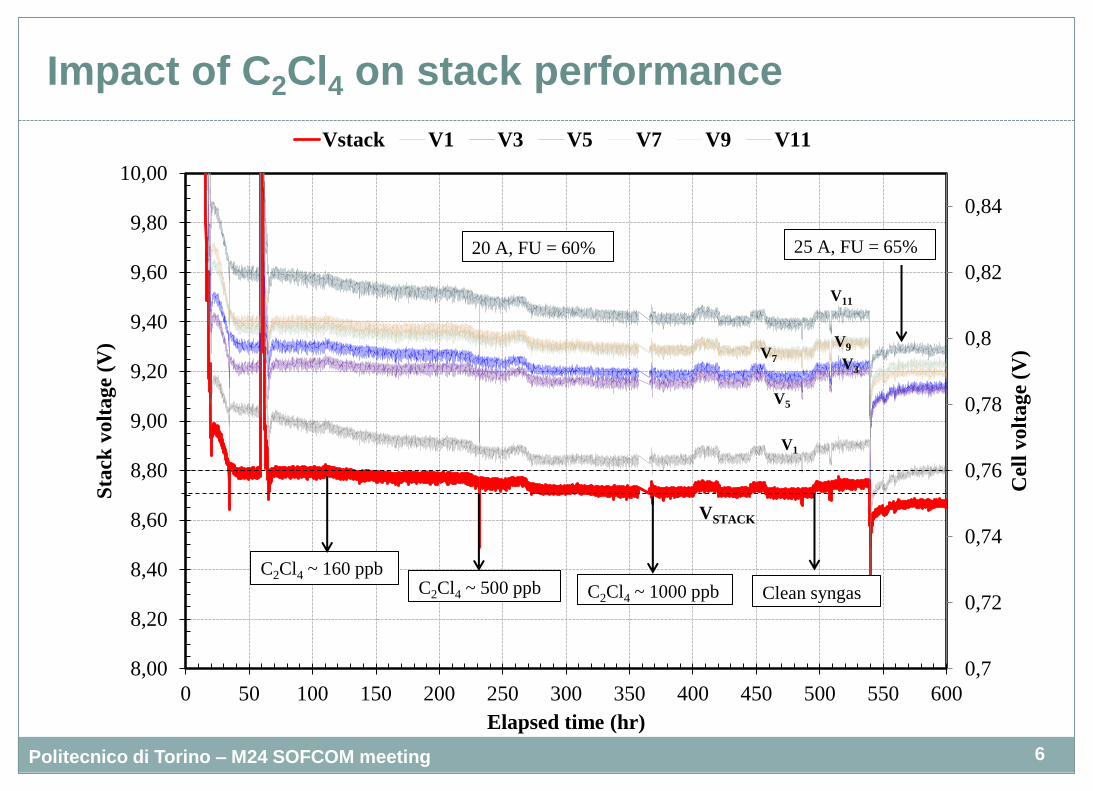
Impact of C2Cl4 on stack performance
6 Politecnico di Torino – M24 SOFCOM meeting
0,7
0,72
0,74
0,76
0,78
0,8
0,82
0,84
8,00
8,20
8,40
8,60
8,80
9,00
9,20
9,40
9,60
9,80
10,00
0 50 100 150 200 250 300 350 400 450 500 550 600
Cel
l v
olt
ag
e (V
)
Sta
ck v
olt
ag
e (V
)
Elapsed time (hr)
Vstack V1 V3 V5 V7 V9 V11
C2Cl4 ~ 160 ppb
V1
V3
V5
V7
V9
V11
VSTACK
C2Cl4 ~ 500 ppb C2Cl4 ~ 1000 ppb Clean syngas
25 A, FU = 65% 20 A, FU = 60%
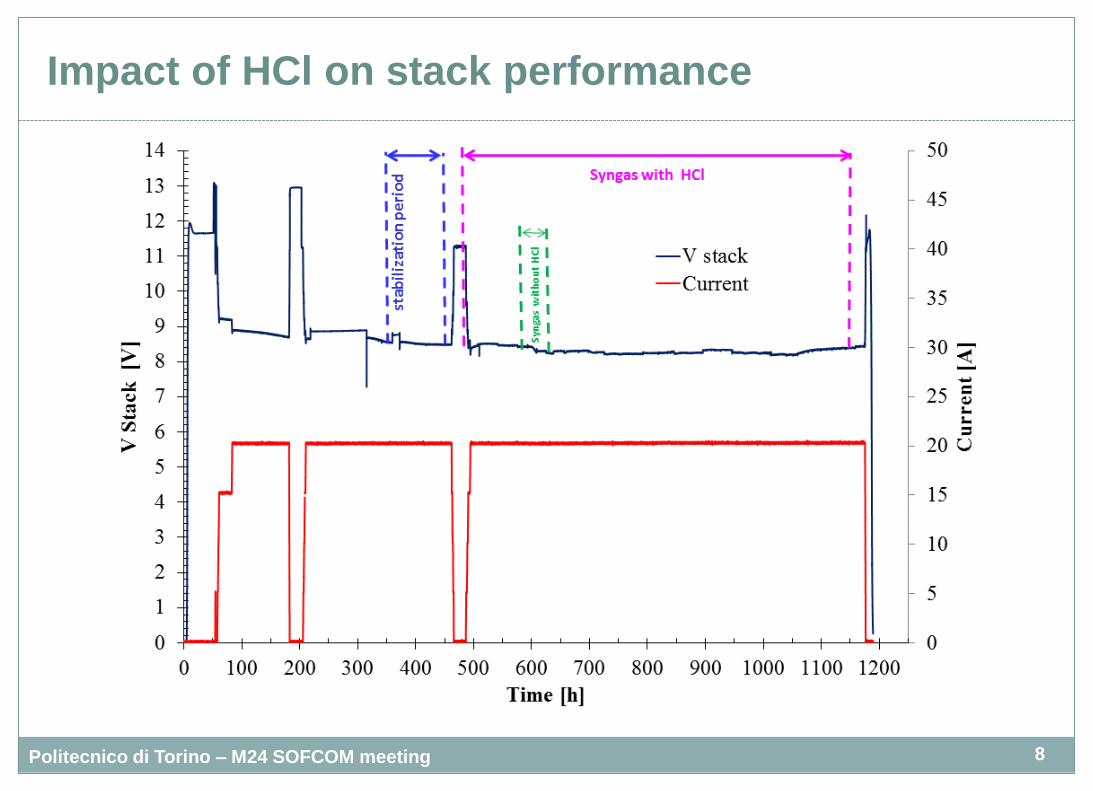
Impact of HCl on stack performance
8 Politecnico di Torino – M24 SOFCOM meeting
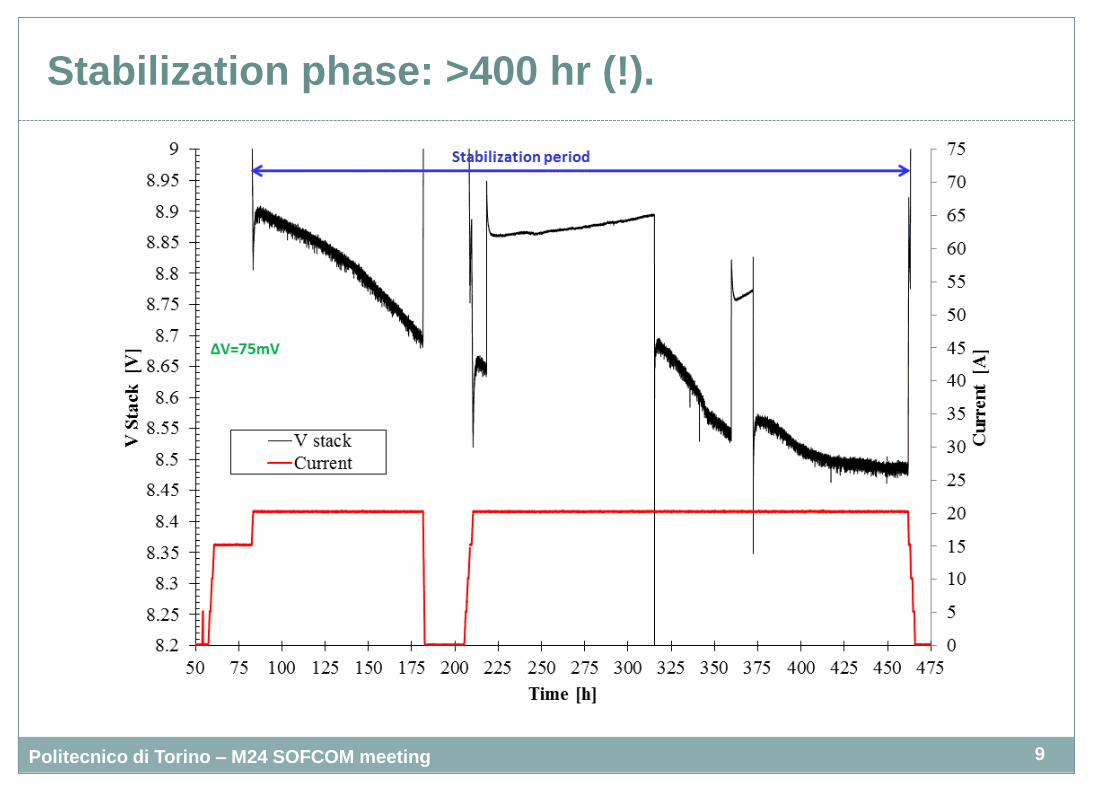
Stabilization phase: >400 hr (!).
9 Politecnico di Torino – M24 SOFCOM meeting
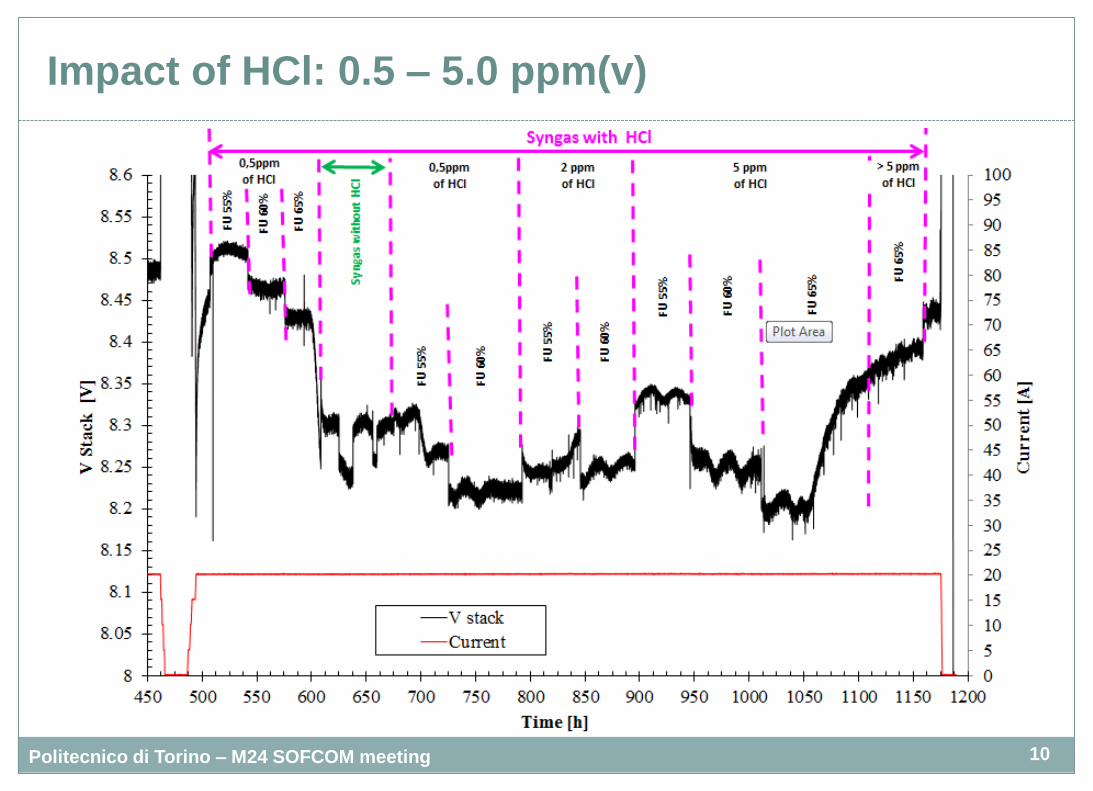
Impact of HCl: 0.5 – 5.0 ppm(v)
10 Politecnico di Torino – M24 SOFCOM meeting
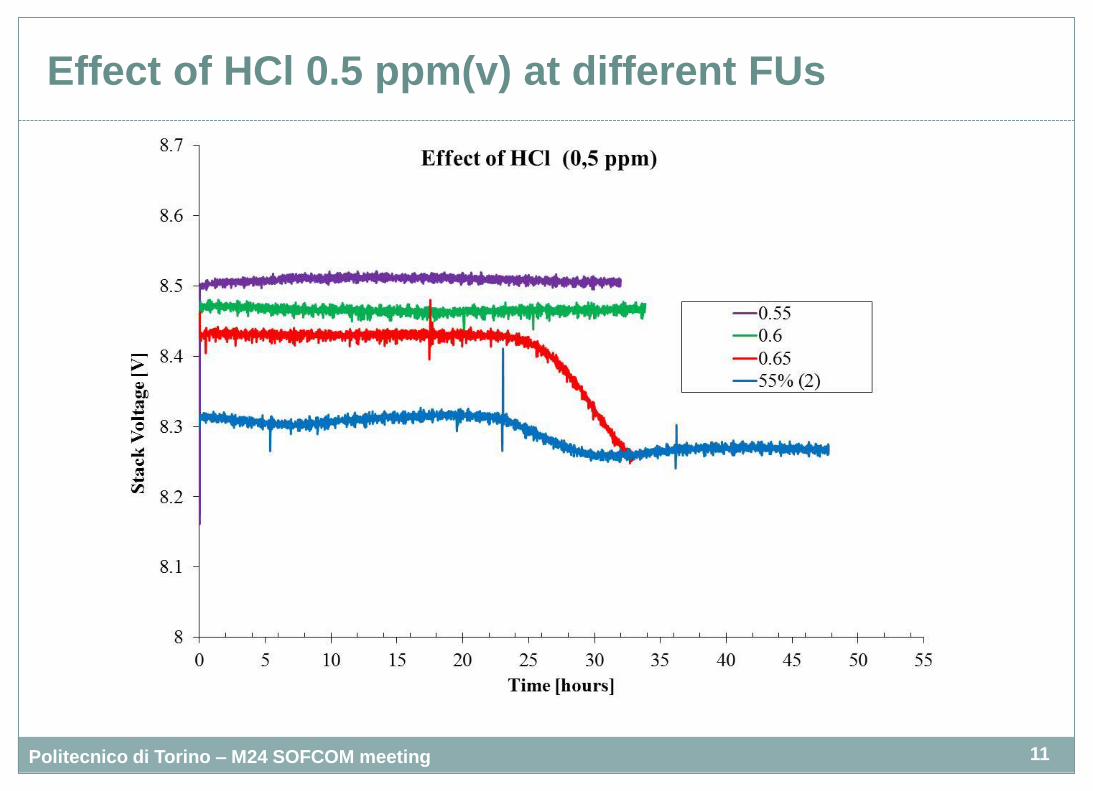
Effect of HCl 0.5 ppm(v) at different FUs
11 Politecnico di Torino – M24 SOFCOM meeting
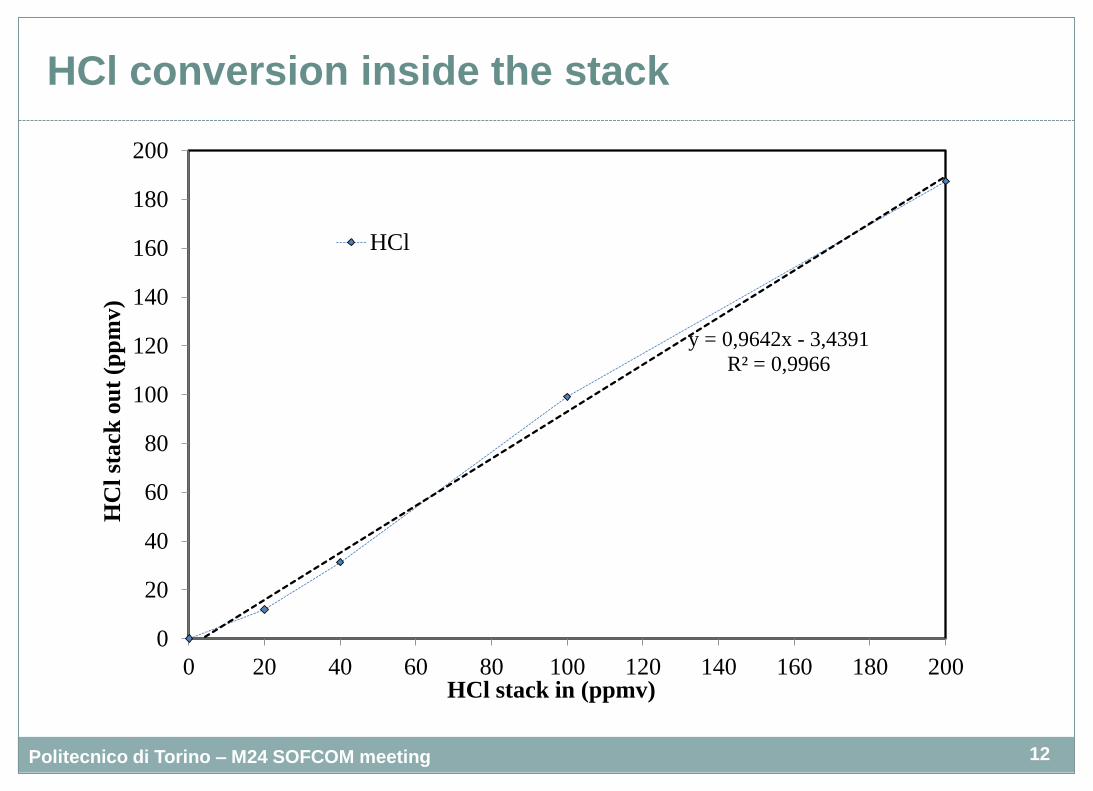
HCl conversion inside the stack
12 Politecnico di Torino – M24 SOFCOM meeting
y = 0,9642x - 3,4391
R² = 0,9966
0
20
40
60
80
100
120
140
160
180
200
0 20 40 60 80 100 120 140 160 180 200
HC
l st
ack
ou
t (p
pm
v)
HCl stack in (ppmv)
HCl
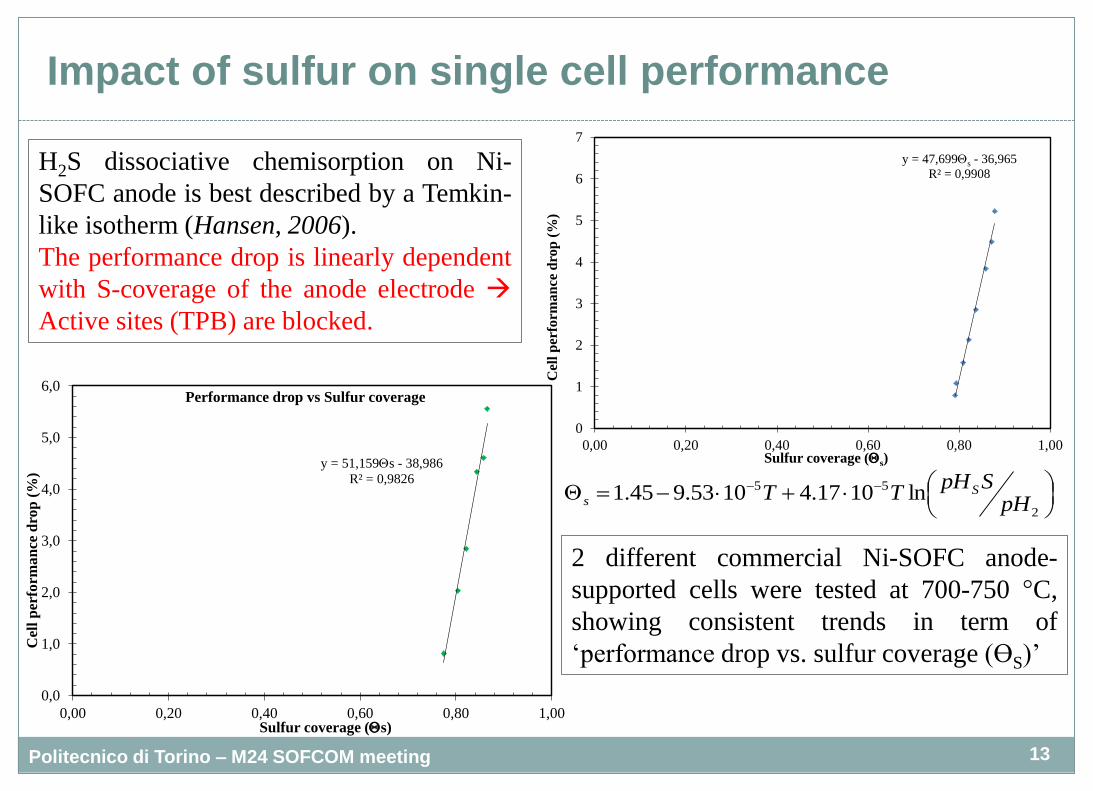
Impact of sulfur on single cell performance
13 Politecnico di Torino – M24 SOFCOM meeting
y = 47,699Qs - 36,965
R² = 0,9908
0
1
2
3
4
5
6
7
0,00 0,20 0,40 0,60 0,80 1,00
Cel
l p
erfo
rma
nce
dro
p (
%)
Sulfur coverage (Qs)
Q
2
55 ln1017.41053.945.1pH
SpHTT S
s
y = 51,159Qs - 38,986
R² = 0,9826
0,0
1,0
2,0
3,0
4,0
5,0
6,0
0,00 0,20 0,40 0,60 0,80 1,00
Cel
l p
erfo
rma
nce
dro
p (
%)
Sulfur coverage (Qs)
Performance drop vs Sulfur coverage
2 different commercial Ni-SOFC anode-
supported cells were tested at 700-750 °C,
showing consistent trends in term of
‘performance drop vs. sulfur coverage (ƟS)’
H2S dissociative chemisorption on Ni-
SOFC anode is best described by a Temkin-
like isotherm (Hansen, 2006).
The performance drop is linearly dependent
with S-coverage of the anode electrode
Active sites (TPB) are blocked.
14 Politecnico di Torino – M24 SOFCOM meeting
715
720
725
730
735
740
745
750
755
760
0 50 100 150 200 250 300
Cel
l V
olt
age
(mV
)
Elapsed time (h)
H2S
0,84ppmv
H2S
0ppmv
H2S
0ppmvH2S
0ppmvH2S
0ppmv H2S
0ppmv H2S
0ppmv H2S
0ppmv
H2S
0ppmv
H2S
0,89ppmvH2S
1,29ppmv
H2S
1,69ppmv H2S
2,44ppmv
H2S
4,04ppmv
H2S
5,44ppmvH2S
6,40ppmv
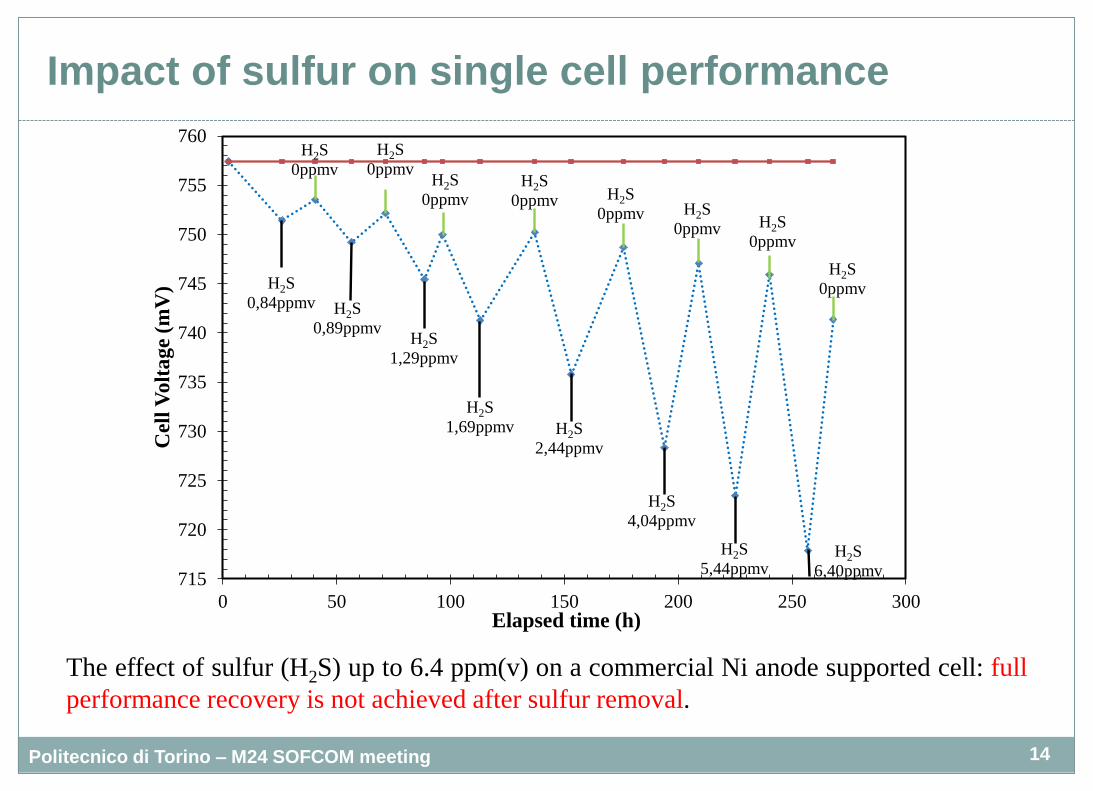
The effect of sulfur (H2S) up to 6.4 ppm(v) on a commercial Ni anode supported cell: full
performance recovery is not achieved after sulfur removal.
Impact of sulfur on single cell performance
15 Politecnico di Torino – M24 SOFCOM meeting
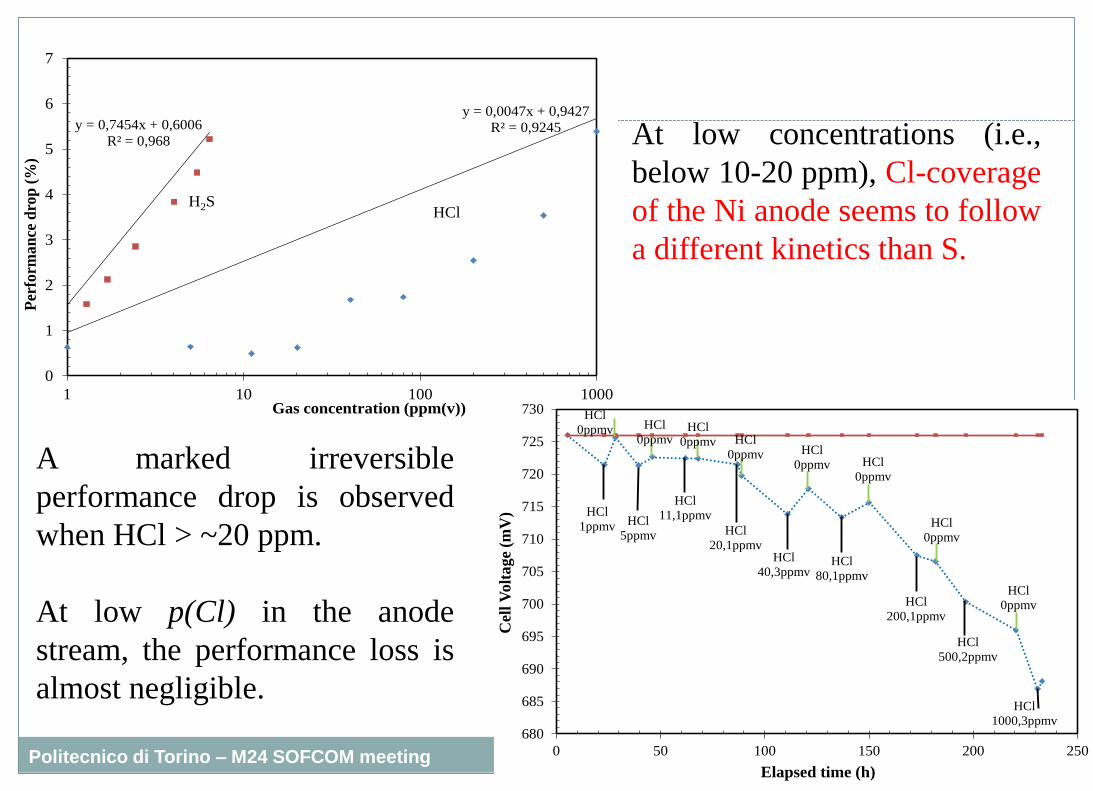
y = 0,0047x + 0,9427
R² = 0,9245y = 0,7454x + 0,6006
R² = 0,968
0
1
2
3
4
5
6
7
1 10 100 1000
Per
form
an
ce d
rop
(%
)
Gas concentration (ppm(v))
H2SHCl
15
At low concentrations (i.e.,
below 10-20 ppm), Cl-coverage
of the Ni anode seems to follow
a different kinetics than S.
A marked irreversible
performance drop is observed
when HCl > ~20 ppm.
At low p(Cl) in the anode
stream, the performance loss is
almost negligible.
680
685
690
695
700
705
710
715
720
725
730
0 50 100 150 200 250
Cel
l V
olt
ag
e (m
V)
Elapsed time (h)
HCl
1ppmv HCl
5ppmv
HCl
11,1ppmv
HCl
20,1ppmvHCl
40,3ppmvHCl
80,1ppmv
HCl
200,1ppmv
HCl
500,2ppmv
HCl
1000,3ppmv
HCl
0ppmvHCl
0ppmv HCl
0ppmv HCl
0ppmv
HCl
0ppmv
HCl
0ppmv
HCl
0ppmvHCl
0ppmv
Impact of D4 (siloxane) on single cell performance
16 Politecnico di Torino – M24 SOFCOM meeting
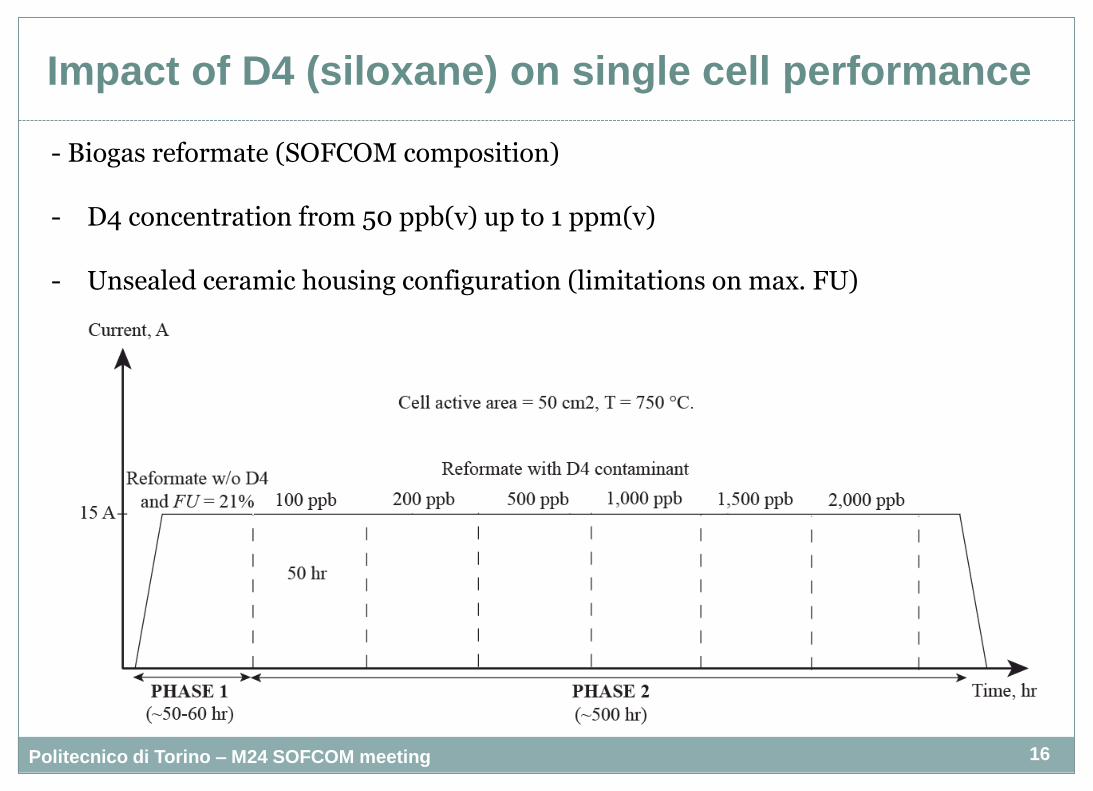
- Biogas reformate (SOFCOM composition) - D4 concentration from 50 ppb(v) up to 1 ppm(v)
- Unsealed ceramic housing configuration (limitations on max. FU)
Impact of D4 (siloxane) on single cell performance
17 Politecnico di Torino – M24 SOFCOM meeting
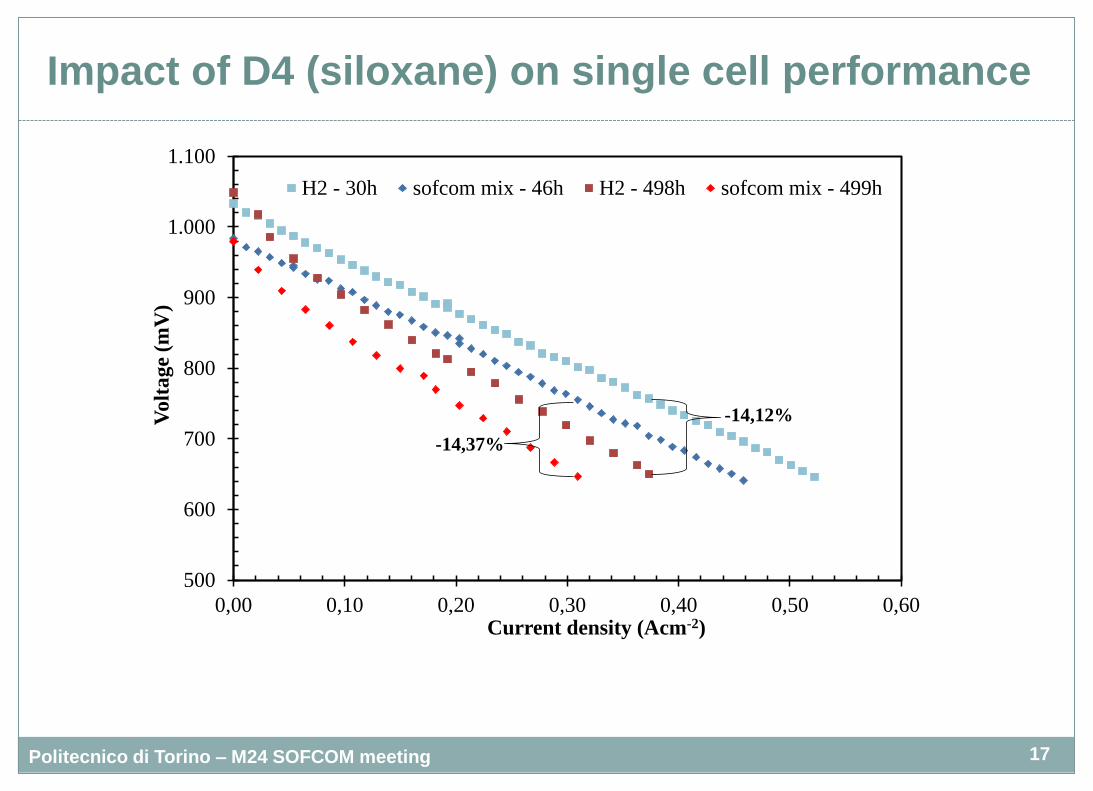
500
600
700
800
900
1.000
1.100
0,00 0,10 0,20 0,30 0,40 0,50 0,60
Volt
age
(mV
)
Current density (Acm-2)
H2 - 30h sofcom mix - 46h H2 - 498h sofcom mix - 499h
-14,37%
-14,12%
Impact of D4 (siloxane) on single cell performance
18 Politecnico di Torino – M24 SOFCOM meeting
500
550
600
650
700
750
800
850
900
950
1.000
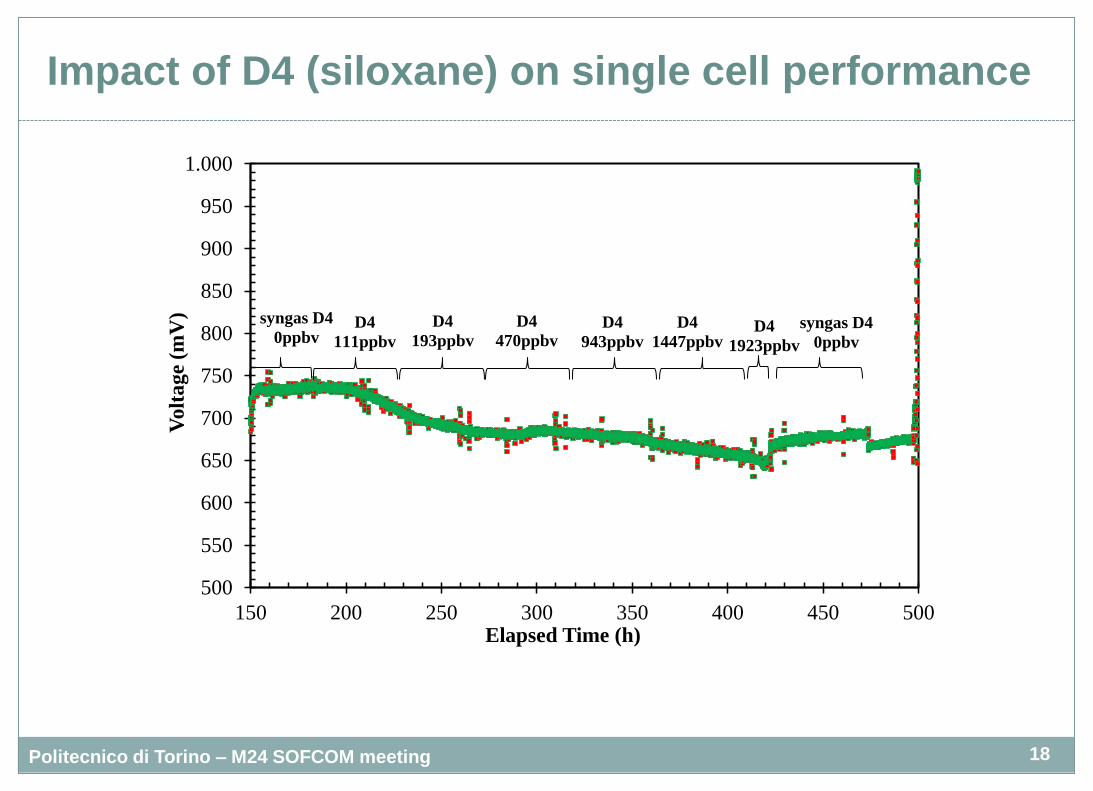
150 200 250 300 350 400 450 500
Volt
age
(mV
)
Elapsed Time (h)
syngas D4
0ppbvD4
111ppbv
D4
193ppbv
D4
470ppbvD4
943ppbv
D4
1447ppbvD4
1923ppbv
syngas D4
0ppbv