Embed Size (px)
Citation preview


Contents
Welcome
New CPI Weights
Methodological changes esp Housing
Moving to the revamped CPI
New CPI weights
New CPI weights
Outline
Why reweighting
New classification
2000 and 2008 weights compared
Sources to derive the weights
Basket of goods and services

New CPI weights
Why reweighting?
International practice is to refresh the CPI weights at least every 5 years
Weights represent the proportions of total consumption expenditure of households
Reweighting ensures that CPI is based on pattern of recent household expenditure
Weights are mainly based on the Income and Expenditure Survey (IES) of 2005/6 released in March 2008

New CPI weights
Why reweighting?
IES showed that generally South Africans are better off since 2000
New CPI weights
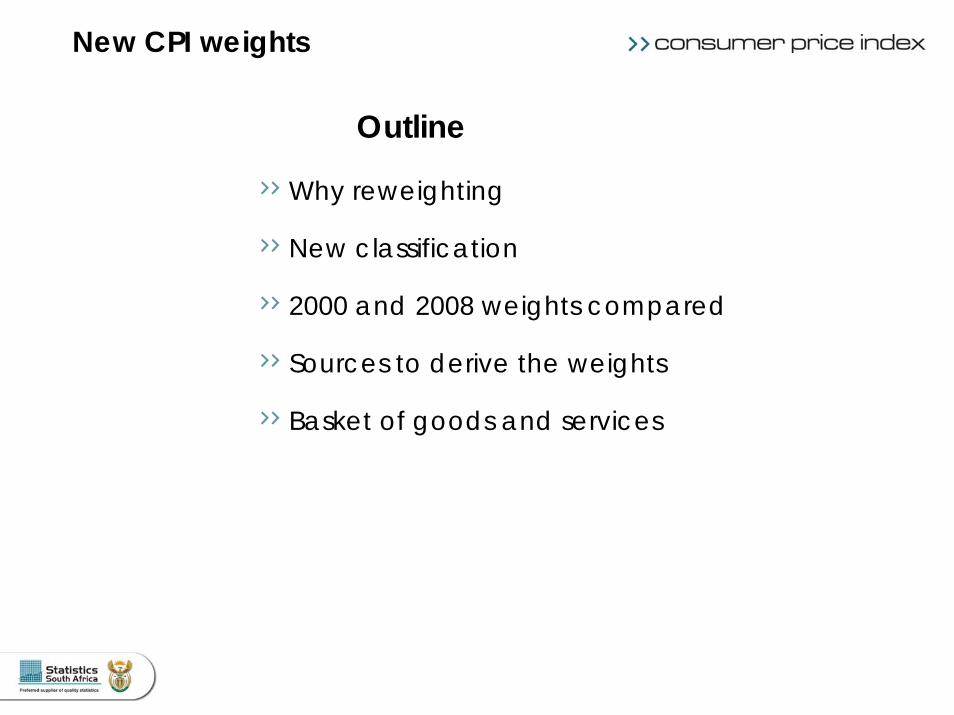
New Classification
Current CPI classification = International Trade Classification (ITC)
New CPI classification = Classification of Individual Consumption by Purpose (COICOP)
COICOP is international standard
IES also classified according to COICOP
Change in classification does not influence measured inflation

New CPI weights
ITC code ITC Category COICOPcode
COICOP Category
0102
FoodNon-alcoholic beverages
01
02
03
04
05
06
07
08
09
10
11
12
0304
Alcoholic beveragesCigarettes, cigars and tobacco
Food and non-alcoholicbeverages
Alcoholic beverages andtobacco
Clothing and footwear
Housing and utilities
Household contents, equipment and maintenance
Health
Transport
Communication
Recreation and culture
Education
Restaurants and hotels
05 Clothing and footwear
0607
HousingFuel and power
0809
Furniture and equipmentHousehold operations
10 Medical care and health expenses
11 Transport
12 Communication
1314
Recreation and entertainmentReading matter
15 Education
1617
Personal careOther
Miscellaneous goods andservices
New CPI weights
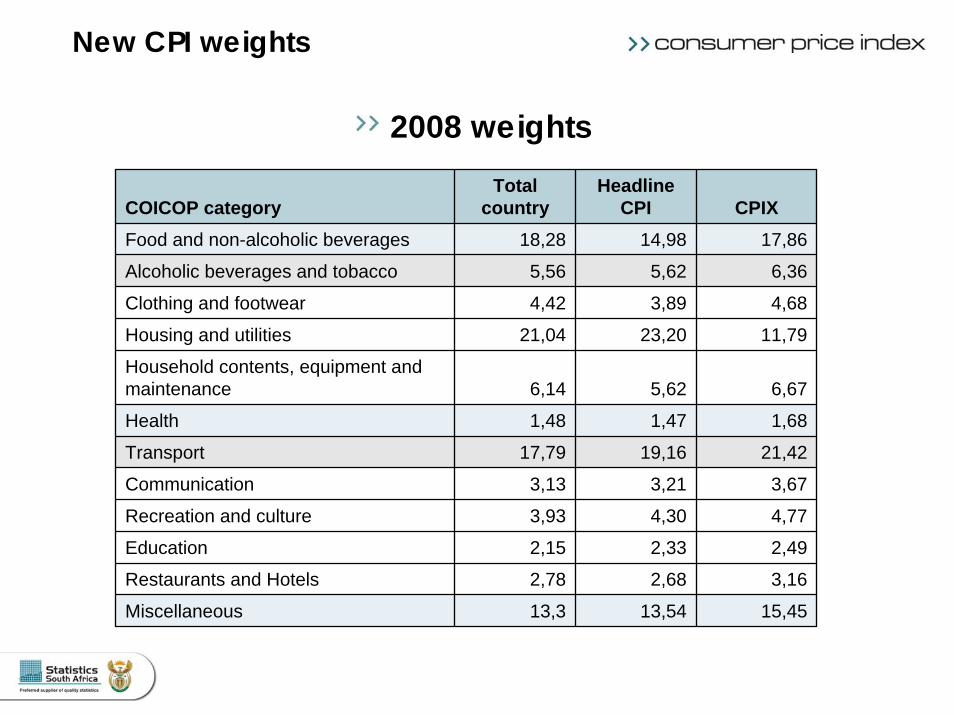
2008 weights
COICOP categoryTotal
countryHeadline
CPI CPIXFood and non-alcoholic beverages 18,28
5,56
4,42
21,04
6,14
1,48
17,79
3,13
3,93
2,15
2,78
13,3
17,86
Alcoholic beverages and tobacco
14,98
5,62
3,89
23,20
5,62
1,47
19,16
3,21
4,30
2,33
2,68
6,36
Clothing and footwear 4,68
Housing and utilities 11,79
Household contents, equipment and maintenance 6,67
Health 1,68
Transport 21,42
Communication 3,67
Recreation and culture 4,77
Education 2,49
Restaurants and Hotels 3,16
Miscellaneous 13,54 15,45

New CPI weights
CPI total country weights: 2000 and 2008
COICOP category 2000 weights 2008 weightsFood and non-alcoholic beverages 26,6 18,28 (20,2 including restaurants)
Alcoholic beverages and tobacco 2,86 5,56
Clothing and footwear 3,87 4,42
Housing and utilities 22,7 21,04
Household contents, equipment and maintenance 7,69 6,14
Health 5,57 1,48
Transport 13,22 17,79
Communication 2,71 3,13
Recreation and culture 3,17 3,93
Education 3,22 2,15
Restaurants and Hotels n/a 2,78 (0,87 excluding restaurants)
Miscellaneous 8,39 13,3

New CPI weights
Differences between CPI weights and IES expenditure sharesCOICOP category IES shares CPI 2008
weightsFood and non-alcoholic beverages 14,43 18,28
Alcoholic beverages and tobacco 1,15 5,56
Clothing and footwear 4,95 4,42
Housing 23,58 21,04
Household contents, equipment and maintenance 6,89 6,14
Health 1,66 1,48
Transport 19,92 17,79
Communication 3,51 3,13
Recreation and culture 4,60 3,93
Education 2,42 2,15
Restaurants and hotels 2,20 2,78
Miscellaneous 14,39 13,3
New CPI weights
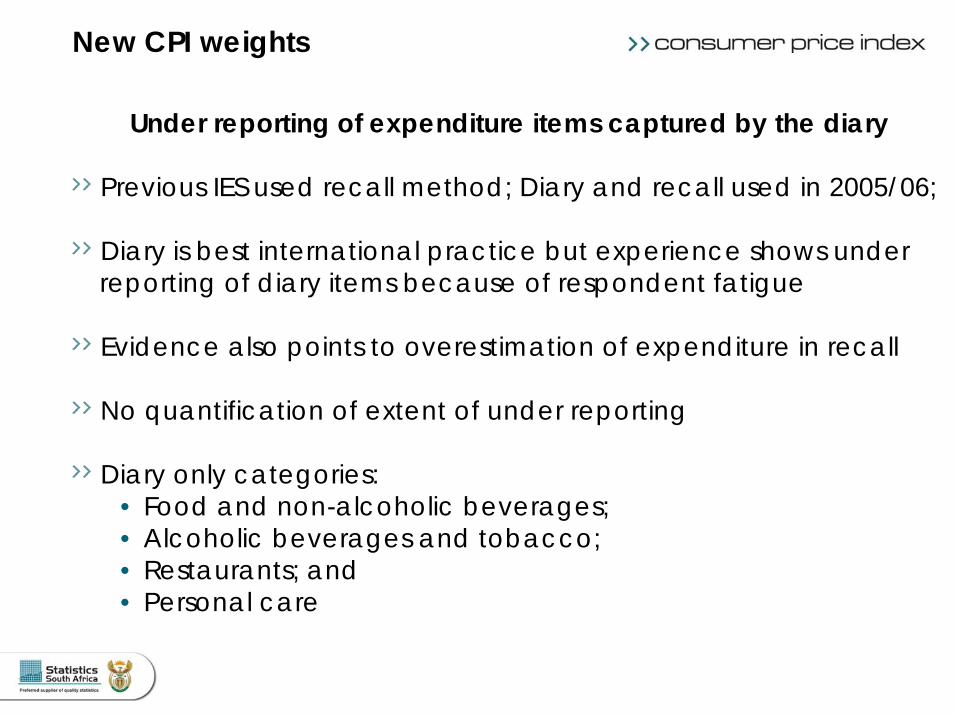
Under reporting of expenditure items captured by the diary
Previous IES used recall method; Diary and recall used in 2005/06;
Diary is best international practice but experience shows under reporting of diary items because of respondent fatigue
Evidence also points to overestimation of expenditure in recall
No quantification of extent of under reporting
Diary only categories: • Food and non-alcoholic beverages;• Alcoholic beverages and tobacco;• Restaurants; and• Personal care

New CPI weights
Additional data sources
International good practice is to use additional data sources where expenditure survey under (or over) reports
Adjustments only made to diary-only items
IES results were compared with:•Private consumption expenditure of the GDP;•Stats SA sectoral surveys (e.g. retail, food & beverages,
motor trade)•Industry sources
Weights calculated on basis of actual Rand values

New CPI weights
Food and non-alcoholic beverages
Used food sales values from Large Sample Survey of Retail
Adjusted for informal sector, time periods and sales to businesses
Distribution of food within IES confirmed by sales data from major supermarket chains
R million IES Expenditure
CPI Expenditure
Food and non-alcoholic beverages
100 971 143 402
New CPI weights
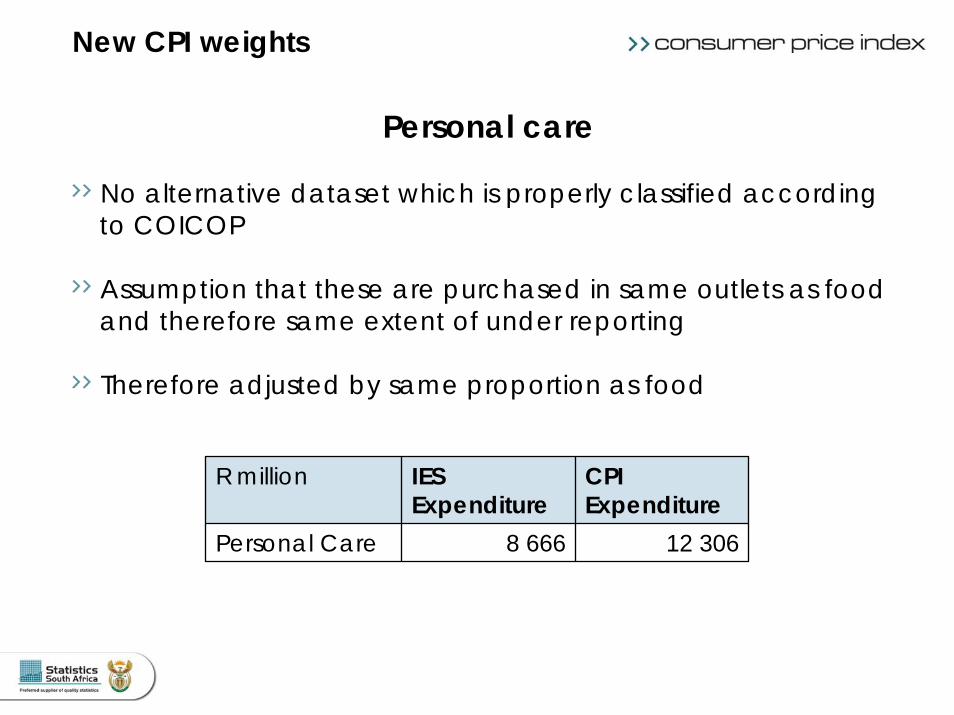
Personal care
No alternative dataset which is properly classified according to COICOP
Assumption that these are purchased in same outlets as food and therefore same extent of under reporting
Therefore adjusted by same proportion as food
R million IES Expenditure
CPI Expenditure
Personal Care 8 666 12 306

New CPI weights
Restaurants
Used sales value from Stats SA’s Food and beverages survey -adjusted to exclude business sales
R million IES Expenditure
CPI Expenditure
Restaurants 9 633 15 007
New CPI weights
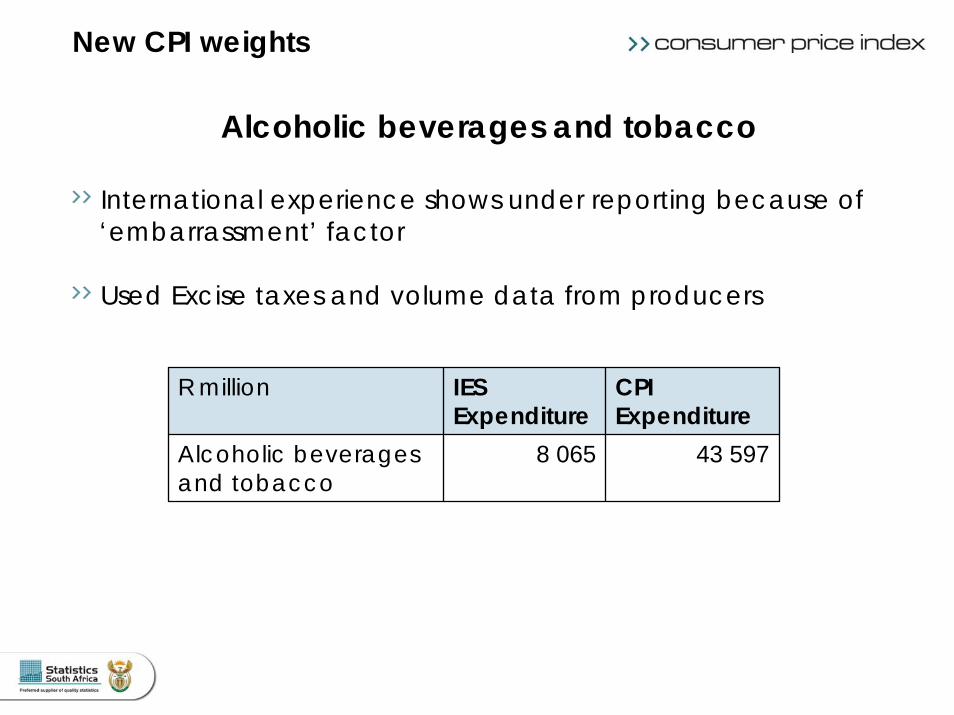
Alcoholic beverages and tobacco
International experience shows under reporting because of ‘embarrassment’ factor
Used Excise taxes and volume data from producers
R million IES Expenditure
CPI Expenditure
Alcoholic beverages and tobacco
8 065 43 597
New CPI weights
Final CPI basket
Basket of goods and services based on IES results
September 2007: Draft basket for public discussion – now finalised
Provincial baskets for first time
Two criteria for inclusion:•What was total expenditure in group?•How widespread were purchases?

New CPI weights
Final CPI basket
Some new products that will be included:• Minibus taxi trips• Restaurant and take away meals• Hotel accommodation• Funeral costs and insurance• Tickets to sporting events• CDs and DVDs
Some current basket products that will not be included:• Caravans and boats• Musical instruments• Laundry services• VHS recorders and cassettes

New CPI weights
Publication level ProductsWestern Cape 392Eastern Cape 365Northern Cape 356Free State 374KwaZulu-Natal 370North West 364Gauteng 370Mpumalanga 363Limpopo 356National 416
Products in baskets

Questions
Methodological changesFocus on housing

Methodological improvements2005-2006: collection of consumer products in field
Current process reviewed all services in CPI
Aim:•Comply with international standards•Ensure relevant and accurate data•Ensure efficient and practical collection methods
Examples of small methodological changes:•University fees•Books, CDs, DVDs
Large methodological changes in •Health (survey of doctors, dentists and hospitals vs NHRPL)•Housing

COICOP code COICOP description
04.1 Actual rentals for housing04.2 Owners’ equivalent rent04.3 Maintenance and repair
04.4 Water and other services04.5 Electricity and other fuels
Housing and utilities: sub-categories
Housing
Conceptual issuesOwners’ equivalent rent = Costs of owner occupiers = Imputed rental (IES)
Why is owner occupied housing a special case?• asset • accommodation service
Not linked to any specific payment
Opportunity cost of a rental income
Important because of high weight and variability due to location
Adopted concept draws strongly on international precedent
Revised methods for weights and pricing
ConceptsHousing
Current practice
Interest rates alone
•Cost of debt, not housing
•Not a good indicator of changes in cost of housing
•No local variation
•Not an accepted international approach
Housing
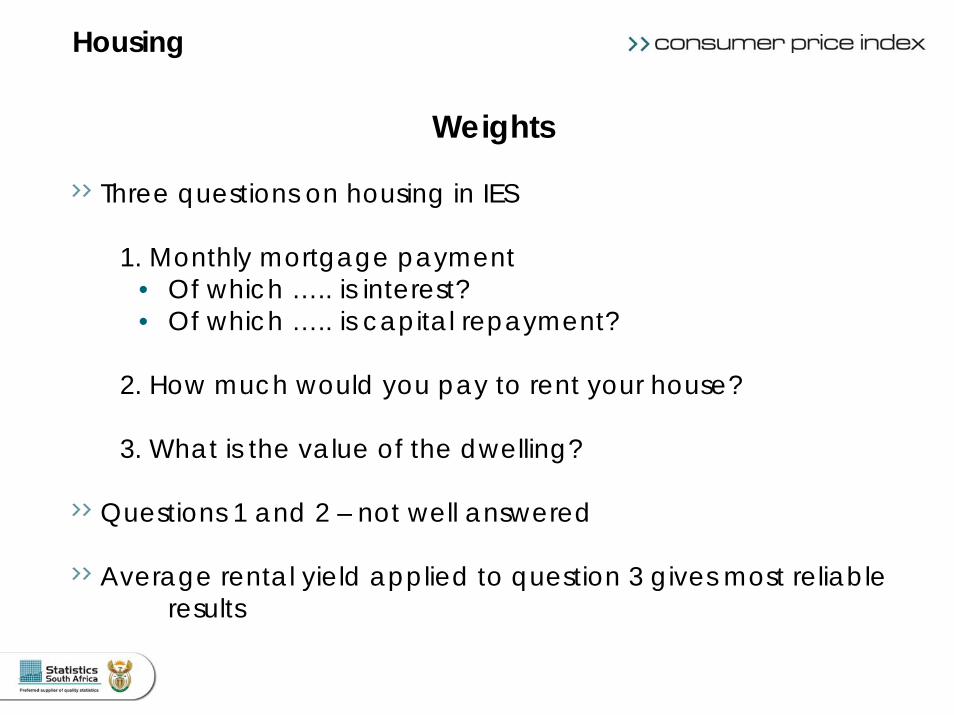
Weights
Three questions on housing in IES
1. Monthly mortgage payment• Of which ….. is interest?• Of which ….. is capital repayment?
2. How much would you pay to rent your house?
3. What is the value of the dwelling?
Questions 1 and 2 – not well answered
Average rental yield applied to question 3 gives most reliable results
Housing

Weight (total country) of housing costs in new basket
Housing
Group WeightActual rentals for housing 3,20Owners equivalent rent 11,25Maintenance and repair 1,55Water and other services 2,86Electricity and other fuels 2,18Total Housing 21,04

Approaches and data requirements
Housing
Measures Data required
Acquisitions Changing cost of houses bought by household sector from other sectors
•New house prices•Depreciation•Value of housing stock
User cost Estimated change in purchase price and sale price accounting for wear and tear etc
•House prices•Depreciation•Value of housing stock•Interest rates
Rental equivalence
Values the services yielded by the dwelling by corresponding rental value for same type of dwelling
•Rents of equivalent dwellings

Approaches employed in other countriesCountry Method
Australia AcquisitionsCanada User costChina User costGermany Rental equivalenceJapan Rental equivalenceMexico Rental equivalenceNetherlands Rental equivalenceNew Zealand AcquisitionsNorway Rental equivalencePoland Rental equivalenceSingapore Rental equivalenceSweden User costUnited Kingdom User costUnited States Rental equivalence
Housing

South African CPI to use rental equivalence
Two criteria for decision
Data•Regularly updated and reliable data for other approaches is not available
Composition of stock•Structure of owner-occupied and rental sectors sufficiently similar•Houses, townhouses and flats are available for rent and purchase
New approach
Owned Rented TotalPercentage of total 77 23 100
Source: Census 2001
Housing

New approachHousing
Product group Old method New methodRode rental survey
Interest rates on mortgage bondsConstruction index (JBCC)Collect water, sewerage and assessment rates from municipalitiesCollect electricity tariffs from suppliers; solid fuels from retailers
Owners’ equivalent rent
Rental equivalence
Actual rentals Rode rental survey
Maintenance and repair
Hardware items
Water and other services
Collect water, sewerage and assessment rates from municipalities
Electricity and other fuels
Collect electricity tariffs from suppliers; solid fuels from retailers
Summary of methods

Implication for different indices
CPI: Owners’ equivalent rent replaces interest rates
CPIX: No impact Definition of CPIX will be excluding Owners’ equivalent rent
Core CPI: No impactDefinition of core CPI will exclude Owners’ equivalent rent
New approachHousing

Data source for owners’ equivalent rent
Stats SA’s rental survey
Covers houses, townhouses and flats
Data collected quarterly by fieldworkers
Head office team of four to coordinate and assure quality
Purposive sample of letting agents in all CPI collection areas
Predetermined number of units to select per type geographicallydistributed
Obtain actual rental of unit each quarter
Percentage change of rental for each specific dwelling between consecutive quarters calculated and then averaged
Rental surveyHousing

Sample size
Approximately 4500 units distributed equally between houses, flats and townhouses
To be increased to between 8000 and 10 000
Proportion of houses to be increased
Rental surveyHousing

Rental survey
QuarterQ3:2007/Q3:2006
Q4:2007/Q4:2006
Q1:2008/Q1:2007
Rental (all areas) 6,06% 6,08% 7,12%Rental (metro only) 6,12% 6,25% 7,52%
Results
Housing

Rental survey
Rental index per province
98,00
100,00
102,00
104,00
106,00
108,00
110,00
112,00
114,00
Q3:2006 Q4:2006 Q1:2007 Q2:2007 Q3:2007 Q4:2007 Q1:2008
Quarter
Inde
x Va
lue
Western Cape Eastern Cape Northern Cape Free State KwaZulu Natal North West
Gauteng Mpumalanga Limpopo National
Housing

Rental survey
Rental index per housing type
98,00
100,00
102,00
104,00
106,00
108,00
110,00
112,00
114,00
Q3:2006 Q4:2006 Q1:2007 Q2:2007 Q3:2007 Q4:2007 Q1:2008
Quarter
Inde
x Va
lue
Houses Flats Townhouses National (Combined) National (metro only)
Housing

Housing
Comparison of indices
98.00
103.00
108.00
113.00
118.00
123.00
128.00
Q3:2006 Q4:2006 Q1:2007 Q2:2007 Q3:2007 Q4:2007 Q1:2008
Quarter
Inde
x Va
lue
Rental(combined)
Absa House Price index
Standard bank house price index
Interest rates on mortgage bonds

Questions

Moving to the revamped CPI:Introducing the 2009 CPI

Three main changes
1. New weights and new basket
2. Rebasing: 2008 = 100
3. Change in classification
Rental survey2009 CPI

Impact of the new weights and new basket on measured inflation
Substitution effect = consumers move to lower inflation productsover time
Income effect = As incomes rise, consumers shift to more expensive goods even if price increases may rise more rapidly than average inflation
Increased weight for services and lower weight for food have downward effect on inflation numbers
Biggest impact of three changes on measured inflation
Rental survey2009 CPI

Rental survey2009 CPI

Impact of the classification change on measured inflation
Individual items simply move between categories
May affect sub-component inflation but these balance each other
No impact on headline aggregates
Rental survey2009 CPI

Rental survey2009 CPI
Impact of the rebasing on measured inflation
Index levels set to 100 (average of 2008)
Rates of change remain the same
No impact on inflation measures
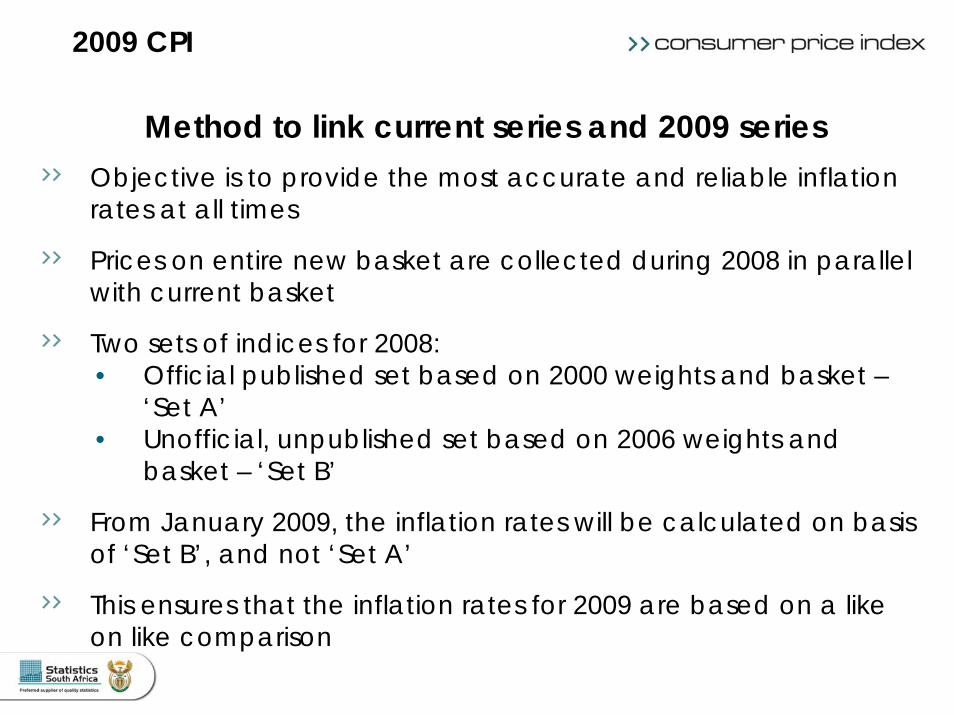
Method to link current series and 2009 seriesObjective is to provide the most accurate and reliable inflationrates at all times
Prices on entire new basket are collected during 2008 in parallel with current basket
Two sets of indices for 2008:• Official published set based on 2000 weights and basket –
‘Set A’• Unofficial, unpublished set based on 2006 weights and
basket – ‘Set B’
From January 2009, the inflation rates will be calculated on basis of ‘Set B’, and not ‘Set A’
This ensures that the inflation rates for 2009 are based on a like on like comparison
Rental survey2009 CPI

2009 CPIHypothetical figures

Method to link current series and 2009 series
This is not a revision of the 2008 inflation rates
A hybrid year on year index is not possible given the scale of the changes to the weights and basket (e.g. Restaurants and Hotels)
Rental survey2009 CPI

Time series information
COICOP based timeseries data will be available between release of December 2008 CPI and January 2009 CPI
Stats SA will calculate COICOP – based timeseries for at least one year
Indices experiencing little change will be able to be calculated further back
Rental survey2009 CPI

Next steps
October 2008: Release of Methods and sources manual
November 2008: Finalisation of CPI release format
February 2009: Release of COICOP-based timeseries data
25 February 2009: Release of January 2009 CPI
Rental survey2009 CPI

Questions