Embed Size (px)
Citation preview
Presentation to World Bank on observation and
initiatives on 'Ease of Doing Business'

Aspects covered in Presentation
• Main initiatives and Reform update
• Export case study
• Import case study
• Good Practices
• Issues in Methodology
• Impact of Reforms
• Shift in Approach

Reform – Perform – Transform A Journey towards achieving excellence
Brought cargo release time as centre of focus in addition to Revenue Collection
Enhanced process efficiency by implementing several modernised procedures
Renewed and intensive focus on Digital Customs - New Investment into IT Infrastructure and Applications – Technology Refresh
Better coordination amongst various stakeholders in the border clearance ecosystem
Extensive outreach, perception survey and capacity building efforts
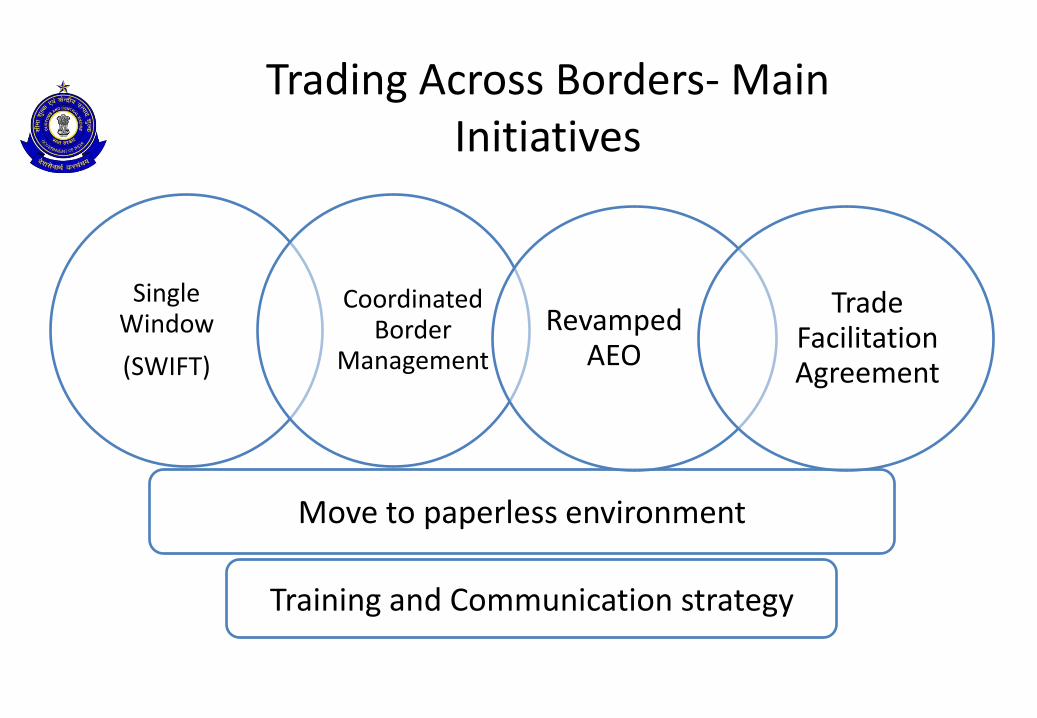
Trading Across Borders- Main Initiatives
Single Window
(SWIFT)
Coordinated Border
Management
Training and Communication strategy
Move to paperless environment
Revamped AEO
Trade Facilitation Agreement

Introduced Customs Single window - SWIFT
SWIFT
Importers
Exporters
CHAs Banks
RBI
Airlines Shipping
lines Freight
Forwarders
Ports, Airports
Air cargo complexes
ICD/CFS
Other
Customs Administrations
Other Government
Agencies
24/7 integrated system

Coordinated Border Management
Customs Clearance Facilitation Committees
• Customs-led Standing/permanent interagency bodies
• Local and National levels
Delegation of authority to Customs by other government agencies, wherever feasible
Integrated Risk Assessment
• Customs to manage automated selectivity criteria for Participating Government Agencies
Integrated time release studies
Integrated Check Posts
6
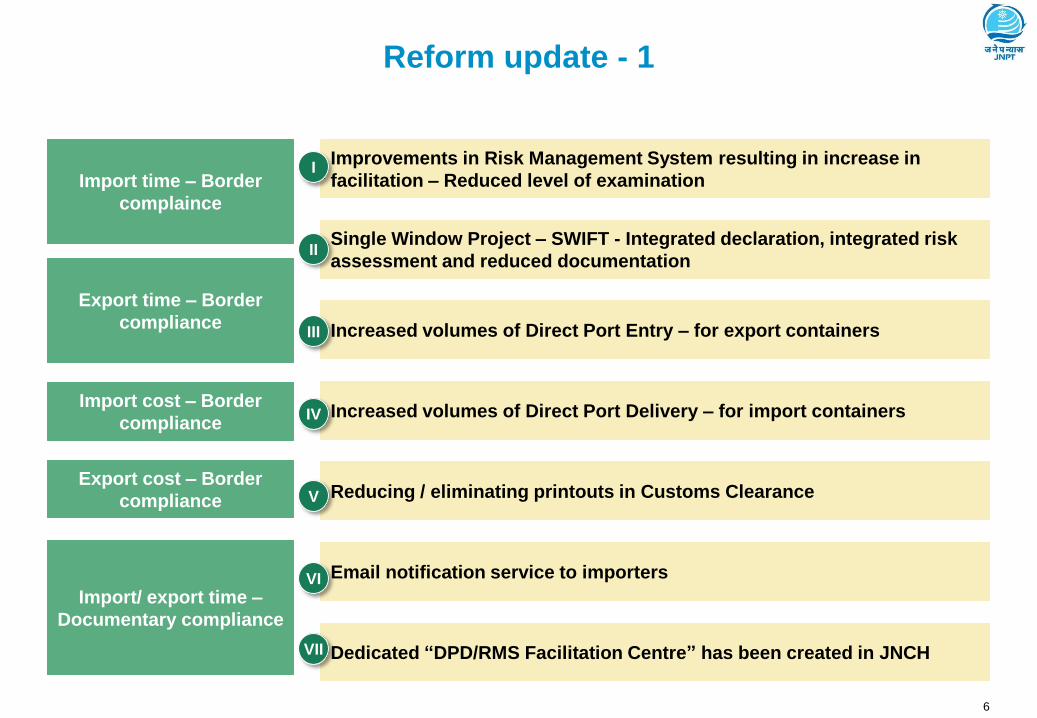
Reform update - 1
Import time – Border
complaince
Export time – Border
compliance
Import cost – Border
compliance
Import/ export time –
Documentary compliance
Improvements in Risk Management System resulting in increase in
facilitation – Reduced level of examination
Increased volumes of Direct Port Entry – for export containers
Single Window Project – SWIFT - Integrated declaration, integrated risk
assessment and reduced documentation
Increased volumes of Direct Port Delivery – for import containers
Email notification service to importers
Reducing / eliminating printouts in Customs Clearance
I
II
III
IV
V
VI
Export cost – Border
compliance
Dedicated “DPD/RMS Facilitation Centre” has been created in JNCH VII
7
Import time – Border
compliance
Export time – Border
compliance
Import cost – Border
compliance
Import/ export time –
Documentary compliance
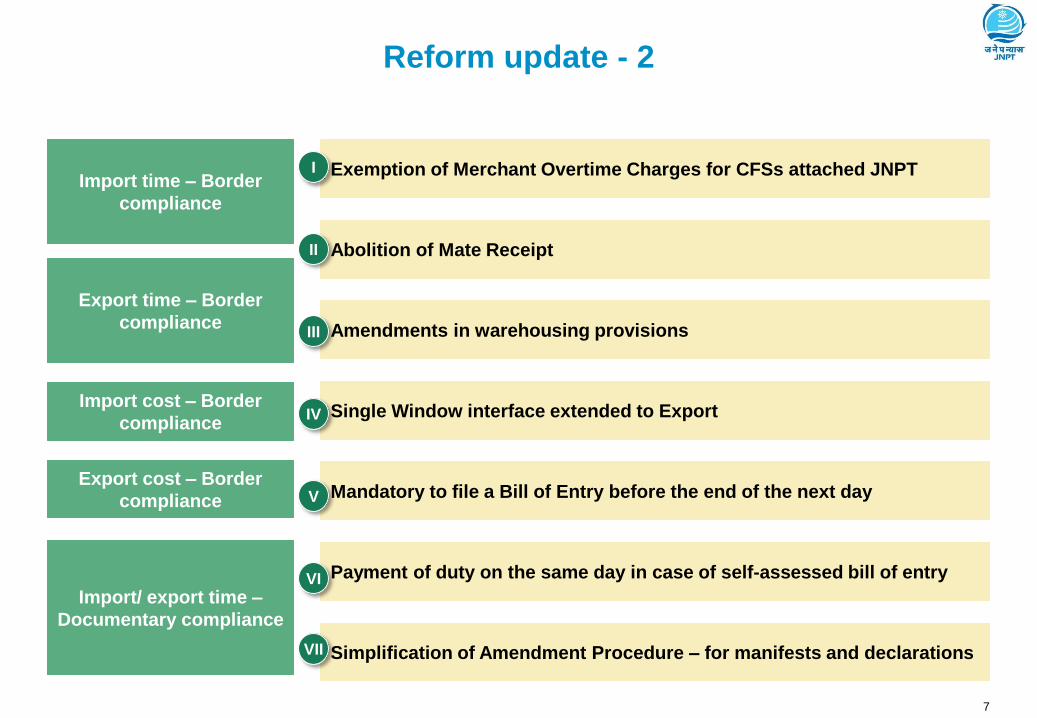
Exemption of Merchant Overtime Charges for CFSs attached JNPT
Amendments in warehousing provisions
Abolition of Mate Receipt
Single Window interface extended to Export
Payment of duty on the same day in case of self-assessed bill of entry
Mandatory to file a Bill of Entry before the end of the next day
I
II
III
IV
V
VI
Export cost – Border
compliance
Simplification of Amendment Procedure – for manifests and declarations VII
Reform update - 2
8
Import time – Border
compliance
Export time – Border
compliance
Import cost – Border
compliance
Import/ export time –
Documentary compliance
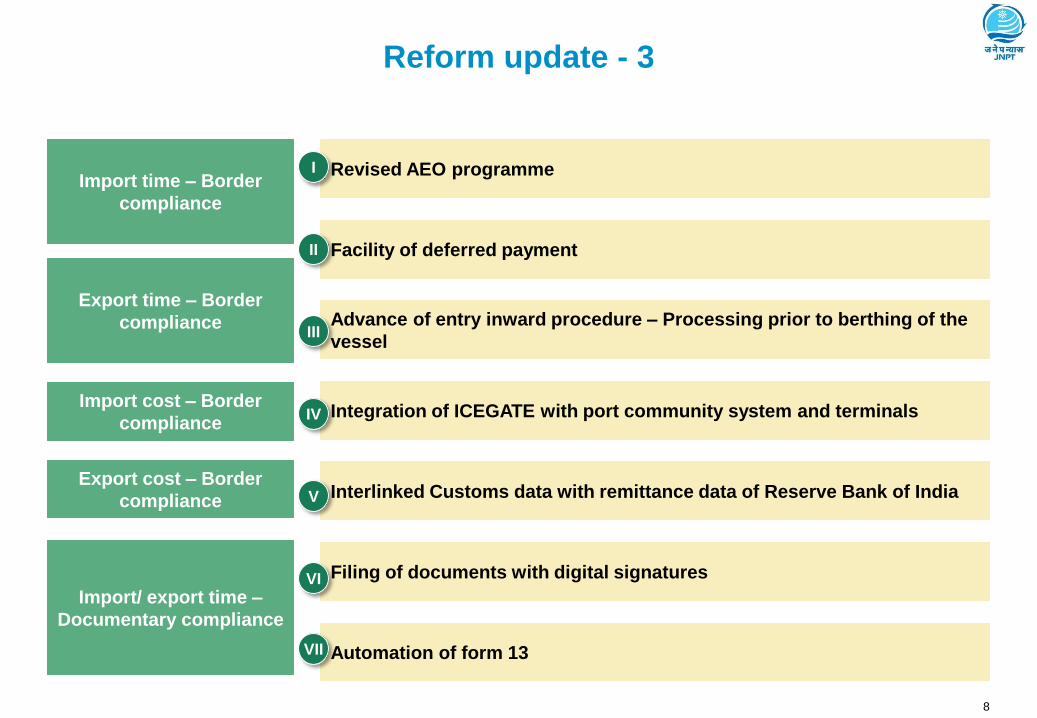
Revised AEO programme
Advance of entry inward procedure – Processing prior to berthing of the
vessel
Facility of deferred payment
Integration of ICEGATE with port community system and terminals
Filing of documents with digital signatures
Interlinked Customs data with remittance data of Reserve Bank of India
I
II
III
IV
V
VI
Export cost – Border
compliance
Automation of form 13 VII
Reform update - 3
9
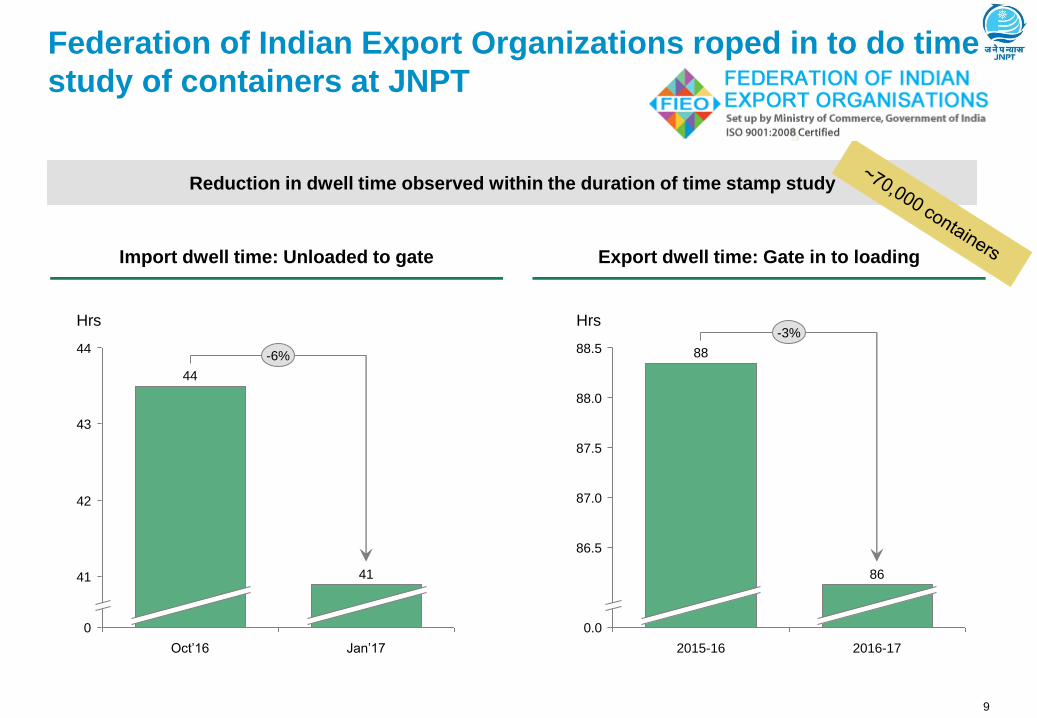
Federation of Indian Export Organizations roped in to do time
study of containers at JNPT
0
43
44
41
42
Hrs
-6%
Jan’17
41
Oct’16
44
Import dwell time: Unloaded to gate
0.0
87.0
88.0
88.5
86.5
87.5
Hrs -3%
2016-17
86
2015-16
88
Export dwell time: Gate in to loading
Reduction in dwell time observed within the duration of time stamp study
10
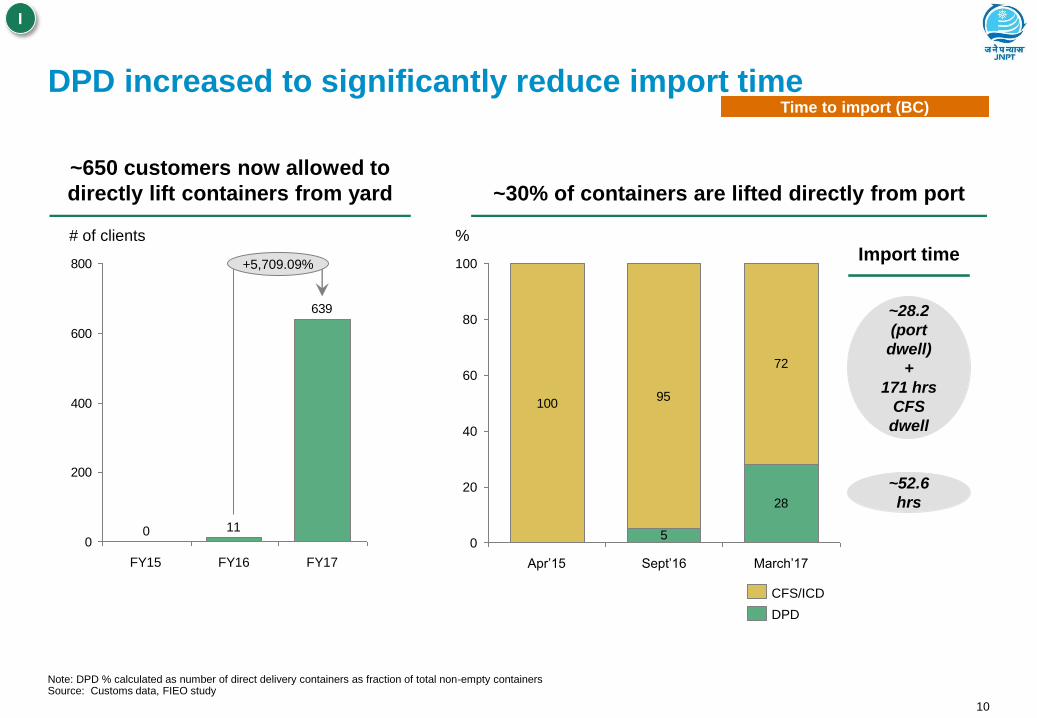
DPD increased to significantly reduce import time
~650 customers now allowed to
directly lift containers from yard ~30% of containers are lifted directly from port
639
1100
200
400
600
800
FY15
# of clients
FY17
+5,709.09%
FY16
28
10095
72
50
20
40
80
60
100
%
Sept’16 Apr’15 March’17
CFS/ICD
DPD
~28.2
(port
dwell)
+
171 hrs
CFS
dwell
~52.6
hrs
Import time
Time to import (BC)
I
Note: DPD % calculated as number of direct delivery containers as fraction of total non-empty containers Source: Customs data, FIEO study
11
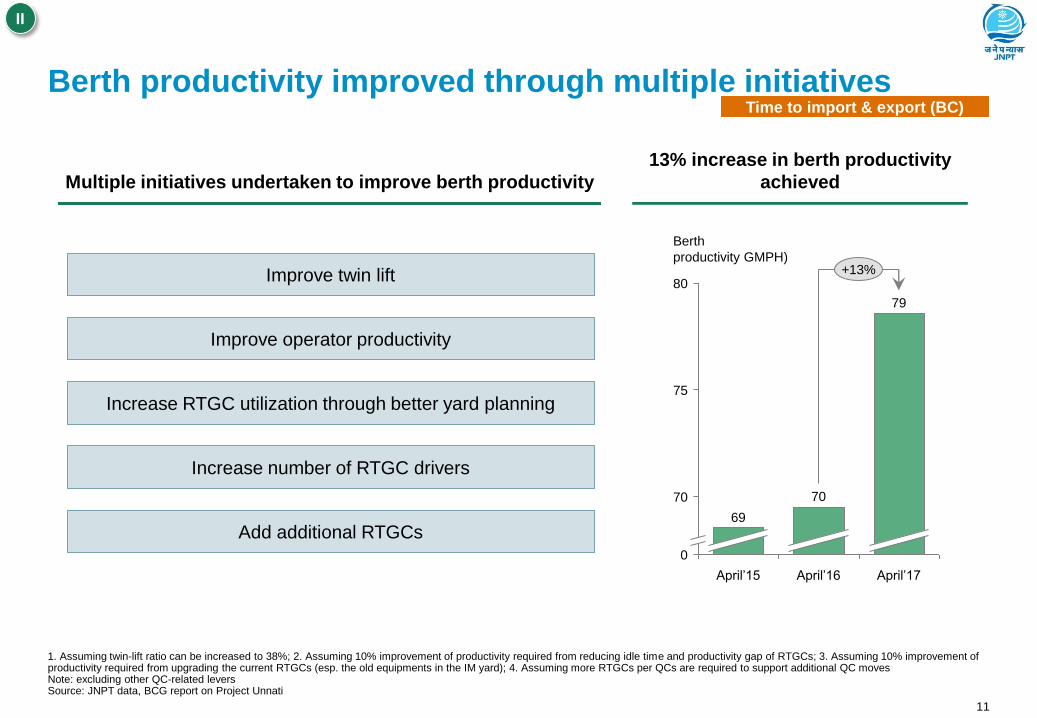
Berth productivity improved through multiple initiatives
1. Assuming twin-lift ratio can be increased to 38%; 2. Assuming 10% improvement of productivity required from reducing idle time and productivity gap of RTGCs; 3. Assuming 10% improvement of productivity required from upgrading the current RTGCs (esp. the old equipments in the IM yard); 4. Assuming more RTGCs per QCs are required to support additional QC moves Note: excluding other QC-related levers Source: JNPT data, BCG report on Project Unnati
Multiple initiatives undertaken to improve berth productivity
13% increase in berth productivity
achieved
70
0
80
75
April’16
79
69
April’15
70
April’17
+13%
Berth
productivity GMPH)
Time to import & export (BC)
II
Improve twin lift
Improve operator productivity
Increase RTGC utilization through better yard planning
Add additional RTGCs
Increase number of RTGC drivers
12
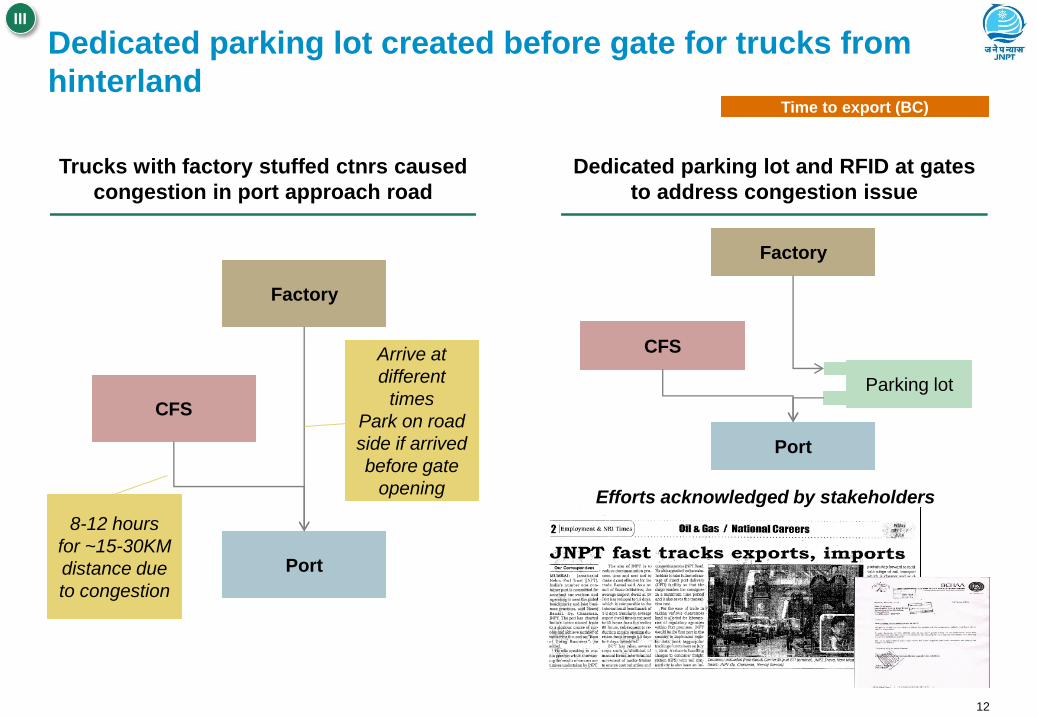
Dedicated parking lot created before gate for trucks from
hinterland Time to export (BC)
III
Trucks with factory stuffed ctnrs caused
congestion in port approach road
Dedicated parking lot and RFID at gates
to address congestion issue
Factory
CFS
Port
Arrive at
different
times
Park on road
side if arrived
before gate
opening
Factory
CFS
Port
Parking lot
8-12 hours
for ~15-30KM
distance due
to congestion
Efforts acknowledged by stakeholders
13
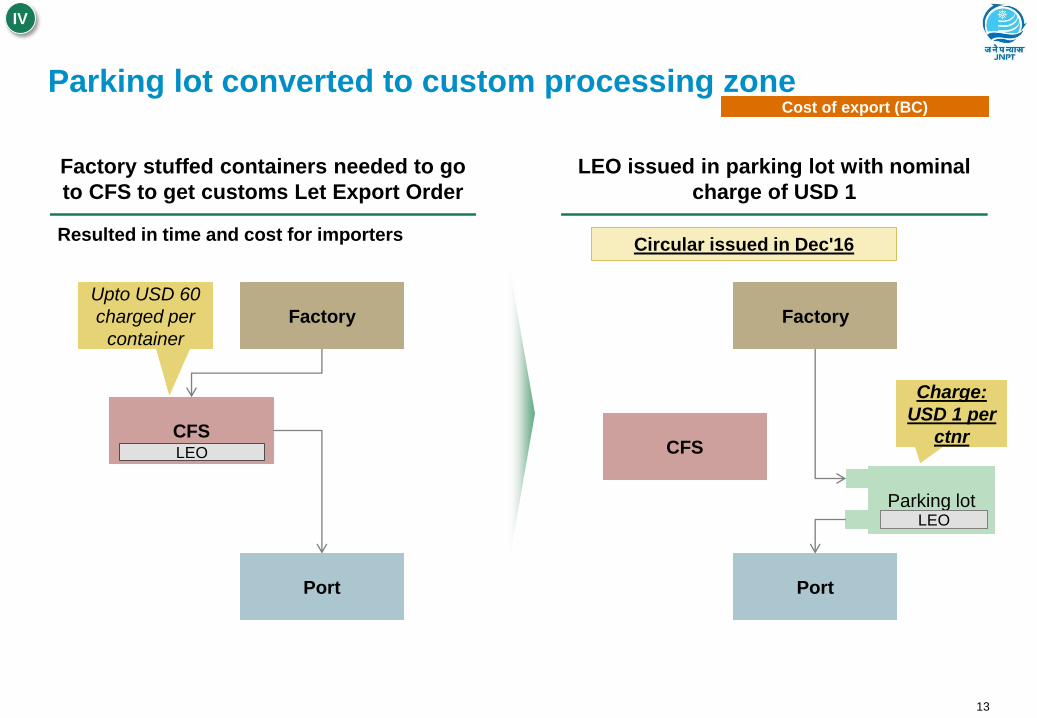
Parking lot converted to custom processing zone
Factory stuffed containers needed to go
to CFS to get customs Let Export Order
LEO issued in parking lot with nominal
charge of USD 1
Resulted in time and cost for importers
Factory
CFS
Port
Upto USD 60
charged per
container
Factory
CFS
Port
Parking lot
Charge:
USD 1 per
ctnr
Cost of export (BC)
Circular issued in Dec'16
IV
LEO
LEO

14
Direct port delivery (DPD) reduces overall import cost
significantly
Mandatory shifting to CFS for customs
OOC resulted in additional cost for
importers
OOC provided within Port to DPD
customers
Resulted in time and cost for importers
Factory
CFS
Port
All import
containers had to
be shifted to CFS
mandatorily
Factory
CFS
Port
Cost of import (BC)
Upto 28% of ctnrs availing DPD
V
USD 120-330
charged at CFS
Importers to save
CFS charges and
inventory cost of
7-8 days of CFS
storage. Cost
limited to USD
25-35
OOC
OOC
15
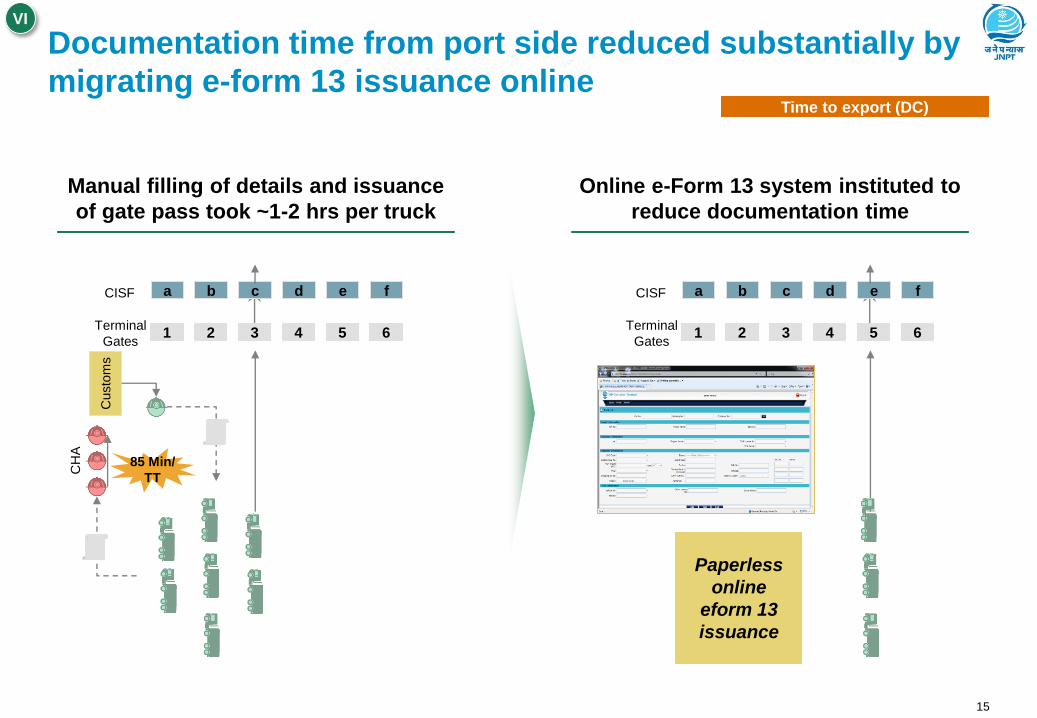
Documentation time from port side reduced substantially by
migrating e-form 13 issuance online
Manual filling of details and issuance
of gate pass took ~1-2 hrs per truck
1 2 3 4 5 6
a b c d e f
Custo
ms
CH
A
85 Min/
TT
Terminal
Gates
CISF
1 2 3 4 5 6
a b c d e f
Terminal
Gates
CISF
Paperless
online
eform 13
issuance
Online e-Form 13 system instituted to
reduce documentation time
Time to export (DC)
VI
16
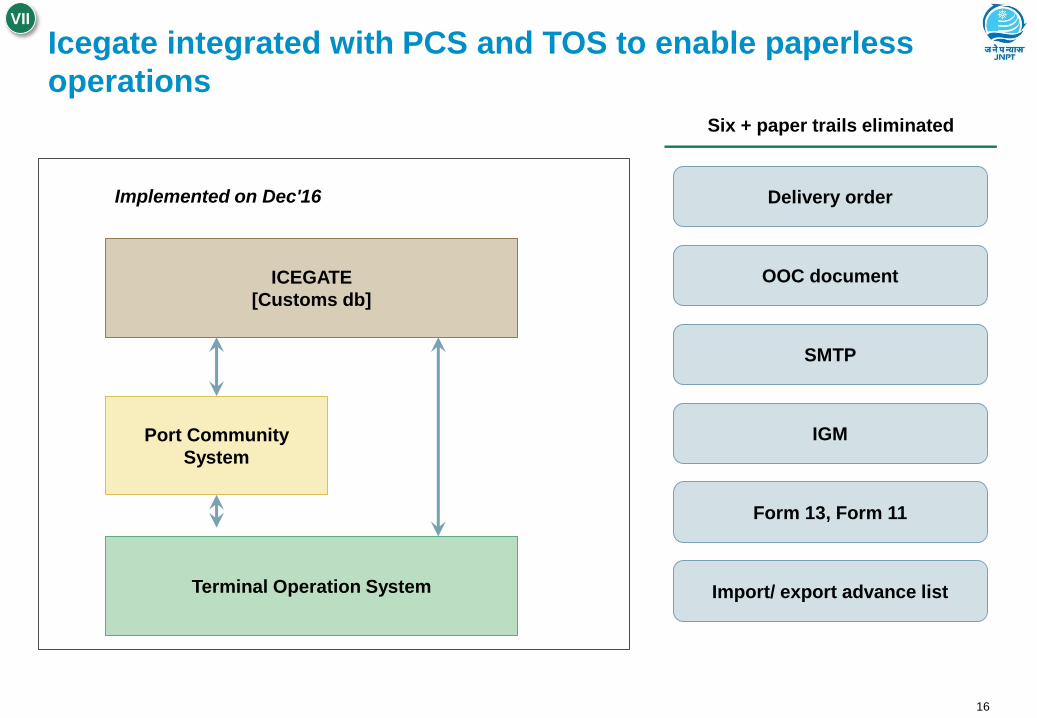
Icegate integrated with PCS and TOS to enable paperless
operations
ICEGATE
[Customs db]
Port Community
System
Terminal Operation System
Implemented on Dec'16 Delivery order
OOC document
SMTP
IGM
Form 13, Form 11
Import/ export advance list
Six + paper trails eliminated
VII
17
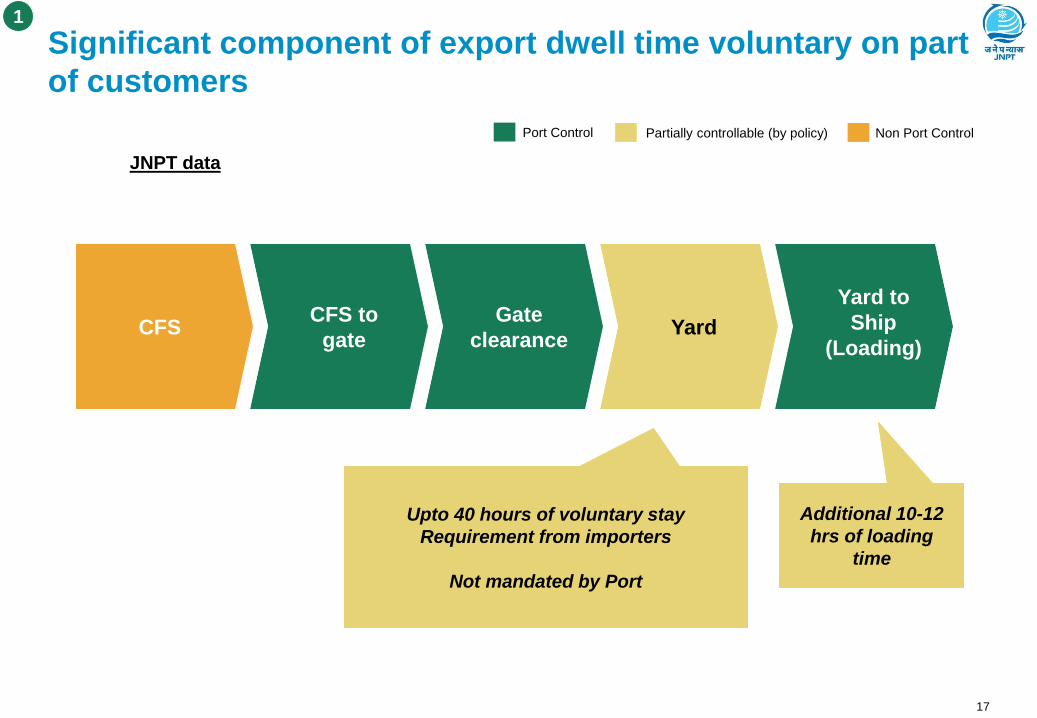
Significant component of export dwell time voluntary on part
of customers
CFS CFS to
gate
Gate
clearance Yard
Yard to
Ship
(Loading)
Port Control Non Port Control Partially controllable (by policy)
Upto 40 hours of voluntary stay
Requirement from importers
Not mandated by Port
Additional 10-12
hrs of loading
time
JNPT data
1
18
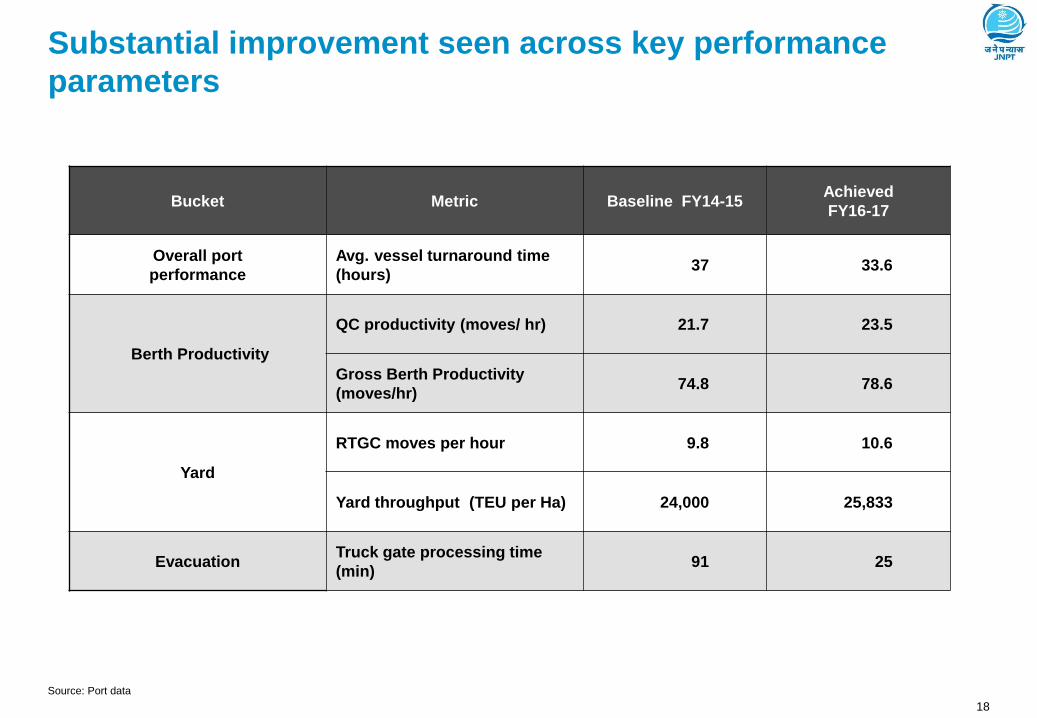
Substantial improvement seen across key performance
parameters
Bucket Metric Baseline FY14-15 Achieved
FY16-17
Overall port
performance
Avg. vessel turnaround time
(hours) 37 33.6
Berth Productivity
QC productivity (moves/ hr) 21.7 23.5
Gross Berth Productivity
(moves/hr) 74.8 78.6
Yard
RTGC moves per hour 9.8 10.6
Yard throughput (TEU per Ha) 24,000 25,833
Evacuation Truck gate processing time
(min) 91 25
Source: Port data

19
Context: India with DTF score of 57.19 in trading across
boundary section; Mumbai with score of 57.98
Value DTF
Export Time (BC) [hrs] 125 22
Export Time (DC) [hrs] 21 88
Import Time (BC) [hrs] 262 6
Import Time (DC) [hrs] 58 76
Export Cost (BC) [USD/Ctnr] 453 57
Export Cost (DC) [USD/Ctnr] 90 78
Import Cost (BC) [USD/Ctnr] 590 51
Import Cost(DC) [USD/Ctnr] 140 80
Value DTF
Export Time (BC) [hrs] 85 47
Export Time (DC) [hrs] 58 66
Import Time (BC) [hrs] 307 -
Import Time (DC) [hrs] 65 73
Export Cost (BC) [USD/Ctnr] 368 65
Export Cost (DC) [USD/Ctnr] 94 77
Import Cost (BC) [USD/Ctnr] 556 54
Import Cost(DC) [USD/Ctnr] 129 82
Value DTF
Export Time (BC) 106 34
Export Time (DC) 38 78
Import Time (BC) 283 -
Import Time (DC) 61 75
Export Cost (BC) 413 61
Export Cost (DC) 92 77
Import Cost (BC) 574 52
Import Cost(DC) 135 81
Delhi
Mumbai
India
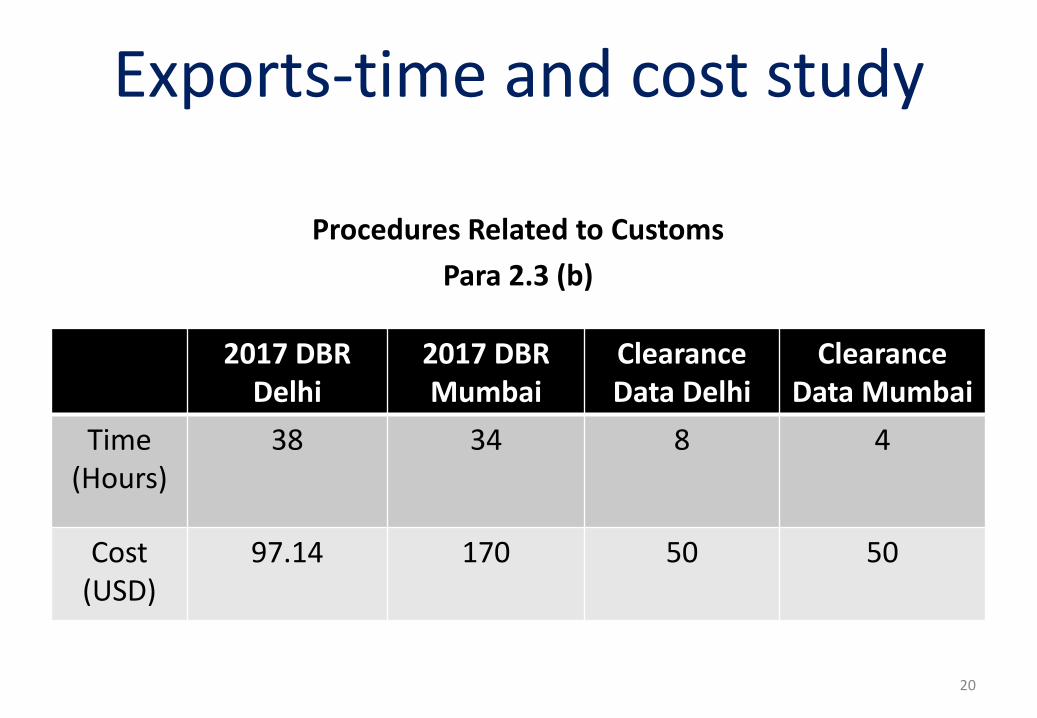
Exports-time and cost study
Procedures Related to Customs
Para 2.3 (b)
2017 DBR Delhi
2017 DBR Mumbai
Clearance Data Delhi
Clearance Data Mumbai
Time (Hours)
38 34 8 4
Cost (USD)
97.14 170 50 50
20

Exports-time and cost study
Procedures Related to Port & Border Handling. Para 2.5b
21
2017 DBR Delhi
2017 DBR Mumbai
Clearance Data Delhi
Clearance Data Mumbai
Time (Hours)
87 50.82 72 86*
Cost (USD)
356 197.94 117 132
* - 42 Hrs for aggregation of containers at the request of exporter + 8 Hrs for vessel load planning + 36 Hrs for vessel operations (Unloading and loading) = 86 Hrs
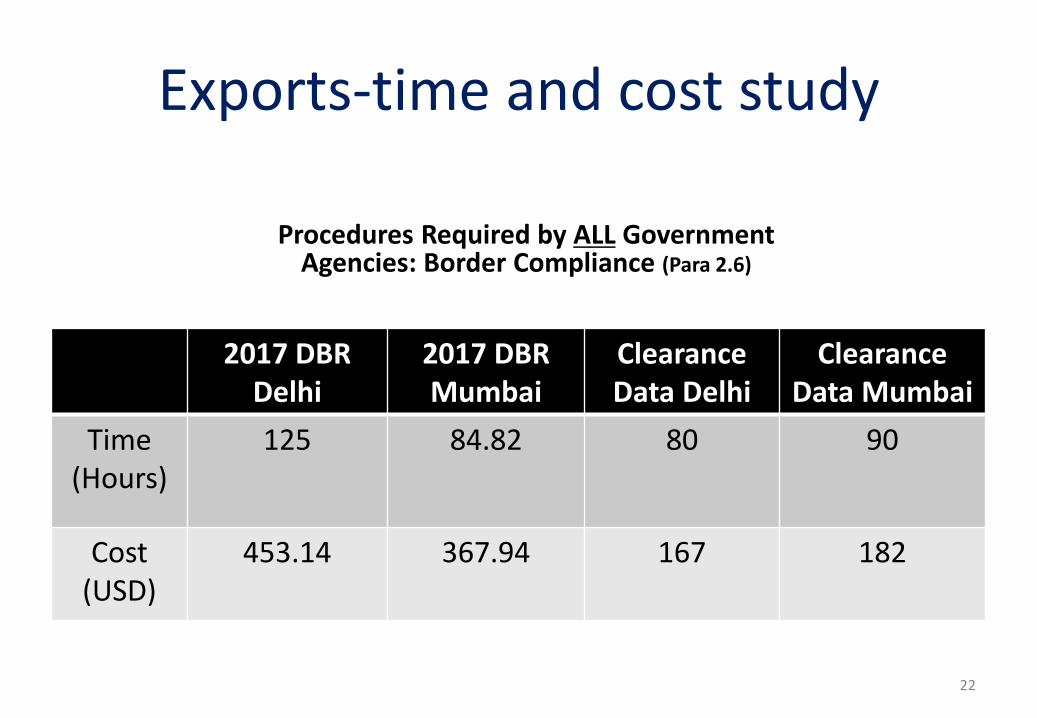
Exports-time and cost study
Procedures Required by ALL Government Agencies: Border Compliance (Para 2.6)
22
2017 DBR Delhi
2017 DBR Mumbai
Clearance Data Delhi
Clearance Data Mumbai
Time (Hours)
125 84.82 80 90
Cost (USD)
453.14 367.94 167 182

Exports-time and cost study
Procedure Related to Document Preparation Para 2.7 (b)
23
2017 DBR Delhi
2017 DBR Mumbai
Clearance Data Delhi
Clearance Data Mumbai
Time (Hours)
21 58 3 2
Cost (USD)
90 94 10 10
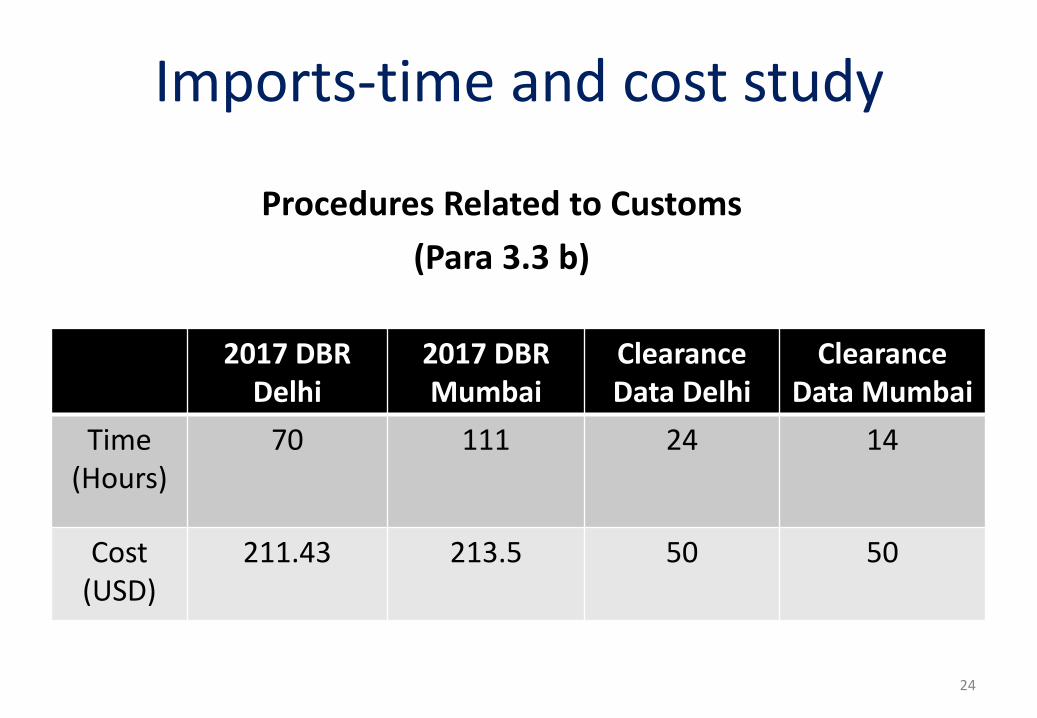
Imports-time and cost study
Procedures Related to Customs
(Para 3.3 b)
24
2017 DBR Delhi
2017 DBR Mumbai
Clearance Data Delhi
Clearance Data Mumbai
Time (Hours)
70 111 24 14
Cost (USD)
211.43 213.5 50 50
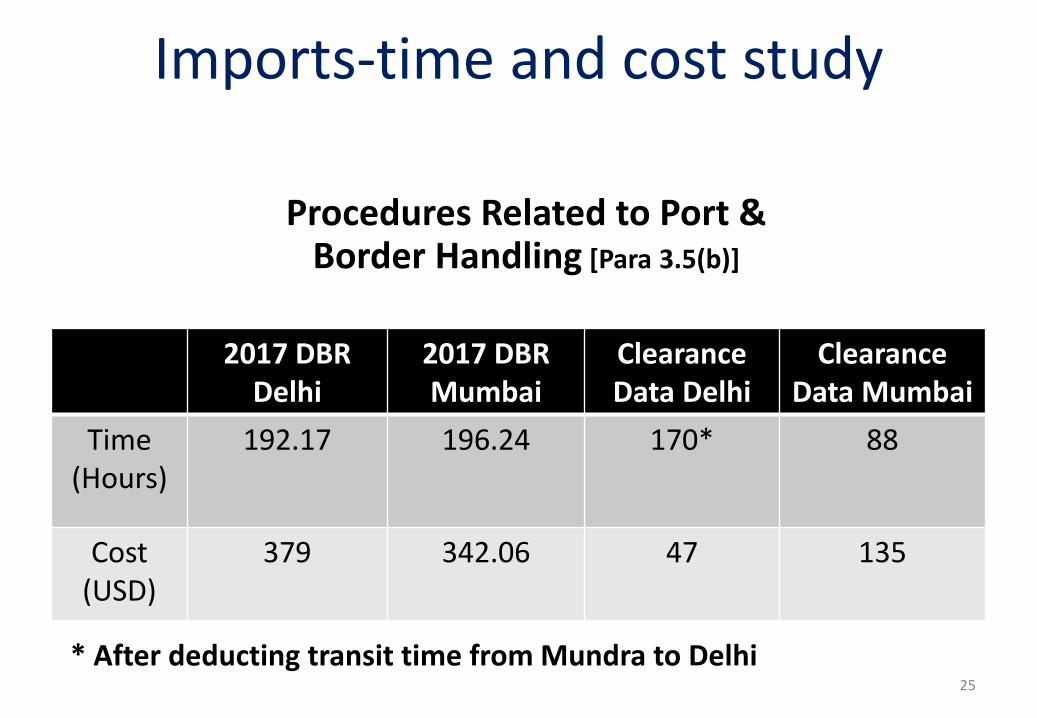
Imports-time and cost study
25
2017 DBR Delhi
2017 DBR Mumbai
Clearance Data Delhi
Clearance Data Mumbai
Time (Hours)
192.17 196.24 170* 88
Cost (USD)
379 342.06 47 135
Procedures Related to Port & Border Handling [Para 3.5(b)]
* After deducting transit time from Mundra to Delhi
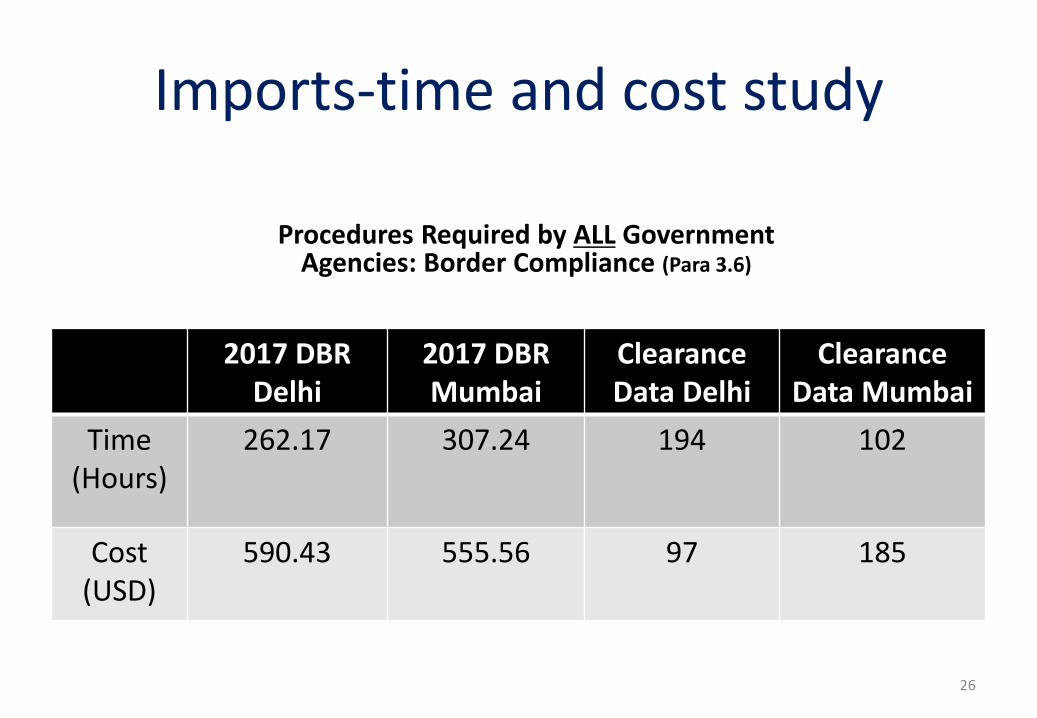
Imports-time and cost study
26
2017 DBR Delhi
2017 DBR Mumbai
Clearance Data Delhi
Clearance Data Mumbai
Time (Hours)
262.17 307.24 194 102
Cost (USD)
590.43 555.56 97 185
Procedures Required by ALL Government Agencies: Border Compliance (Para 3.6)
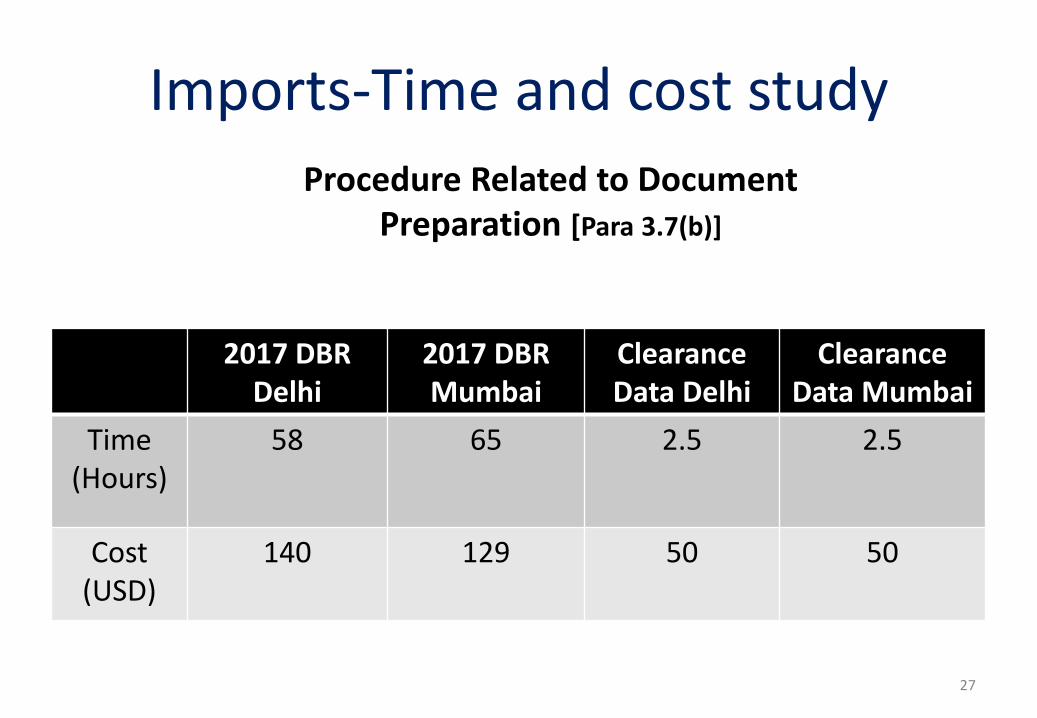
Imports-Time and cost study
Procedure Related to Document Preparation [Para 3.7(b)]
27
2017 DBR Delhi
2017 DBR Mumbai
Clearance Data Delhi
Clearance Data Mumbai
Time (Hours)
58 65 2.5 2.5
Cost (USD)
140 129 50 50

28
Concerns: Three structural parameters affect overall delays
and skew ranking – need to be factored in scoring
• Road vs. rail vs. sea
• Affects cargo
aggregation time • Trans-shipment vs.
gateway
• Affects container
handling and port
dwell time
• Direct port entry/
delivery vs. via CFS
• Mandatory CFS shifting
will result in extra
delays
Nature of freight at
border
Nature of port
Nature of evacuation
1
2
3
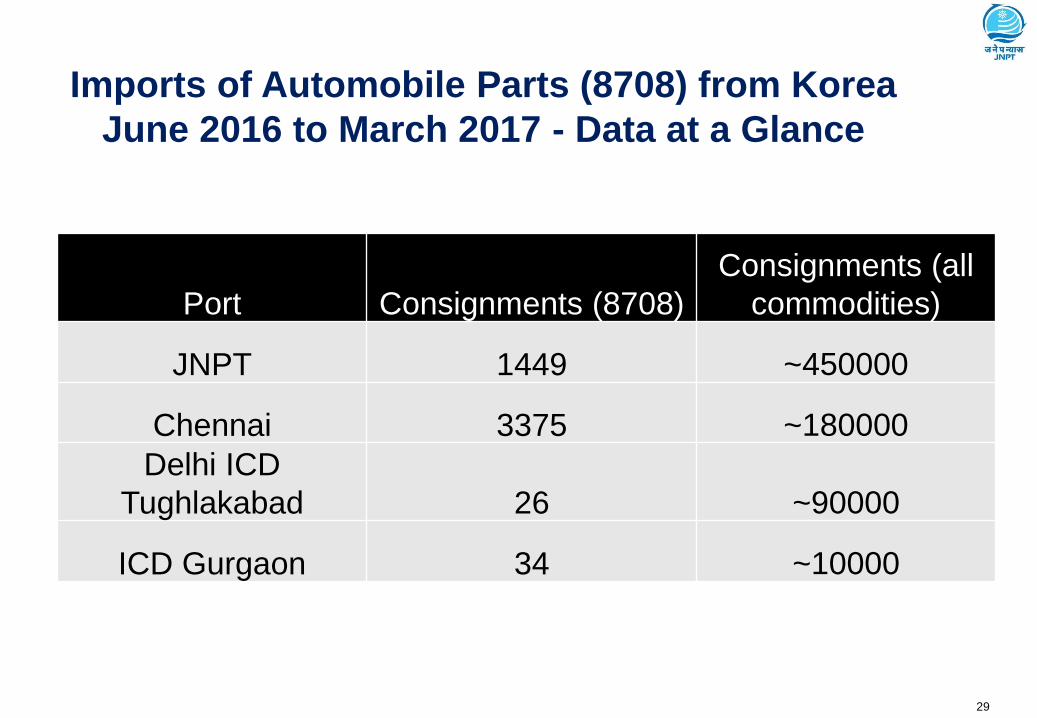
29
Port Consignments (8708)
Consignments (all
commodities)
JNPT 1449 ~450000
Chennai 3375 ~180000
Delhi ICD
Tughlakabad 26 ~90000
ICD Gurgaon 34 ~10000
Imports of Automobile Parts (8708) from Korea
June 2016 to March 2017 - Data at a Glance
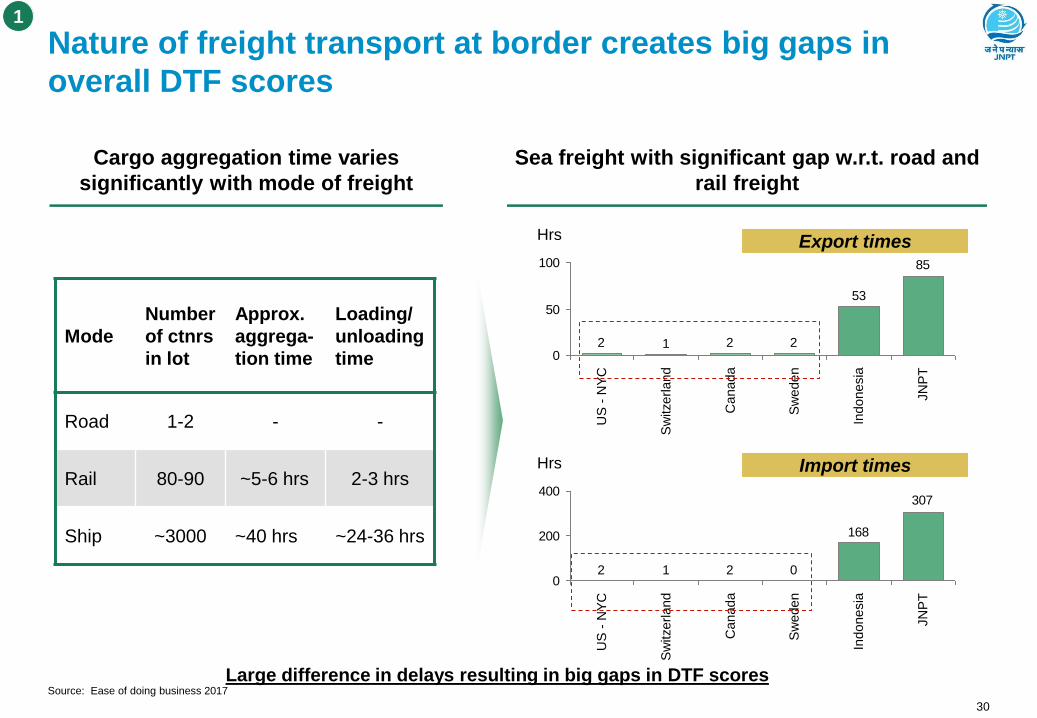
30
Nature of freight transport at border creates big gaps in
overall DTF scores
1
Cargo aggregation time varies
significantly with mode of freight
Sea freight with significant gap w.r.t. road and
rail freight
Mode
Number
of ctnrs
in lot
Approx.
aggrega-
tion time
Loading/
unloading
time
Road 1-2 - -
Rail 80-90 ~5-6 hrs 2-3 hrs
Ship ~3000 ~40 hrs ~24-36 hrs
85
53
22120
50
100
Canada
JN
PT
Sw
itzerland
US
- N
YC
Hrs
Sw
eden
Indonesia
307
168
02120
200
400
Canada
JN
PT
Sw
itzerland
US
- N
YC
Hrs
Sw
eden
Indonesia
Import times
Export times
Large difference in delays resulting in big gaps in DTF scores Source: Ease of doing business 2017

31
High trans-shipment volumes can significantly reduce delays
RS 17.Apr.17:
Graph
Show a bar graph with different
ports – Singapore, Shanghai,
Busan vs. JNPT, Japan...
Show for export
2
Major trans-shipment hubs show
significantly low export border ctrl time Trans-shipment can result in lower
delays
Global trans-shipment hubs may trans-ship
their major trade commodity also
Not separating trans-shipment cargo from
gateway cargo can result in lower delays
Typically
~12 hrs > 24 hrs
85
48
23
12
0
20
40
60
80
100
Hrs
JNPT Surabaya Shanghai Singapore
Source: Ease of doing business 2017
85% 50% 0% 0%
Trans-
shipment
%
Port
Hinter
land
Port
+ Customs
clearance and cargo
aggregation time
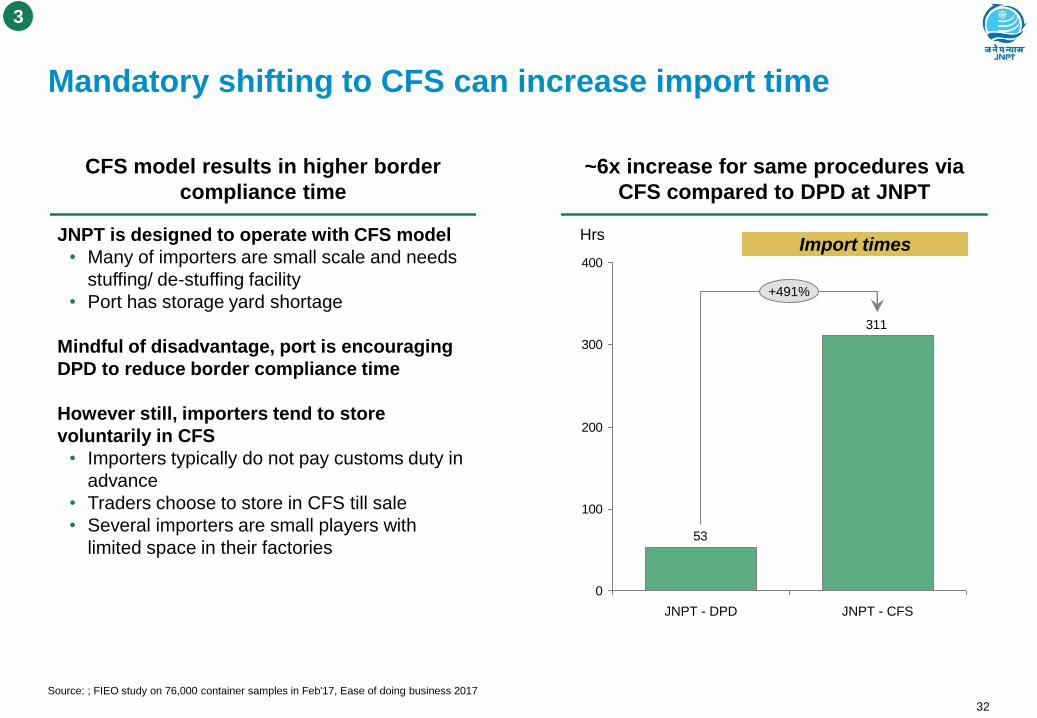
32
Mandatory shifting to CFS can increase import time
3
CFS model results in higher border
compliance time
JNPT is designed to operate with CFS model
• Many of importers are small scale and needs
stuffing/ de-stuffing facility
• Port has storage yard shortage
Mindful of disadvantage, port is encouraging
DPD to reduce border compliance time
However still, importers tend to store
voluntarily in CFS
• Importers typically do not pay customs duty in
advance
• Traders choose to store in CFS till sale
• Several importers are small players with
limited space in their factories
~6x increase for same procedures via
CFS compared to DPD at JNPT
311
53
0
100
200
300
400
Hrs
JNPT - DPD JNPT - CFS
+491%
Import times
Source: ; FIEO study on 76,000 container samples in Feb'17, Ease of doing business 2017

33
Import time – Border
control
Export time – Border
control
Import cost – Border
control
Import/ export time –
Document control
Reduction in queuing time by putting up dedicated parking lots. Average
saving is 45 minutes
Cost reduction for export container (DPE) from USD 60 to USD 1 by
facilitating customs processing in parking lot
Reduced container handling time through multiple initiatives. Reduction
in terminal time for Import by 14.19 Hrs & Export by 10 Hrs YoY.
Cost reduction from USD 120-330 to USD 25-35 for import container
under DPD
67.14% of import declarations were cleared in less than 8 hrs
87% import declarations are being cleared in less than 2 days
I
II
III
IV
V
VI
Export cost – Border
control
14.34% in less than 24 hours and 5.75% with in less than 2 days VII
Impact of Reforms

Publicity Assistance Communication Education
Strategy for Service Delivery - Keep PACE with all Stakeholders
Shift in perception about Taxpayer to promote voluntary compliance
Control based approach
Trust based approach
Compliant Fence sitters Non - Compliant
Focus on Delivery of Services
35
THANK YOU


![Regional Report on Ozone Observation Ozone Observation [ RA-II: Asia ] Regional Report on Ozone Observation Ozone Observation [ RA-II: Asia ] Hidehiko](https://img.pdfslide.us/doc/110x75/56649f115503460f94c23df0/regional-report-on-ozone-observation-ozone-observation-ra-ii-asia-regional.jpg)