Embed Size (px)
Citation preview

Presentation to:
Virginia Government Finance Officers’ Association
“Virginia College Savings Plan – Program Overview and a CFO’s Viewof Surviving Recent Market Challenges”
Gary Ometer, CPA, Chief Financial OfficerJune 8, 2011
Presented by:

VGFOA – June 8, 2011 2
Presentation Goals
State of Saving for College
529 Plans
Virginia College Savings Plan
Regulatory Challenges

VGFOA – June 8, 2011 3
State of Saving for College

VGFOA – June 8, 2011 4
Tuition and Fee Increases
Source: The College Board, Trends in College Pricing 2010

VGFOA – June 8, 2011 5
Cost of College
Source: The College Board, Trends in College Pricing 2010

VGFOA – June 8, 2011 6
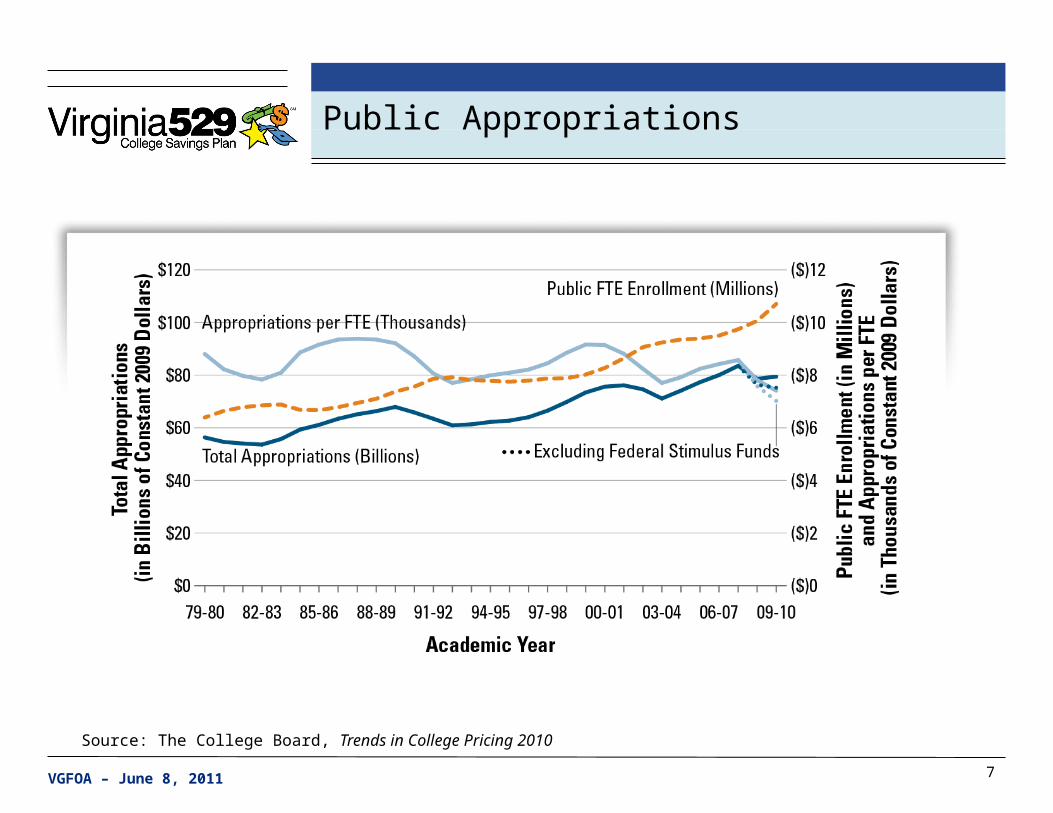
Public Appropriations
Source: The College Board, Trends in College Pricing 2010
Annual Percentage Changes in State Appropriations for Higher Education per Full-Time Equivalent (FTE) Student and in Tuition and Fees at Public Four-Year Institutions in Constant 2009 Dollars, 1979-80 to 2009-10
VGFOA – June 8, 2011 7
Public Appropriations
Source: The College Board, Trends in College Pricing 2010

VGFOA – June 8, 2011 8
Saving For Funding College
Funding Sources
Savings (529 Plans and other savings vehicles)
Scholarships (academic and need-based)
Grants (federal and state)
Loans (federal, state, school)
Cash-on-hand (parents, students)
Scholarships (athletic)

VGFOA – June 8, 2011 9
How Much Have You Saved for College?
Source: College Savings Foundation – 2010 Survey of Parents

VGFOA – June 8, 2011 10
How Do Parents Plan on Funding College?
Source: College Savings Foundation - 2010 Survey of Parents

VGFOA – June 8, 2011 11
Primary Savings Vehicle
Source: College Savings Foundation - 2008 Parents Survey
VGFOA – June 8, 2011 12
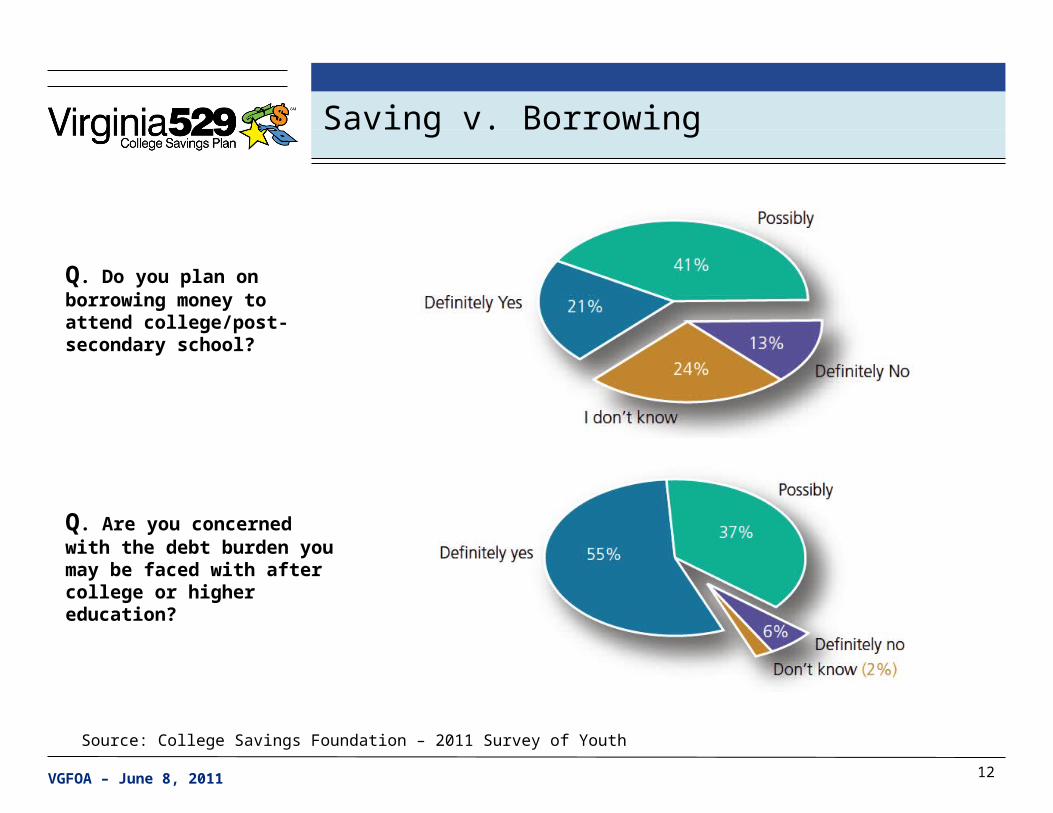
Saving v. Borrowing
Q. Do you plan on borrowing money to attend college/post-secondary school?
Q. Are you concerned with the debt burden you may be faced with after college or higher education?
Source: College Savings Foundation – 2011 Survey of Youth

VGFOA – June 8, 2011 13
Saving v. Borrowing (cont.)
Source: College Savings Foundation – 2010 Survey of Parents

VGFOA – June 8, 2011 14
529 Plans

VGFOA – June 8, 2011 15
What is a 529 Plan?
Education savings plan operated by a state or educational institution designed to help families set aside funds for future college costs
Section 529 Internal Revenue Code, enacted in 1996
Plans can be used to meet qualified higher education expenses at eligible educational institutions
Tax advantaged
Two types:
• Prepaid plans
• Savings plans

VGFOA – June 8, 2011 16
Growth of the National 529 Market – January 2000 - June 2010
• Beginning in 2001, participation in savings plans far outpaced prepaid plans
• Savings plan assets decreased more dramatically than prepaid assets in 2008 with similar increases in 2009
• Asset and account growth across remained relatively unchanged between year-end 2009 and mid-year 2010
Source: College Savings Plan Network (“CSPN”); data as of June 30, 2010
YE 2000
YE 2001
YE 2002
YE 2003
YE 2004
YE 2005
YE 2006
YE 2007
YE 2008
YE 2009
Q2 2010
$0
$35,000,000,000
$70,000,000,000
$105,000,000,000
$140,000,000,000National 529 Assets 2000 - June 2010
Prepaid Savings
($ B
illio
ns)
YE 2000
YE 2001
YE 2002
YE 2003
YE 2004
YE 2005
YE 2006
YE 2007
YE 2008
YE 2009
Q2 2010
0
3,000,000
6,000,000
9,000,000
12,000,000
National 529 Accounts 2000 - June 2010
Prepaid Savings
Acc
ount
s (0
00s)

VGFOA – June 8, 2011 17
Benefits of 529 Plans
Federal tax benefits – earnings grow free from federal tax, and withdrawals for qualified higher education expenses are likewise free from federal tax
State tax benefits – Virginia 529 plan account owners with Virginia taxable income are eligible for up to a $4,000 tax deduction per contract or account with an unlimited carryforward – other states’ plans may also provide state tax benefits
No income limits – no calculations required to determine whether you may contribute
Virginia has a $350,000 aggregate limit per beneficiary
Donor retains control of funds – account owner rather than beneficiary retains control of account assets and determines amount and timing of distributions (VPEP distributions paid directly to college)

VGFOA – June 8, 2011 18
Benefits of 529 Plans (cont.)
You may open an account for your child, grandchild, spouse, friend or yourself
Plan assets may be used to pay qualified higher education expenses at any eligible educational institution in the world – expenses include tuition, room and board, books, supplies and certain fees (VPEP covers tuition and mandatory fees only)
Flexible – account owners may change beneficiaries without penalty provided the new beneficiary is a member of the previous beneficiary’s immediate family
Rollovers – Can roll from one program to another
Low maintenance – Virginia accounts may be set up with a variety of payment plans (depending on VPEP, VEST, etc.) and Virginia savings plans offer a number of investment options

VGFOA – June 8, 2011 19
Virginia College Savings Plan
VGFOA – June 8, 2011 20
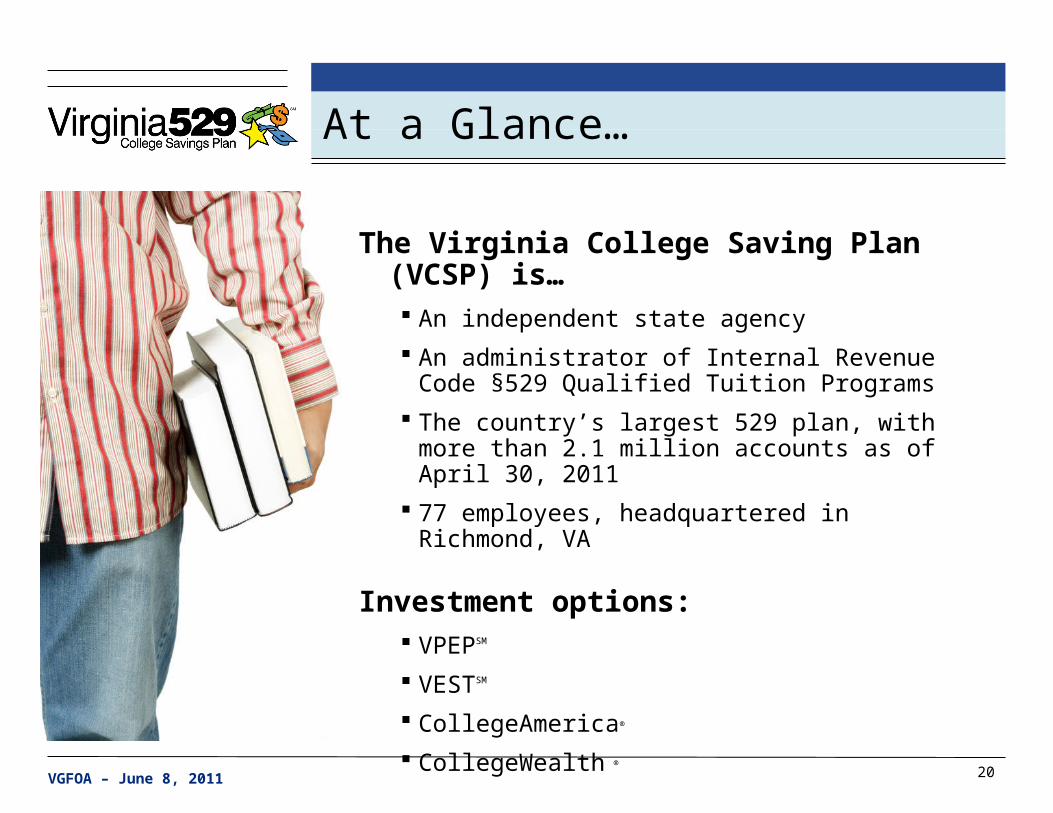
At a Glance…
The Virginia College Saving Plan (VCSP) is… An independent state agency
An administrator of Internal Revenue Code §529 Qualified Tuition Programs
The country’s largest 529 plan, with more than 2.1 million accounts as of April 30, 2011
77 employees, headquartered in Richmond, VA
Investment options: VPEPSM
VESTSM
CollegeAmerica®
CollegeWealth ®

VGFOA – June 8, 2011 21
Our Programs
Virginia Prepaid Education Program (VPEP) - allows families to purchase contracts for future tuition and mandatory fees at Virginia public colleges and universities. Opened in 1996.
Virginia Education Savings Trust (VEST) - a direct-sold savings program offering age-based evolving portfolios and static investment portfolios featuring Vanguard and other mutual funds. Opened in 1999.
CollegeAmerica - a broker-sold savings program offering a wide selection of the American Funds portfolios, one of the largest mutual fund families in the country. Opened in 2002.
CollegeWealth - FDIC-insured 529 savings accounts offered through participating banks including Union First Market Bank and BB&T. Opened in 2007.

VGFOA – June 8, 2011 22
VPEP Assets and Account Growth
FYE 19
97
FYE 19
98
FYE 19
99
FYE 20
00
FYE 20
01
FYE 20
02
FYE 20
03
FYE 20
04
FYE 20
05
FYE 20
06
FYE 20
07
FYE 20
08
FYE 20
09
FYE 20
10
3/31
/201
1
$0
$200,000,000
$400,000,000
$600,000,000
$800,000,000
$1,000,000,000
$1,200,000,000
$1,400,000,000
$1,600,000,000
$1,800,000,000
$2,000,000,000
0
10,000
20,000
30,000
40,000
50,000
60,000
70,000
80,000
VPEP Assets Under Management and Total Accounts
Balances
Accounts

VGFOA – June 8, 2011 23
VEST Assets and Account Growth
FYE 20
00
FYE 20
01
FYE 20
02
FYE 20
03
FYE 20
04
FYE 20
05
FYE 20
06
FYE 20
07
FYE 20
08
FYE 20
09
FYE 20
10
3/31
/201
1
$0
$200,000,000
$400,000,000
$600,000,000
$800,000,000
$1,000,000,000
$1,200,000,000
$1,400,000,000
$1,600,000,000
$1,800,000,000
0
20,000
40,000
60,000
80,000
100,000
120,000
140,000
160,000
VEST Assets Under Management and Total Accounts
Balances
Accounts

VGFOA – June 8, 2011 24
Program Statistics
Distributions began in 2000
Over $681 million distributed through 6/30/10 (VPEP and VEST)
VPEP Student Attendance – 2010 Fall Semester
• 67% in-state public four-year institutions*
• 13% community college
• 6% in-state private
• 14% at more than 460 out-of-state schools
* 64% of students (43% overall) attending in-state public institutions attend University of Virginia, Virginia Tech, William & Mary, James Madison and Virginia Commonwealth University

VGFOA – June 8, 2011 25
Assets Under Management
Number of Accounts Assets Under Management
Program June 30, 2009 June 30, 2010 April 30, 2011 June 30, 2009 June 30, 2010 April 30, 2011
VPEP 71,847 71,373 71,415 $1,335,093,400 $1,613,149,325 $1,952,551,463
VEST 115,957 129,415 141,402 $1,056,274,799 $1,346,385,956 $1,768,049,095
CollegeAmerica 1,807,211 1,893,271 1,921,918 $21,115,858,233 $25,021,126,526 $32,671,015,902
CollegeWealth 601 2,760 5,034 $4,986,631 $13,911,187 $23,282,280
Total 1,995,616 2,096,819 2,139,769 $23,512,213,064 $27,994,572,994 $36,414,898,741

VGFOA – June 8, 2011 26
VPEP Assets Under Management
Market Value by Asset Class as of April 30, 2011
Domestic Equity17.7%
International Equity18.6%
Alternatives13.0%
Core Fixed Income23.3%
Non-Core Fixed Income24.5%
Cash2.8%

VGFOA – June 8, 2011 27
2007-2009 Financial Meltdown
Causes Domestically:
Poor lending decisions
Poor borrowing decisions
Excessive leverage (individual / corporate / government)
Lax risk management
Misaligned incentives
Antiquated and dysfunctional regulatory framework
Predatory rather than productive bankers

VGFOA – June 8, 2011 28
VPEP – New Target Asset Allocation
In 2008 recognized that the VPEP portfolio volatility (risk) was not generating returns commensurate with volatility
Desire to review VPEP’s long-term expected liabilities and cash flows versus the assets invested under VPEP
Asset Liability Modeling study in 2009 with goal of finding optimal balance between investment risk and long-term cost
Report completed and presented by VCSP’s investment consultant and actuary in June 2009
Investment Advisory Committee and Board approved new target asset allocation
Decreased: Domestic equity and core fixed income
Increased: Emerging market equity and high yield fixed income
Added: Emerging market debt and alternatives

VGFOA – June 8, 2011 29
VPEP – New Target Asset Allocation (cont.)
Domestic Equity44.1%
International Equity11.0%
Core Fixed Income35.2%
Non Core Fixed In-
come5.2%
Cash4.6%
Asset Allocation as of June 30, 2008
Domestic Equity17.7%
Interna-tional Equity18.6%
Alterna-tives
13.0%
Core Fixed Income23.3%
Non-Core Fixed In-
come24.5%
Cash2.8%
Asset Allocation as of April 30, 2011

VGFOA – June 8, 2011 30
VPEP – Transition to Target Asset Allocation
Domestic Equity15.0%
International Equity17.5%
Alternatives15.0%
Core Fixed Income25.0%
Non Core Fixed Income
27.5%
Target Asset Allocation
Domestic Equity17.7%
Interna-tional Equity18.6%
Alterna-tives
13.0%
Core Fixed Income23.3%
Non-Core Fixed In-
come24.5%
Cash2.8%
Asset Allocation as of April 30, 2011
VGFOA – June 8, 2011 31
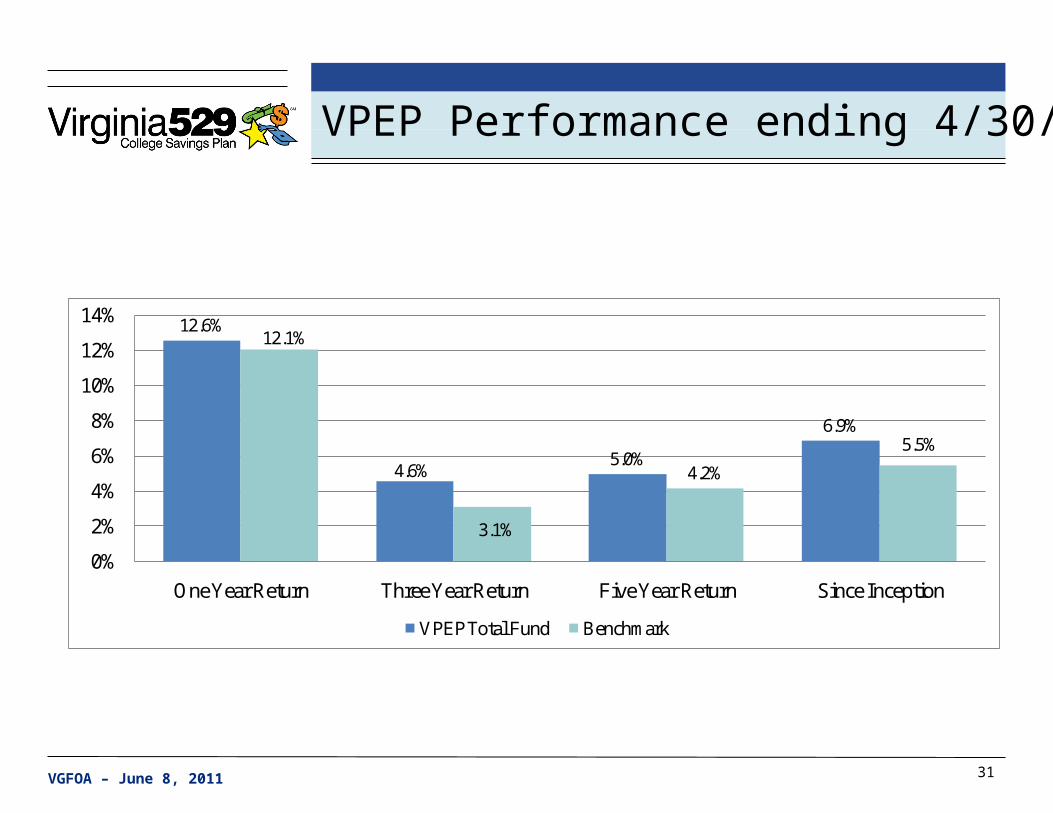
12.6%
4.6%5.0%
6.9%
12.1%
3.1%
4.2%
5.5%
0%
2%
4%
6%
8%
10%
12%
14%
One Year Return Three Year Return Five Year Return Since Inception
VPEP Total Fund Benchmark
VPEP Performance ending 4/30/2011

VGFOA – June 8, 2011 32
VPEP Annual Returns Since Inception
10.4%7.6% 7.6%
1.4%
-1.4%
5.6%
14.9%
10.1% 9.8%
14.6%
-4.3%
-16.3%
18.7% 20.1%
-20%-15%-10%
-5%0%5%
10%15%20%25%
One Year Returns by Fiscal Year
*2011 performance through 4/30/2011

VGFOA – June 8, 2011 33
Investment Return Assumptions
Year Return
1996 – 2000 8.0%
2001 7.5%
2002 7.0%
2003 6.75%
2004 - 2010 7.0%

VGFOA – June 8, 2011 34
VPEP Actuarial Tuition Increase Assumptions*
Universities Community Colleges
Academic YearJune 30, 2010
assumptionPrior
assumptionJune 30, 2010
assumptionPrior
assumption
Fall 2011 10.00% 8.50% 9.50% 7.50%
Fall 2012 10.00% 7.50% 8.50% 7.50%
Fall 2013 forward 7.50% 7.50% 7.50% 7.50%
*Assumption includes tuition and all mandatory fees (both education and general fees and non-education and general fees)
VGFOA – June 8, 2011 35
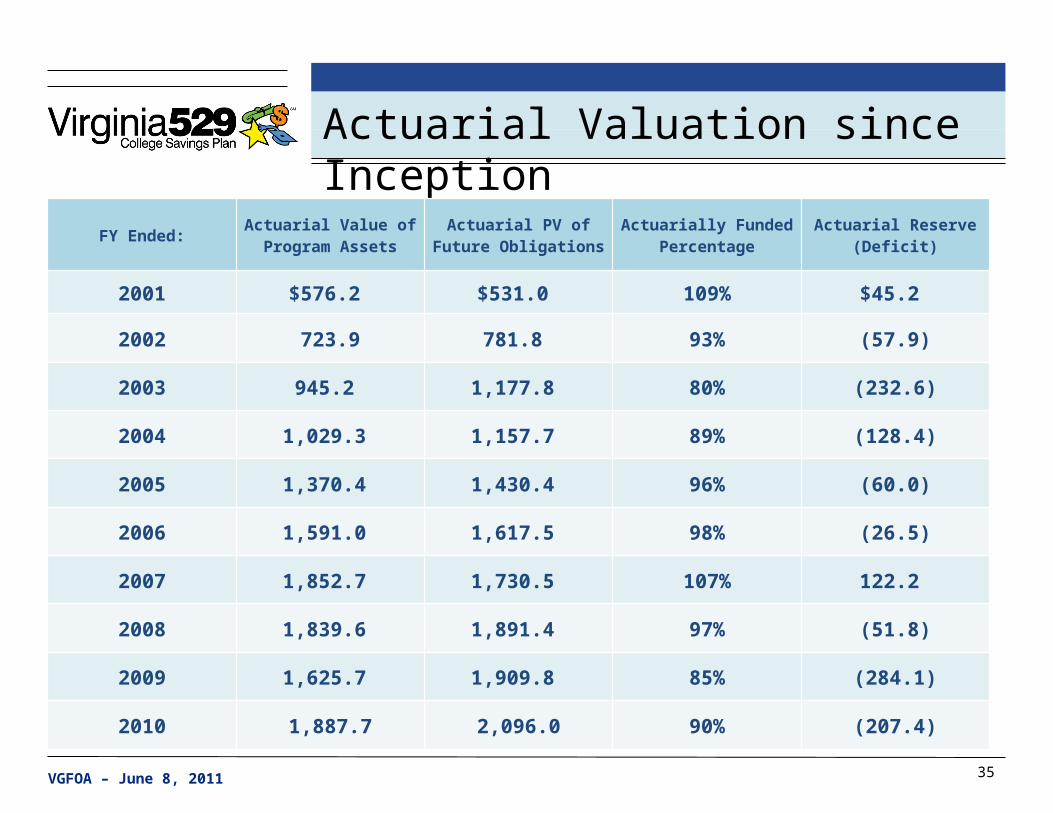
Actuarial Valuation since Inception
FY Ended:Actuarial Value of
Program AssetsActuarial PV of Future
ObligationsActuarially Funded
PercentageActuarial Reserve (Deficit)
2001 $576.2 $531.0 109% $45.2
2002 723.9 781.8 93% (57.9)
2003 945.2 1,177.8 80% (232.6)
2004 1,029.3 1,157.7 89% (128.4)
2005 1,370.4 1,430.4 96% (60.0)
2006 1,591.0 1,617.5 98% (26.5)
2007 1,852.7 1,730.5 107% 122.2
2008 1,839.6 1,891.4 97% (51.8)
2009 1,625.7 1,909.8 85% (284.1)
2010 1,887.7 2,096.0 90% (207.4)

VGFOA – June 8, 2011 36
Historical Funded Status and Actuarial Reserve
Fun
ded
Per
cent
age
Act
uari
al R
eser
ve
2001
2002
2003
2004
2005
2006
2007
2008
2009
2010
0%
20%
40%
60%
80%
100%
120%
140%
($300)
($200)
($100)
$0
$100
$200
$300
Funded Percentage Actuarial Reserve

VGFOA – June 8, 2011 37
Regulatory Challenges

VGFOA – June 8, 2011 38
Government Employees
“You give 100 percent in the first half of the game, and if that isn’t enough in the second half you give what’s left.”
Yogi Berra

VGFOA – June 8, 2011 39
Recent Regulatory Changes / Announcements
•Federal Trade Commission Red Flags Rule
•Dodd-Frank Wall Street Reform and Consumer Protection Act
•Municipal Securities Rulemaking Board (MSRB)
•Securities and Exchange Commission (SEC)
•HR 529
VGFOA – June 8, 2011 40
9001 Arboretum ParkwayRichmond, Virginia 23236Toll Free:1-888-567-0540On the web:Virginia529.com