Embed Size (px)
Citation preview

September 21, 2007
Danyal SattarAnalyst, Public Finance
David SuttonManaging Director, Public Finance
Presentation to University of Florida Masters In Finance Program
A Brief Overview of Public Finance Investment Banking

2
Table of Contents
1. Public Finance Investment Banking Overview I
2. Raymond James Public Finance Overview II
3. CaseStudy1 – Parking Authority III
4. Case Study 2 – Investment of Proceeds IV
Analyst Roles and Responsibilities Appendix A
Raymond James Information Appendix B

Section I: Public Finance Investment Banking Overview

4
Scope of Public Finance Investment Banking
DUE DILIGENCE PHASE
Step 2:
Discuss needs &
objectives with
clients
Step 3:
Conduct
analyses of
various potential
solutions
Step 1:
Develop
understanding of
clients/needs
situations
Step 4:
Review viable
solutions with
client to
determine
course of action
Step 6:
Market Bonds
Step 7:
Price Bonds
Step 5:
Structure Bond
Transaction &
Legal
Documents
Step 8:
Invest Proceeds
TRANSACTIONAL PHASE
Step 3:
During this step,
determine if swaps
are a viable
alternative to
lower cost of
capital

5
What Types of Entities Issue Tax-Exempt Bonds?
States
Cities
Counties
Special Service Districts/TIF’s
501-c-3 Healthcare Institutions (Acute Care and Senior Living)
Higher Educational Institutions (Public and Private Universities)
K-12 School Districts (Public and Private)
Utility Systems
Transportation Authorities (Local and Regional)
Housing Authorities (State and Local)

6
Project Finance
Water and Sewer Utility
Toll Roads
Airports
Mass Transit
Arena Finance
Securitization/Asset Backed
Personal Income Tax
Sales Tax
Gas Tax
Tobacco Settlement
HAS “Corporate Finance
Aspects”
Hospitals
Utilities
Special Situations
Strategic Business Advisors
Mergers and Acquisitions
Asset Liability Management
Real Estate Financing
…Numerous Others
What Types of Revenues are Pledged?

7
Municipal Market Characteristics
Over the last 10 years the volume of negotiated deals has increased with many predicting this year to be a record year
Variable rate volume has also increased significantly
Derivatives utilization greatly increased
Over-the-Counter Interest Rate
Derivatives Outstanding
$0
$50,000
$100,000
$150,000
$200,000
$250,000
$300,000
$350,000
1987 1989 1991 1993 1995 1997 1999 2001 2003 2005
No
tio
nal
(b
illi
on
s)
Negotiated vs Competitive Volume
0
50
100
150
200
250
300
350
1997 1998 1999 2000 2001 2002 2003 2004 2005 2006
Vo
lum
e ($
Bill
ion
s)
Negotiated Competitive
Variable Rate Volume
0
20
40
60
80
100
1997 1998 1999 2000 2001 2002 2003 2004 2005 2006
Vo
lum
e ($
Bill
ion
s)
Variable RateSource: Bond Buyer

8
Who are the Buyers of Municipal Bonds?
In addition to the High-Net worth investors who benefit from the
tax-exempt status of municipal bonds, the investor universe is
dynamic and has changed immensely in recent years
Property & Casualty Companies
Mutual Funds
Trust Companies
Arbitrage Accounts
Foreign Investors
“Cross-over” Buyers
Retail

9
Measuring Inefficiency in the Municipal Market The chart to the right indicates that the market
places very little value on tax-exemption given that the ratio of the tax-exempt yield to the taxable yield exceeds 90% during years 15 to 30.
The market places the value of tax-exemption at less than 10% in those years.
The “expected value” of a municipal bond equals 100% less the tax rate.
An investor in the 35% tax bracket would view a municipal bond efficiently priced at 65% of the same maturity Treasury (1.00 – 0.35 = 0.65)
As each investor has a specific tax bracket, a single bond price may be considered efficient for certain tax brackets while inefficient for other tax brackets.
This implies that yields on municipal bonds are perhaps higher than warranted given expectations of future marginal tax rates.
Inefficiency in the fixed rate bond market enables the Muni Swap Market to potentially generate a lower all-in cost of borrowing.
0%
20%
40%
60%
80%
100%
2008
2010
2012
2014
2016
2018
2020
2022
2024
2026
2028
2030
2032
2034
2036
Imp
lied
"R
atio
" o
f T
ax-E
xem
pti
on
Tax Exempt Ratio % of Treasuries Implied Value of Tax Exemption
Value of Tax Exemption w/35% Tax Rate vs Implied Value of Tax Exemption
0.00%
5.00%
10.00%
15.00%
20.00%
25.00%
30.00%
35.00%
40.00%
2008
2010
2012
2014
2016
2018
2020
2022
2024
2026
2028
2030
2032
2034
2036
1 m
inus
"Rat
ios"
Implied Value of Tax Exemption Value of Tax-exemption w/ 35% Tax Rate
Market Rates as of 9/14/2007
10
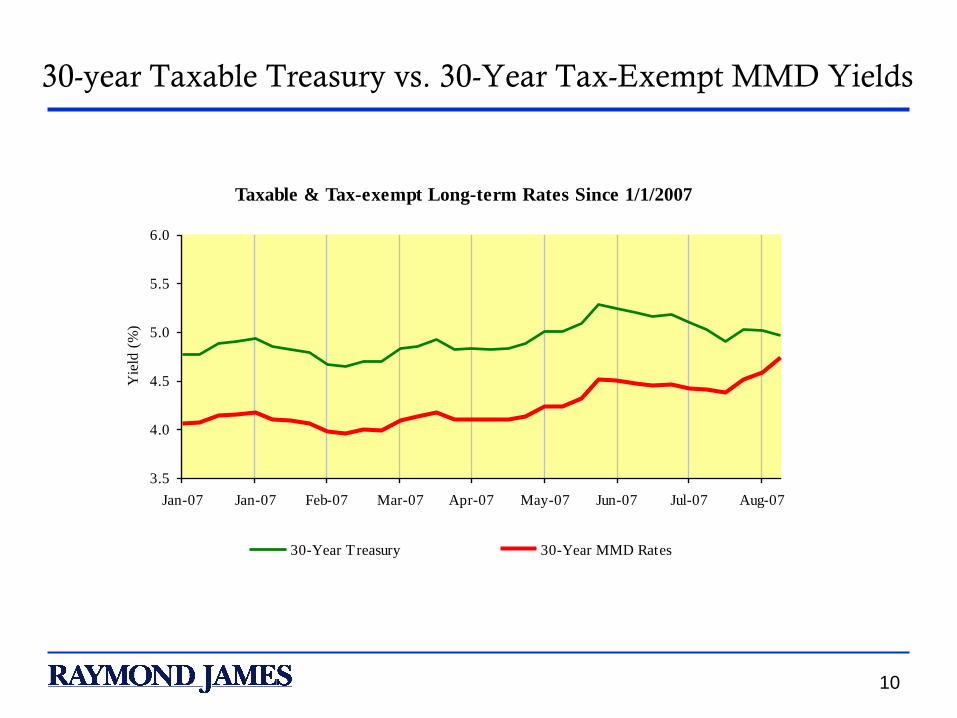
30-year Taxable Treasury vs. 30-Year Tax-Exempt MMD Yields
Taxable & Tax-exempt Long-term Rates Since 1/1/2007
3.5
4.0
4.5
5.0
5.5
6.0
Jan-07 Jan-07 Feb-07 Mar-07 Apr-07 May-07 Jun-07 Jul-07 Aug-07
Yie
ld (
%)
30-Year Treasury 30-Year MMD Rates

Section II: How Does Raymond James Participate
in The Public Finance Marketplace?

12
10 public finance
offices nationwide
National
resources,
regional expertise
Public Finance Offices

13
Wide range of
experience and
expertise
Full service
investment
banking
Public
Utility
Taxable
Financings
Project
Finance
TransportationHousing
Health Care
RJ Public
Finance
General
Obligation
Other
Revenue
Education
Public Finance Expertise

Over the last 10
years, Raymond
James has
participated in
over 1,800
transactions for
total par amount
in excess of $299
billion.
Public Finance Transactional Experience
Decade of Growth
Year # of Issues Total Par Amount # of Issues Total Par Amount
1997 40 $1,452.60 104 $7,371.90
1998 25 $550.80 172 $20,726.80
1999 39 $2,232.20 130 $12,907.80
2000 16 $162.60 109 $16,085.60
2001 33 $1,430.10 145 $17,741.10
2002 26 $584.50 177 $42,492.60
2003 25 $1,353.90 182 $45,630.60
2004 30 $1,546.70 189 $50,894.00
2005 37 $1,817.80 158 $39,146.50
2006 38 $1,437.30 197 $34,746.70
Total 309 $12,568.50 1563 $287,743.60
Senior Managed Deals Co-Managed Deals

15
5,200 Financial
Advisors located
in 2,200 offices
nation-wide
Extensive
Municipal
Securities Retail
Network,
supported by 15
Municipal Retail
Traders
Washington
40
Wyoming11
Oklahoma18
Kansas30
Texas125
Kentucky25
Arkansas22
Missouri38
WestVirginia
6
Tennessee54
Maine9
Ohio91
Wisconsin36
Louisiana25
Mississippi17
Alabama20
Georgia55
New Mexico17Arizona
27
Alaska1
Utah
14
Colorado58
Nebraska22
Iowa17
South Dakota
12
Minnesota34
North Dakota5
Nevada7
California130
Idaho9
Oregon
24
Montana17
Illinois99 Indiana
43
Virginia
39
Pennsylvania63
Hawaii5
Kansas29 Kentucky
35Missouri40
Michigan111
Tennessee68
North Carolina78
Maine
Connecticut - 23
New Jersey - 43
Mar yland - 39Washington DC - 1
Delaware - 3
Rhode Island - 2
Massachusetts22
New Hampshire - 5
Vermont - 4
New York - 67
Wisconsin37
Mississippi25
Alabama23
South Carolina - 45
Puerto Rico - 1
Georgia68
Alaska4
Nebraska20
Iowa16
South Dakota
15
Minnesota54
North Dakota7
Illinois119 Indiana
66
Virginia
48
Pennsylvania76
Hawaii3
Corporate Headquarters
Retail Sales Locations
Corporate Headquarters
Institutional Sales Offices
Retail Sales Locations
Florida254
Ohio110
WestVirginia
7
Distribution Capabilities

16
National Distribution
Taxable Distribution
Broad Investor Base
Ranked 3rd nationally by number of offices
5,200 sales representatives nationwide
10th largest municipal institutional sales force
Not limited to certain investor types
Coverage of entire spectrum of retail investors
Exclusive coverage of many mid-size institutions not
covered by other firms
Full-time dedicated taxable municipal bond trader
106 taxable sales professionals
Web site devoted solely to taxable municipal bonds
(www.rjtaxablemunis.com)
Providing
complete market
coverage to ensure
the lowest possible
interest cost
Total Market Access and Coverage

17
What Documentation is Required and What is the Process? Scope of Public Finance Investment Banking
Head of
Public Finance
Southeast
Group
Northeast
Group
Military
Housing
Group
Midwest
Group
Healthcare
Group
Housing
Group
Military
Housing
Group
Healthcare
Group
Head of Muni
Sales & Trading
Swap & Derivative
Desk
Quantitative Services
Group
David Sutton Danyal Sattar

18
What Documentation is Required and What is the Process? Structure of a Typical Group Within Public Finance
Senior
Banker
Senior
Banker
Senior
Banker
Senior
Banker
Junior
Banker
Junior
Banker
Analyst
Quantitative
Services Group
Managing Director
Director
Associate Director
VP
AVP
Associate
Experience
5 - ????? yrs
2 – 6 yrs
1 – 3 yrs

19
Quantitative Services Group
Highly analytical group that works with each Public Finance Group and with the Derivatives Desk on a day-to-day basis
How do we add value? Primarily through working with Senior Bankers to tailor solutions for their clients in
which structured products may provide either a lower cost of capital or greater amount of financial flexibility.
Secondary goal is to bring forth ideas that will add value and set us apart from the competition
We can be brought in anywhere from start to finish Examples:
Pre-issuance – Forward Starting Swaps & Rate Locks
Refunding – BMA & % of LIBOR Swaptions, Forward Bond Options, swap termination
Structuring – Swaps – BMA, % of LIBOR, CMS, Basis, Total Return
Post Issuance – GICs, REPOs, Laddered Portfolios
Our job requires the ability to enter into a project in many phases and be able to get “caught up” very quickly; Generally the PF “Answer Guys”
Additional duties include working on generally complicated deals, pricing & parallel pricing live deals that are entering the market, tracking refunding candidates, and generally modeling everything that could possibly need to be modeled!!!!
20
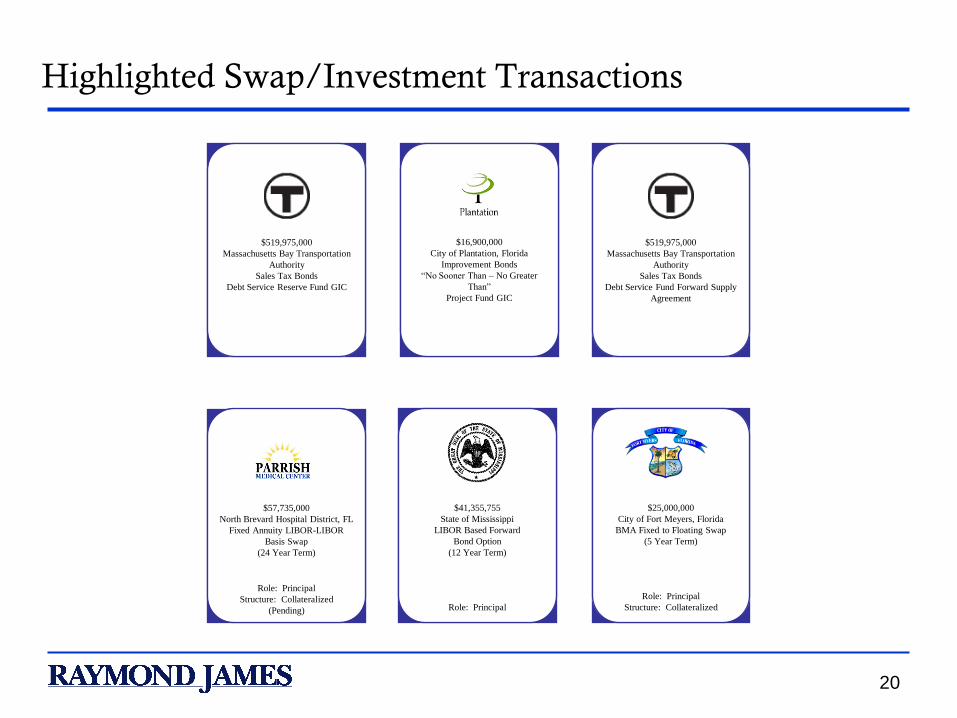
Highlighted Swap/Investment Transactions
$519,975,000
Massachusetts Bay Transportation
Authority
Sales Tax Bonds
Debt Service Reserve Fund GIC
$519,975,000
Massachusetts Bay Transportation
Authority
Sales Tax Bonds
Debt Service Fund Forward Supply
Agreement
$16,900,000
City of Plantation, Florida
Improvement Bonds
“No Sooner Than – No Greater
Than”
Project Fund GIC
$57,735,000
North Brevard Hospital District, FL
Fixed Annuity LIBOR-LIBOR
Basis Swap
(24 Year Term)
Role: Principal
Structure: Collateralized
(Pending)
$41,355,755
State of Mississippi
LIBOR Based Forward
Bond Option
(12 Year Term)
Role: Principal
$25,000,000
City of Fort Meyers, Florida
BMA Fixed to Floating Swap
(5 Year Term)
Role: Principal
Structure: Collateralized

Section III: Case Study: Parking Authority

22
Background
Midwest Group Banker tells us about an Authority that has outstanding bonds that could be
refunded. In addition, the Authority is open to using structured products as a potential solution.
Banker’s Duties:
The Banker knows that the Mayor of the City is a minority and is also leaving office soon.
Given the lame duck status of the Mayor, he could enhance his legacy by saving the
Authority millions of dollars at the tail-end of his administration. Ideally, the client is
highly incentivized.
It is also well-known that the Mayor is an advocate of working with Minority-run firms
The Banker reaches out to a Prestigious Minority-owned firm to align ourselves with in our
pitch
Quant Group Duties:
Mine the debt of the Issuer, find the candidates that would provide the highest savings
ASK QUESTIONS!!!!
Issuer-related – Variable vs. Fixed, are they allowed to do swaps, do they want to do
swaps (Many Issuers have staunch views against structured products), do they need
cash upfront or over time, what is their tolerance for risk, etc.
Market-related – Do traditional fixed-rate bonds make more sense or synthetic, what
structured products are we seeing getting done in the market, YIELD CURVE
ANALYSIS

23
Floating to Fixed Rate Swaps: Overview
Definition: An Issuer enters into a contract with a swap dealer (Counterparty) in which the Issuer
exchanges a variable rate obligation for a fixed rate obligation
Results:Applications:
Adjust variable/fixed rate mix as part of overall debt
management strategy
Lock in refinancing rates for debt that cannot be
refunded at the time of the swap
Lock in financing rates for new money debt that is
expected to be issued in the near future
Belief that interest rates are going to increase during
the period the swap is in place
Cash-flow Result
Step 1: Issuer pays the Counter-party a Fixed
Rate (-)
Step 2: Issuer receives a Variable Rate from the
Counterparty (+)
Step 3: Issuer pays the variable rate debt service
to bondholder (-)
Swap
Counterparty
Variable Rate
Bondholders
IssuerStructure: Variable
Fixed
Variable

24
Debt Outstanding
The Authority has Series 1999 Bonds outstanding of Parking Revenue Bonds that could produce savings:
The highlighted areas in green indicate callable bonds.
Date Principal Amount Coupon
Traditional Fixed -
MMD
BMA - Muni
Swap Curve
70% of LIBOR
9/1/2008 $3,360,000 4.800% 3.67% 3.81% 3.88%
9/1/2009 $3,525,000 4.875% 3.69% 3.70% 3.77%
9/1/2010 $3,715,000 5.500% 3.72% 3.74% 3.78%
9/1/2011 $3,925,000 5.500% 3.74% 3.81% 3.82%
9/1/2012 $4,150,000 5.625% 3.80% 3.87% 3.86%
9/1/2013 $4,390,000 5.625% 3.89% 3.94% 3.91%
9/1/2014 $4,645,000 5.625% 3.97% 4.00% 3.95%
9/1/2015 $4,910,000 5.625% 4.05% 4.06% 3.98%
9/1/2016 $5,195,000 5.625% 4.13% 4.11% 4.02%
9/1/2017 $5,495,000 5.625% 4.22% 4.17% 4.05%
9/1/2018 $5,815,000 5.625% 4.31% 4.21% 4.07%
9/1/2019 $6,150,000 5.625% 4.39% 4.25% 4.10%
9/1/2020 $6,495,000 5.250% 4.46% 4.29% 4.11%
9/1/2021 $6,845,000 5.250% 4.51% 4.33% 4.13%
9/1/2022 $7,215,000 5.250% 4.56% 4.37% 4.15%
9/1/2023 $7,605,000 5.250% 4.59% 4.40% 4.16%
9/1/2024 $8,010,000 5.250% 4.62% 4.42% 4.17%
9/1/2025 $8,445,000 5.250% 4.65% 4.44% 4.18%
9/1/2026 $8,900,000 5.250% 4.68% 4.46% 4.19%
9/1/2027 $9,380,000 5.250% 4.71% 4.48% 4.20%
9/1/2028 $9,885,000 5.250% 4.74% 4.49% 4.20%
9/1/2029 $10,420,000 5.250% 4.79% 4.50% 4.21%
Total $138,475,000
Series 1999 Current Yield Curves
The Yield Curves represent the
current yields offered in the
market today.
The structure that offers the
lowest cost of capital varies by
maturity across the maturity
spectrum.

25
Yield Curve Illustration
The highlighted areas in green indicate callable bonds.
Yield Curve Comparison
3.00%
4.00%
5.00%
1 4 7 10 13 16 19 22Years
Yie
lds
Traditional Fixed - MMD BMA - Muni Swap Curve 70% of LIBOR
Below is a graphic depiction of the yield curves.

26
Overview of the Municipal Market (Bond and Swap)
Borrowers today have the ability to utilize different markets to generate the lowest cost of
borrowing.
Tax-exempt organizations can execute the funding of their capital needs through either:
Traditional fixed rate tax-exempt bond market (the “Muni Cash Market” or “MCM”);
or,
Tax exempt swap market (the “Muni Swap Market” or “MSM”)
The two markets are distinctly separate, each with their own market fundamentals and short-
term supply/demand considerations.
The Muni Swap Market will change yields much faster than the Muni Cash Market as described
herein.
Both the Muni Cash and Muni Swap markets have certain characteristics and these markets can
also be contrasted to the benchmark U.S. Treasury and LIBOR swap markets which, as
described later, play an integral role in determining available funding levels in the two municipal
marketplaces.
27
Overview of the Municipal Market (Bond and Swap), cont.
Municipal (“Tax-Exempt”) Cash Market
Fewer Buyers: The municipal market has more limited demand compared to the Treasury market due to fewer investors seeking tax-exempt income than the “safety” of Treasury securities.
Lagging Price Movement: Municipal yields tend to “lag” the instantaneous yield/price changes in the Treasury market
The Treasury market is the price leader, the Muni market is the follower.
Distinctive Credits: The Municipal market literally has thousands of individual credits while U.S. Treasuries are homogeneously rated “AAA” due to the full faith and credit of the U.S. Government’s principal and interest payment pledge.
Visible/Invisible Supply: Only a portion of the Municipal market forward supply (future bond issues) are publicly known, or “visible.” Many issuers wait until the day bonds are to be sold to announce it.
Thus, supply may be understated which subsequently impacts the yield levels at which a borrower can sell bonds.
In the Treasury market, auction times and amounts are announced in advance.
Demand: Demand is partly a function of how many previously refunded bonds will be redeemed thereby freeing up cash for investors to re-invest – typically highest levels of cash become available in January and July.

28
Overview of the Municipal Market (Bond and Swap), cont.
Municipal (“Tax-Exempt”) Swap Market
Value Derivation: The municipal swap market derives its value from the U.S. Treasury, LIBOR swap and Ratio markets.
Market Participants: The Muni Swap Market has fewer market participants than the LIBOR swap market, similar to the Muni Cash Market having fewer participants than the U.S. Treasury Market.
Price Movement: Unlike the Muni Cash Market, the Muni Swap Market changes prices instantaneously and in approximately the same magnitude as both the U.S. Treasury and LIBOR Swap Markets.
Homogeneity of Credits: Muni Swap Market credits are non-homogeneous, a function of each issuer’s specific credit while the credits in the LIBOR swap market typically are large financial institutions with credit ratings ranging from the high “A” category to the low “AA” category. The homogeneity of the LIBOR swap market credits provides for a more constant credit environment.
Visibility of Supply: The LIBOR swap market is a very broad and deep marketplace, consisting of financial institutions such as insurance companies, large banks, broker/dealers, etc. The LIBOR yield curve is easily accessible through financial subscription services such as Bloomberg or Reuters and is monitored on a minute to minute basis by market participants.
The Muni Swap Market, conversely, has fewer market participants and its yield curve is implied from a combination of the U.S. Treasury curve, the LIBOR swap curve and the ratio market.
Demand: The Muni Swap Market is based upon issuers accessing capital and investors conducting hedging strategies.

29
Borrowing Cost Determination Flowchart
Determining if municipal
cash market (“MCM”)
is pricing bonds
efficiently
Compare
borrowing costs from
MCM to MSM
(yields maturity
by maturity)
If
yes
STOPIssue Fixed
Rate Bonds
Fixed Rate
Bond StructureMunicipal
Swap Structure(1)
If
no
(1) Muni Swap structure involves
the issuance of variable rate
bonds combined with a swap to a
fixed rate
Determine borrowing
cost available from
Muni swap market
(“MSM”) (1)
by
Objective: Answer the
question of can the Issuer
realize a borrowing cost
close to the average after-tax
yield of a taxable loan of
similar duration
Select Structure Providing
Lowest Cost of borrowing
Combination of Fixed
Rate Bonds and Muni
Swap Structure
in select maturities

30
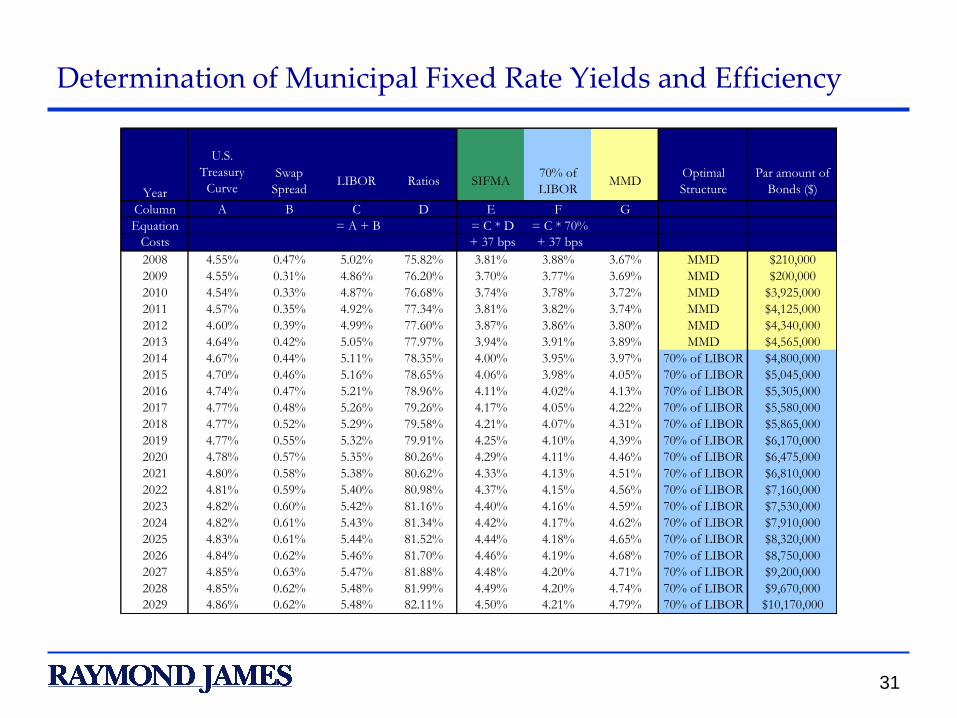
Determination of Municipal Fixed Rate Yields and Efficiency
Understanding how yields are derived is important in determining which structure will price most efficiently.
Municipal fixed rate bond yields are based upon the tax-exempt fixed rate bond market’s own supply and demand conditions.
The level of efficiency decreases further out on the yield curve as investors’ views of tax-exemption vary widely (potentially impacted by such events as a flat tax or a change in marginal tax rates)
Views of tax-exemption are exceptionally divergent at the 20 to 25-year maturities.
The table on the following page highlights the 5 steps which derive the Municipal Swap Curve:
Step 1: Identify the U.S. Treasury Curve
Step 2: Identify the “LIBOR Swap Spread”
Step 3: Derive the LIBOR Swap curve
Step 4: Identify the Actual ratio applicable to a given maturity
Step 5: multiply the LIBOR swap curve by the ratio
The Muni Swap Curve is the base swap rate to which all other costs need to be added in order to arrive at the Issuers al-in borrowing cost (Variable Rate Expenses)
Again, a swap structure involves the Issuer selling either variable rate or auction rate bonds and simultaneously entering into a fixed rate swap
31
Determination of Municipal Fixed Rate Yields and Efficiency
Year
Swap
SpreadLIBOR Ratios SIFMA
70% of
LIBORMMD
Optimal
Structure
Par amount of
Bonds ($)
Column A B C D E F G
Equation = A + B = C * D = C * 70%
Costs + 37 bps + 37 bps
2008 4.55% 0.47% 5.02% 75.82% 3.81% 3.88% 3.67% MMD $210,000
2009 4.55% 0.31% 4.86% 76.20% 3.70% 3.77% 3.69% MMD $200,000
2010 4.54% 0.33% 4.87% 76.68% 3.74% 3.78% 3.72% MMD $3,925,000
2011 4.57% 0.35% 4.92% 77.34% 3.81% 3.82% 3.74% MMD $4,125,000
2012 4.60% 0.39% 4.99% 77.60% 3.87% 3.86% 3.80% MMD $4,340,000
2013 4.64% 0.42% 5.05% 77.97% 3.94% 3.91% 3.89% MMD $4,565,000
2014 4.67% 0.44% 5.11% 78.35% 4.00% 3.95% 3.97% 70% of LIBOR $4,800,000
2015 4.70% 0.46% 5.16% 78.65% 4.06% 3.98% 4.05% 70% of LIBOR $5,045,000
2016 4.74% 0.47% 5.21% 78.96% 4.11% 4.02% 4.13% 70% of LIBOR $5,305,000
2017 4.77% 0.48% 5.26% 79.26% 4.17% 4.05% 4.22% 70% of LIBOR $5,580,000
2018 4.77% 0.52% 5.29% 79.58% 4.21% 4.07% 4.31% 70% of LIBOR $5,865,000
2019 4.77% 0.55% 5.32% 79.91% 4.25% 4.10% 4.39% 70% of LIBOR $6,170,000
2020 4.78% 0.57% 5.35% 80.26% 4.29% 4.11% 4.46% 70% of LIBOR $6,475,000
2021 4.80% 0.58% 5.38% 80.62% 4.33% 4.13% 4.51% 70% of LIBOR $6,810,000
2022 4.81% 0.59% 5.40% 80.98% 4.37% 4.15% 4.56% 70% of LIBOR $7,160,000
2023 4.82% 0.60% 5.42% 81.16% 4.40% 4.16% 4.59% 70% of LIBOR $7,530,000
2024 4.82% 0.61% 5.43% 81.34% 4.42% 4.17% 4.62% 70% of LIBOR $7,910,000
2025 4.83% 0.61% 5.44% 81.52% 4.44% 4.18% 4.65% 70% of LIBOR $8,320,000
2026 4.84% 0.62% 5.46% 81.70% 4.46% 4.19% 4.68% 70% of LIBOR $8,750,000
2027 4.85% 0.63% 5.47% 81.88% 4.48% 4.20% 4.71% 70% of LIBOR $9,200,000
2028 4.85% 0.62% 5.48% 81.99% 4.49% 4.20% 4.74% 70% of LIBOR $9,670,000
2029 4.86% 0.62% 5.48% 82.11% 4.50% 4.21% 4.79% 70% of LIBOR $10,170,000
U.S.
Treasury
Curve

32
Determination of Municipal Swap Rates
The yield difference between the U.S. Treasury curve and the LIBOR swap curve is known as the LIBOR “Swap Spread.” This market-driven number of basis points is added to each maturity on the U.S. Treasury curve to reflect the average additional credit charge on a loan/swap that an average market participant will charge another.
Major players in the LIBOR swap market are banks, insurance companies, broker/dealers, and other financial institutions.
The Swap Spread reflects a generic credit spread these institutions typically charge one another for a loan of a given maturity based upon the fact that most market participants’ credit ratings are in the “AA” or “A” category.
Unlike the Municipal Cash Market, the “ratio” market is an actual market with its own bid-ask spread (also known as the “basis swap” market):
Participants in this market include issuers, investors running Tender Option Bond programs, and hedge funds (i.e. investors and speculators). Participants utilize this market to place directional trades which anticipate changes in the future value of tax-exemption.
To the extent participants believe fixed rate municipals are price inefficiently (i.e. exceptionally high ratios or yields---little value placed on tax-exemption relative to its worth), they will desire to “buy” ratios (receive a fixed percentage of LIBOR and pay BMA) in the hope that the market adjusts and ratios fall.
Should this occur, participants are now receiving a ratio (percentage of LIBOR) higher than available in the market and has therefore profited from the trade.
Given that fixed rate municipal bonds, particularly those with longer maturities can be very inefficient, this type of trade is rather popular among buyers of issuer’s bonds.

33
Series 1999 Refunding Analysis
Type of Issuance Fixed Rate Bonds1
Synthetic Fixed Rate Bonds2
Synthetic Fixed Rate Bonds2
Swap N/A 70% of LIBOR4
BMA4
Bond Par Amount 132,850,000 138,070,000 137,590,000
Average Coupon/Swap Rate 5.00% 3.83% 4.05%
Average Life 14.10 13.62 13.71
Arbitrage Yield 4.61% 3.90% 4.13%
Escrow Yield 4.10% 3.90% 4.10%
Average Annual Debt Service 10,209,660 9,781,990 9,958,850
Maximum Annual Debt Service 10,652,250 10,191,785 10,365,384
Refunded Bonds Data
Par Amount of Refunded Bonds $131,590,000 $131,590,000 $131,590,000
Call Date 9/1/2009 9/1/2009 9/1/2009
Call Price 101% 101% 101%
Savings Results
PV Savings (%) 3.31% 8.04% 5.93%
PV Savings ($) $4,361,373 $10,584,238 $7,806,494
Assumptions:
Market Conditions as of 8/29/2007
1 Fixed rate scenarios include Underwriter's Discount of $5,00/Bond; Insurance of 50 bps; Cost of Issuance of $150,0002 Scenarios include Underwriter's Discount of $2.50/bond; Cost of Issuance of $150,000; Insurance at 50 bps; Remarketing Fees of 25 bps and Auction
Agent Fees of 2 bps

34
Series 1999 Hybrid Refunding Analysis
Type of IssuanceTraditional/Synthetic
Structure
Traditional/Synthetic
Structure
Swap 70% of LIBOR4
BMA4
Bond Par Amount 135,950,000 135,625,000
Average Coupon/Swap Rate 4.01% 4.24%
Average Life 14.24 14.25
Arbitrage Yield 3.97% 4.19%
Escrow Yield 3.97% 4.10%
Average Annual Debt Service 9,916,910 10,098,681
Maximum Annual Debt Service 10,765,717 10,899,700
Refunded Bonds Data
Par Amount of Refunded Bonds $131,590,000 $131,590,000
Call Date 9/1/2009 9/1/2009
Call Price 101% 101%
Savings Results
PV Savings (%) 7.77% 5.56%
PV Savings ($) $10,227,394 $7,321,836
Assumptions:
Market Conditions as of 8/29/2007
1 Fixed rate Bonds include Underwriter's Discount of $5.00/Bond
3 Structure includes Cost of Issuance of $150,000 and Insurance of 50 bps
2 Synthetic fixed rate Bonds include Underwriter's Discount of $2.50/bond; Remarketing Fees of 25 bps
and Auction Agent Fees of 2 bps

Section IV: Case Study Large Authority in Northeast

36
Background
In April 2007, the Authority sold $1.5 Billion of Dedicated Sales Tax Revenue
Bonds to raise funds to make grants to Cities and Schools Districts throughout
the Commonwealth of Massachusetts for the purpose of funding capital
projects such as the building/renovation of middle, elementary, and high
schools;
The Authority had made a 4 week investment of the funds on the April closing
date and hired Raymond James to secure longer-term investments for the
Project Fund ($1.135B) and Debt Service Reserve Funds($129M)
The Authority’s objective was to maximize its return on its investment plus
capital preservation
37
Background (cont.)
$450M of the Project fund had to be spent first with a primary
objective of yield maximization
The $685M balance was then to be spent over the remaining 1.5
years with a primary objective of yield maximization and a
secondary one of capital preservation
The Authority imposed the following constraints upon the
investment situation:
It did NOT want to purchase U.S. Treasuries or Agencies in a
laddered portfolio
Any potential investment vehicle or counterparty had to be rated
at least AA or higher.
The challenge was given to us to structure the investment and meet
the objectives while meeting the Authority’s dual objectives

38
How to Tackle the Situation?
How should the investment be structured?
Should GIC’s or REPO’s be used?
Will there be a yield difference between the two?
What should be the minimum rating requirement of any
potential counterparty?
Are there structural approaches to the GIC’s or REPO’s
that can make a yield difference to the client?
How will different combination of structure and rating
requirements potentially impact the results?
How should the bid be structured given all these
considerations?

39
What are GIC’s?
A GIC is a guaranteed investment contract where a deposit is placed
with a highly rated counterparty who agrees to pay an agreed upon rate
over the term of the investment (can be fixed or variable)
GIC’s are an unsecured investment and initially have no collateral
supporting the principal on deposit
If there is a downgrade in the credit rating of the counterparty below a
pre-defined threshold, then the counterparty must take action such as
collateralizing with treasuries, agencies, or alternatively, assigning the
contract to another entity who has a rating equal to the minimum rating
requirement (typically AA)
Insurance companies and large banks are the primary participants in
the GIC market
Yields on GIC’s tend to be somewhat higher than REPO’s because of
their unsecured nature
Market participants have different motivations
40
What are REPO’s?
A REPO is a repurchase agreement where a deposit is placed with a highly rated counterparty who agrees to pay an agreed upon rate over the term of the investment (can be fixed or variable)
REPO’s are a secured investment and have collateral supporting the principal on deposit at the outset of the investment. As funds are drawn down out of the investment over time, the collateral is released back to the REPO provider.
In a REPO there is little concern over the credit rating of the counterparty below a pre-defined threshold because the investment is already collateralized. Some clients and some credit enhancers will nonetheless desire a minimum credit rating to decrease the probability of default over the term of their investment. Typical rating thresholds for REPO’s are in the A category.
Broker dealers and large banks are the primary participants in the REPO market
Yields on REPO’s tend to be somewhat less than GIC’s because of their secured nature
Market participants have different motivations

41
Investment Structure Considerations
Was there value in structuring the $450M to be drawn
first in front of the $685M, and then have the $685M split
and also drawn “sequentially”?
Was the Authority better off having the funds divided
into 3 contracts all spent down at the same rate (“Pro-
rata”) or some combination thereof?
Deposit constraints of specific potential bidders
“Flex risk” concerns of some bidders vs. others

42
Recommended Approach
Below are alternative approaches that were proposed. Each approach diversifies the Authority’s exposure tocounterparty risk.
Investment
Agreement
#1
Approximately $450 million
Tim
e
Investment
Agreement
#3
Approximately
$274 million
Closing
Investment
Agreement
#2
Approximately
$411 million
Contract
Expires
in 6-
months
Contract
Expires
in 24-
months
Investment
Agreement
#3
Approx.
$380 MMTim
e
Investment
Agreement
#2
Approx.
$380 MM
Closing
Investment
Agreement
#1
Approx.
$380 MM
Contract
Expires
in 24-
months
Pro-Rata Structure Sequential & Pro-Rata Structure
43
Chosen Structure
$450M to be spent first
This $450M contract had a 6 week “lock-out” period
where no withdrawals could take place---contract
terminates on 12/31/07
$685M is split into 2 contracts, one of $411M(60%) and
one of $274M(40%) with a termination of 2/1/09
The 2 contracts associated with the longer funds totaling
the $685M will be drawn pro-rata

44
Reasoning for Structure
The yield curve was slightly inverted in the front end and the
Authority wanted to maximize its yield on the unrestricted $450M
The 6 week lock-out period was designed to let other funds of the
Authority be drawn down AND to add a higher degree of certainty
to the projected draws given to the bidders which firms up their
pricing
Pro-rata was chosen for the $685M because of the concern over
weaker bids if it was broken into 2 contracts and drawn
sequentially; bidders had expressed some reservations over
managing the flex risk on a deal that large
One contract was sized at less than $300M to allow a couple of
potential bidders participate just under their institutional limits

45
Bid Results
Potential Bidder PF I PF II PF III PF I PF II PF III Moody's S&P Fitch
AIG 5.26 5.116 5.112 Pass Pass Pass Aa2 AA AA
Calyon 5.255 5.083 5.08 Pass Pass Pass Aa2 AA- AA
Citigroup 5.326 5.107 5.105 5.204 4.985 4.983 Aa1 AA AA+
JP Morgan Pass Pass Pass 5.247 5.095 5.0625 Aaa AAA AA-
NATIXIS 5.297 5.174 5.167 Pass Pass Pass Aa2 AA AA
Rabobank 5.237 5.167 5.187 Pass Pass Pass Aaa AAA AAA
XL Capital Pass 5.132 5.207 Pass Pass Pass Aaa AAA AAA
DEPFA 5.342 5.1525 5.005 5.17 5.005 5.005 Aa3 AA- AA-
Merril Lynch Pass
Bear Stearns Pass
Lehman Brothers Pass
Wachovia Pass
Bank of America Pass
GE Pass
AMBAC Pass
MBIA Pass
Societe Generale Pass
RBC Pass
GIC Repurchase Agreement Rating

46
Aftermath
Did we achieve our objective?
DEPFA was downgraded from AA- to A1 in July
Client continues to drawn down funds within the $450M
contract “One”

Appendix A:Analyst Role and Responsibilities

48
Application:
Application of much of Finance, Accounting, and Economics course work
Utilization of excel modeling and programming capabilities
Opportunity to rapidly take on as much responsibility as one can handle, thus playing a more integral role on transactions from start to finish
Candidate Characteristics:
People with passion for what they do
People who take pride in their work
People who enjoy the “what if ” aspects of finance and accounting
People who are self-starters and motivated
People with great communication and social skills
Application and Background

49
Financial analysts in the Public Finance Investment Banking Group play an integral role in the department's activities, and are given a high level of responsibility as a key member of an analytical team. Some of the responsibilities include:
Analyze municipal issuer financial statements and outstanding debt
Formulate new transaction proposals
Develop the financial structure and document preparation related to the public issuance of taxable and tax-exempt municipal bonds
Analysts will gain exposure to a variety of derivative products related to municipal finance
As analysts gain experience, they are expected to increase their capacity to process a larger portion of a given transaction
Analysts will work closely with senior investment bankers, often in a dead-line driven team-work environment
The Analyst Role & Responsibilities

50
What Can You Expect in the First 1-2 Years?
Mix of formal and on-the-job training
Learning industry specific software immediately
Excel used for revenue modeling and interest calculations
Typically go through 3 month learning curve cycles
Lots and lots of situational analyses
Diverse work environment where one situation may
involve a large deal team of 5+ and others much smaller
(2-3)

51
How Can a Typical Day be Described?
Mornings and late evenings are when you will be able to get the most undisturbed quiet time to think and run numbers/work on proposals, etc.
Middle of the day - interaction with trading desks, bankers and other team members on various projects to get info, re-work and turn the next draft/version around
Amazingly, senior bankers “seem to wake up” at 3-4 PM which tends to bring late afternoon requests that need to be addressed immediately
A lot of interaction with other analysts to get help in answering questions or to figure out something you have not come across before so there tends to be a strong sense of comraderie in the analyst group

52
Question: Is it different?
Answer: Definitely.
Bulge bracket firms tend to have a higher volume of deals, however, what an analyst is exposed to over the first 2 years will vary widely;
The regional experience tends to offer more breadth of experience on a given transaction, as well as greater exposure to senior bankers;
Greater breadth can translate into a more full understanding of all aspects of a transaction
How is the Role Different in Regional Vs. Bulge Bracket Firms?

Appendix B: Raymond James Information

54
With over 5,200
financial
advisors and
over 440 capital
markets
professionals,
Raymond James
is positioned
among the top
securities firms
in the country
Full-service securities firm founded in 1962 and public since 1983
Listed on the New York Stock Exchange under the symbol “RJF”
Major presence in North America and Europe
– Currently over 5,200 financial advisors, with offices in all 50 states; approximately 1.5 million accounts*
– Member of the Fortune 1,000. Ranked 11th among securities firms and 9th
among retail brokers.
– 26 North American investment banking and institutional sales offices*
– European operations in London, Paris, Geneva, Brussels, and Düsseldorf*
Over 440 capital markets professionals organized along industry
and product lines, providing a full spectrum of investment
banking and capital markets services*
– Powerful retail and institutional distribution capabilities
*RJF data as of August 18, 2005.
Raymond James Overview

55
Raymond James
is a full-service
financial firm
focused on
providing
investment
banking and asset
management
services to a wide
range of
institutions and
individuals.
Retail BrokerageFixed Income &
Equity Capital MarketsAsset Management
Domestic Retail Brokerage
5,200 Financial Advisors
in 2,200 offices nationwide
Canadian Retail Brokerage
237 Financial Advisors in
21 Canadian offices
International Retail Brokerage
Developing retail network
in the United Kingdom
Public Finance
Municipal Sales, Trading &
Research
Municipal Underwriting
Corporate Finance
Equity Sales, Trading & Research
Equity Syndicate
$25 billion in institutional
client accounts
Eagle Asset Management
Pension & profit sharing plans,
retirement funds, foundations
Heritage Asset Management
13 mutual funds
Awad Asset Management
NY based small-cap equity
Raymond James Financial,
Inc.
Principal Business Segments

56
Raymond James Financial Corporate Structure
57
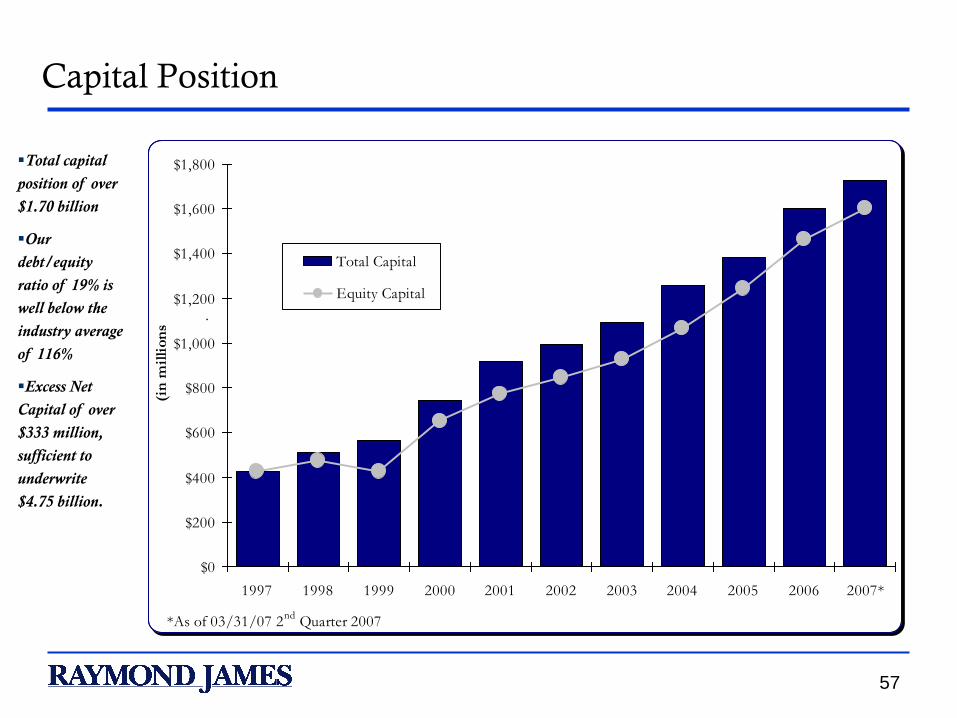
Total capital
position of over
$1.70 billion
Our
debt/equity
ratio of 19% is
well below the
industry average
of 116%
Excess Net
Capital of over
$333 million,
sufficient to
underwrite
$4.75 billion.
Capital Position
$0
$200
$400
$600
$800
$1,000
$1,200
$1,400
$1,600
$1,800
1997 1998 1999 2000 2001 2002 2003 2004 2005 2006 2007*
.
(in
mil
lion
s)
Total Capital
Equity Capital
*As of 03/31/07 2nd
Quarter 2007

58
Over the past
ten years
Raymond
James has
significantly
outperformed
the major
indices.
*Indexed Price to 100 as of 1/1/1997. Prices as of 8/31/2007.
RJ Stock Performance Among Major Indices
Raymond James vs American Equity Indices
0
1
2
3
4
5
6
7
8
9
10
1997 1998 1999 2000 2001 2002 2003 2004 2005 2006 2007
Wee
kly
Clo
se
DOW JONES INDU. S&P 500
NASDAQ Raymond James Stock

59
Retail Branch, Institutional Sales and Investment Banking Locations
Raymond James
has over 2,330
offices covering
all 50 states.
'
Raymond James Retail Branch Offices
Investment Banking / Fixed Income /
Institutional Sales Offices
Other Locations
Buenos Aires, Argentina
Brussels, Belgium
London, England
Paris, France
Düsseldorf, Germany
Mumbai, India
Geneva, Switzerland
Istanbul, Turkey
Raymond James North American Locations

60
Raymond James Combined Fixed Income Employees
269
263
258
266
270
252
254
256
258
260
262
264
266
268
270
272
2002 2003 2004 2005 2006
Em
plo
yee
s
Fixed Income Department
Consistent growth
over the last 5
years in both
employees and
revenue

61
Highlighted Transactions
$98,000,000
New York State Housing Finance Agency
100 Maiden Lane Housing Revenue
Bonds
Series of 2004 A & B (Taxable)
Raymond James served as
Sole Managing Underwriter
$184,312,247.55
Miami-Dade County, Florida
Subordinate Special Obligation Bonds
Series of 2005 A & B
Raymond James served as
Senior Managing Underwriter
$400,000,000
Jefferson County, Alabama
Limited Obligation School Warrants
Series of 2005 A & B
Raymond James served as
Sole Managing Underwriter
$239,025,000
Hillsborough County Aviation
Authority, FL
Transportation Revenue Bonds
Series 2003 A & B (Tampa Airport)
Raymond James served as
Senior Managing Underwriter
$107,870,000
Tampa Bay Water Authority, Florida
Utility System Refunding
Revenue Bonds
Series of 2004
Raymond James served as
Senior Managing Underwriter
$93,000,000
Casino Reinvestment Development
Authority, New Jersey
Hotel Room Fee Revenue Bonds
Series of 2004
Raymond James served as
Senior Managing Underwriter
$650,000,000
Jefferson County, Alabama
Education Sales Tax Warrants
Series of 2004
Raymond James served as
Senior Managing Underwriter
$34,672,571.10
The Rahway Valley Sewerage Authority,
New Jersey
Sewer Revenue Bonds
Series of 2005 A
Raymond James served as
Sole Managing Underwriter
RVSA

62
Highlighted Transportation Transactions
$425,000,000
Massachusetts Bay Transportation
Authority
Assessment Bonds
Series 2005 A
Senior Managing Underwriter
$750,000,000
Metropolitan Transportation
Authority, State of New York
Transportation Revenue Bonds
Series 2005 A
Co-Managing Underwriter
$1,072,840,000
Orlando-Orange County Expressway
Authority
Revenue Bonds
Series 2003 A
Series 2003 B
Series 2003 C
Series 2003 D
Co-Senior Managing Underwriter
$1,213,140,000
New Jersey Transportation Trust Fund
Authority
Transportation System Bonds
2005 Series B
Co-Managing Underwriter
$2,786,000,000
New York State Thruway Authority
Second General Highway and Bridge
Trust Fund Bonds
Series 2005 B
Co-Managing Underwriter
$542,399,755
New Jersey Turnpike Authority
Turnpike Revenue Bonds
Series 2004 A
Series 2004 B
Series 2004 C
Co-Managing Underwriter
$241,400,000
Miami-Dade County Expressway
Authority
Toll System Revenue Bonds
Series 2005 A
Auction Rate Securities
Co-Managing Underwriter &
Remarketing Agent
$770,000,000
Illinois State Toll Highway Authority
Toll Highway Senior Priority
Revenue Bonds
Series 2005 A
Co-Managing Underwriter

63
$210,000,000
Hillsborough County
Industrial
Development Authority, FL
Hospital Revenue Bonds
(Tampa General Hospital
Project)
Series 2003 A & B
Raymond James served as
Co-Senior Managing
Underwriter
$116,005,000
Pinellas County
Health Facilities Authority
Health System Revenue
Refunding Bonds, Baycare
Health System,
Series 2003A
Raymond James served as
Co-Senior Managing
Underwriter
$107,075,000
City of Miami Beach Health
Facilities Authority
Hospital Revenue Refunding
Bonds, Series 2004
Mount Sinai Medical Center of
Florida
Raymond James served as
Sole Managing Placement
Agent
$150,000,000
Pinellas County
Health Facilities Authority
Health System Revenue
Bonds, Baycare Health
System,
Series 2003
Raymond James served as
Co-Senior Managing
Underwriter
Raymond James served
as
Senior Managing
Underwriter
$90,260,000
Monongalia County Building
Commission
Revenue Bonds,
Series 2005 A, B, & C
Raymond James served
as
Senior Managing
Underwriter
$30,000,000
City of Saint Petersburg
Health Facilities Authority
Revenue Bonds, Series 2005C
$100,000,000
City of Reno, Nevada
Hospital Revenue Bonds
Washoe Medical Center
Project
Series 2005 A, B & C
Raymond James served as
Co-Senior Managing
Underwriter
Raymond James served as
Sole Manager
$32,275,000
North Brevard County Hospital
District
Parrish Medical Center
Auction Rate Revenue Bonds
Series 2005
Highlighted Healthcare Transactions