Embed Size (px)
Citation preview

Presentation to: ULI 2007 South Florida Economic & Development Outlook Conference
Stephen Blank
Senior Fellow, Finance
ULI – the Urban Land Institute January 25, 2007

Agenda: Real Estate Industry and Real Estate Capital Markets Trends
Real Estate Industry Trends
Public and Private Real Estate Equity Capital Markets
Public and Private Real Estate Debt Capital Markets
Real Estate Capital Markets Trends


Why Study Real Estate Industry and Capital Markets Trends?
“If you come to a fork in the road, take it.”Yogi Berra
“Successful investing [involves] anticipating the anticipations of others”
John Maynard Keynes
“The view never changes unless you’re the lead dog.”Anon

Viewing the Future Requires a 21st
Century Vocabulary
BABOONS – “Baby Boomers” with no savings
SITCOM – Single income, two children, oppressive mortgage
SHAKE-UP CALL – A wake-up call to the 10th power; the difference between heartburn and a heart attack
YOGURT CITIES – Places with active cultures and access to the arts, music, education, etc. Retiring “Baby Boomers” will move to “Yogurt Cities”, not retirement communities

Viewing the Future Also Requires a New Real Estate Vocabulary
TOAD—Temporary, Obsolete, Abandoned, or DerelictLITTER ON A STICK—BillboardsGROUND COVER—Easily bulldozed buildingsALLIGATOR—real estate scheme that has gone belly upZOOMBURB—a city in the suburbs growing faster than a “boomburb”LULU—Locally Unwanted Land UseBANANA—Build Absolutely Nothing Anywhere NearNOPE—Not on Planet Earth

“If all the economists were laid end to end, they would never reach a conclusion”(George Bernard Shaw)

Job Growth Drives the Real Estate Economy - Monthly Employment Growth
-300
-200
-100
0
100
200
300
400
J M M J S N J M M J S N J M M J S N J M M J S N
Source: Bureau of Labor Statistics (in 000s)
1990s Expansion30-Year Average10-Year AverageOctober 2003

Interest Rates

Key Interest Rates
December 29, 2006 One Year Ago Increase/ Decrease
Prime Rate 8.25% 7.25% +1.00%
Federal Funds Rate 5.25% 4.25% +1.00%
3-Month Libor 5.36% 4.53% +0.83%
3-Month T-Bills 4.88% 4.07% +0.81%
10-Year T-Bonds 4.70% 4.39% +0.31%
30-Year T-Bonds 4.81% 4.79% +0.02%

Federal Funds Rate and Discount Rate
Source: Moody’s Economy.com Dismal Scientist.

Yield Curve at December 29, 2006

© 2001 The New Yorker Collection from cartoonbank.com. All Rights Reserved.

The World of “Paradigm Shifts”
SecuritizationConsolidationGlobalizationTechnologyResiliency


© 2001 The New Yorker Collection from cartoonbank.com. All Rights Reserved.


Resiliency
Prisms to measure real estate’s resiliency by:
1998: Russia defaults on its sovereign debt2001: September 11thContinuing resiliency to global economic and geo-political uncertainty


“History has not dealt kindly with protracted periods of low risk premiums”
Historic global liquidity + insatiable appetite for yield = “irrational exuberance” applied to real estate
No distinction as to quality, quantity, or durability of incomeIncreased competition has led to lower underwriting standardsIncrease in proprietary risk takers active in the real estate investment and capital markets, many of whom could be characterized as “inexperienced”Low interest rates are driving many investment, operating, and financing strategiesRecord year for everything-property sales, conventional/securitized debt financing

“An unsustainable trends will not last forever”
2.50%
3.50%
4.50%
5.50%
6.50%
7.50%
8.50%
9.50%
10.50%
11.50%
12.50%
2001 2002 2003 2004 2005 2006
IRR Cap Rate 10-Year TreasuryMortgage Rate "IRR Spread" "Cap Rate Spread""Mortgage Rate Spread"
Source: Real Estate Research Corporation.

Sales of Office, Industrial, Retail, and Multifamily (in $ Billions)
Sales (in $ Billions)
$304.50
$364.20
$270.00
$300.00
$330.00
$360.00
$390.00
2005 2006
Average Capitalization Rates
6.57%
6.08%
5.80%5.90%6.00%6.10%6.20%6.30%6.40%6.50%6.60%6.70%
2005 2006
Source: Real Capital Analytics Inc.


“Today…a deployment problem; tomorrow…a performance problem”
Perfect alignment of the stars due to investment income requirements of a wide array of investors
Baby boomers seeking low-risk, income-oriented investmentsInstitutional investors seeking income-producing investments to fund distributions to retireesOffshore investors seeking higher yields and geopolitical safety of U.S. real estate
No longer a decision of whether to own real estate or notNow it’s how (to structure) and where (geographically) to own it

An Ever Widening Array of Investment Strategies for Commercial Real Estate

Growing Appetite for Higher Yielding, Non-Traditional, Investment Strategies
Demographically-driven investment strategiesSenior HousingStudent HousingMedical Office BuildingsResorts and destination hotelsSecond home communitiesSingle familyCondominium conversions
Development, re-development, rehabilitation, renovation, re-leasing and re-positioning

Offshore investingEquity and debt in securitized format Direct investment via pooled funds and joint ventures
Fixed-income oriented investmentsInvestment grade securities to B-piecesNon-investment grade/non-rated securitiesMezzanine debtStructured debt (CDOs, CLOs)
Other alternative investment strategies/structuresReal estate securities hedge fundsReal estate derivativesInfrastructure (toll roads, bridges, tunnels, etc.)

“We are at the stage where investors are paying up to put money out”
Risk
Returns
CoreLeverage: 0-25%
Value-AddedLeverage: 55-65%
OpportunisticLeverage: 65-75%+
Core PlusLeverage: 25-50%
Return 6-7.5%
Return 8-11%
Return 12-15%
Return 15%+
Return 9.5-11%
Return 11-13%
Return 14-17%
Return 18%+
4+/- Years Ago
Today
Strategy

Rapidly Changing Real Estate Capital Markets
Excess global liquidity in both the public and private real estate equity and debt capital markets
Increased globalization of owners, developers, investors, investment funds, lenders, and service providersCompressed capitalization rates and risk premiums, all in the face of volatile interest rates and an uncertain economyNew players (hedge funds), new investment strategies and alternatives (demographics plays and infrastructure), new financial instruments (collateralized debt obligations and real estate derivatives)

What’s Behind Door Number 3?
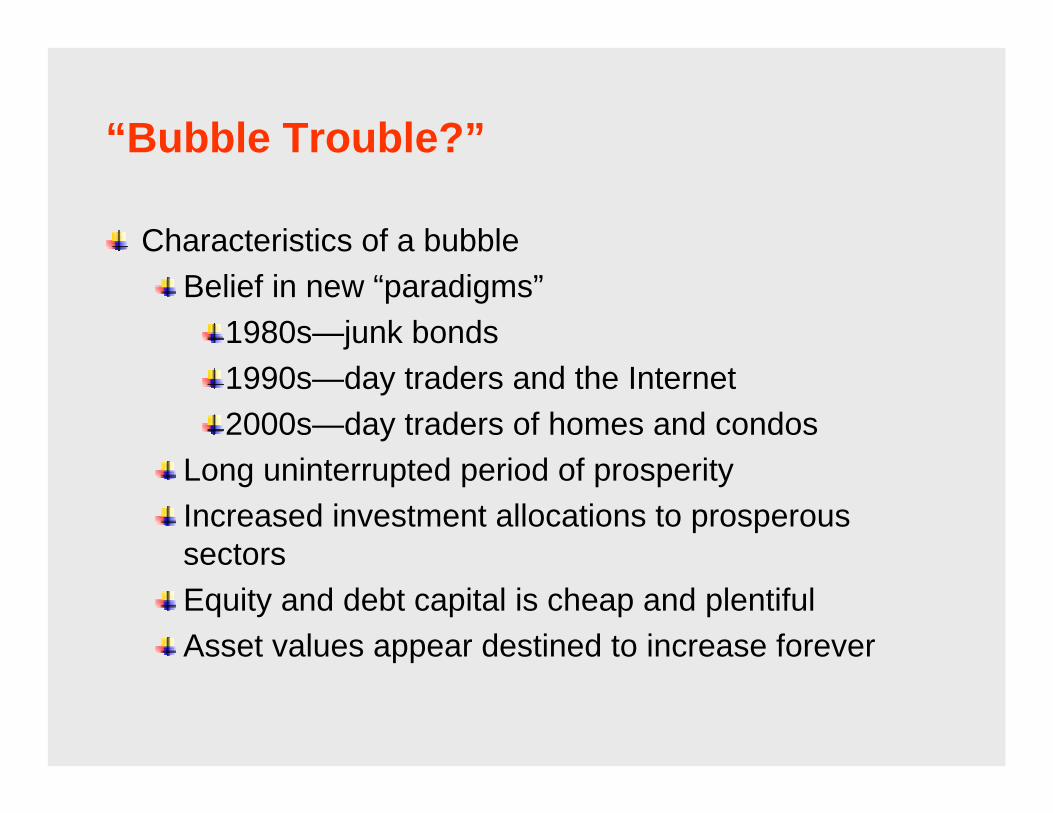
“Bubble Trouble?”
Characteristics of a bubbleBelief in new “paradigms”
1980s—junk bonds1990s—day traders and the Internet2000s—day traders of homes and condos
Long uninterrupted period of prosperityIncreased investment allocations to prosperous sectorsEquity and debt capital is cheap and plentifulAsset values appear destined to increase forever

2007: Themes and Trends
When interest and capitalization rates increase, industry will learn if recent decline in capitalization rates was cyclical or secular
Cyclical argues for reversion to historical meanSecular argues that risk premium and required investment yields have decreased permanently
Has the risk-return metric for real estate equity and debt changed?Does current margin of returns in excess of risk-free rates provide adequate risk-adjusted rates of return?
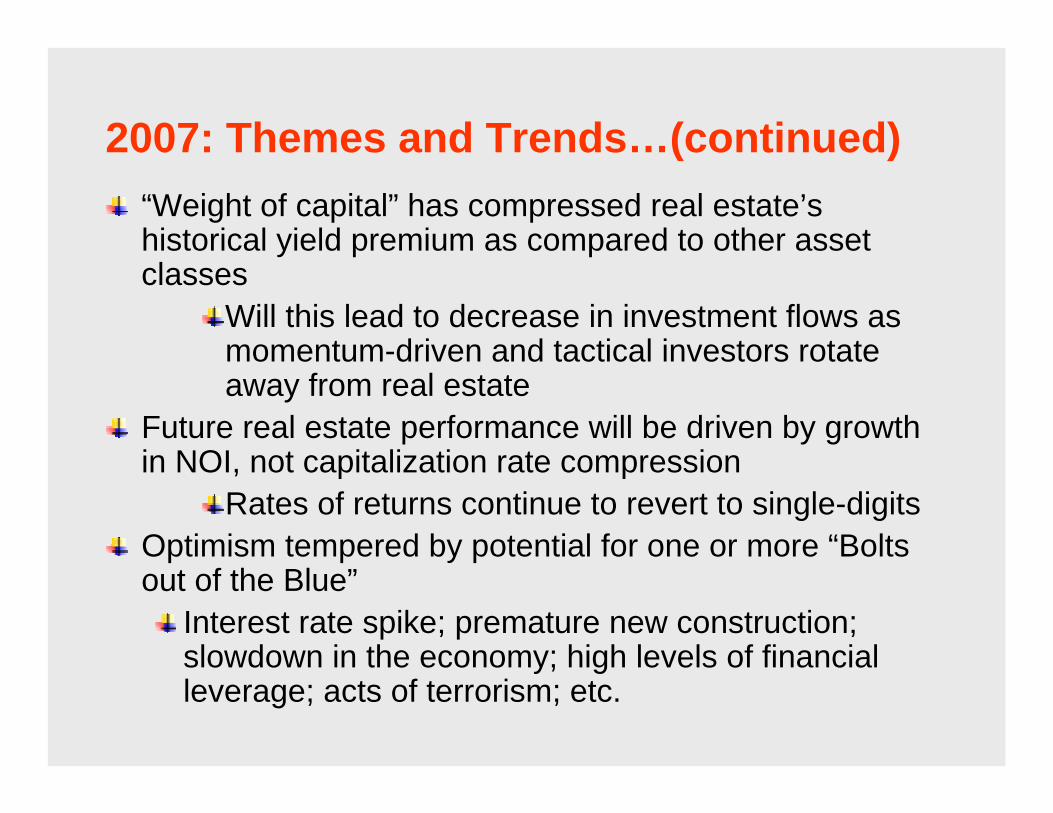
2007: Themes and Trends…(continued)“Weight of capital” has compressed real estate’s historical yield premium as compared to other asset classes
Will this lead to decrease in investment flows as momentum-driven and tactical investors rotate away from real estate
Future real estate performance will be driven by growth in NOI, not capitalization rate compression
Rates of returns continue to revert to single-digitsOptimism tempered by potential for one or more “Bolts out of the Blue”
Interest rate spike; premature new construction; slowdown in the economy; high levels of financial leverage; acts of terrorism; etc.

2007: Themes and Trends…(continued)
Increases in interest rates will squeeze positive leverage and cash flows
New mantra—“The deal will cash flow in 2008!”Leverage is at historical high as government (3 deficits), business (derivatives), and consumers (mortgage and credit card debt) “pile” it onAs interest rates increase, refinancing risk will increaseSome buyers are incorporating lots of recovery in their pricing with little discrimination as to asset quality
Everyone is betting a future buyer (or lender) will take them out

2007: Themes and Trends…(continued)
Crises, when it comes, will be liquidity driven due to withdrawal of equity, mezzanine capital, and/or mortgage capital from the real estate industryIndustry faces unaccustomed pressure of new capital sources such as mezzanine investors and hedge funds
While better able to analyze, segment, and price risk, many current real estate industry and capital markets participants have never endured “rough seas”
Hopefully, the real estate capital markets continue to function as a “governor” and “allocater” of capital

“Things Have a Habit of Ending Badly”
Today’s commercial/multifamily real estate investment markets have been powered by a combination of
Belief in a long-term, uninterrupted economic boomAssumption of continued availability of equity and debt capital
But “things” have a habit of ending badlyMore serious housing decline leads to consumer driven global economic downturnContinuing decline in U.S. dollar lowers purchasing power while defending the dollar raises interest rates
“Things Have a Habit of Ending Badly”…(continued)
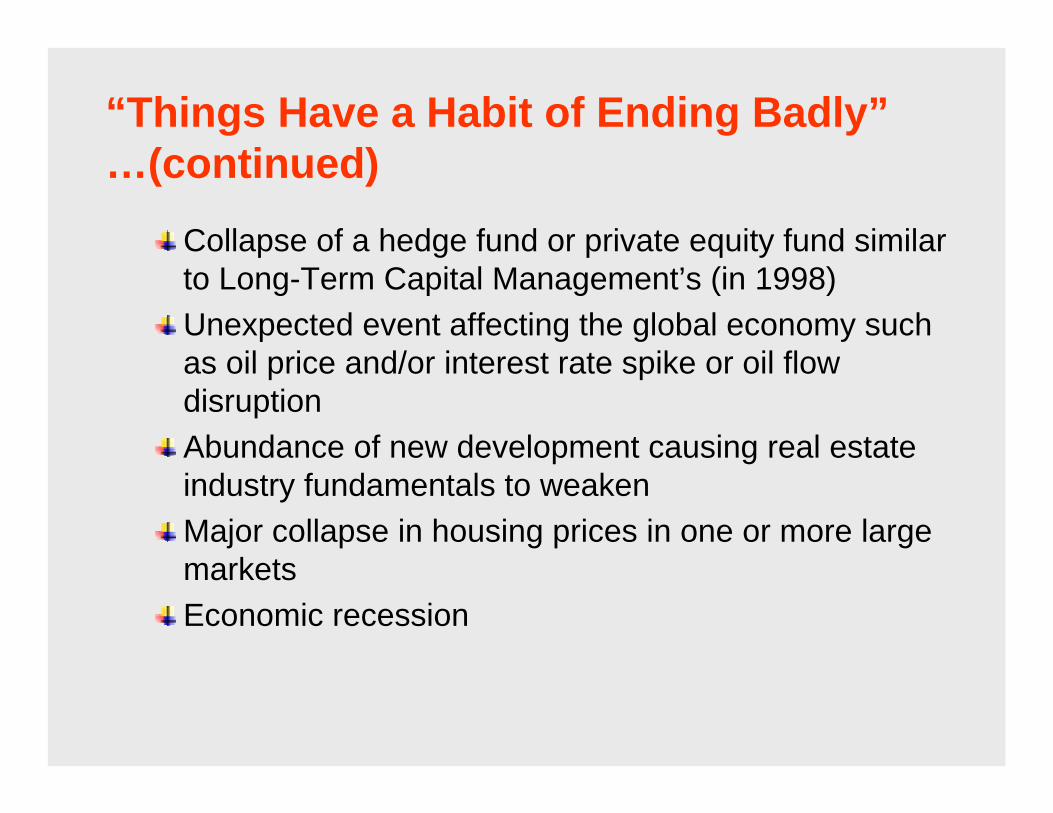
Collapse of a hedge fund or private equity fund similar to Long-Term Capital Management’s (in 1998)Unexpected event affecting the global economy such as oil price and/or interest rate spike or oil flow disruptionAbundance of new development causing real estate industry fundamentals to weakenMajor collapse in housing prices in one or more large marketsEconomic recession

“Things Have a Habit of Ending Badly”…(continued)
Foreign trade initiatives, i.e., protectionism and tariffs, reduce confidence in the capital marketsUncertainty regarding international geopolitical event risk reduces confidence in the capital marketsUncertainty regarding the potential for a terrorist “event” leads to a loss of confidence and the closing— figurative or literal—of the capital marketsFailure of a major transaction to close leads to a loss of confidence and the closing of the bridge equity or bridge loan markets
“Things Have a Habit of Ending Badly”…(concluded)
“Deal Making3” (to the third power”)How risky is this generation of leveraged buyouts?How has the emergence of hedge funds, CDOs, and CLOs as “lenders” altered the landscape?What implications does the recent trend toward “covenant-lite” and “covenant-loose” lending have for future restructurings?What impact will structured second lien lending have on leveraged finance?

“Perfect Beach Day”…or “Perfect Storm”?

“Perfect Beach Day”…or“Perfect Storm”?
Historically low interest rates and low credit spreadsOversupply of equity and debt capitalCompetition to invest as well as lend at historical peakSellers and borrowers, rather than buyers and lenders, have pricing powerBuyers justifying paying more by borrowing more at low interest rates Confluence of investors (baby boomers, pension funds, and foreign investors) with shared yield objective has sustained excess investment demand


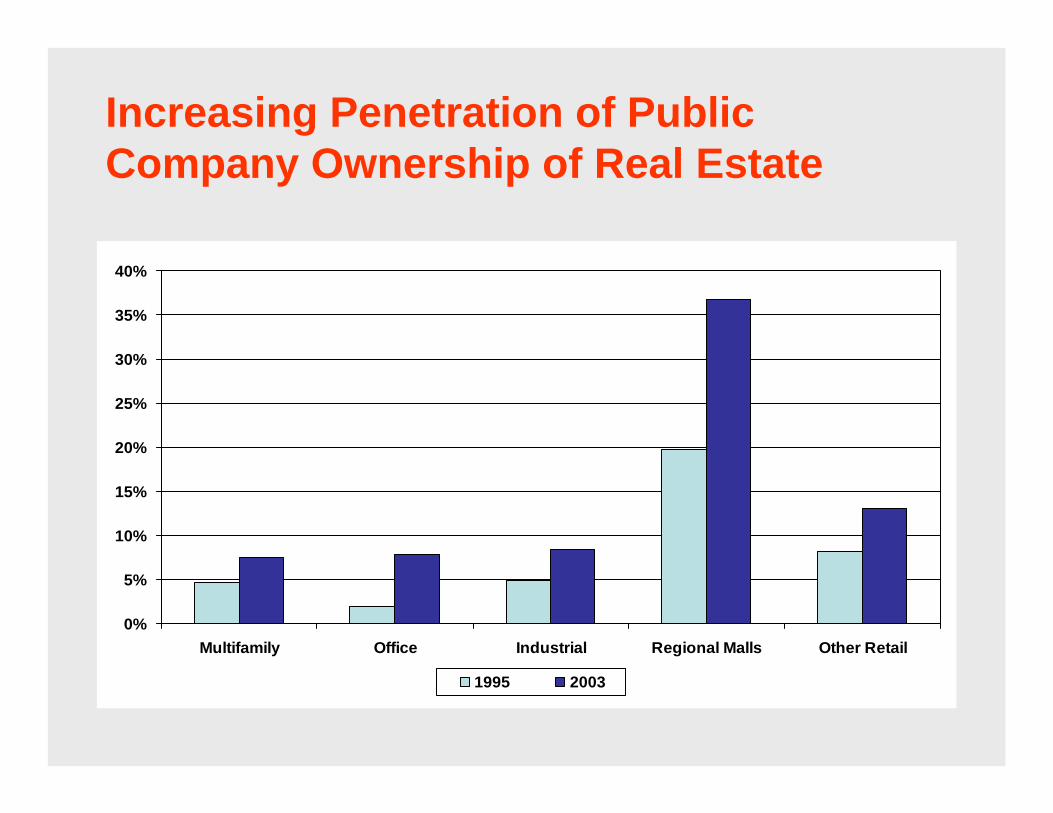
Increasing Penetration of Public Company Ownership of Real Estate
0%
5%
10%
15%
20%
25%
30%
35%
40%
Multifamily Office Industrial Regional Malls Other Retail
1995 2003

REIT Performance
-60.00%
-40.00%
-20.00%
0.00%
20.00%
40.00%
60.00%
80.00%
100.00%
1999 2000 2001 2002 2003 2004 2005 2006
REITs DJ Industrials S & P 500 NASDAQ Russell 2000

For REITs…It’s Different This Time
Have proven themselves to be cycle-tested and user-friendly Demonstrated ability to provide portfolio diversificationLiquidity available in size as average daily trading volumes increaseAbundant transparency and availability of information as well as critical analysis from numerous independent sourcesProven relative value performance versus wide array of publicly-traded alternative equity investments

It’s Different This Time But...
What trading values are “sustainable”?Prices should correlate to “something”Earnings are growing, but are they growing fast enough to support current valuations?
Has low interest rate environment been the real driver of performance?
Correlation between interest rates and REIT prices seems to exist
Accelerating number of joint venture transactionsREITs “poking their noses” in operating company M & A/ restructuring-type transactionsBenefiting from high global inflows of investment funds
Risk of sector rotation by various investor constituencies

What’s Driving Recent REIT Merger and Acquisition Activity?
Recent REIT merger and acquisition activity driven by private funds backed by institutional investors
Public market pricing attractive relative to private market pricesAvailability of capital is no longer a constraint
“Horizontal” transactions allow institutional investors to acquire both “size” and vertically-integrated operating platforms
Willingness to pay portfolio premium for “size”Operate differently-sell assets, increase leverage, etc.


Private Equity Capital MarketsCirca 2007
Historically, it is in the later stages of the cycle that the biggest mistakes are madeBuyers will begin to awaken from “dream-like” state
Capital can no longer ignore fundamentalsIf interest rates increase, capital flows could become more subduedIf interest rates increase, so will capitalization rates
Allocations to real estate could decrease if investors decide to rotate to alternative investments in search of better “relative” value
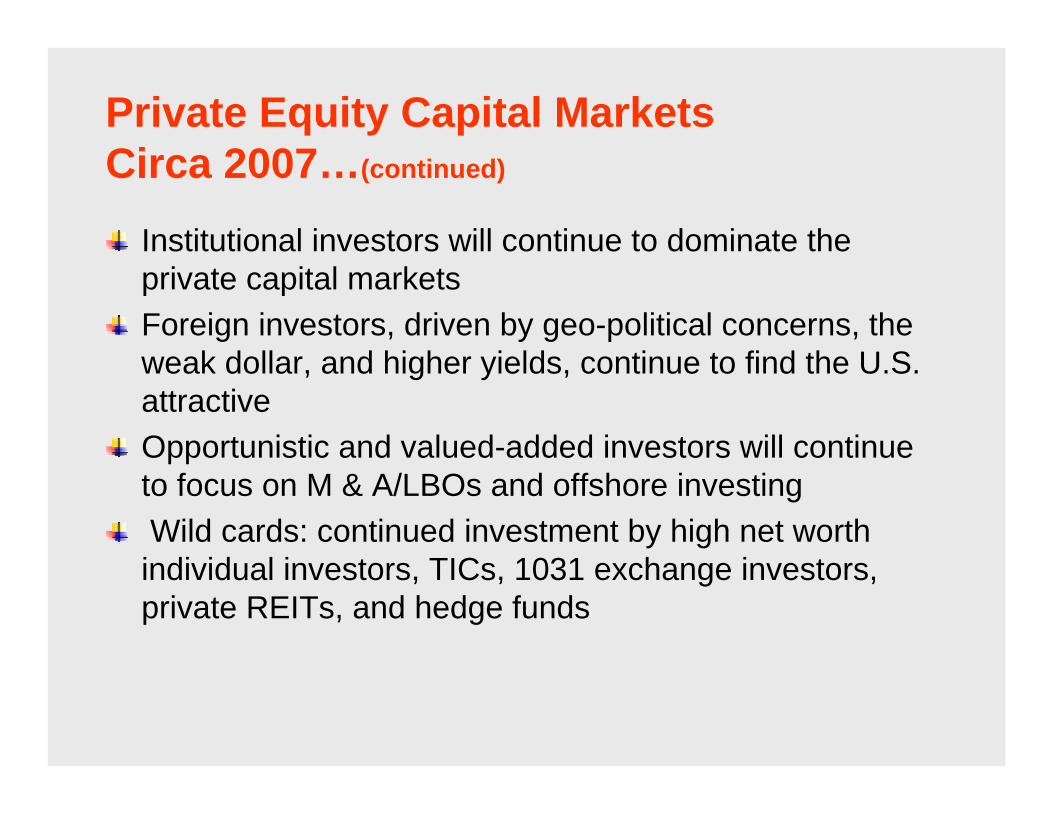
Private Equity Capital MarketsCirca 2007…(continued)
Institutional investors will continue to dominate the private capital marketsForeign investors, driven by geo-political concerns, the weak dollar, and higher yields, continue to find the U.S. attractiveOpportunistic and valued-added investors will continue to focus on M & A/LBOs and offshore investingWild cards: continued investment by high net worth individual investors, TICs, 1031 exchange investors, private REITs, and hedge funds


Three Strikes and You’re Out?
2005—regulatory agencies issued “guidance” regarding underwriting practices in home-equity lending and risks of “exotic” home mortgage financing2006—federal regulators issued for comment guidelines regarding risks associated with concentrations [of loans] in commercial real estate
December 7, 2006—federal regulators proposed guidelines on the amount of commercial real estate loans banks can hold before drawing further oversight
Regulators noted that “banks hold more real estate now than during the market decline in the 1980s”

Private Debt Capital Markets Circa 2007
2007 may finally test industry’s underwriting practicesWhile securitized and conventional delinquencies remain far below industry “high-water” levels, recent increase in interest-only loans is increasing risk
Underwriting standards should “tighten” as regulators and management recognize recent weakening of the credit cultureContinued decline in balance sheet lenders in favor of warehouse-securitized origination/distribution strategies and clubs, participations, and syndicationsForeign banks remain active in selected marketsOverall, adequate capital will be available from both conventional as well securitized lenders

Commercial Mortgage-Backed Securities
Remain positioned to outperform comparable debt investments based on relative value, credit performance, and structural characteristics
Delinquencies on seasoned transactions at lowest level since September 2001
Well below 1.54% industry “lifetime” averageForeclosure loss severity improved to 28% of principal versus 35% long-term average8-to-1 credit ratings upgrade/downgrade ratio; best performance since 2001

Growth in Issuance of Commercial Mortgage-Backed Securities
$0
$50
$100
$150
$200
$250
1995 1996 1997 1998 1999 2000 2001 2002 2003 2004 2005 2006 2007(P)
U.S. International

CMBS Issues and Concerns : Have Underwriting Standards Deteriorated?Continued investor demand for yield combined with intense competition between originators
Underwriting will not improve dramatically if at allWall Street conduits “need to feed” their underwriting and issuance machine
Lender’s are pushing underwriting boundaries“Amortization…covenants...how retro!”
Will rising tide of improving fundamentals offset risk of aggressive underwriting?
Volume of Interest-only/partial interest-only loans continue to increase DSCR/LTVs continue to “deteriorate”Subordination levels continue to decline

In conclusion…
Return expectations continue to decline for all asset classesReal estate returns continue to offer positive spreads relative to alternativesSpreads over Treasury yields and inflation remain positiveReal estate remains “the least vertically challenged” in relative value comparisons
But…as risk premium compression continues, investors may start to look elsewhere

In conclusion…really!
Real estate is in driver ‘s seat…for nowCapital flows from individual and institutional investors will continue to grow…for nowCapital flows to global property investment markets will continue…for nowDrivers today are external to real estate markets
Domestic and off-shore individual and institutional investors have become “income-seeking missiles”
Once again, it’s ours to blow

ULI’s Real Estate Capital MarketsWeb SiteAt www.uli.org, click on “Research” on the navigation bar, then click on “Trends” to view the most recent issue of ULI’s Real Estate Capital Markets UpdateWeb site also contains
Archives of prior updatesFAQsE-mail subscription form

Presentation to: ULI 2007 South Florida Economic & Development Outlook