Embed Size (px)
Citation preview
Presentation to the Treasury Borrowing Advisory Committee
U.S. Department of the TreasuryOffi f D bt M tOffice of Debt Management
February 2, 2010
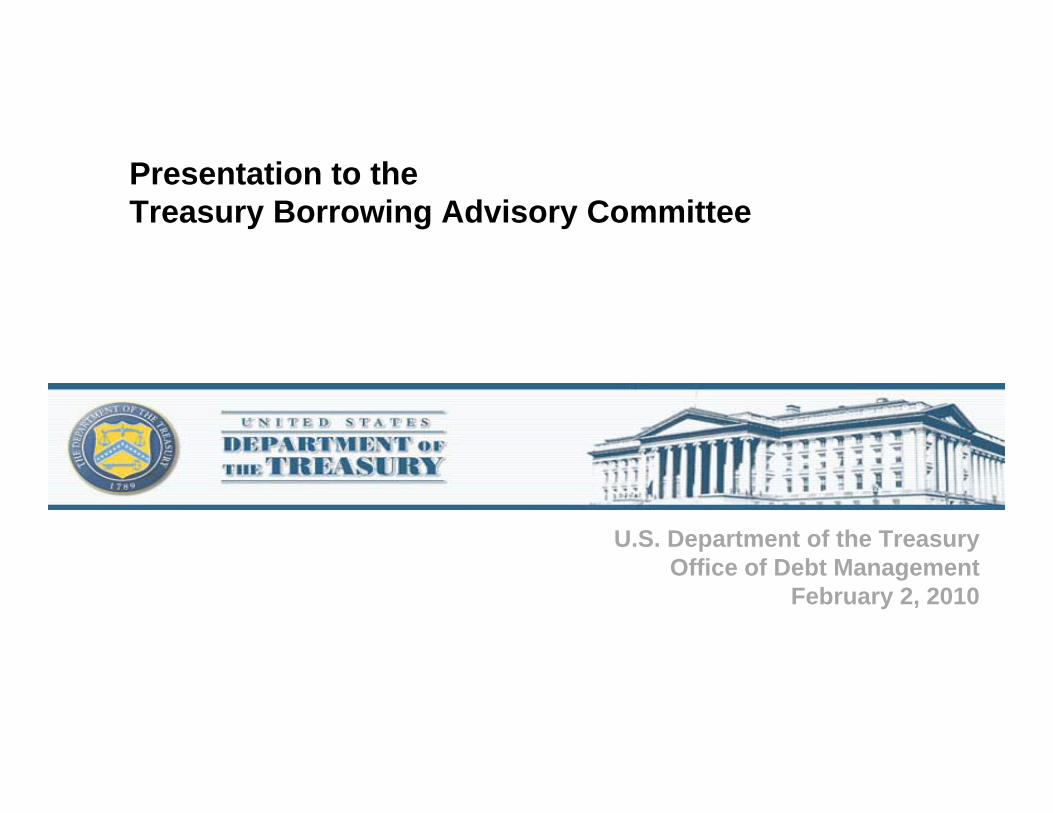
Federal Budget Deficits Year-to-Date
-1 413
600%-1,600
$ Billions
2008 Y-O-Y % Change
-1,086
-1,267
-1,3781,413
400%
500%-1,400
-1,200
20102009
-765
-957
-802
-992
200%
300%
-1,000
-800
-263-311 -319 269
-371
-483 -455
-402
-485
-569
-176-297
-389 100%
200%
-600
-400
-56-154
-106 -88
263
-152-269 -237
-100%
0%-200
0
7 7 7 8 8 8 8 8 8 8 8 8 8 8 8 9 9 9 9 9 9 9 9 9 9 9 9
Office of Debt Management2
Oct
-07
Nov
-07
Dec
-07
Jan-
08
Feb-
08
Mar
-08
Apr
-08
May
-08
Jun-
08
Jul-0
8
Aug
-08
Sep
-08
Oct
-08
Nov
-08
Dec
-08
Jan-
09
Feb-
09
Mar
-09
Apr
-09
May
-09
Jun-
09
Jul-0
9
Aug
-09
Sep
-09
Oct
-09
Nov
-09
Dec
-09
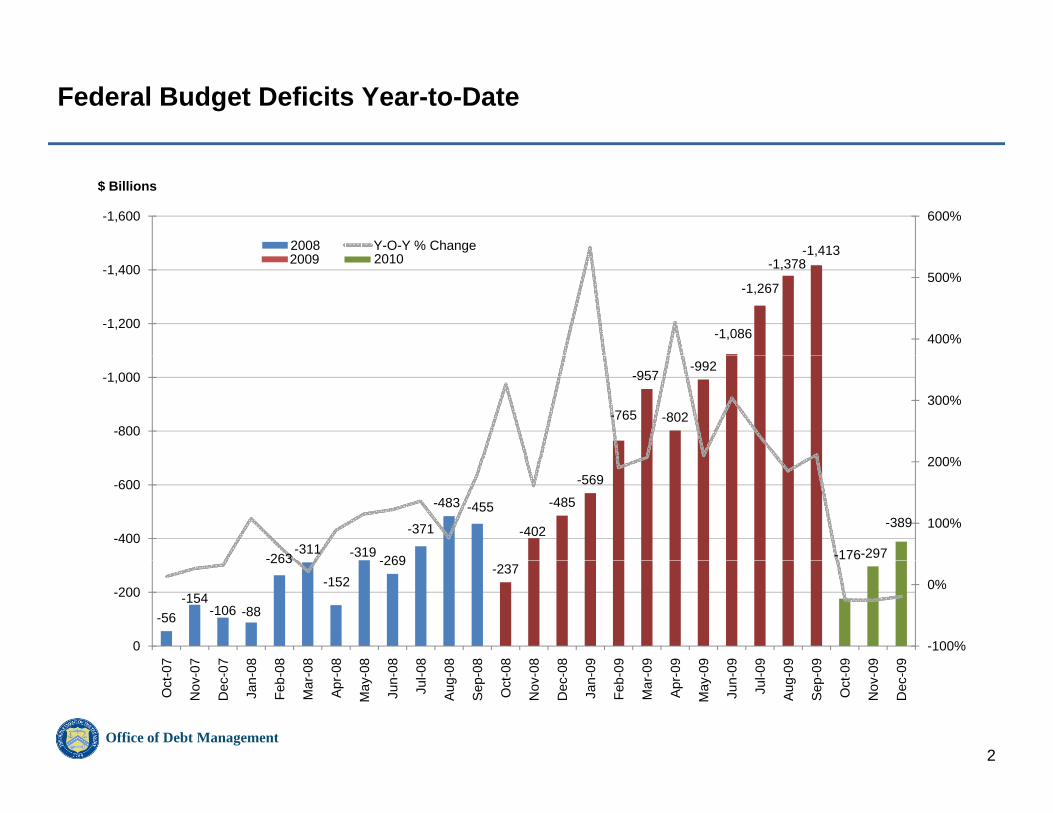
Federal Cash Outlays Year-to-Date
01-Oct 15-Nov 31-Dec 15-Feb 1-Apr 17-May 2-Jul 16-Aug
FY07 FY08 FY09 FY10
-1,000
-500
-1,500
Bill
ion
2 500
-2,000
$
-3,000
-2,500
Office of Debt Management3
-3,500
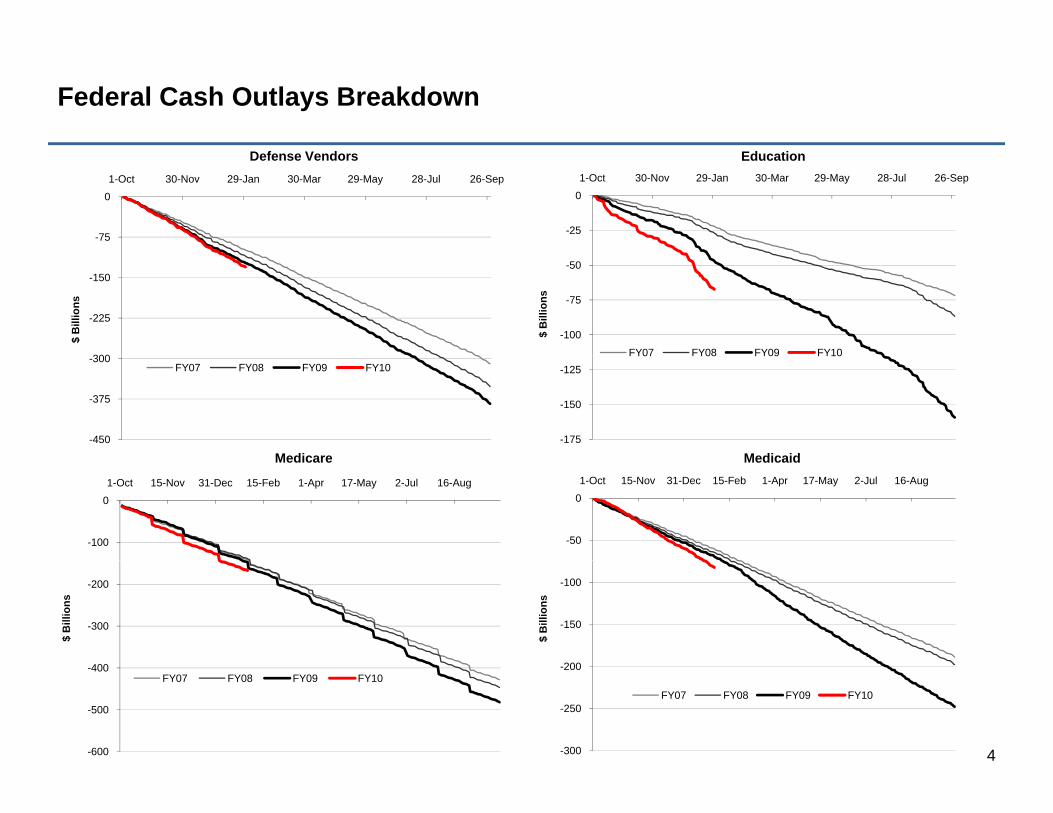
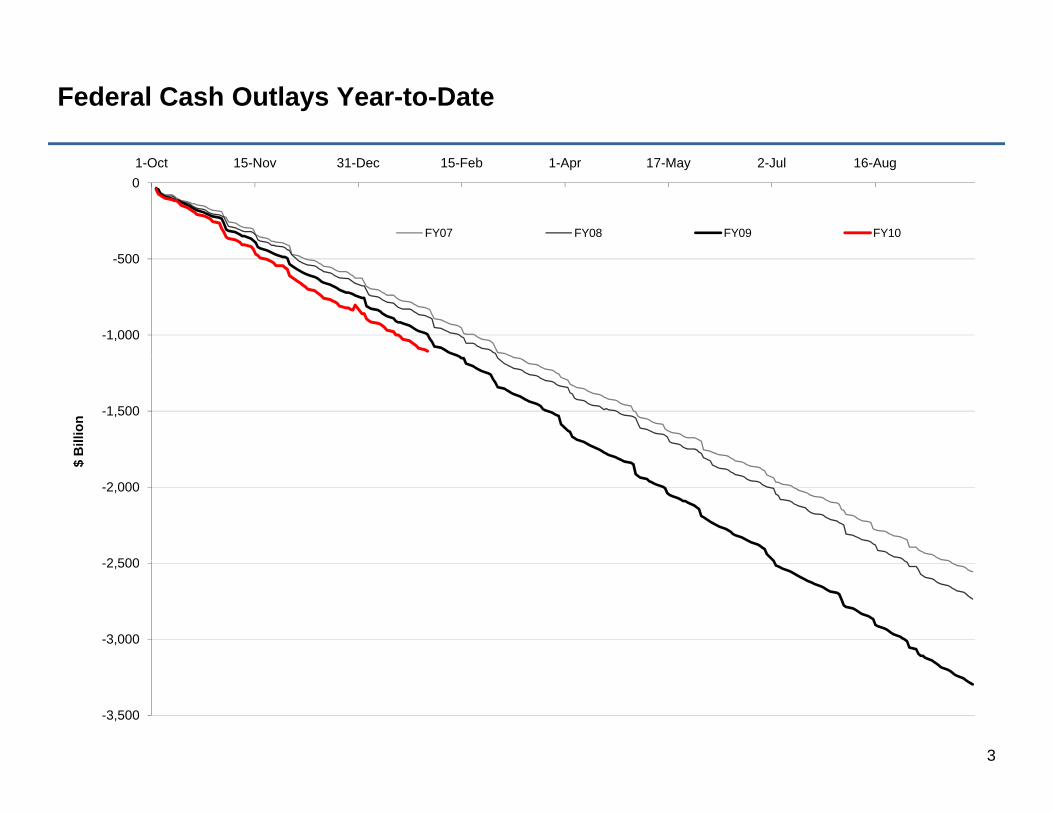
Federal Cash Outlays Breakdown
-75
01-Oct 30-Nov 29-Jan 30-Mar 29-May 28-Jul 26-Sep
Defense Vendors
-25
01-Oct 30-Nov 29-Jan 30-Mar 29-May 28-Jul 26-Sep
Education
300
-225
-150
$ B
illio
ns
-100
-75
-50
$ B
illio
ns
FY07 FY08 FY09 FY10
-450
-375
-300FY07 FY08 FY09 FY10
-175
-150
-125FY07 FY08 FY09 FY10
Medicare Medicaid
-100
01-Oct 15-Nov 31-Dec 15-Feb 1-Apr 17-May 2-Jul 16-Aug
Medicare
-50
01-Oct 15-Nov 31-Dec 15-Feb 1-Apr 17-May 2-Jul 16-Aug
Medicaid
-300
-200
$ B
illio
ns
200
-150
-100
$ B
illio
ns
Office of Debt Management4-600
-500
-400FY07 FY08 FY09 FY10
-300
-250
-200
FY07 FY08 FY09 FY10
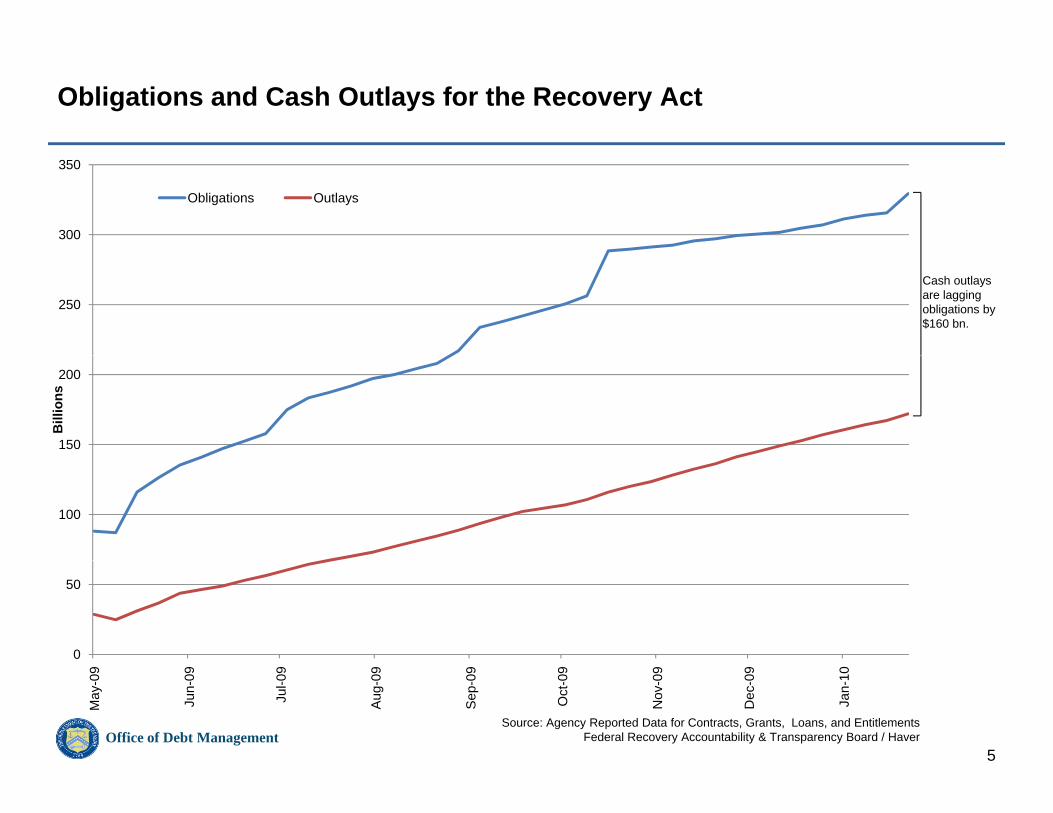
Obligations and Cash Outlays for the Recovery Act
300
350
Obligations Outlays
Cash outlays are lagging obligations by $160 bn.
250
150
200
Bill
ions
100
0
50
Office of Debt Management5
May
-09
Jun-
09
Jul-0
9
Aug
-09
Sep
-09
Oct
-09
Nov
-09
Dec
-09
Jan-
10
Source: Agency Reported Data for Contracts, Grants, Loans, and Entitlements Federal Recovery Accountability & Transparency Board / Haver
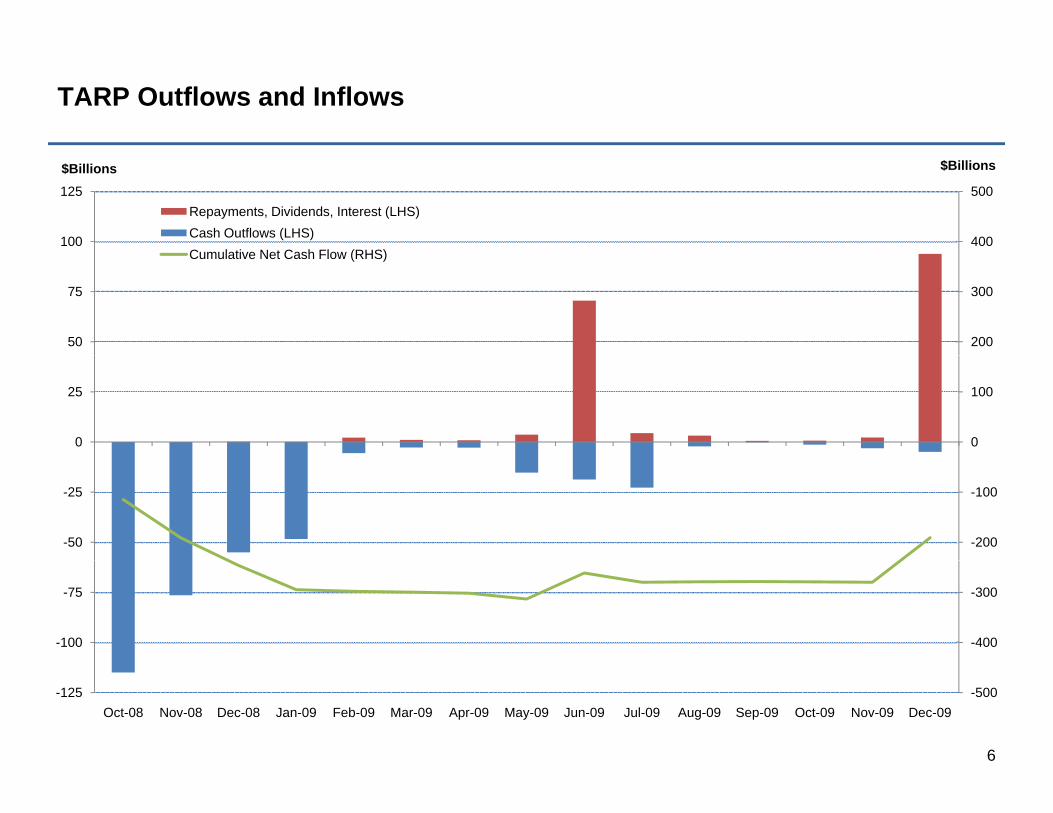
TARP Outflows and Inflows
400
500
100
125Repayments, Dividends, Interest (LHS)Cash Outflows (LHS)Cumulative Net Cash Flow (RHS)
$Billions $Billions
200
300
50
75
Cumulative Net Cash Flow (RHS)
0
100
0
25
-200
-100
-50
-25
-400
-300
-100
-75
Office of Debt Management6
-500-125Oct-08 Nov-08 Dec-08 Jan-09 Feb-09 Mar-09 Apr-09 May-09 Jun-09 Jul-09 Aug-09 Sep-09 Oct-09 Nov-09 Dec-09
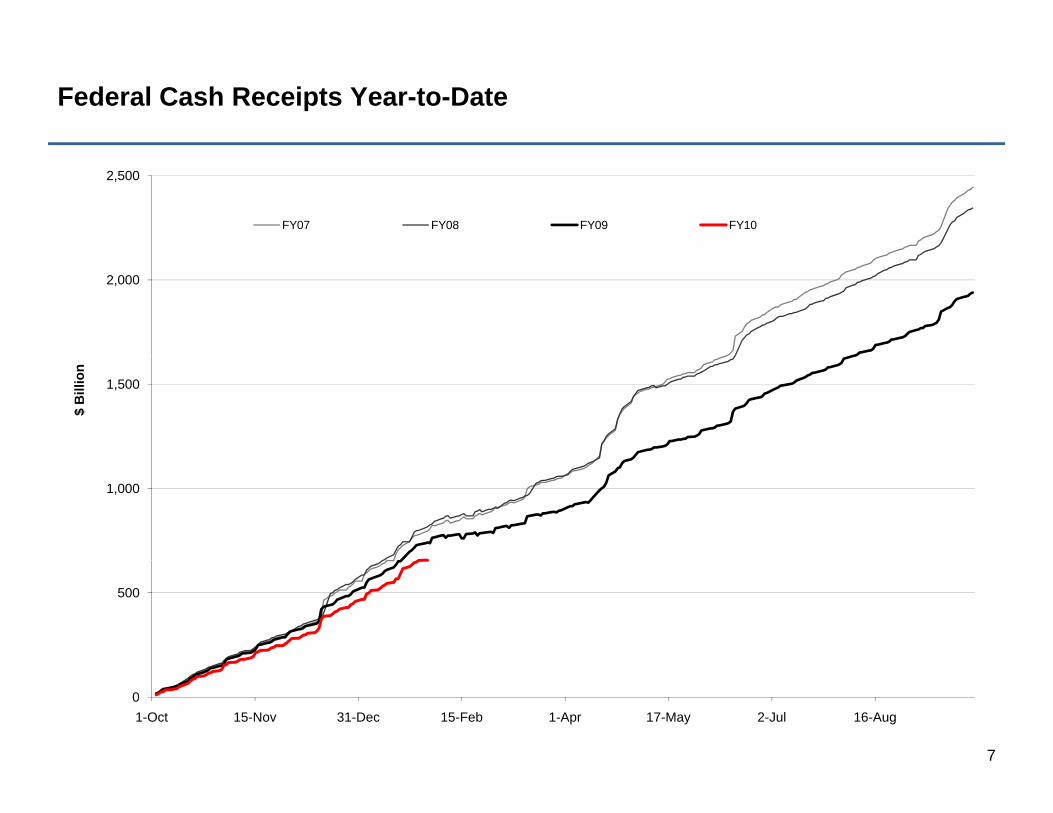
Federal Cash Receipts Year-to-Date
2,500
FY07 FY08 FY09 FY10
2,000
1,500
$ B
illio
n
1,000
500
Office of Debt Management7
01-Oct 15-Nov 31-Dec 15-Feb 1-Apr 17-May 2-Jul 16-Aug
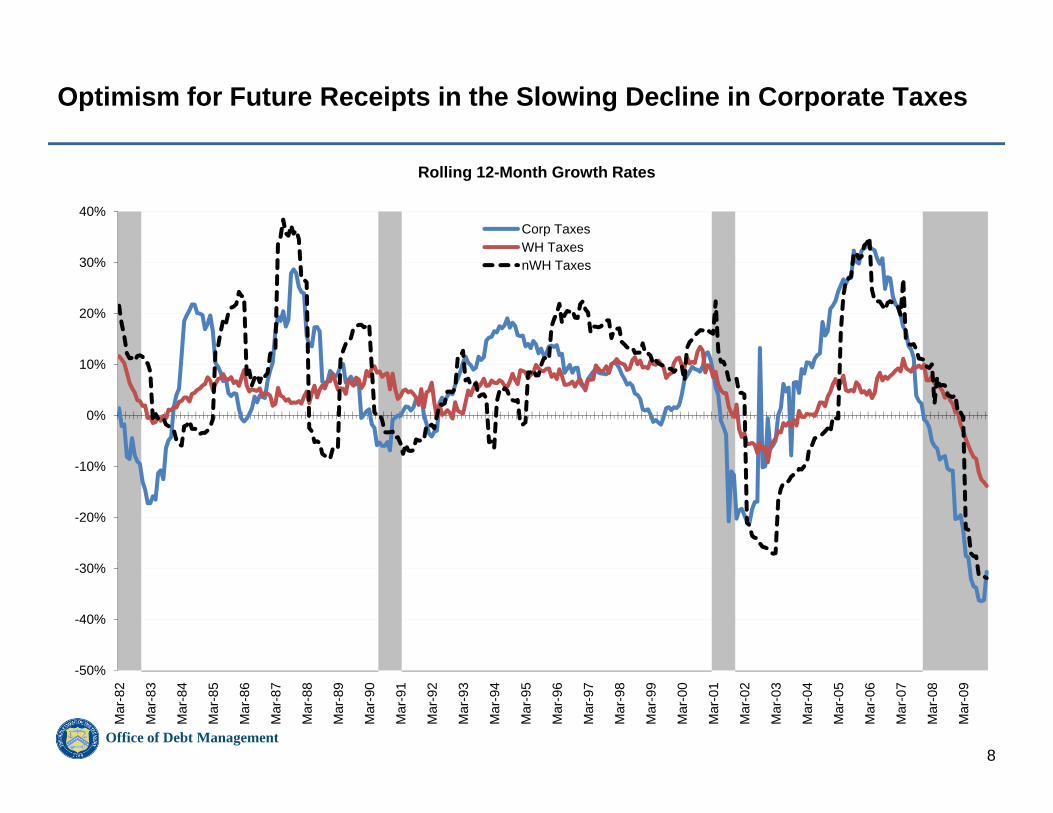
Optimism for Future Receipts in the Slowing Decline in Corporate Taxes
40%
Rolling 12-Month Growth Rates
Corp TaxesWH Taxes
20%
30% nWH Taxes
0%
10%
-20%
-10%
-40%
-30%
Office of Debt Management8
-50%
Mar
-82
Mar
-83
Mar
-84
Mar
-85
Mar
-86
Mar
-87
Mar
-88
Mar
-89
Mar
-90
Mar
-91
Mar
-92
Mar
-93
Mar
-94
Mar
-95
Mar
-96
Mar
-97
Mar
-98
Mar
-99
Mar
-00
Mar
-01
Mar
-02
Mar
-03
Mar
-04
Mar
-05
Mar
-06
Mar
-07
Mar
-08
Mar
-09
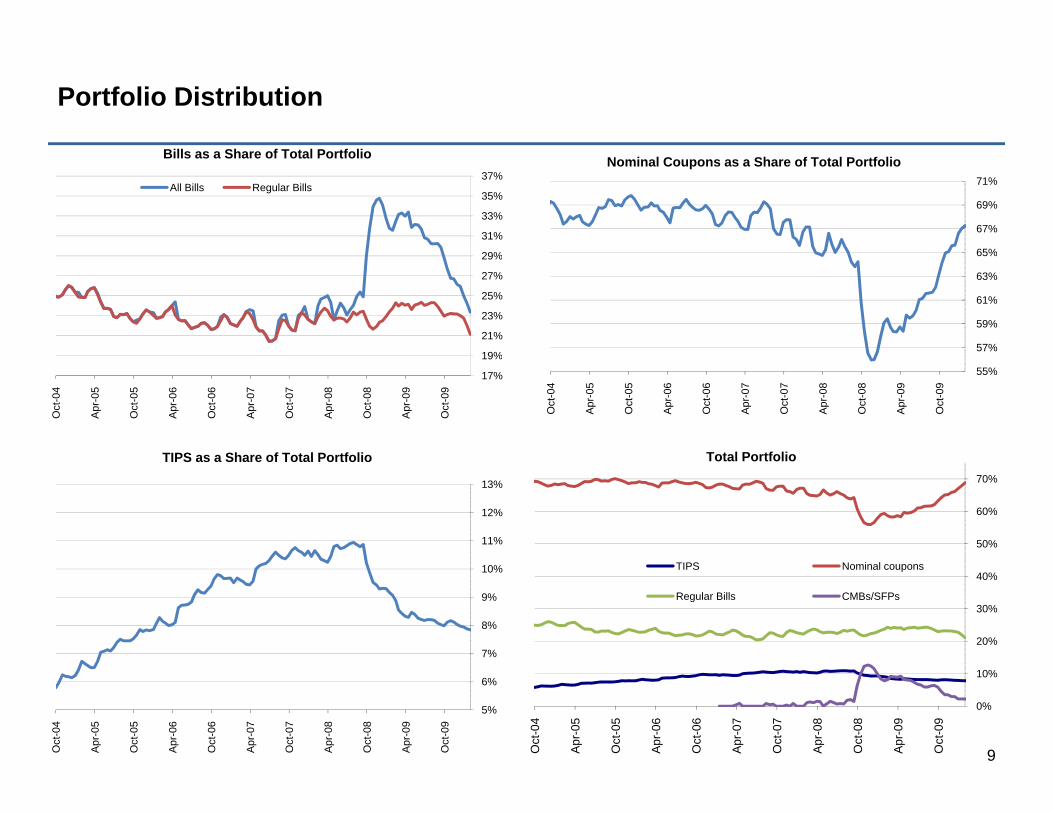
Portfolio Distribution
Bill Sh f T t l P tf li
29%
31%
33%
35%
37%
Bills as a Share of Total Portfolio
All Bills Regular Bills
65%
67%
69%
71%
Nominal Coupons as a Share of Total Portfolio
19%
21%
23%
25%
27%
29%
57%
59%
61%
63%
65%
Total PortfolioTIPS as a Share of Total Portfolio
17%
19%
Oct
-04
Apr
-05
Oct
-05
Apr
-06
Oct
-06
Apr
-07
Oct
-07
Apr
-08
Oct
-08
Apr
-09
Oct
-09
55%
Oct
-04
Apr
-05
Oct
-05
Apr
-06
Oct
-06
Apr
-07
Oct
-07
Apr
-08
Oct
-08
Apr
-09
Oct
-09
50%
60%
70%
Total Portfolio
11%
12%
13%
TIPS as a Share of Total Portfolio
20%
30%
40%TIPS Nominal coupons
Regular Bills CMBs/SFPs
7%
8%
9%
10%
Office of Debt Management9
0%
10%
Oct
-04
Apr
-05
Oct
-05
Apr
-06
Oct
-06
Apr
-07
Oct
-07
Apr
-08
Oct
-08
Apr
-09
Oct
-09
5%
6%
Oct
-04
Apr
-05
Oct
-05
Apr
-06
Oct
-06
Apr
-07
Oct
-07
Apr
-08
Oct
-08
Apr
-09
Oct
-09
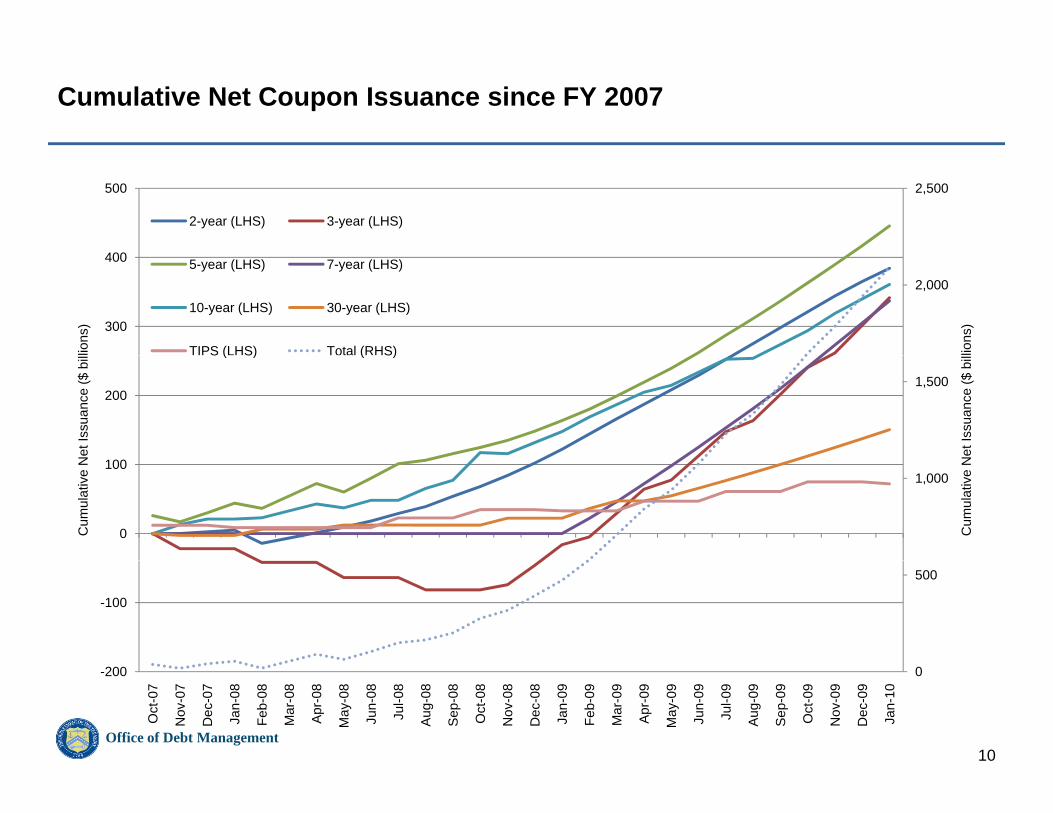
Cumulative Net Coupon Issuance since FY 2007
2,500
400
500
2-year (LHS) 3-year (LHS)
2,000
300
400
lions
)
lions
)
5-year (LHS) 7-year (LHS)
10-year (LHS) 30-year (LHS)
TIPS (LHS) Total (RHS)
1,500200
Net
Issu
ance
($ b
il
Net
Issu
ance
($ b
il S ( S) ( S)
1,000
0
100
Cum
ulat
ive
N
Cum
ulat
ive
N
500
-100
Office of Debt Management10
0-200
Oct
-07
Nov
-07
Dec
-07
Jan-
08
Feb-
08
Mar
-08
Apr
-08
May
-08
Jun-
08
Jul-0
8
Aug
-08
Sep
-08
Oct
-08
Nov
-08
Dec
-08
Jan-
09
Feb-
09
Mar
-09
Apr
-09
May
-09
Jun-
09
Jul-0
9
Aug
-09
Sep
-09
Oct
-09
Nov
-09
Dec
-09
Jan-
10
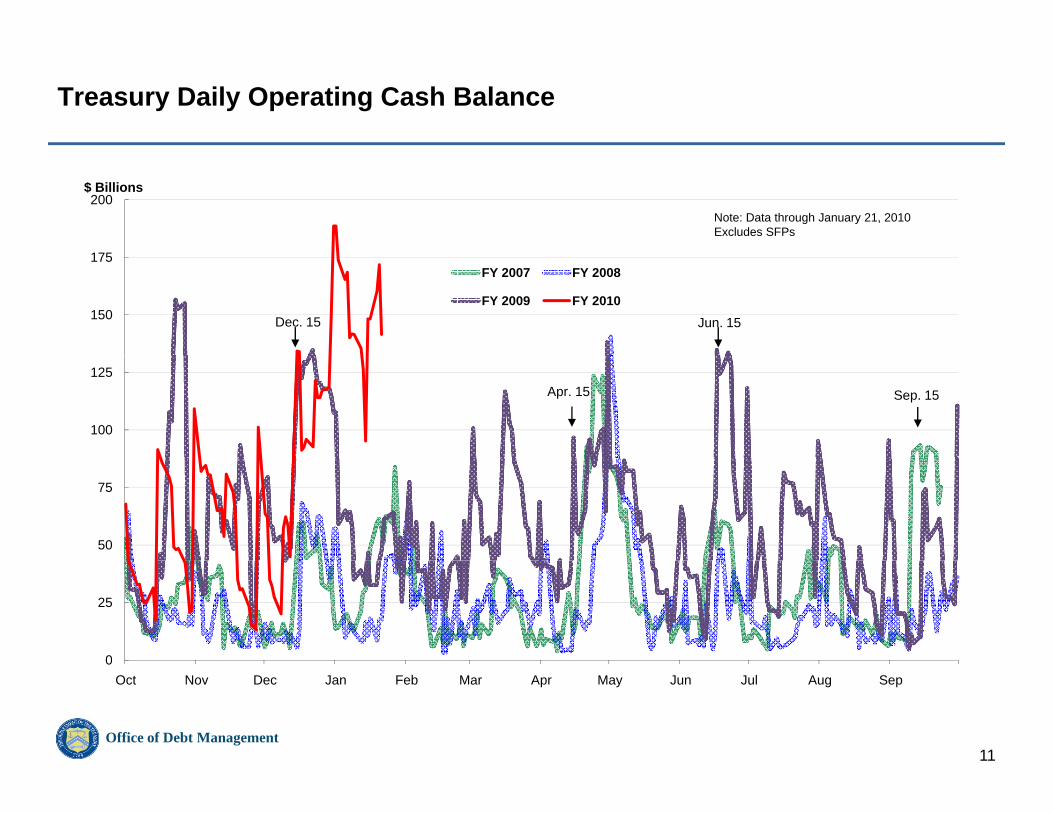
Treasury Daily Operating Cash Balance
175
200$ Billions
Note: Data through January 21, 2010Excludes SFPs
150
175FY 2007 FY 2008
FY 2009 FY 2010Dec. 15 Jun. 15
100
125
Sep. 15Apr. 15
50
75
0
25
Office of Debt Management11
0Oct Nov Dec Jan Feb Mar Apr May Jun Jul Aug Sep
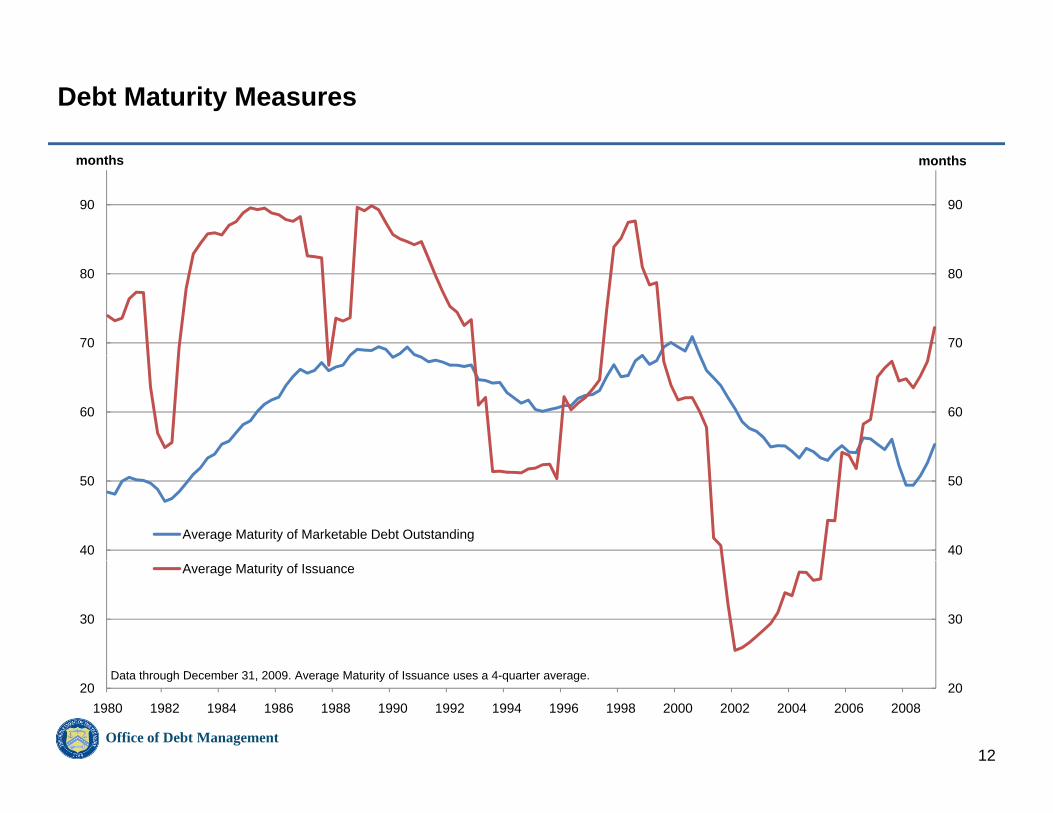
Debt Maturity Measures
9090
monthsmonths
70
80
70
80
6060
40
50
40
50
Average Maturity of Marketable Debt Outstanding
3030
Average Maturity of Issuance
Office of Debt Management12
20201980 1982 1984 1986 1988 1990 1992 1994 1996 1998 2000 2002 2004 2006 2008
Data through December 31, 2009. Average Maturity of Issuance uses a 4-quarter average.
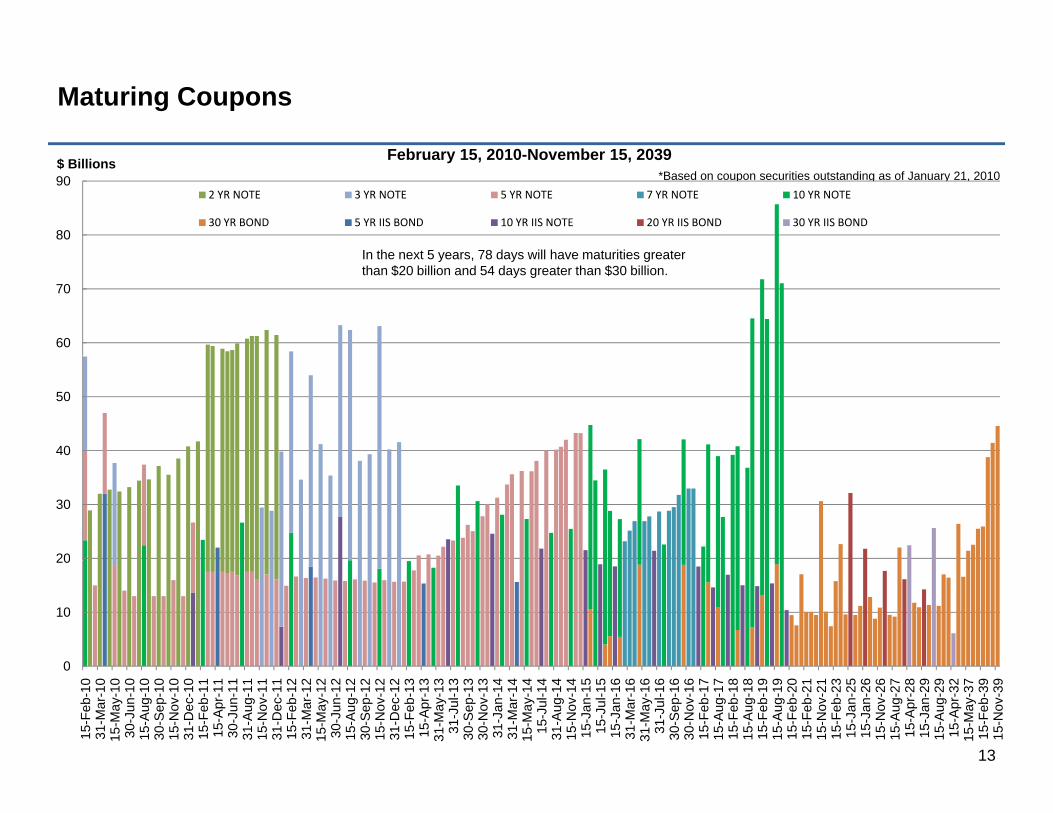
Maturing Coupons
F b 15 2010 N b 15 2039
80
90$ Billions February 15, 2010-November 15, 2039
2 YR NOTE 3 YR NOTE 5 YR NOTE 7 YR NOTE 10 YR NOTE
30 YR BOND 5 YR IIS BOND 10 YR IIS NOTE 20 YR IIS BOND 30 YR IIS BOND
*Based on coupon securities outstanding as of January 21, 2010
In the next 5 years 78 days will have maturities greater
60
70
In the next 5 years, 78 days will have maturities greater than $20 billion and 54 days greater than $30 billion.
40
50
20
30
0
10
20
Office of Debt Management13
0
15-F
eb-1
031
-Mar
-10
15-M
ay-1
030
-Jun
-10
15-A
ug-1
030
-Sep
-10
15-N
ov-1
031
-Dec
-10
15-F
eb-1
115
-Apr
-11
30-J
un-1
131
-Aug
-11
15-N
ov-1
131
-Dec
-11
15-F
eb-1
231
-Mar
-12
15-M
ay-1
230
-Jun
-12
15-A
ug-1
230
-Sep
-12
15-N
ov-1
231
-Dec
-12
15-F
eb-1
315
-Apr
-13
31-M
ay-1
331
-Jul
-13
30-S
ep-1
330
-Nov
-13
31-J
an-1
431
-Mar
-14
15-M
ay-1
415
-Jul
-14
31-A
ug-1
415
-Nov
-14
15-J
an-1
515
-Jul
-15
15-J
an-1
631
-Mar
-16
31-M
ay-1
631
-Jul
-16
30-S
ep-1
630
-Nov
-16
15-F
eb-1
715
-Aug
-17
15-F
eb-1
815
-Aug
-18
15-F
eb-1
915
-Aug
-19
15-F
eb-2
015
-Feb
-21
15-N
ov-2
115
-Feb
-23
15-J
an-2
515
-Jan
-26
15-N
ov-2
615
-Aug
-27
15-A
pr-2
815
-Jan
-29
15-A
ug-2
915
-Apr
-32
15-M
ay-3
715
-Feb
-39
15-N
ov-3
9
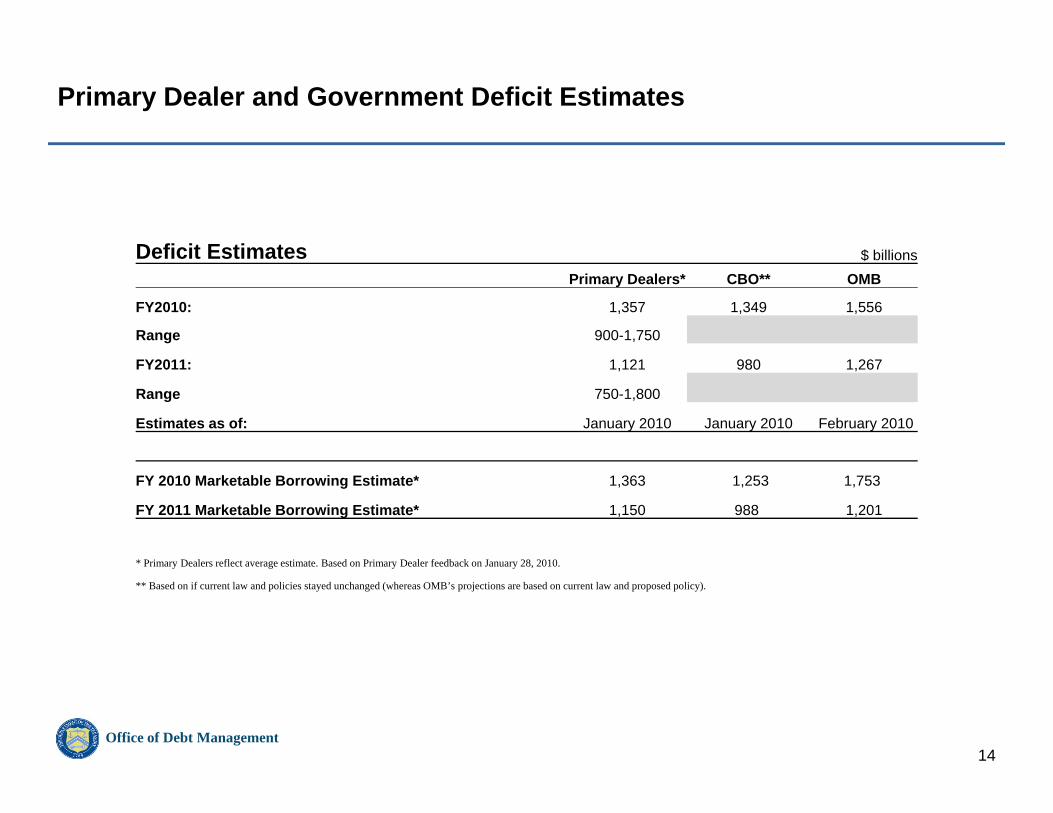
Primary Dealer and Government Deficit Estimates
Deficit Estimates $ billionsDeficit Estimates $ billionsPrimary Dealers* CBO** OMB
FY2010: 1,357 1,349 1,556
Range 900-1,750
FY2011: 1,121 980 1,267
Range 750-1,800
Estimates as of: January 2010 January 2010 February 2010
FY 2010 Marketable Borrowing Estimate* 1,363 1,253 1,753
FY 2011 Marketable Borrowing Estimate* 1,150 988 1,201
* P i D l fl t ti t B d P i D l f db k J 28 2010* Primary Dealers reflect average estimate. Based on Primary Dealer feedback on January 28, 2010.
** Based on if current law and policies stayed unchanged (whereas OMB’s projections are based on current law and proposed policy).
Office of Debt Management14
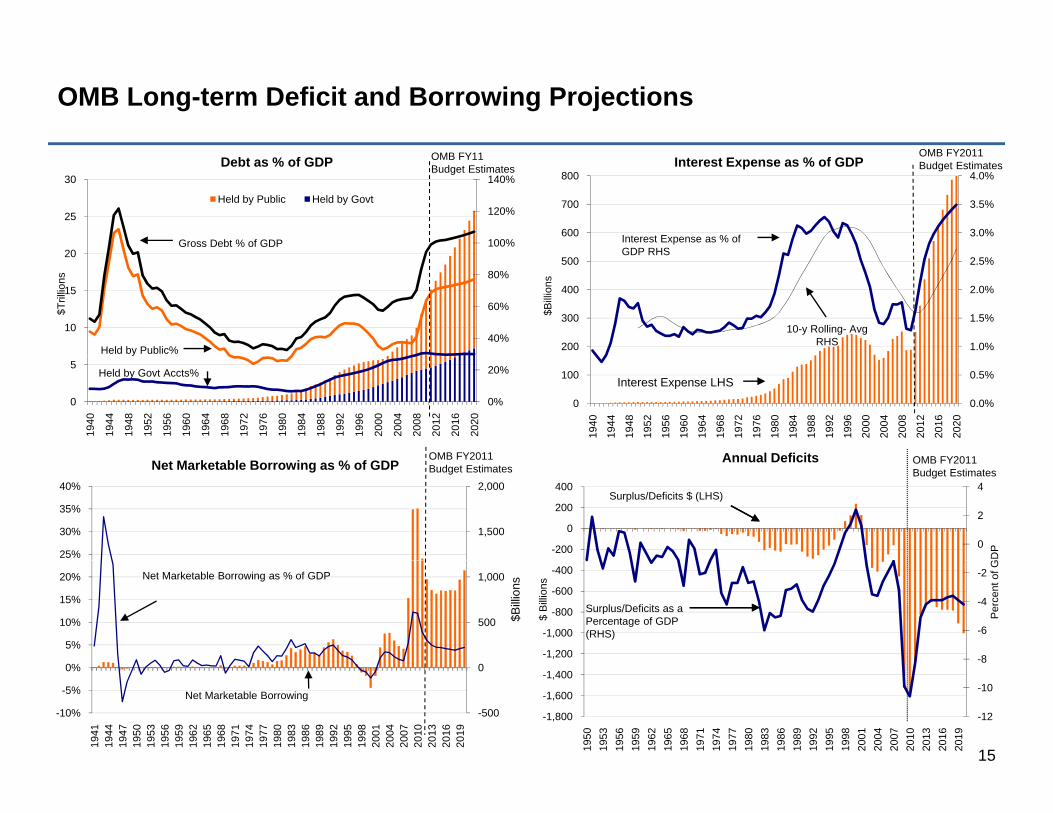
OMB Long-term Deficit and Borrowing Projections
OMB FY2011
3.0%
3.5%
4.0%
600
700
800Interest Expense as % of GDP
OMB FY2011 Budget Estimates
Interest Expense as % of GDP RHS
100%
120%
140%
20
25
30Debt as % of GDP
Held by Public Held by Govt
Gross Debt % of GDP
OMB FY11Budget Estimates
1.0%
1.5%
2.0%
2.5%
200
300
400
500
$Bill
ions
GDP RHS
10-y Rolling- AvgRHS40%
60%
80%
10
15
20
Held by Public%
$Tril
lions
0.0%
0.5%
0
100
1940
1944
1948
1952
1956
1960
1964
1968
1972
1976
1980
1984
1988
1992
1996
2000
2004
2008
2012
2016
2020
Interest Expense LHS0%
20%
0
5
1940
1944
1948
1952
1956
1960
1964
1968
1972
1976
1980
1984
1988
1992
1996
2000
2004
2008
2012
2016
2020
y
Held by Govt Accts%
OMB FY2011 Annual Deficits OMB FY2011
1,500
2,000
25%
30%
35%
40%
Net Marketable Borrowing as % of GDPOMB FY2011 Budget Estimates
0
2
4
-200
0
200
400
GD
P
Annual Deficits OMB FY2011 Budget Estimates
Surplus/Deficits $ (LHS)
500
1,000
5%
10%
15%
20%
$Billi
onsNet Marketable Borrowing as % of GDP
-8
-6
-4
-2
-1,200
-1,000
-800
-600
-400
Per
cent
of G
$ B
illio
ns
Surplus/Deficits as a Percentage of GDP (RHS)
Office of Debt Management15
-500
0
1941
1944
1947
1950
1953
1956
1959
1962
1965
1968
1971
1974
1977
1980
1983
1986
1989
1992
1995
1998
2001
2004
2007
2010
2013
2016
2019
-10%
-5%
0%
Net Marketable Borrowing
-12
-10
-1,800
-1,600
-1,400
1950
1953
1956
1959
1962
1965
1968
1971
1974
1977
1980
1983
1986
1989
1992
1995
1998
2001
2004
2007
2010
2013
2016
2019
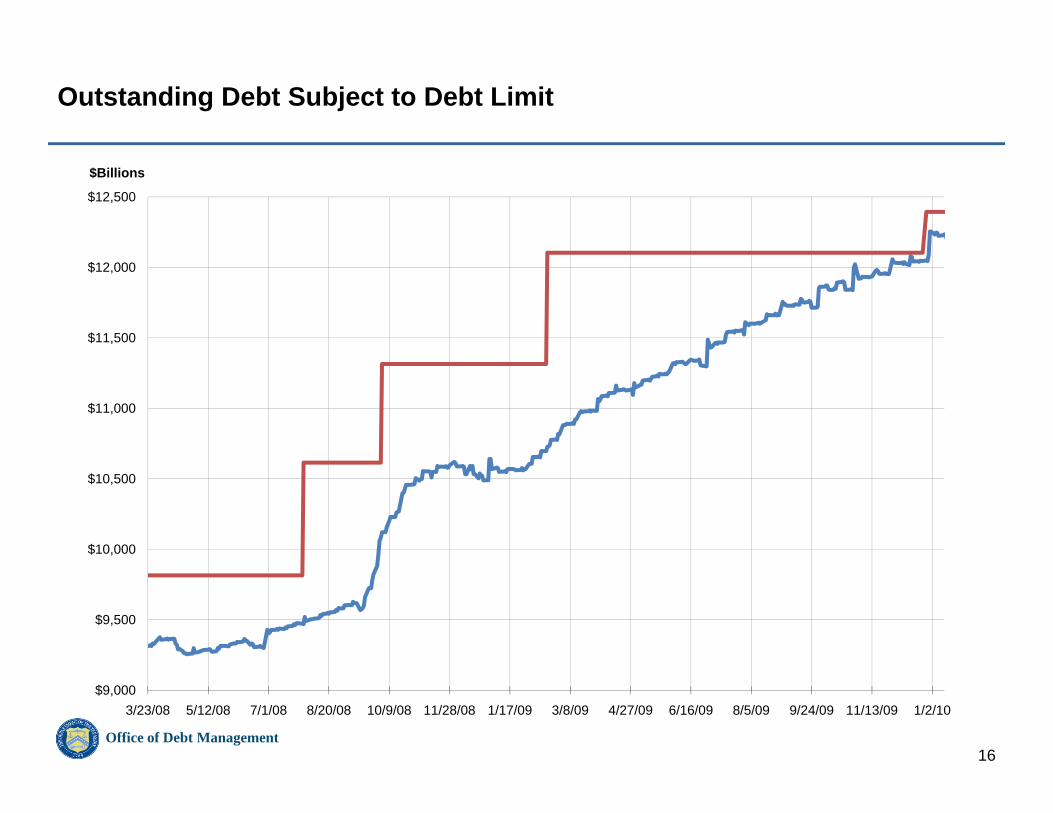
Outstanding Debt Subject to Debt Limit
$12,500
$Billions
$11,500
$12,000
$11,000
$10,000
$10,500
$9,500
Office of Debt Management16
$9,0003/23/08 5/12/08 7/1/08 8/20/08 10/9/08 11/28/08 1/17/09 3/8/09 4/27/09 6/16/09 8/5/09 9/24/09 11/13/09 1/2/10
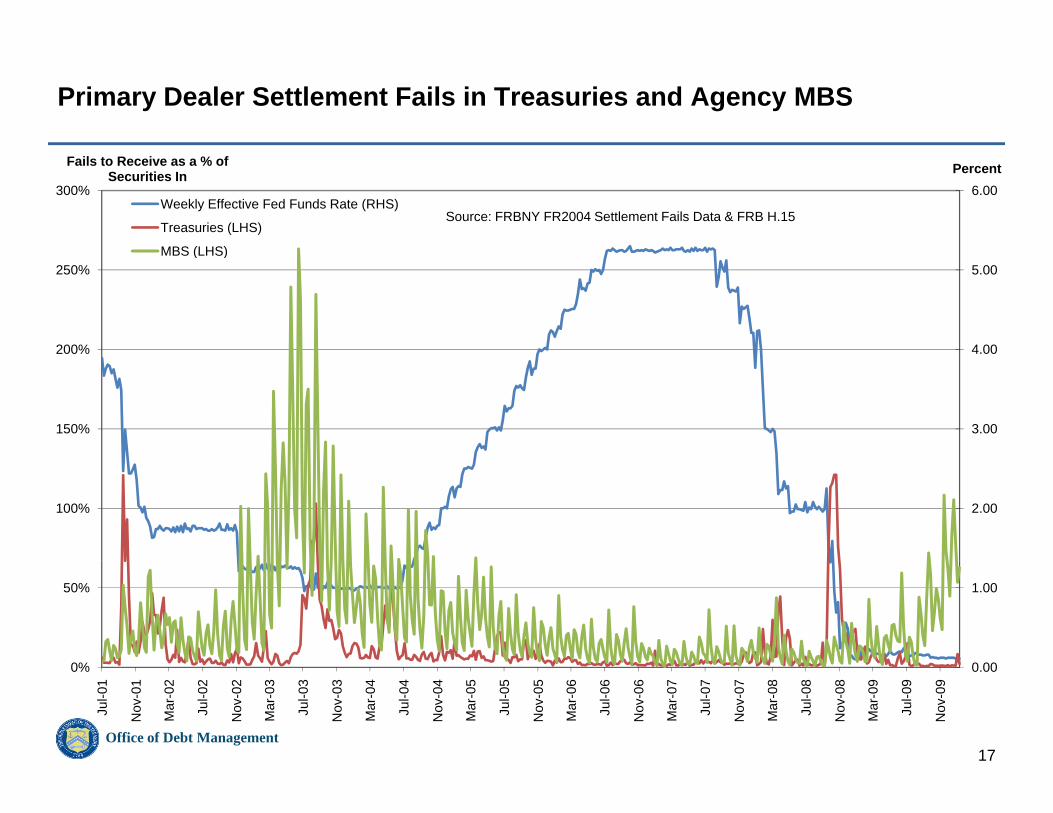
Primary Dealer Settlement Fails in Treasuries and Agency MBS
300% 6.00
Fails to Receive as a % of Securities In Percent
Weekly Effective Fed Funds Rate (RHS)
Treasuries (LHS)
MBS (LHS)
Source: FRBNY FR2004 Settlement Fails Data & FRB H.15
200%
250%
4.00
5.00MBS (LHS)
150% 3.00
100% 2.00
0%
50%
0 00
1.00
Office of Debt Management17
0%
Jul-0
1
Nov
-01
Mar
-02
Jul-0
2
Nov
-02
Mar
-03
Jul-0
3
Nov
-03
Mar
-04
Jul-0
4
Nov
-04
Mar
-05
Jul-0
5
Nov
-05
Mar
-06
Jul-0
6
Nov
-06
Mar
-07
Jul-0
7
Nov
-07
Mar
-08
Jul-0
8
Nov
-08
Mar
-09
Jul-0
9
Nov
-09
0.00

What adjustments to debt issuance if any should Treasury make inWhat adjustments to debt issuance, if any, should Treasury make in consideration of its financing needs in the short, medium, and long term?
Office of Debt Management18

TBAC Presentation to Treasury
February 2, 2010

Global Sovereign Borrowers
February 2, 2010
Global Sovereign BorrowersPlease assess the challenges faced by the global sovereign borrowers over the short, medium and long term. How are these challenges similar or different to the case of the United States?g
3
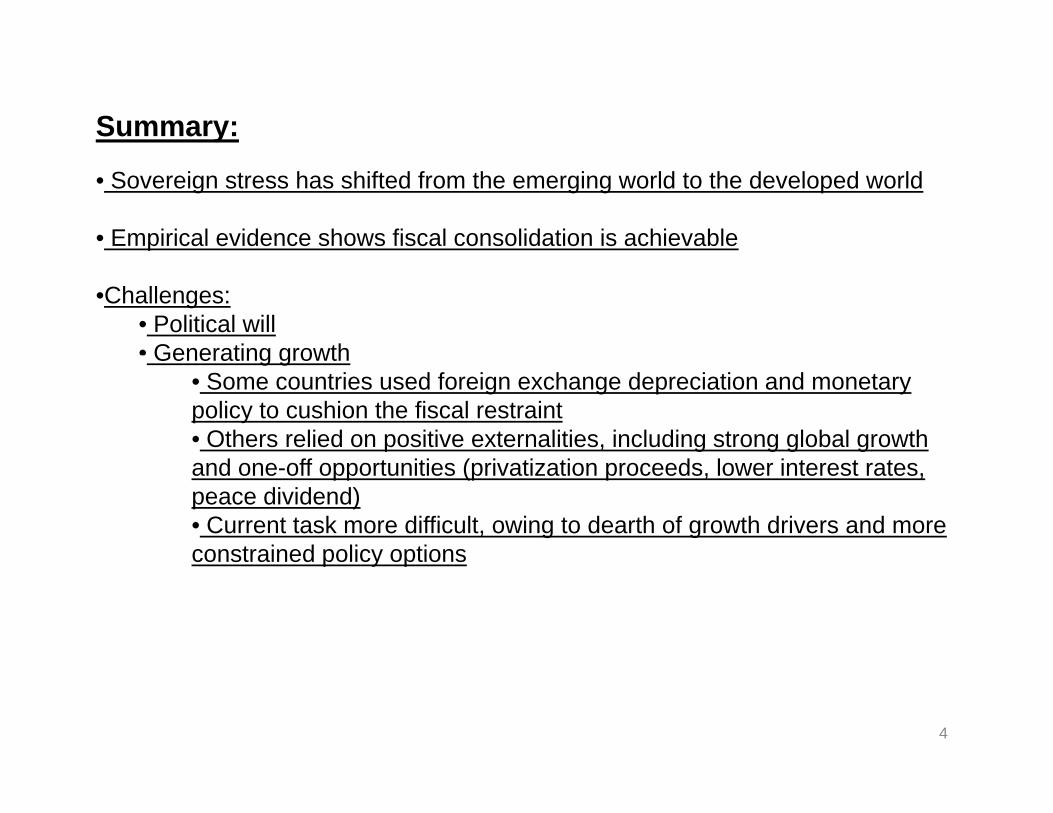
Summary:
• Sovereign stress has shifted from the emerging world to the developed world
• Empirical evidence shows fiscal consolidation is achievable
•Challenges: • Political will• Generating growthGenerating growth
• Some countries used foreign exchange depreciation and monetary policy to cushion the fiscal restraint• Others relied on positive externalities, including strong global growth and one-off opportunities (privatization proceeds, lower interest rates, peace dividend)• Current task more difficult, owing to dearth of growth drivers and more constrained policy optionsconstrained policy options
4
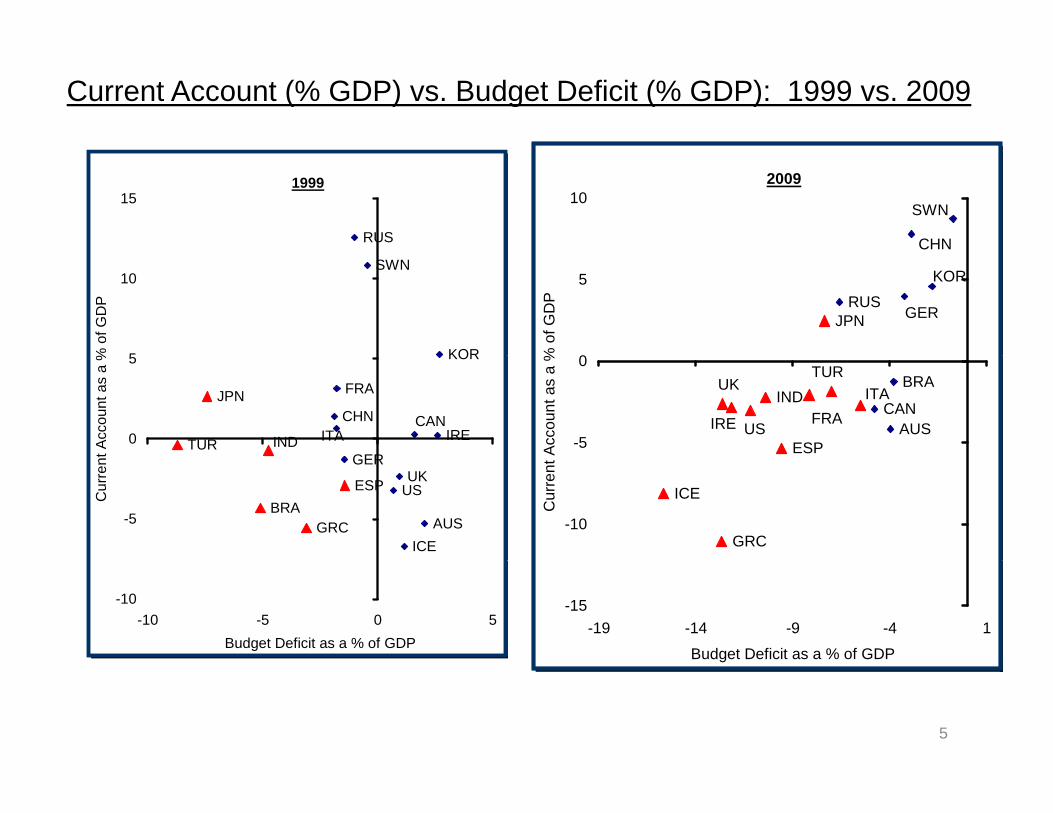
Current Account (% GDP) vs. Budget Deficit (% GDP): 1999 vs. 2009
RUS
151999
CHN
SWN10
2009
SWN
KOR5
10
% o
f GD
P
JPNRUS
GER
KOR
0
5
% o
f GD
P
KOR
GER
CANITA
JPN
TUR IND
FRA
IRECHN
0
5
t Acc
ount
as
a %
USIRE
UKIND
ESP
FRA
TUR
AUSCAN
ITABRA
-5
0
Acc
ount
as
a %
GER
BRAAUS
ESP USUK
GRCICE
-5
Cur
ren
GRC
ICE
-10C
urre
nt
-10-10 -5 0 5
Budget Deficit as a % of GDP
-15-19 -14 -9 -4 1
Budget Deficit as a % of GDP
5
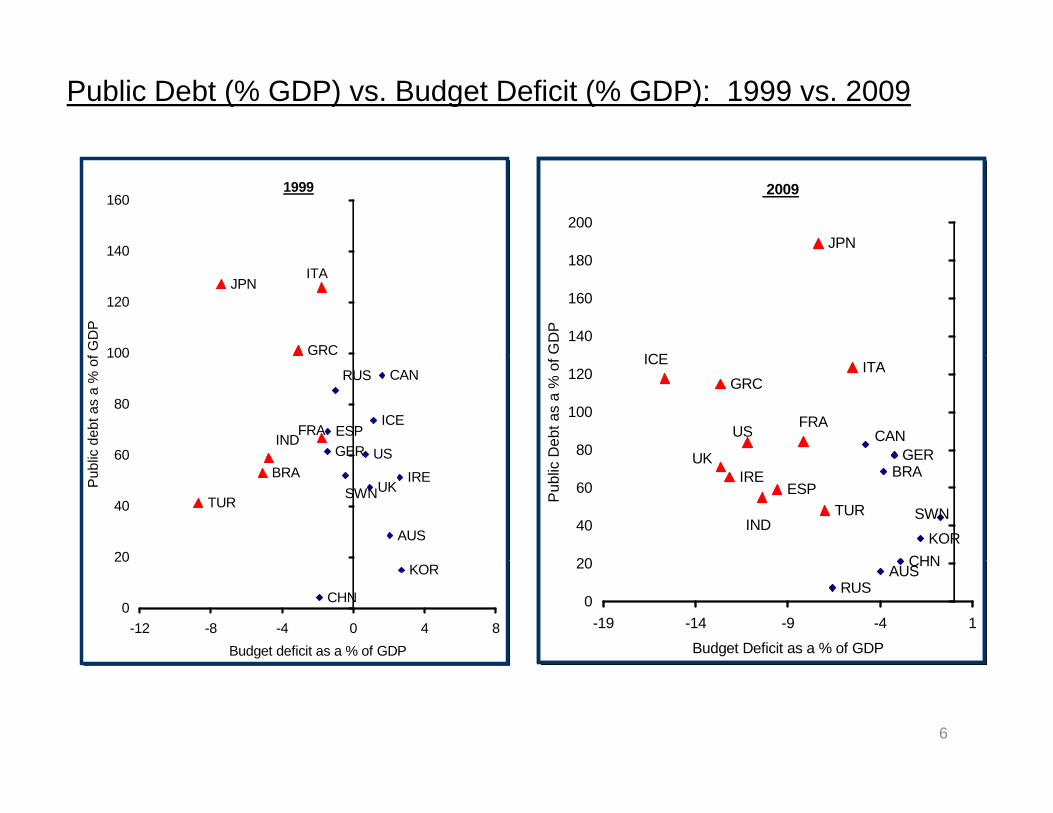
Public Debt (% GDP) vs. Budget Deficit (% GDP): 1999 vs. 2009
140
1601999
JPN200
2009
GRC
ITAJPN
100
120
140
f GD
P
ICE140
160
180
GD
P
INDGERESPFRA
US
ICE
CANRUS
60
80
100
ic d
ebt a
s a
% o
f ICEGRC
UK
US FRA
ITA
CANGER80
100
120
Deb
t as
a %
of
TUR
BRAUS
UK
AUS
IRESWN
20
40
60
Pub
li
ESPIRE
UK
INDTUR
BRAGER
KORSWN
CHN20
40
60Pub
lic
CHN
KOR
0
20
-12 -8 -4 0 4 8Budget deficit as a % of GDP
RUSAUS
CHN
0
20
-19 -14 -9 -4 1
Budget Deficit as a % of GDP
6
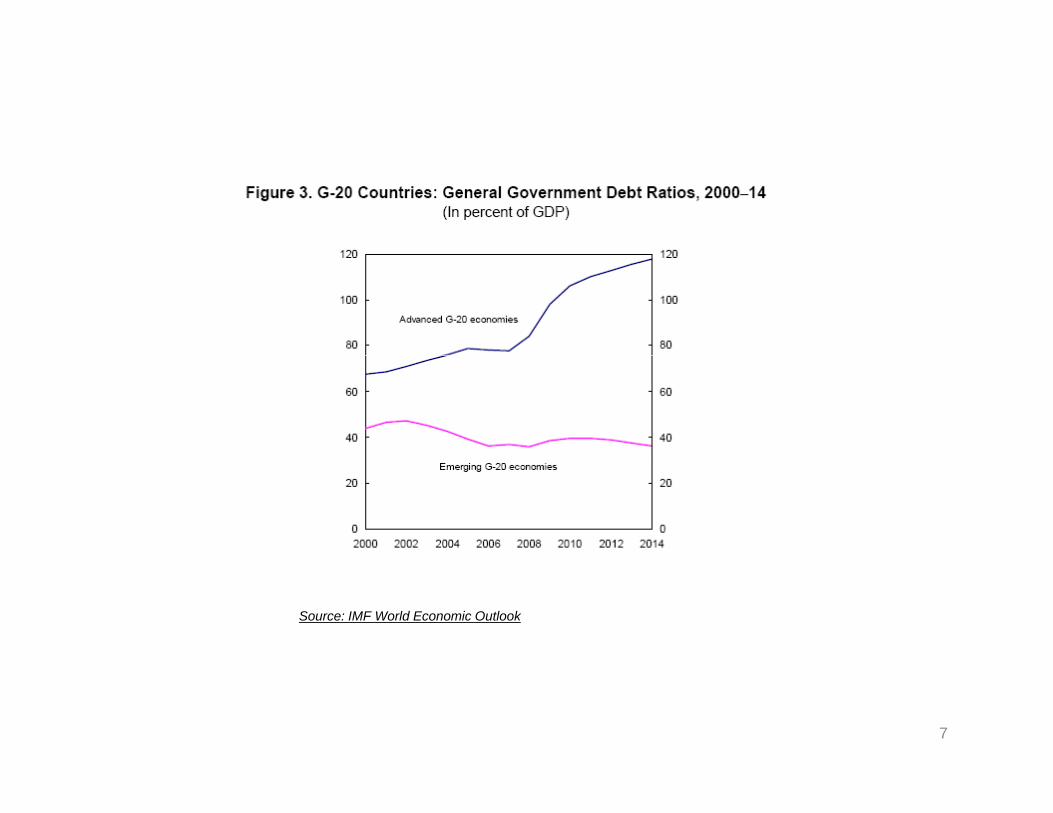
Source: IMF World Economic Outlook
7
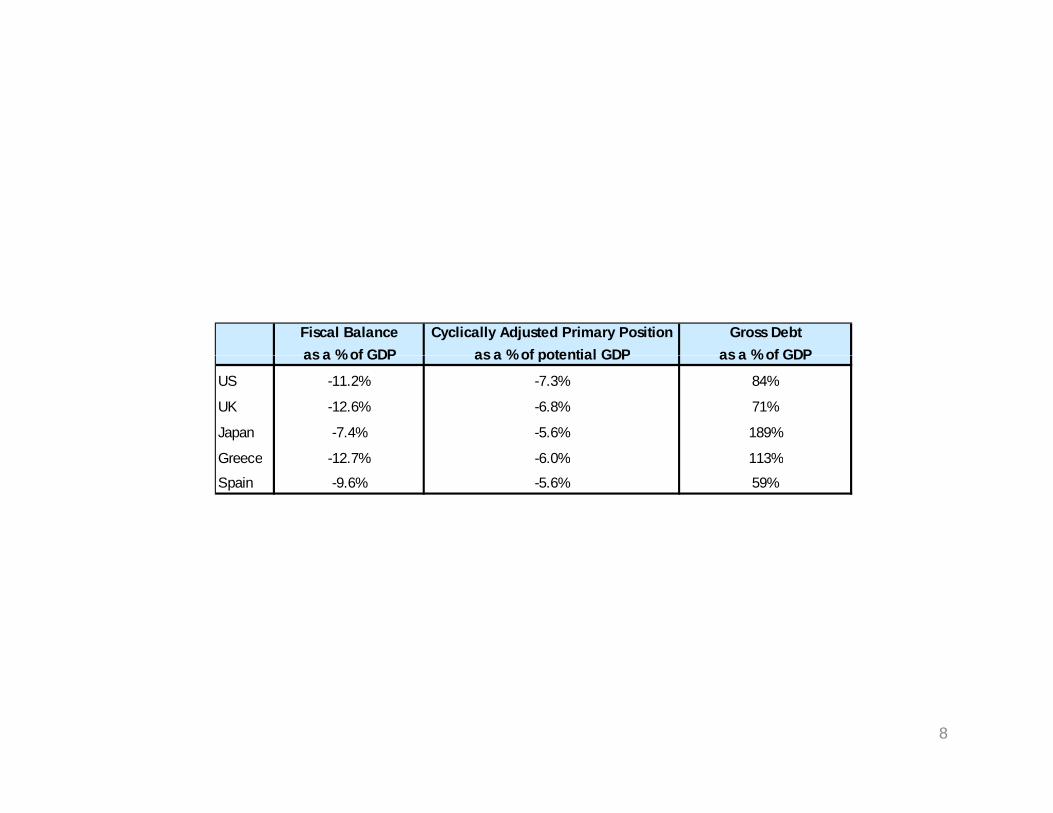
Fiscal Balance Cyclically Adjusted Primary Position Gross Debtas a %of GDP as a %of potential GDP as a %of GDPas a % of GDP as a % of potential GDP as a % of GDP
US -11.2% -7.3% 84%
UK -12.6% -6.8% 71%
Japan -7.4% -5.6% 189%
Greece 12 7% 6 0% 113%Greece -12.7% -6.0% 113%
Spain -9.6% -5.6% 59%
8
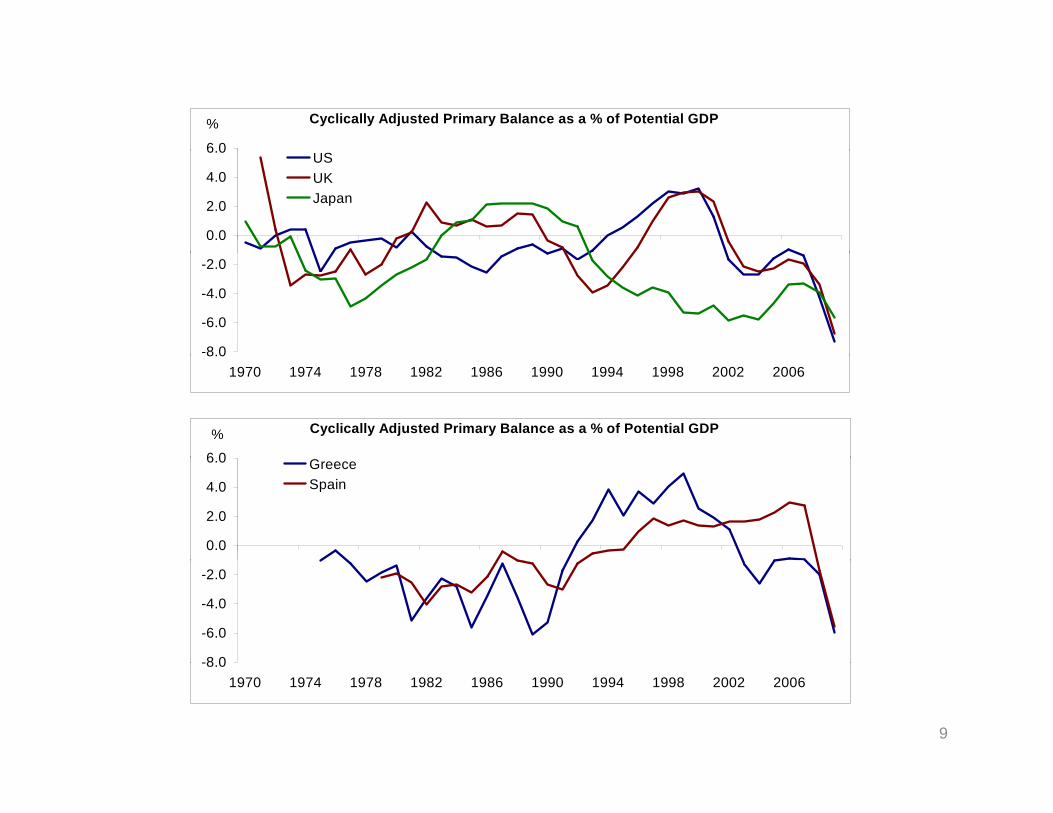
6 0
Cyclically Adjusted Primary Balance as a % of Potential GDP%
0.0
2.0
4.0
6.0USUKJapan
-8.0
-6.0
-4.0
-2.0
8.01970 1974 1978 1982 1986 1990 1994 1998 2002 2006
6 0
Cyclically Adjusted Primary Balance as a % of Potential GDP%
0.0
2.0
4.0
6.0 GreeceSpain
-8 0
-6.0
-4.0
-2.0
-8.01970 1974 1978 1982 1986 1990 1994 1998 2002 2006
9
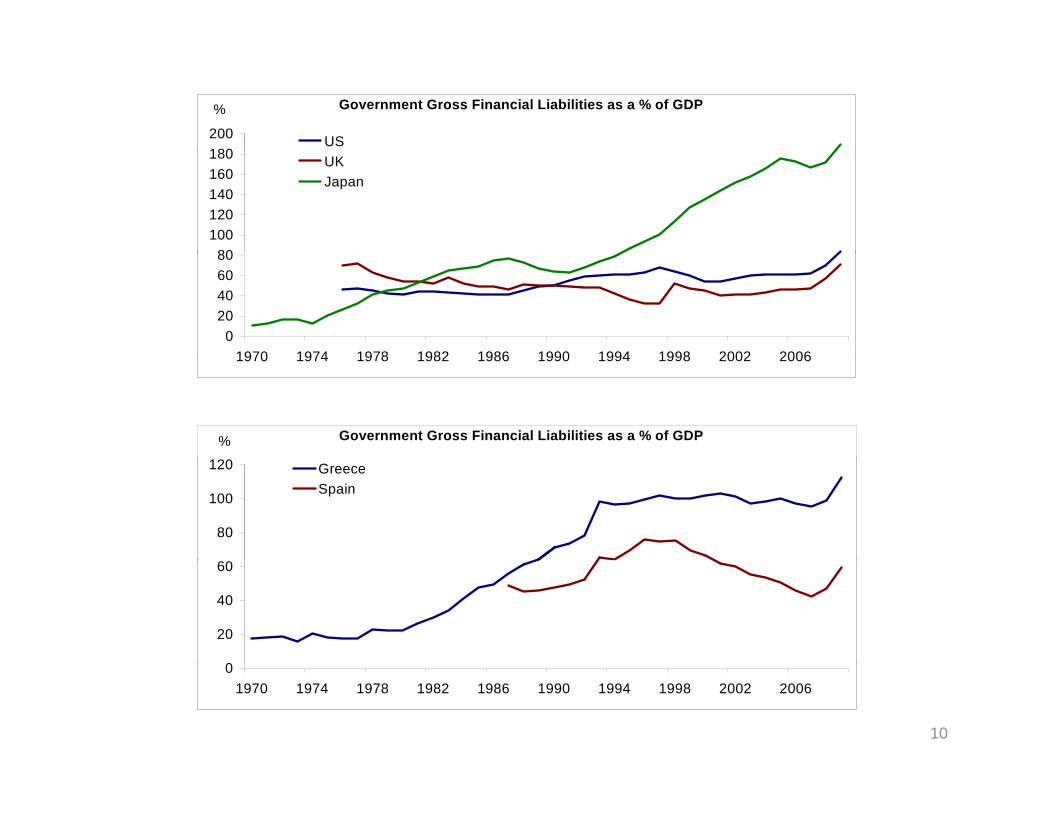
180200 US
Government Gross Financial Liabilities as a % of GDP%
80100120140160180 UK
Japan
020406080
1970 1974 1978 1982 1986 1990 1994 1998 2002 20061970 1974 1978 1982 1986 1990 1994 1998 2002 2006
Government Gross Financial Liabilities as a % of GDP%
80
100
120 GreeceSpain
0
20
40
60
01970 1974 1978 1982 1986 1990 1994 1998 2002 2006
10
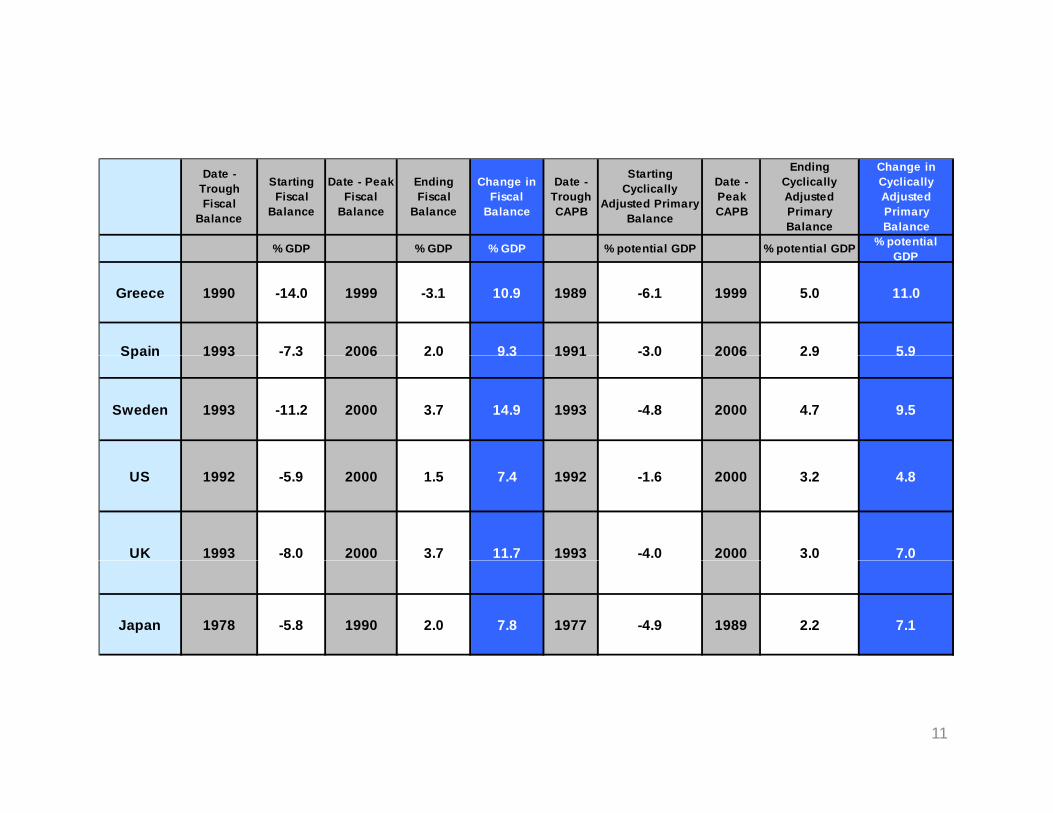
Date - Trough Fiscal
Balance
Starting Fiscal
Balance
Date - Peak Fiscal
Balance
Ending Fiscal
Balance
Change in Fiscal
Balance
Date - Trough CAPB
Starting Cyclically
Adjusted Primary Balance
Date - Peak CAPB
Ending Cyclically Adjusted Primary Balance
Change in Cyclically Adjusted Primary Balance
% GDP % GDP % GDP % potential GDP % potential GDP % potential GDPp p GDP
Greece 1990 -14.0 1999 -3.1 10.9 1989 -6.1 1999 5.0 11.0
Spain 1993 -7.3 2006 2.0 9.3 1991 -3.0 2006 2.9 5.9Spain 1993 7.3 2006 2.0 9.3 1991 3.0 2006 2.9 5.9
Sweden 1993 -11.2 2000 3.7 14.9 1993 -4.8 2000 4.7 9.5
US 1992 -5.9 2000 1.5 7.4 1992 -1.6 2000 3.2 4.8
UK 1993 -8.0 2000 3.7 11.7 1993 -4.0 2000 3.0 7.0
Japan 1978 -5.8 1990 2.0 7.8 1977 -4.9 1989 2.2 7.1
11
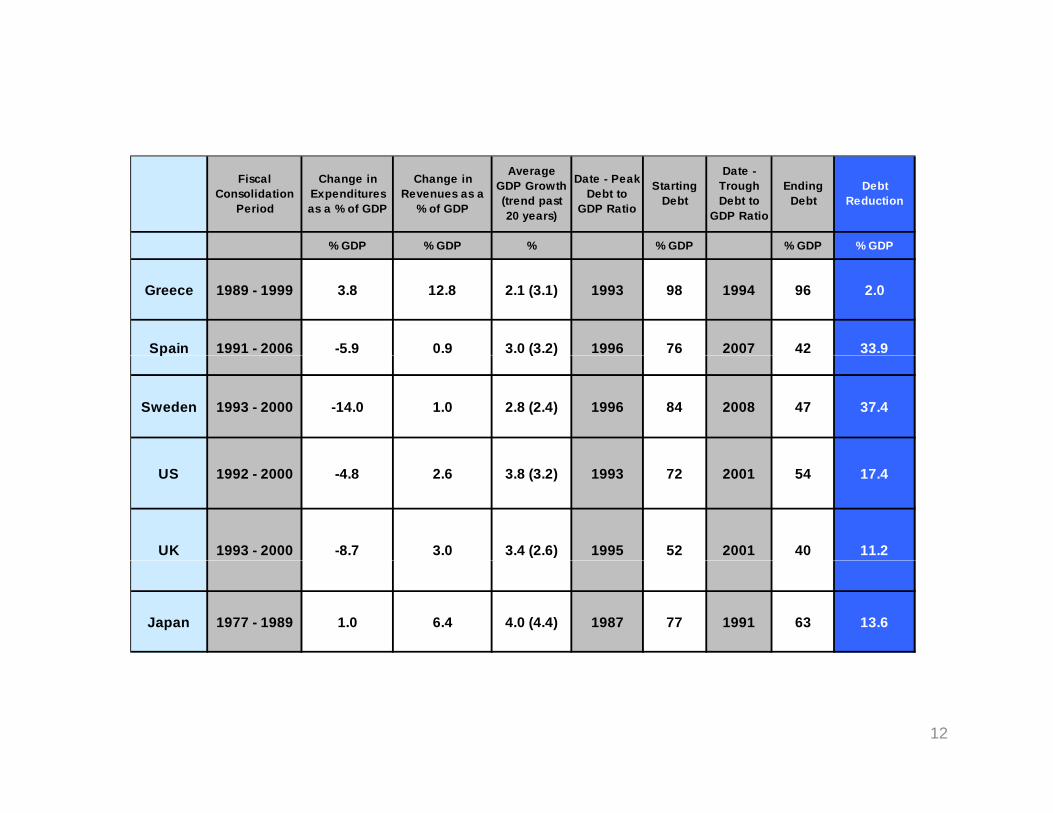
Fiscal Consolidation
Period
Change in Expenditures as a % of GDP
Change in Revenues as a
% of GDP
Average GDP Growth (trend past 20 years)
Date - Peak Debt to
GDP Ratio
Starting Debt
Date - Trough Debt to
GDP Ratio
Ending Debt
Debt Reduction
% GDP % GDP % % GDP % GDP % GDP
Greece 1989 - 1999 3.8 12.8 2.1 (3.1) 1993 98 1994 96 2.0
Spain 1991 - 2006 -5.9 0.9 3.0 (3.2) 1996 76 2007 42 33.9p ( )
Sweden 1993 - 2000 -14.0 1.0 2.8 (2.4) 1996 84 2008 47 37.4
US 1992 - 2000 -4.8 2.6 3.8 (3.2) 1993 72 2001 54 17.4
UK 1993 - 2000 -8.7 3.0 3.4 (2.6) 1995 52 2001 40 11.2
Japan 1977 - 1989 1.0 6.4 4.0 (4.4) 1987 77 1991 63 13.6
12
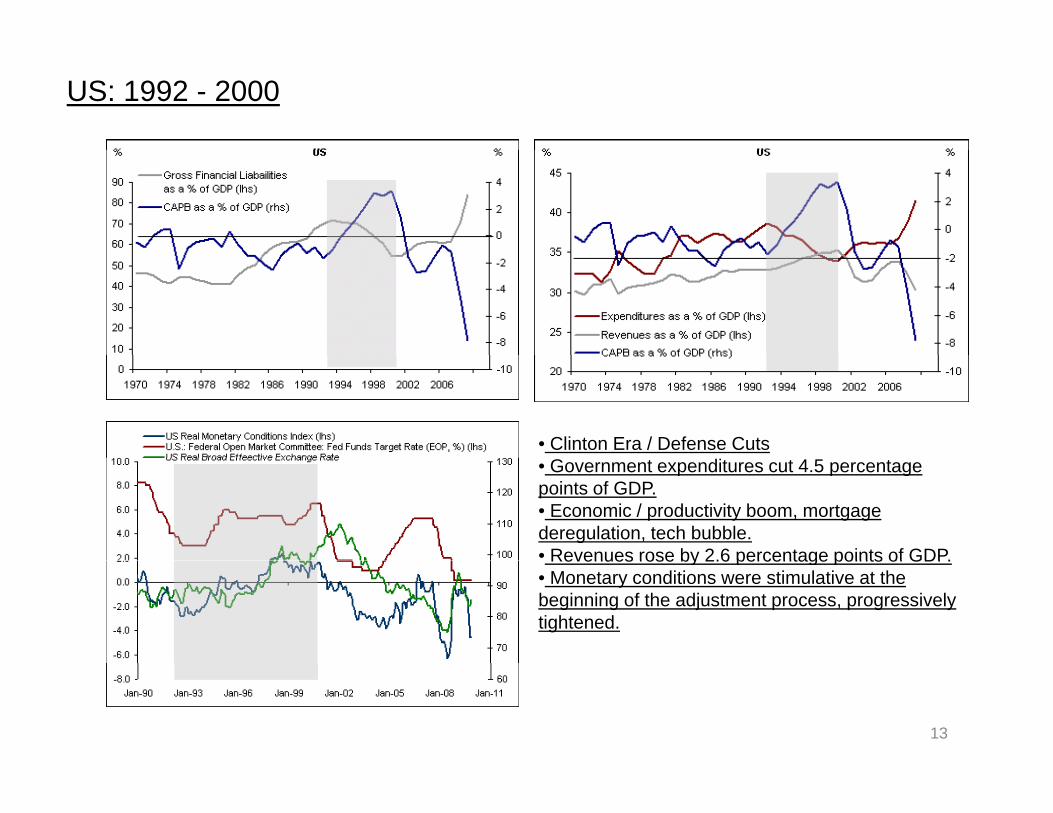
US: 1992 - 2000
• Clinton Era / Defense Cuts• Government expenditures cut 4.5 percentage points of GDP.• Economic / productivity boom, mortgage deregulation, tech bubble.• Revenues rose by 2.6 percentage points of GDP.Revenues rose by 2.6 percentage points of GDP.• Monetary conditions were stimulative at the beginning of the adjustment process, progressively tightened.
13
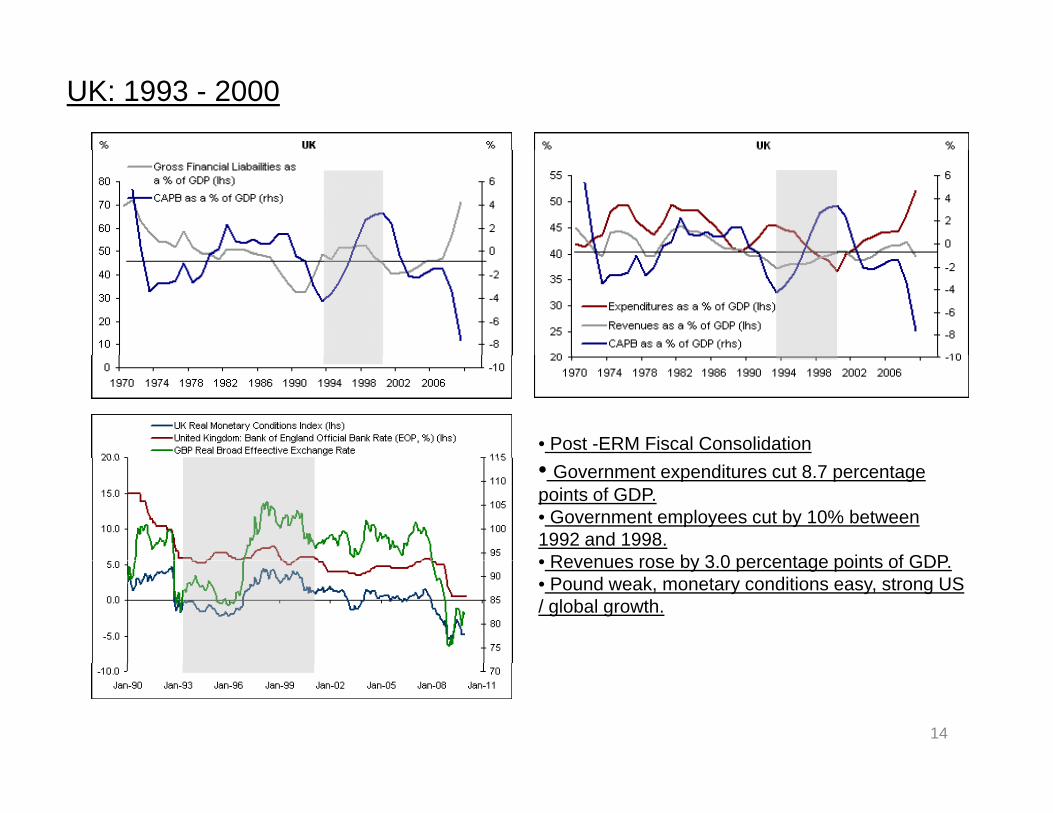
UK: 1993 - 2000
• Post -ERM Fiscal Consolidation• Government expenditures cut 8.7 percentage points of GDP.• Government employees cut by 10% between 1992 and 1998.• Revenues rose by 3 0 percentage points of GDP• Revenues rose by 3.0 percentage points of GDP.• Pound weak, monetary conditions easy, strong US / global growth.
14
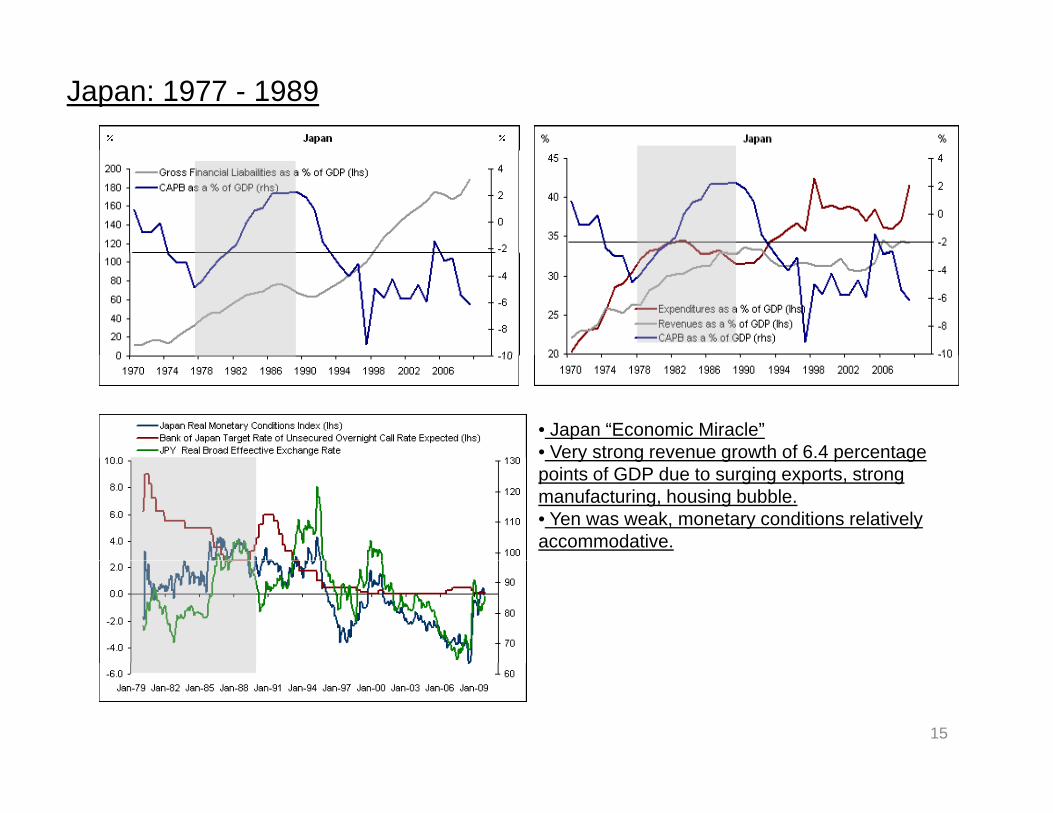
Japan: 1977 - 1989
• Japan “Economic Miracle”• Very strong revenue growth of 6.4 percentage e y st o g e e ue g o t o 6 pe ce tagepoints of GDP due to surging exports, strong manufacturing, housing bubble.• Yen was weak, monetary conditions relatively accommodative.
15
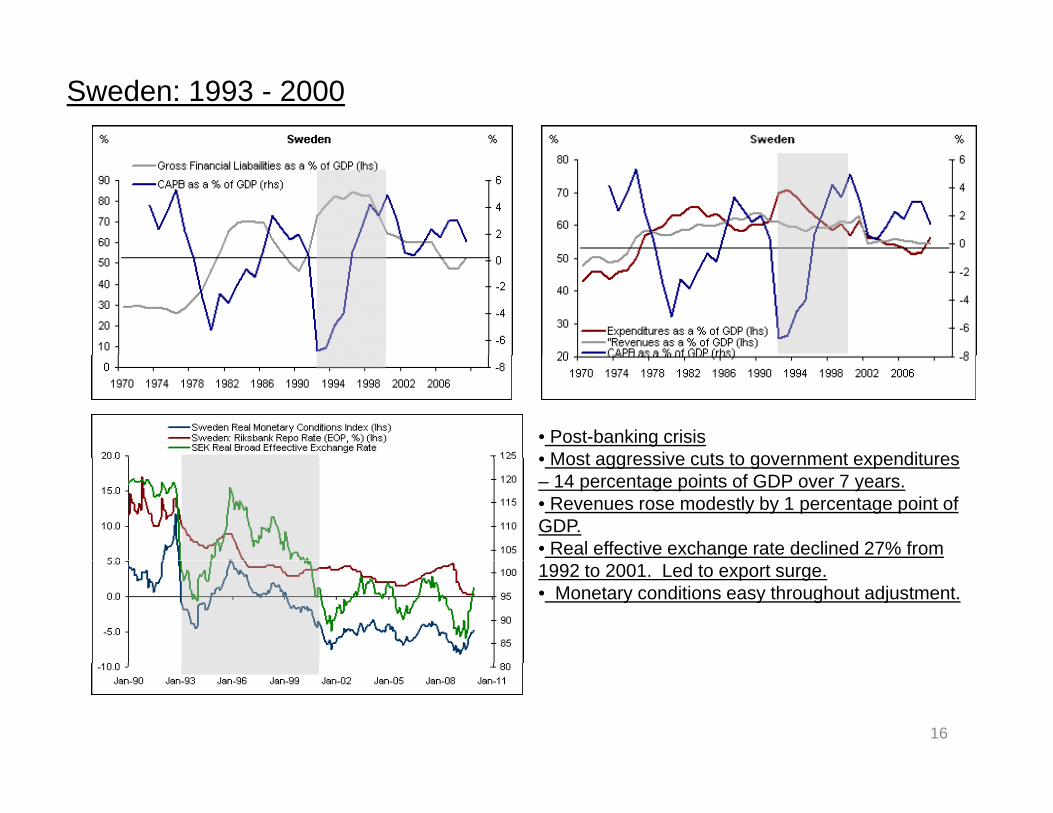
Sweden: 1993 - 2000
• Post-banking crisis• Most aggressive cuts to government expenditures• Most aggressive cuts to government expenditures – 14 percentage points of GDP over 7 years.• Revenues rose modestly by 1 percentage point of GDP.• Real effective exchange rate declined 27% from 1992 to 2001. Led to export surge.• Monetary conditions easy throughout adjustment.
16
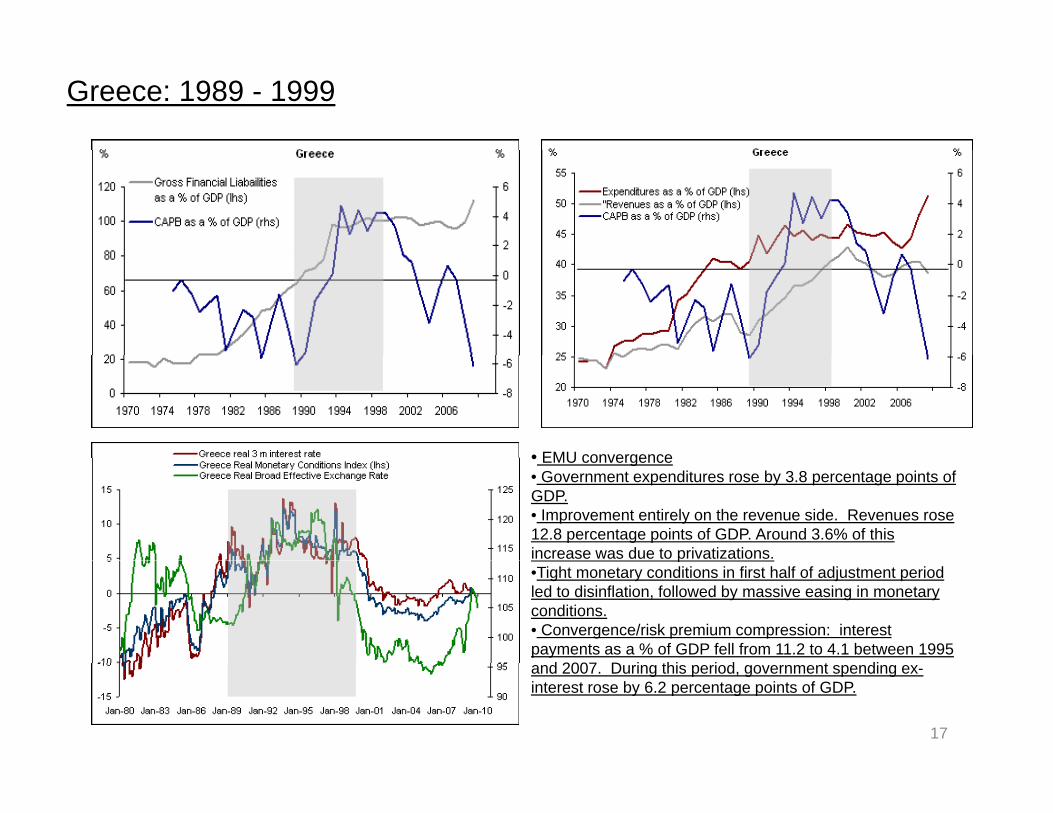
Greece: 1989 - 1999
• EMU convergence• EMU convergence• Government expenditures rose by 3.8 percentage points of GDP.• Improvement entirely on the revenue side. Revenues rose 12.8 percentage points of GDP. Around 3.6% of this increase was due to privatizations. p•Tight monetary conditions in first half of adjustment period led to disinflation, followed by massive easing in monetary conditions.• Convergence/risk premium compression: interest payments as a % of GDP fell from 11.2 to 4.1 between 1995
d 2007 D i thi i d t diand 2007. During this period, government spending ex-interest rose by 6.2 percentage points of GDP.
17
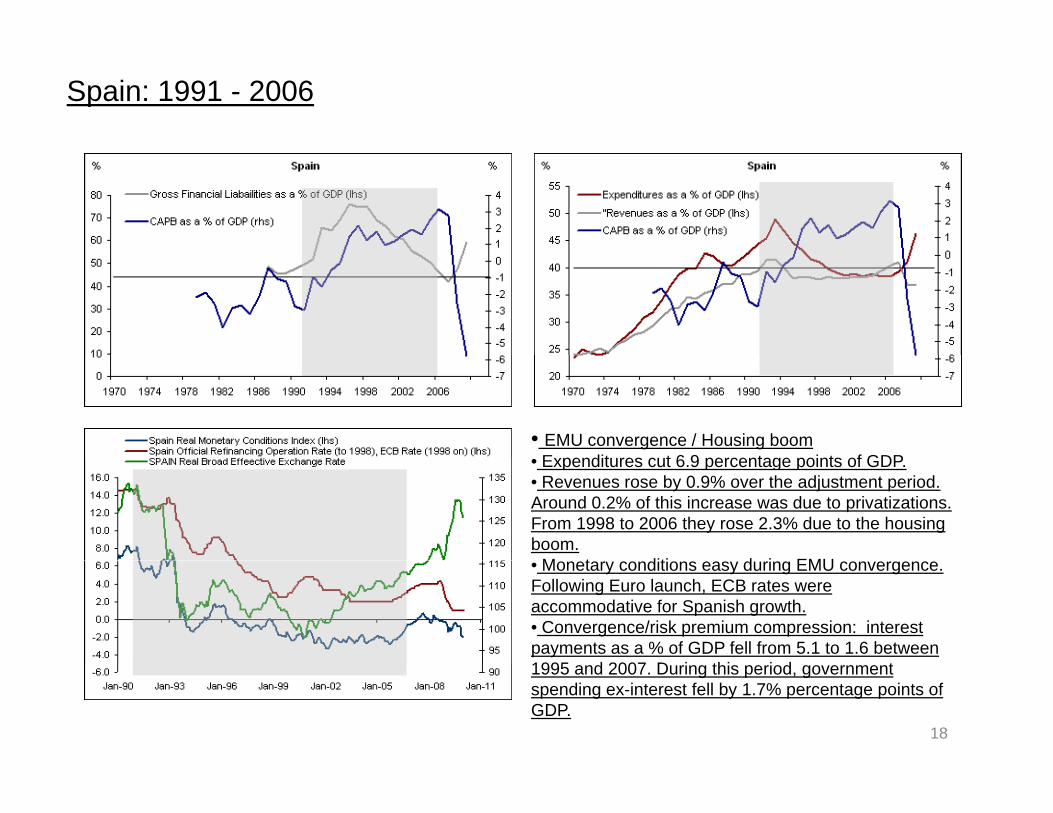
Spain: 1991 - 2006
• EMU convergence / Housing boomExpenditures cut 6 9 percentage points of GDP• Expenditures cut 6.9 percentage points of GDP.
• Revenues rose by 0.9% over the adjustment period. Around 0.2% of this increase was due to privatizations. From 1998 to 2006 they rose 2.3% due to the housing boom.
M t diti d i EMU• Monetary conditions easy during EMU convergence. Following Euro launch, ECB rates were accommodative for Spanish growth.• Convergence/risk premium compression: interest payments as a % of GDP fell from 5.1 to 1.6 between 1995 d 2007 D i thi i d t1995 and 2007. During this period, government spending ex-interest fell by 1.7% percentage points of GDP.
18
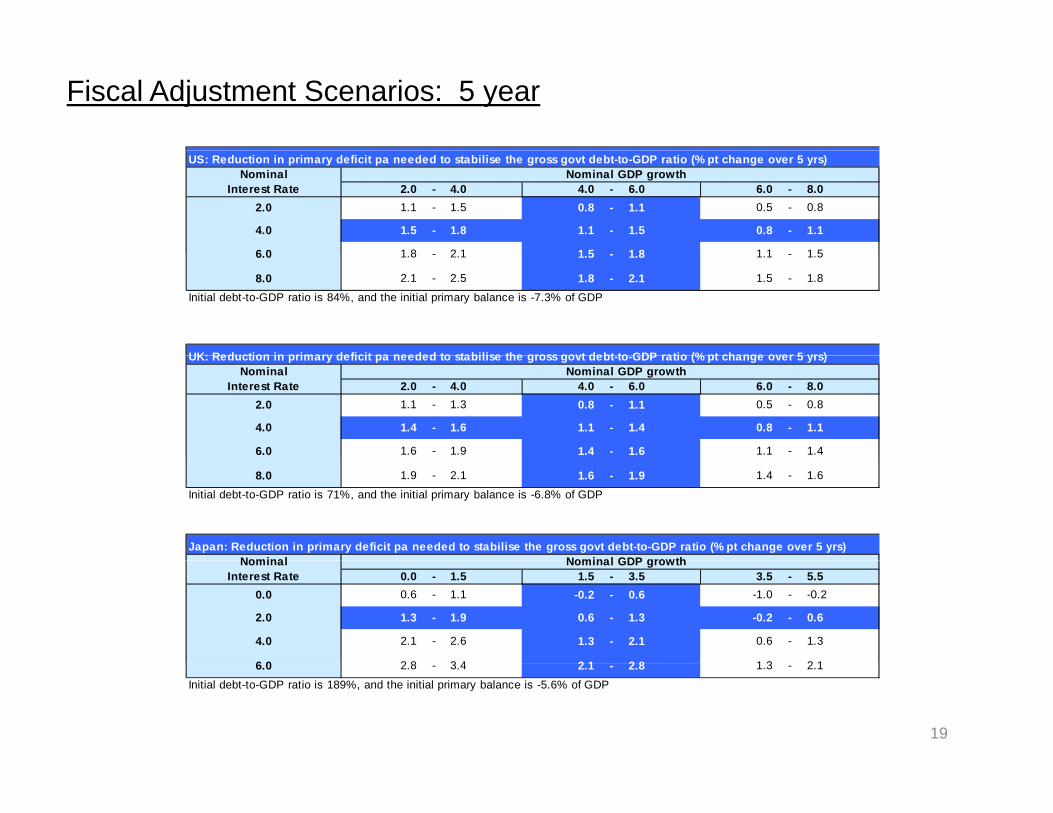
Fiscal Adjustment Scenarios: 5 year
US: Reduction in primary deficit pa needed to stabilise the gross govt debt-to-GDP ratio (% pt change over 5 yrs)Nominal Nominal GDP growth
Interest Rate 2.0 - 4.0 4.0 - 6.0 6.0 - 8.02.0 1.1 - 1.5 0.8 - 1.1 0.5 - 0.8
4.0 1.5 - 1.8 1.1 - 1.5 0.8 - 1.1
6 0 1 8 2 1 1 5 1 8 1 1 1 5
UK: Reduction in primary deficit pa needed to stabilise the gross govt debt to GDP ratio (% pt change over 5 yrs)
6.0 1.8 - 2.1 1.5 - 1.8 1.1 - 1.5
8.0 2.1 - 2.5 1.8 - 2.1 1.5 - 1.8
Initial debt-to-GDP ratio is 84%, and the initial primary balance is -7.3% of GDP
UK: Reduction in primary deficit pa needed to stabilise the gross govt debt-to-GDP ratio (% pt change over 5 yrs)Nominal Nominal GDP growth
Interest Rate 2.0 - 4.0 4.0 - 6.0 6.0 - 8.02.0 1.1 - 1.3 0.8 - 1.1 0.5 - 0.8
4.0 1.4 - 1.6 1.1 - 1.4 0.8 - 1.1
6.0 1.6 - 1.9 1.4 - 1.6 1.1 - 1.4
Japan: Reduction in primary deficit pa needed to stabilise the gross govt debt-to-GDP ratio (% pt change over 5 yrs)Nominal Nominal GDP growth
8.0 1.9 - 2.1 1.6 - 1.9 1.4 - 1.6
Initial debt-to-GDP ratio is 71%, and the initial primary balance is -6.8% of GDP
Nominal Nominal GDP growthInterest Rate 0.0 - 1.5 1.5 - 3.5 3.5 - 5.5
0.0 0.6 - 1.1 -0.2 - 0.6 -1.0 - -0.2
2.0 1.3 - 1.9 0.6 - 1.3 -0.2 - 0.6
4.0 2.1 - 2.6 1.3 - 2.1 0.6 - 1.3
6 0 2 8 3 4 2 1 2 8 1 3 2 16.0 2.8 - 3.4 2.1 - 2.8 1.3 - 2.1
Initial debt-to-GDP ratio is 189%, and the initial primary balance is -5.6% of GDP
19
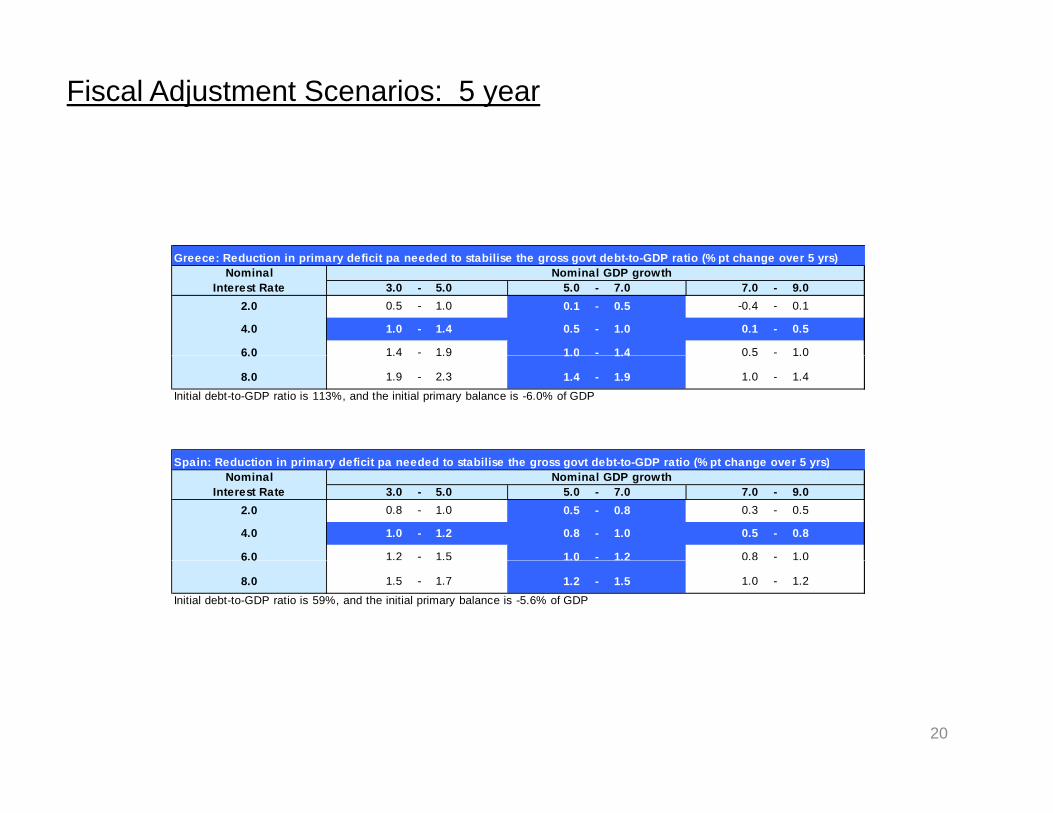
Fiscal Adjustment Scenarios: 5 year
Greece: Reduction in primary deficit pa needed to stabilise the gross govt debt-to-GDP ratio (% pt change over 5 yrs)Nominal Nominal GDP growth
Interest Rate 3.0 - 5.0 5.0 - 7.0 7.0 - 9.02.0 0.5 - 1.0 0.1 - 0.5 -0.4 - 0.1
4.0 1.0 - 1.4 0.5 - 1.0 0.1 - 0.5
6.0 1.4 - 1.9 1.0 - 1.4 0.5 - 1.0
S i R d ti i i d fi it d d t t bili th t d bt t GDP ti (% t h 5 )
6.0 1.4 1.9 1.0 1.4 0.5 1.0
8.0 1.9 - 2.3 1.4 - 1.9 1.0 - 1.4
Initial debt-to-GDP ratio is 113%, and the initial primary balance is -6.0% of GDP
Spain: Reduction in primary deficit pa needed to stabilise the gross govt debt-to-GDP ratio (% pt change over 5 yrs)Nominal Nominal GDP growth
Interest Rate 3.0 - 5.0 5.0 - 7.0 7.0 - 9.02.0 0.8 - 1.0 0.5 - 0.8 0.3 - 0.5
4.0 1.0 - 1.2 0.8 - 1.0 0.5 - 0.8
6.0 1.2 - 1.5 1.0 - 1.2 0.8 - 1.06 0 0
8.0 1.5 - 1.7 1.2 - 1.5 1.0 - 1.2
Initial debt-to-GDP ratio is 59%, and the initial primary balance is -5.6% of GDP
20
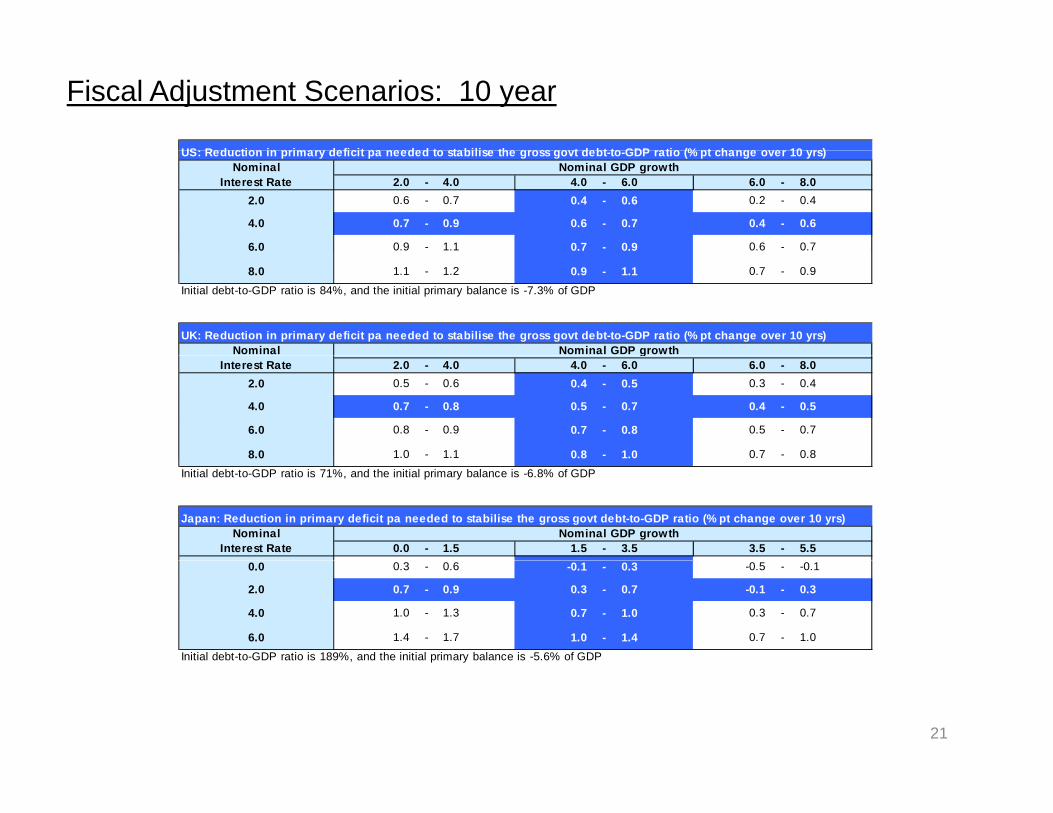
Fiscal Adjustment Scenarios: 10 year
US: Reduction in primary deficit pa needed to stabilise the gross govt debt to GDP ratio (% pt change over 10 yrs)US: Reduction in primary deficit pa needed to stabilise the gross govt debt-to-GDP ratio (% pt change over 10 yrs)Nominal Nominal GDP growth
Interest Rate 2.0 - 4.0 4.0 - 6.0 6.0 - 8.02.0 0.6 - 0.7 0.4 - 0.6 0.2 - 0.4
4.0 0.7 - 0.9 0.6 - 0.7 0.4 - 0.6
6.0 0.9 - 1.1 0.7 - 0.9 0.6 - 0.7
8.0 1.1 - 1.2 0.9 - 1.1 0.7 - 0.9
Initial debt-to-GDP ratio is 84%, and the initial primary balance is -7.3% of GDP
UK: Reduction in primary deficit pa needed to stabilise the gross govt debt-to-GDP ratio (% pt change over 10 yrs)Nominal Nominal GDP growthg
Interest Rate 2.0 - 4.0 4.0 - 6.0 6.0 - 8.02.0 0.5 - 0.6 0.4 - 0.5 0.3 - 0.4
4.0 0.7 - 0.8 0.5 - 0.7 0.4 - 0.5
6.0 0.8 - 0.9 0.7 - 0.8 0.5 - 0.7
8.0 1.0 - 1.1 0.8 - 1.0 0.7 - 0.88.0 0 0.8 1.0 0 0 8
Initial debt-to-GDP ratio is 71%, and the initial primary balance is -6.8% of GDP
Japan: Reduction in primary deficit pa needed to stabilise the gross govt debt-to-GDP ratio (% pt change over 10 yrs)Nominal Nominal GDP growth
Interest Rate 0.0 - 1.5 1.5 - 3.5 3.5 - 5.50.0 0.3 - 0.6 -0.1 - 0.3 -0.5 - -0.1
2.0 0.7 - 0.9 0.3 - 0.7 -0.1 - 0.3
4.0 1.0 - 1.3 0.7 - 1.0 0.3 - 0.7
6.0 1.4 - 1.7 1.0 - 1.4 0.7 - 1.0
Initial debt-to-GDP ratio is 189%, and the initial primary balance is -5.6% of GDP
21
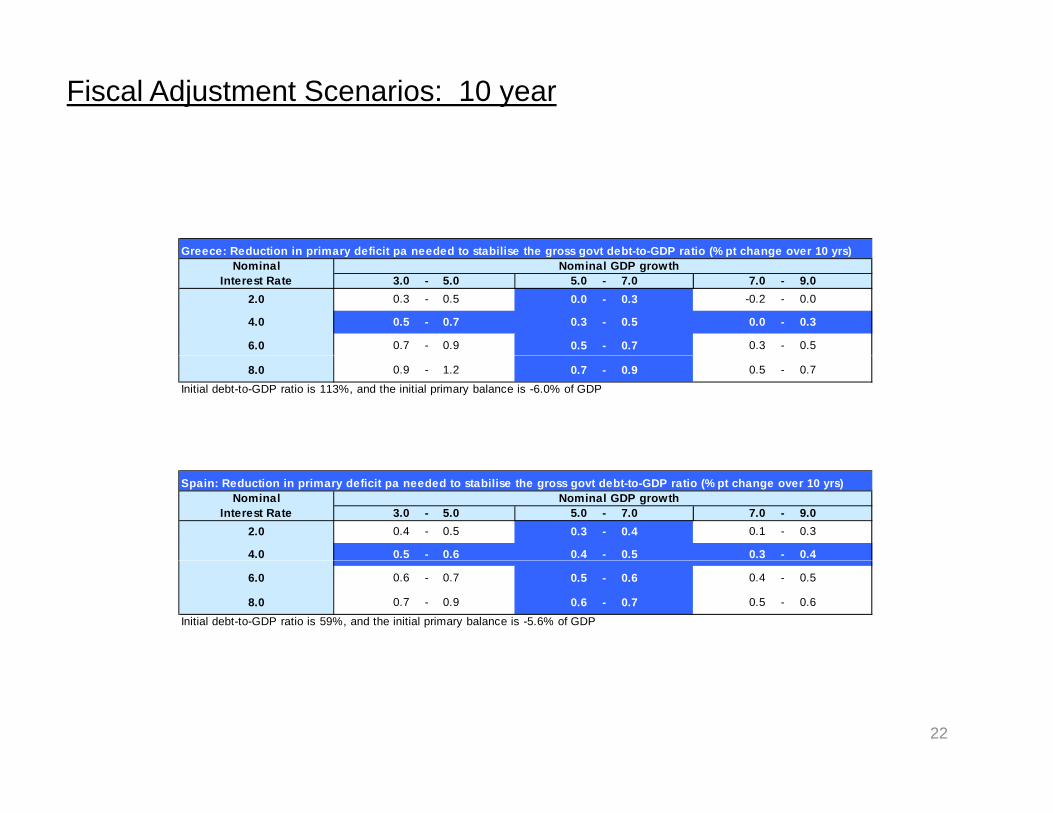
Fiscal Adjustment Scenarios: 10 year
Greece: Reduction in primary deficit pa needed to stabilise the gross govt debt-to-GDP ratio (% pt change over 10 yrs)Greece: Reduction in primary deficit pa needed to stabilise the gross govt debt to GDP ratio (% pt change over 10 yrs)Nominal Nominal GDP growth
Interest Rate 3.0 - 5.0 5.0 - 7.0 7.0 - 9.02.0 0.3 - 0.5 0.0 - 0.3 -0.2 - 0.0
4.0 0.5 - 0.7 0.3 - 0.5 0.0 - 0.3
6.0 0.7 - 0.9 0.5 - 0.7 0.3 - 0.5
8.0 0.9 - 1.2 0.7 - 0.9 0.5 - 0.7
Initial debt-to-GDP ratio is 113%, and the initial primary balance is -6.0% of GDP
Spain: Reduction in primary deficit pa needed to stabilise the gross govt debt-to-GDP ratio (% pt change over 10 yrs)Nominal Nominal GDP growth
Interest Rate 3.0 - 5.0 5.0 - 7.0 7.0 - 9.02.0 0.4 - 0.5 0.3 - 0.4 0.1 - 0.3
4.0 0.5 - 0.6 0.4 - 0.5 0.3 - 0.4
6.0 0.6 - 0.7 0.5 - 0.6 0.4 - 0.5
8.0 0.7 - 0.9 0.6 - 0.7 0.5 - 0.6
Initial debt-to-GDP ratio is 59%, and the initial primary balance is -5.6% of GDP
22
Conclusions:• Fiscal consolidation can happen – could result in slower than desired growth• Similarities with the US
• Easy monetary conditions as a a starting pointDiffi lt liti l i t• Difficult political environment
• Modest global growth• Lack of positive externalities
• Differences with the US• Lack of autonomous monetary policy• Currency flexibility• Historical precedent
• If all countries need to stimulate who will provide the savings? Global growth• If all countries need to stimulate, who will provide the savings? Global growth rebalancing is key.
23
Demand for Treasury Securitiesand 2010 Spread Outlookp
February 2, 2010
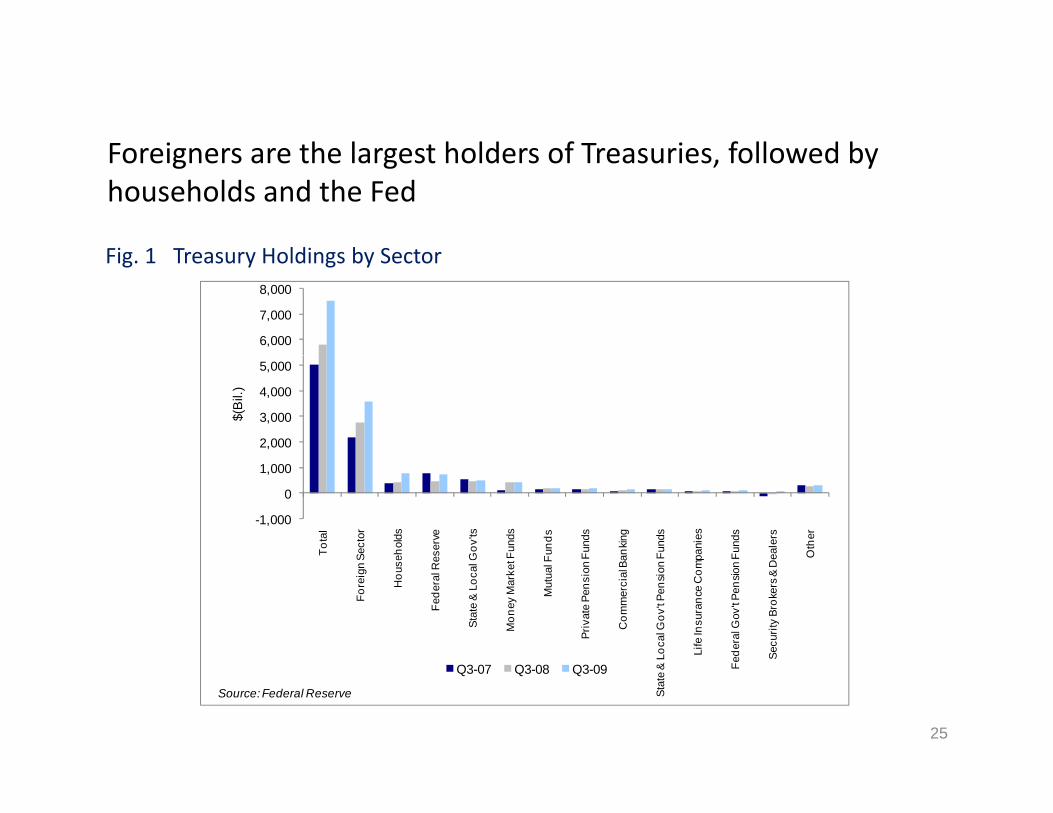
Foreigners are the largest holders of Treasuries followed byForeigners are the largest holders of Treasuries, followed by households and the Fed
Fig 1 Treasury Holdings by SectorFig. 1 Treasury Holdings by Sector
6,000
7,000
8,000
2,000
3,000
4,000
5,000
$(B
il.)
-1,000
0
1,000
Tota
l
Sect
or
ehol
ds
eser
ve
Gov
'ts
Fund
s
Fund
s
Fund
s
ankin
g
Fund
s
mpa
nies
Fund
s
Dea
lers
Oth
er
Fore
ign
Hou
s
Fede
ral R
e
Stat
e &
Loca
l
Mon
ey M
arke
t
Mut
ual F
Priv
ate
Pens
ion
Com
mer
cial
Ba
& Lo
cal G
ov't P
ensi
on
Life
Insu
ranc
e C
o m
eder
al G
ov't P
ensio
n
Secu
rity
Brok
ers &
D
25
Stat
e & FQ3-07 Q3-08 Q3-09
Source: Federal Reserve
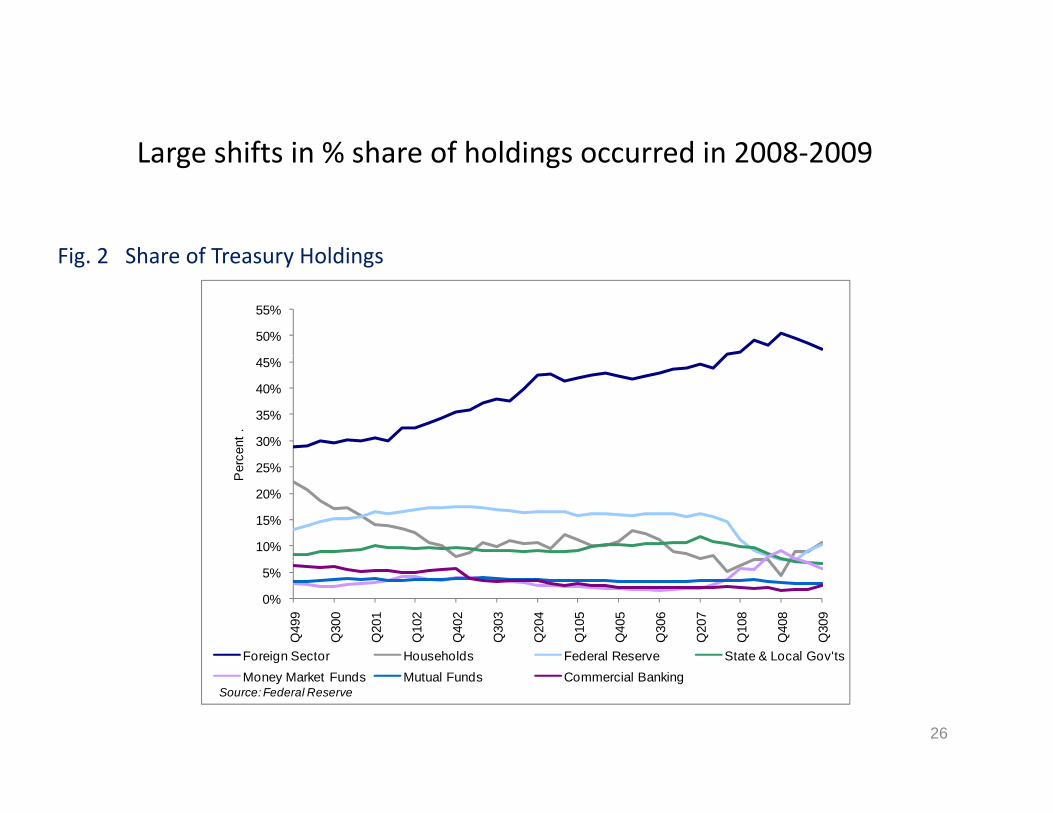
Large shifts in % share of holdings occurred in 2008 2009Large shifts in % share of holdings occurred in 2008‐2009
Fig 2 Share of Treasury HoldingsFig. 2 Share of Treasury Holdings
50%
55%
30%
35%
40%
45%
cent
.
10%
15%
20%
25%
Per
c
0%
5%
Q49
9
Q30
0
Q20
1
Q10
2
Q40
2
Q30
3
Q20
4
Q10
5
Q40
5
Q30
6
Q20
7
Q10
8
Q40
8
Q30
9
Foreign Sector Households Federal Reserve State & Local Gov'ts
26
gMoney Market Funds Mutual Funds Commercial Banking
Source: Federal Reserve
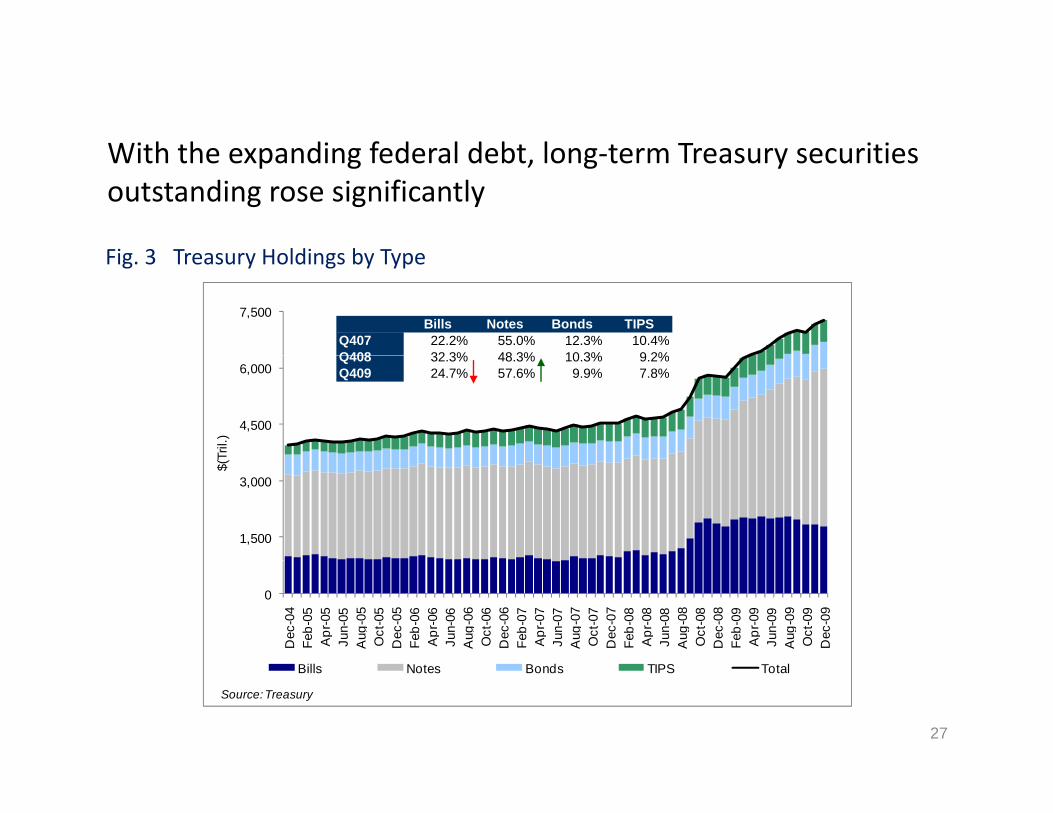
With the expanding federal debt long term Treasury securitiesWith the expanding federal debt, long‐term Treasury securities outstanding rose significantly
Fi 3 Treas r Holdin s b T pe
7,500Bills Notes Bonds TIPS
Q407 22.2% 55.0% 12.3% 10.4%Q408 32 3% 48 3% 10 3% 9 2%
Fig. 3 Treasury Holdings by Type
4,500
6,000
Tril.
)
Q408 32.3% 48.3% 10.3% 9.2%Q409 24.7% 57.6% 9.9% 7.8%
1,500
3,000
$(T
0
Dec
-04
Feb-
05A
pr-0
5Ju
n-05
Aug
-05
Oct
-05
Dec
-05
Feb-
06A
pr-0
6Ju
n-06
Au g
-06
Oct
-06
Dec
-06
Feb-
07A
pr-0
7Ju
n-07
Au g
-07
Oct
-07
Dec
-07
Feb-
08A
pr-0
8Ju
n-08
Aug
-08
Oct
-08
Dec
-08
Feb-
09A
pr-0
9Ju
n-09
Au g
-09
Oct
-09
Dec
-09
Bills Notes Bonds TIPS Total
Source: Treasury
27
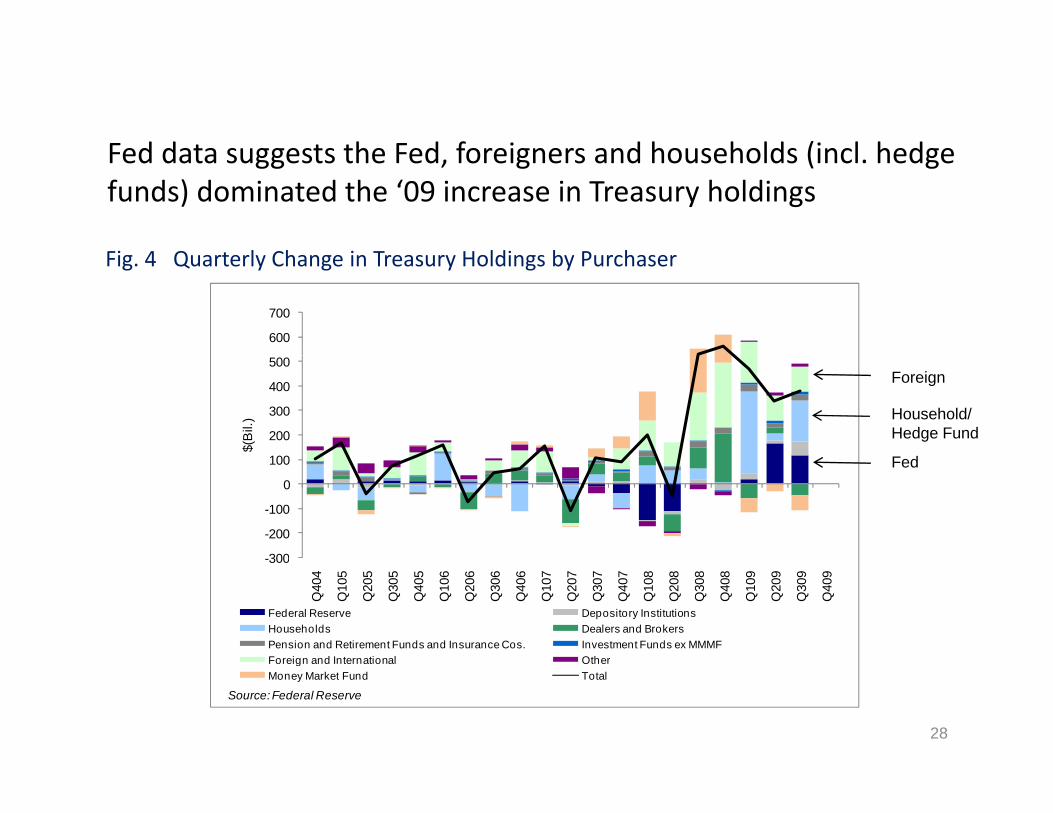
Fed data suggests the Fed foreigners and households (incl hedgeFed data suggests the Fed, foreigners and households (incl. hedge funds) dominated the ‘09 increase in Treasury holdings
Fi 4 Q t l Ch i T H ldi b P h
600
700
Fig. 4 Quarterly Change in Treasury Holdings by Purchaser
100
200
300
400
500
$(B
il.)
Foreign
Household/Hedge Fund
F d
-300
-200
-100
0
100 Fed
300
Q40
4
Q10
5
Q20
5
Q30
5
Q40
5
Q10
6
Q20
6
Q30
6
Q40
6
Q10
7
Q20
7
Q30
7
Q40
7
Q10
8
Q20
8
Q30
8
Q40
8
Q10
9
Q20
9
Q30
9
Q40
9
Federal Reserve Depository InstitutionsHouseholds Dealers and BrokersPension and Retirement Funds and Insurance Cos. Investment Funds ex MMMFForeign and International OtherForeign and International OtherMoney Market Fund Total
Source: Federal Reserve
28
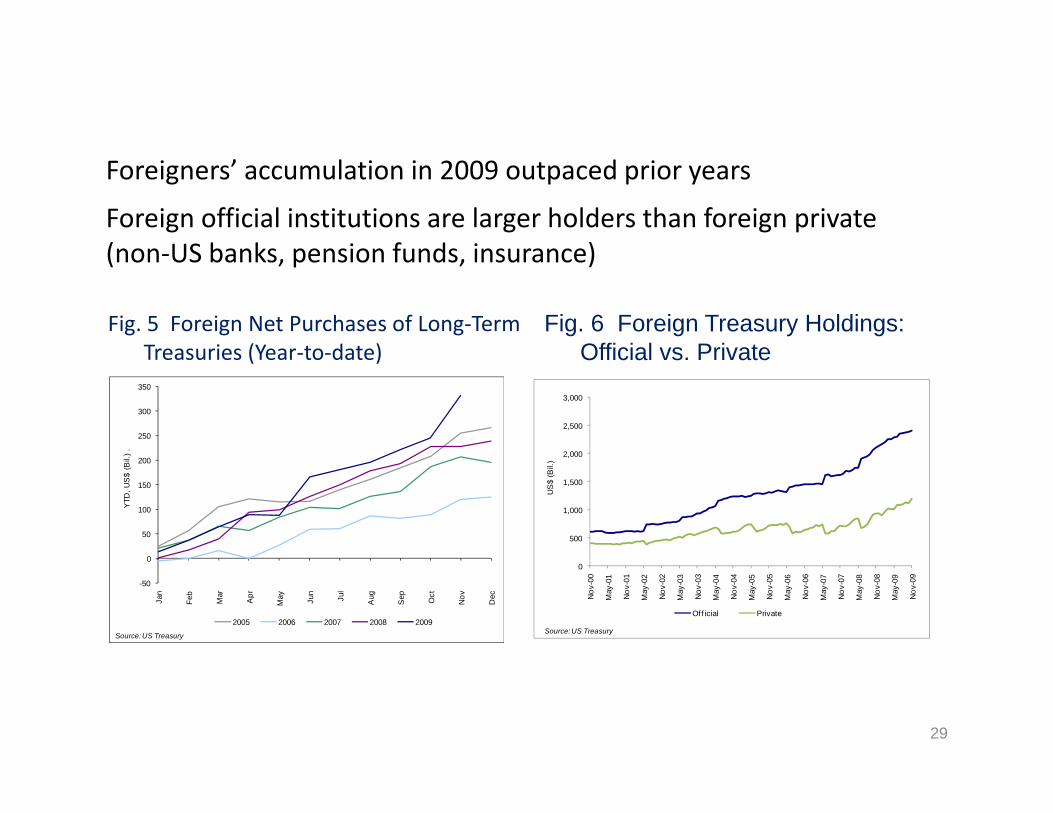
Foreigners’ accumulation in 2009 outpaced prior years
Foreign official institutions are larger holders than foreign private (non US banks pension funds insurance)(non‐US banks, pension funds, insurance)
Fig. 5 Foreign Net Purchases of Long‐Term Treasuries (Year‐to‐date)
Fig. 6 Foreign Treasury Holdings: Official vs PrivateTreasuries (Year to date) Official vs. Private
200
250
300
350
.) .
2,000
2,500
3,000
0
50
100
150
200
YTD
, US
$ (B
il
500
1,000
1,500
US
$ (B
il.)
-50
0
Jan
Feb
Mar
Apr
May Jun
Jul
Aug
Sep Oct
Nov
Dec
2005 2006 2007 2008 2009
Source: US Treasury
0
Nov
-00
May
-01
Nov
-01
May
-02
Nov
-02
May
-03
Nov
-03
May
-04
Nov
-04
May
-05
Nov
-05
May
-06
Nov
-06
May
-07
Nov
-07
May
-08
Nov
-08
May
-09
Nov
-09
Of f icial Private
Source: US Treasury
29
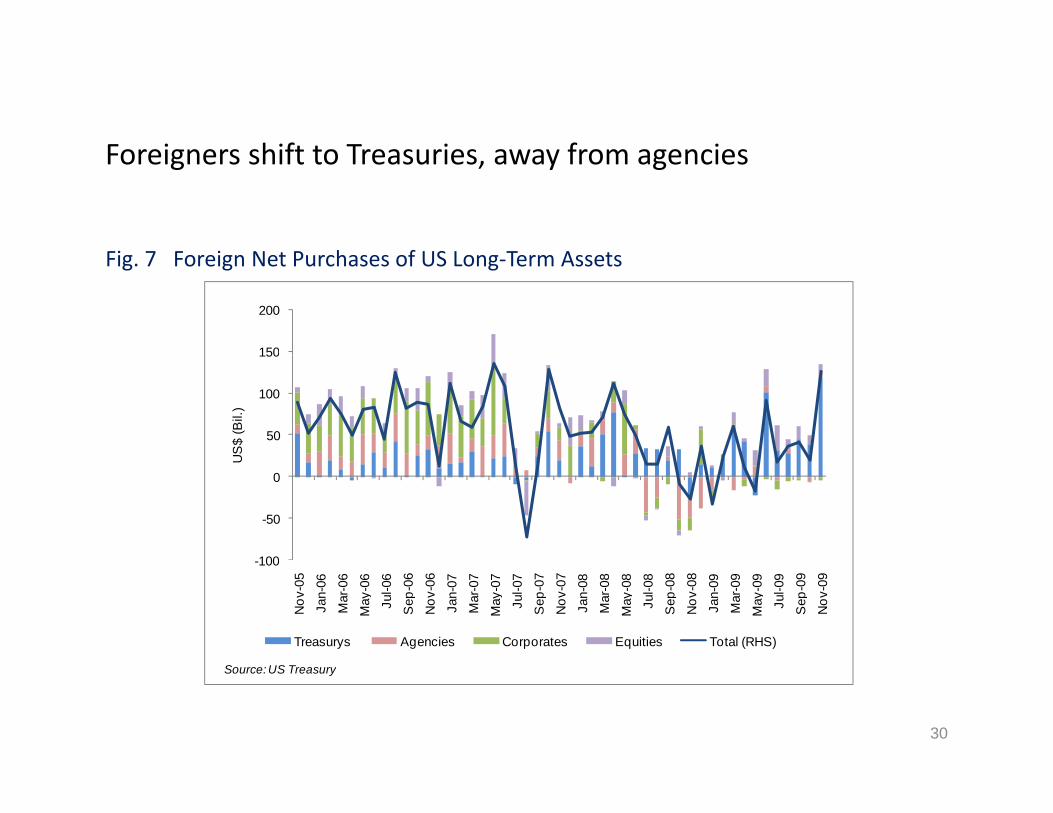
Foreigners shift to Treasuries away from agenciesForeigners shift to Treasuries, away from agencies
Fi 7 F i N t P h f US L T A tFig. 7 Foreign Net Purchases of US Long‐Term Assets
150
200
50
100
150
US
$ (B
il.)
100
-50
0
U
-100
Nov
-05
Jan-
06
Mar
-06
May
-06
Jul-0
6
Sep
-06
Nov
-06
Jan-
07
Mar
-07
May
-07
Jul-0
7
Se p
-07
Nov
-07
Jan-
08
Mar
-08
May
-08
Jul-0
8
Sep
-08
Nov
-08
Jan-
09
Mar
-09
May
-09
Jul-0
9
Se p
-09
Nov
-09
Treasurys Agencies Corporates Equities Total (RHS)
30
Source: US Treasury
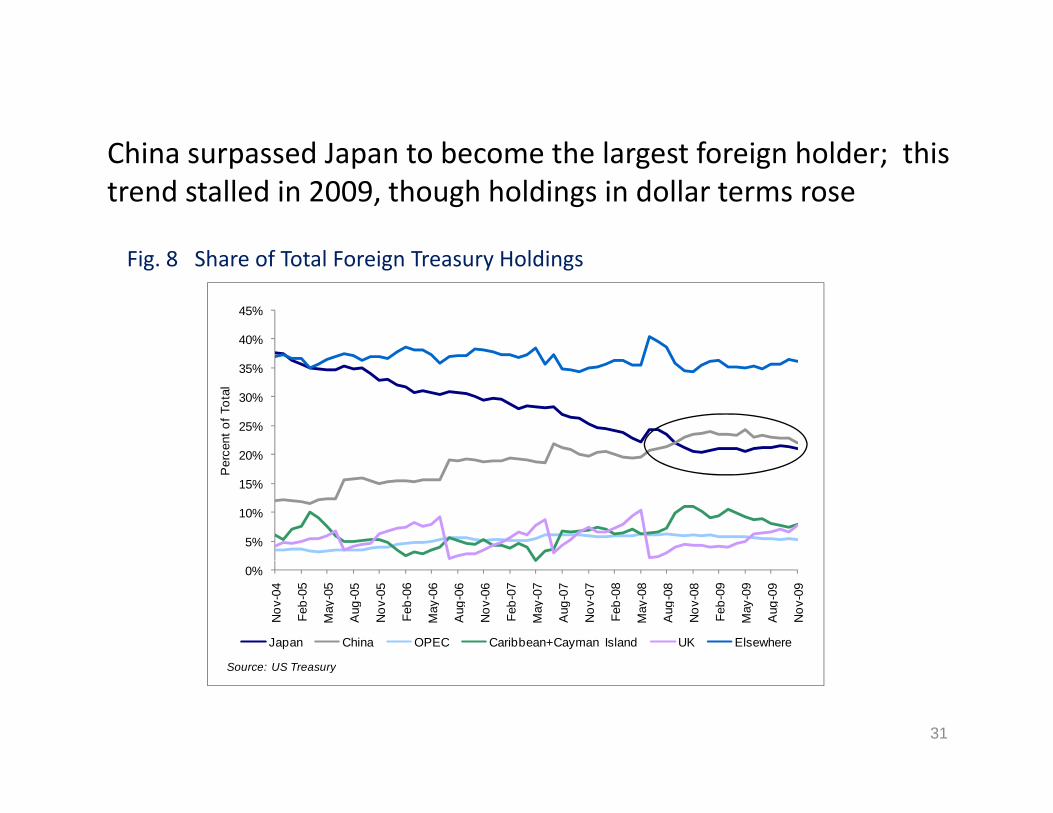
China surpassed Japan to become the largest foreign holder; thisChina surpassed Japan to become the largest foreign holder; this trend stalled in 2009, though holdings in dollar terms rose
Fi 8 Sh f T t l F i T H ldi
40%
45%
Fig. 8 Share of Total Foreign Treasury Holdings
20%
25%
30%
35%
rcen
t of T
otal
5%
10%
15%
20%
Per
0%
Nov
-04
Feb-
05
Ma y
-05
Au g
-05
Nov
-05
Feb-
06
May
-06
Au g
-06
Nov
-06
Feb-
07
May
-07
Au g
-07
Nov
-07
Feb-
08
May
-08
Aug
-08
Nov
-08
Feb-
09
Ma y
-09
Aug
-09
Nov
-09
Japan China OPEC Caribbean+Cayman Island UK Elsewhere
S US TSource: US Treasury
31
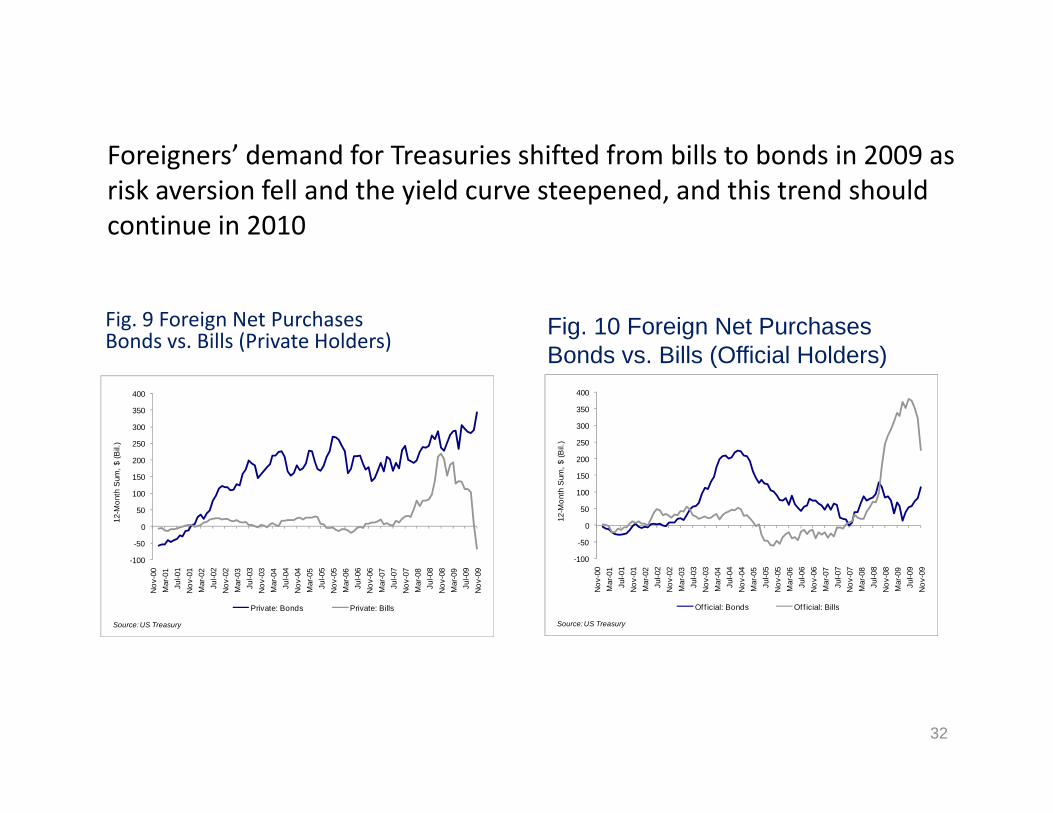
Foreigners’ demand for Treas ries shifted from bills to bonds in 2009 asForeigners’ demand for Treasuries shifted from bills to bonds in 2009 as risk aversion fell and the yield curve steepened, and this trend should continue in 2010
Fig. 9 Foreign Net PurchasesBonds vs. Bills (Private Holders)
Fig. 10 Foreign Net PurchasesBonds vs Bills (Official Holders)Bonds vs. Bills (Official Holders)
200
250
300
350
400
(Bil.
)
200
250
300
350
400
(Bil.
) 100
-50
0
50
100
150
200
12-M
onth
Sum
, $ (
-100
-50
0
50
100
150
200
12-M
onth
Sum
, $
-100
Nov
-00
Mar
-01
Jul-0
1N
ov-0
1M
ar-0
2Ju
l-02
Nov
-02
Mar
-03
Jul-0
3N
ov-0
3M
ar-0
4Ju
l-04
Nov
-04
Mar
-05
Jul-0
5N
ov-0
5M
ar-0
6Ju
l-06
Nov
-06
Mar
-07
Jul-0
7N
ov-0
7M
ar-0
8Ju
l-08
Nov
-08
Mar
-09
Jul-0
9N
ov-0
9
Private: Bonds Private: Bills
Source: US Treasury
100
Nov
-00
Mar
-01
Jul-0
1N
ov-0
1M
ar-0
2Ju
l-02
Nov
-02
Mar
-03
Jul-0
3N
ov-0
3M
ar-0
4Ju
l-04
Nov
-04
Mar
-05
Jul-0
5N
ov-0
5M
ar-0
6Ju
l-06
Nov
-06
Mar
-07
Jul-0
7N
ov-0
7M
ar-0
8Ju
l-08
Nov
-08
Mar
-09
Jul-0
9N
ov-0
9
Of f icial: Bonds Off icial: Bills
Source: US Treasury
32
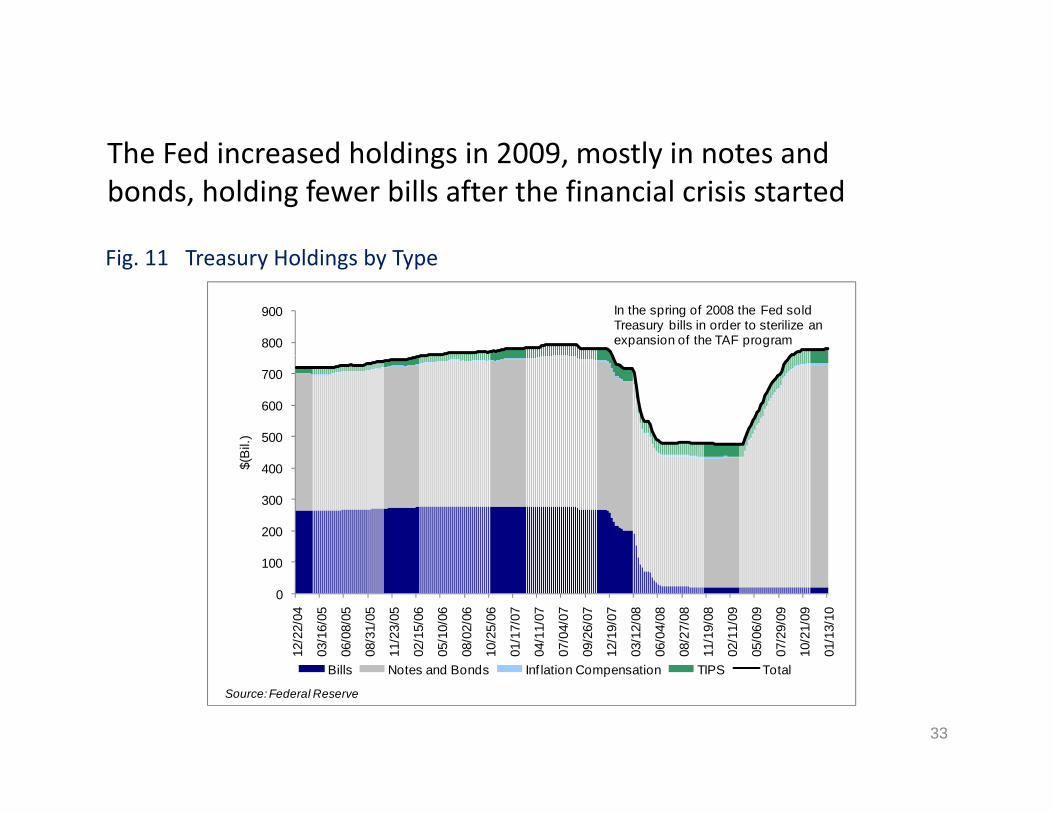
The Fed increased holdings in 2009 mostly in notes andThe Fed increased holdings in 2009, mostly in notes and bonds, holding fewer bills after the financial crisis started
Fi 11 T H ldi b TFig. 11 Treasury Holdings by Type
800
900 In the spring of 2008 the Fed soldTreasury bills in order to sterilize anexpansion of the TAF program
500
600
700
Bil.
)
100
200
300
400$(
0
100
12/2
2/04
03/1
6/05
06/0
8/05
08/3
1/05
11/2
3/05
02/1
5/06
05/1
0/06
08/0
2/06
10/2
5/06
01/1
7/07
04/1
1/07
07/0
4/07
09/2
6/07
12/1
9/07
03/1
2/08
06/0
4/08
08/2
7/08
11/1
9/08
02/1
1/09
05/0
6/09
07/2
9/09
10/2
1/09
01/1
3/10
33
Bills Notes and Bonds Inf lation Compensation TIPS Total
Source: Federal Reserve
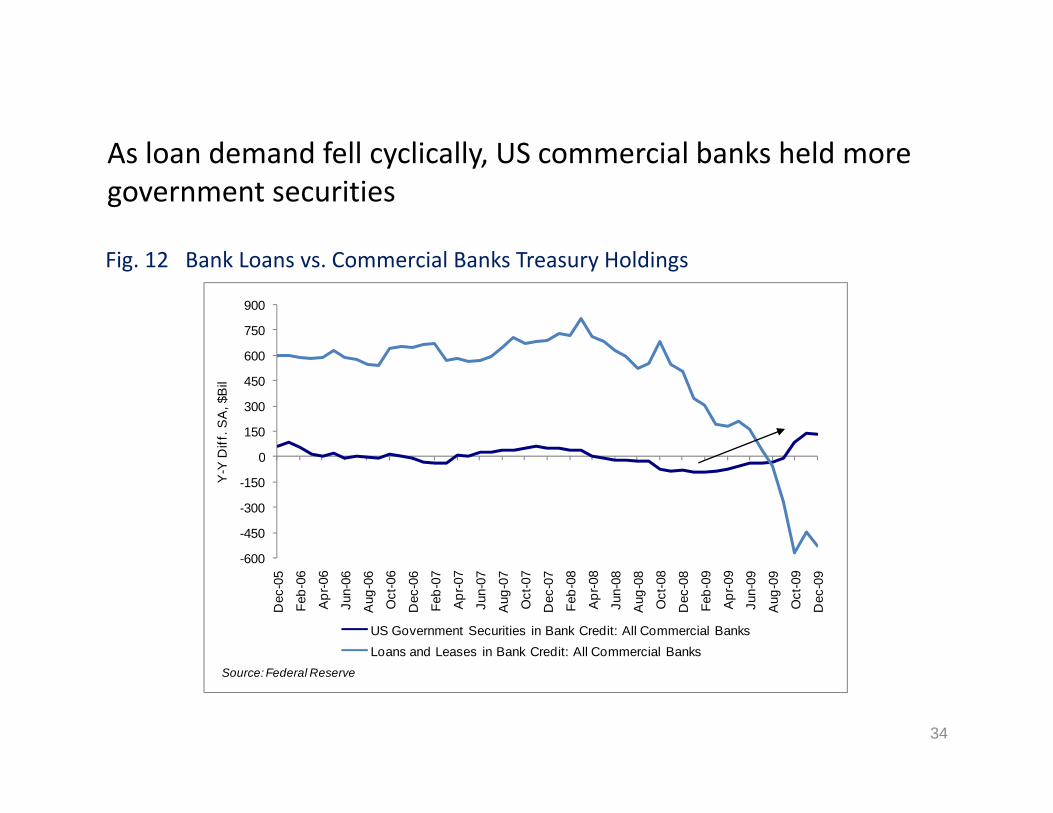
As loan demand fell cyclically US commercial banks held moreAs loan demand fell cyclically, US commercial banks held more government securities
Fi 12 B k L C i l B k T H ldi
600
750
900
Fig. 12 Bank Loans vs. Commercial Banks Treasury Holdings
0
150
300
450
600
Diff
. SA
, $B
il
-600
-450
-300
-150
0
Y-Y
600
Dec
-05
Feb-
06
Apr
-06
Jun-
06
Aug
-06
Oct
-06
Dec
-06
Feb-
07
Apr
-07
Jun-
07
Aug
-07
Oct
-07
Dec
-07
Feb-
08
Apr
-08
Jun-
08
Aug
-08
Oct
-08
Dec
-08
Feb-
09
Apr
-09
Jun-
09
Aug
-09
Oct
-09
Dec
-09
US Government Securities in Bank Credit: All Commercial BanksLoans and Leases in Bank Credit: All Commercial Banks
Source: Federal Reserve
34
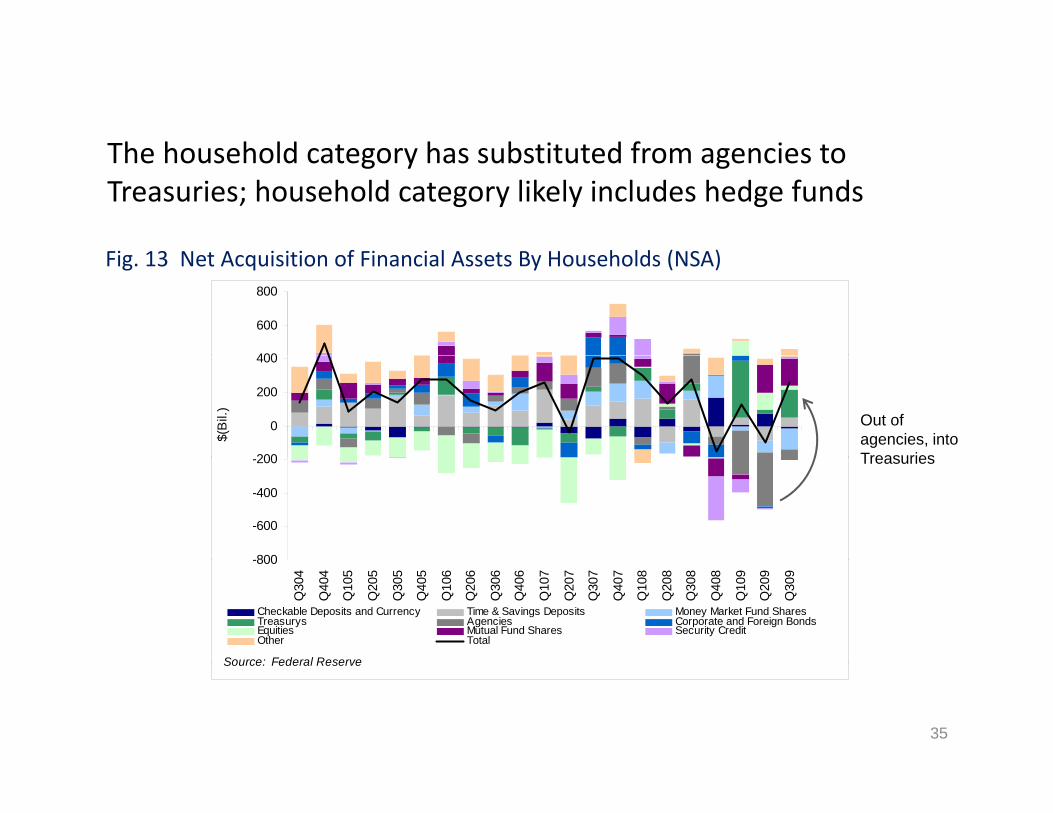
The household category has substituted from agencies toThe household category has substituted from agencies to Treasuries; household category likely includes hedge funds
Fi 13 N t A i iti f Fi i l A t B H h ld (NSA)
400
600
800
Fig. 13 Net Acquisition of Financial Assets By Households (NSA)
200
0
200
400
$(B
il.)
Out of agencies, into Treasuries
-800
-600
-400
-200 Treasuries
-800
Q30
4
Q40
4
Q10
5
Q20
5
Q30
5
Q40
5
Q10
6
Q20
6
Q30
6
Q40
6
Q10
7
Q20
7
Q30
7
Q40
7
Q10
8
Q20
8
Q30
8
Q40
8
Q10
9
Q20
9
Q30
9
Checkable Deposits and Currency Time & Savings Deposits Money Market Fund SharesTreasurys Agencies Corporate and Foreign BondsEquities Mutual Fund Shares Security CreditOther Total
Source: Federal ReserveSource: Federal Reserve
35
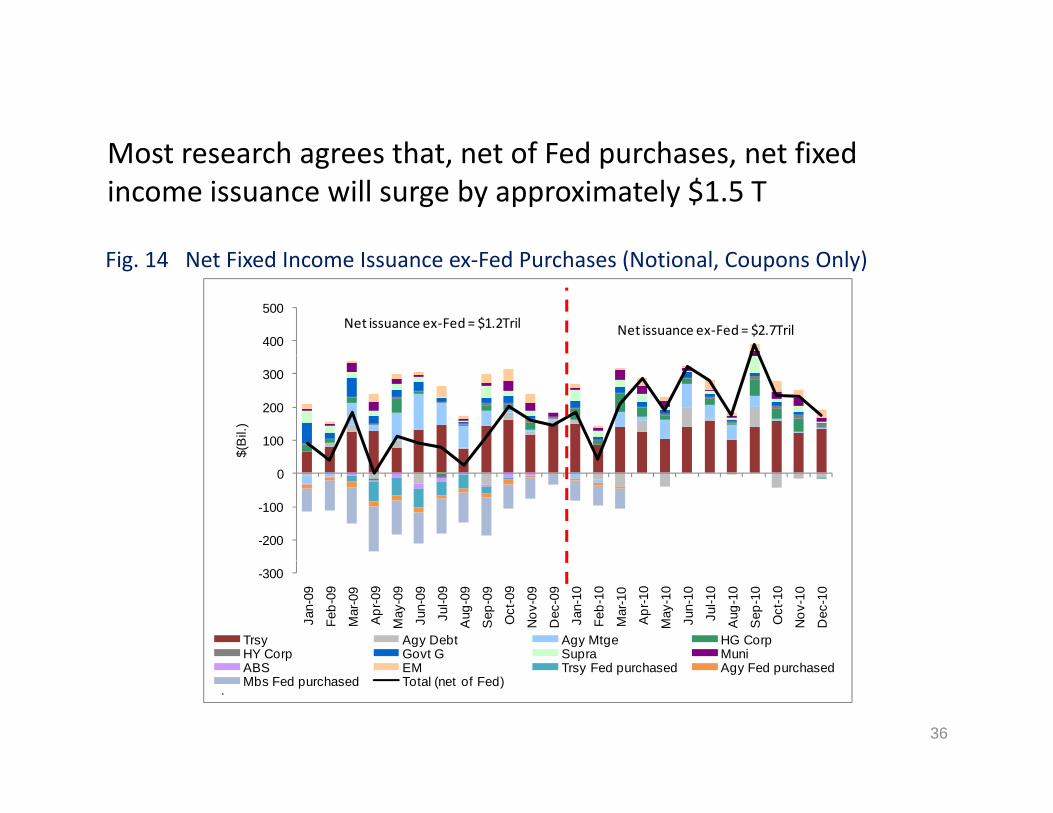
Most research agrees that net of Fed purchases net fixedMost research agrees that, net of Fed purchases, net fixed income issuance will surge by approximately $1.5 T
Fi 14 N Fi d I I F d P h (N i l C O l )Fig. 14 Net Fixed Income Issuance ex‐Fed Purchases (Notional, Coupons Only)
400
500Net issuance ex‐Fed = $1.2Tril Net issuance ex‐Fed = $2.7Tril
100
200
300
$(B
il.)
-200
-100
0
-300
Jan-
09
Feb-
09
Mar
-09
Apr
-09
May
-09
Jun-
09
Jul-0
9
Aug
-09
Sep
-09
Oct
-09
Nov
-09
Dec
-09
Jan-
10
Feb-
10
Mar
-10
Apr
-10
May
-10
Jun-
10
Jul-1
0
Aug
-10
Sep
-10
Oct
-10
Nov
-10
Dec
-10
Trsy Agy Debt Agy Mtge HG CorpHY Corp Govt G Supra MuniABS EM T F d h d A F d h d
36
ABS EM Trsy Fed purchased Agy Fed purchasedMbs Fed purchased Total (net of Fed)
.
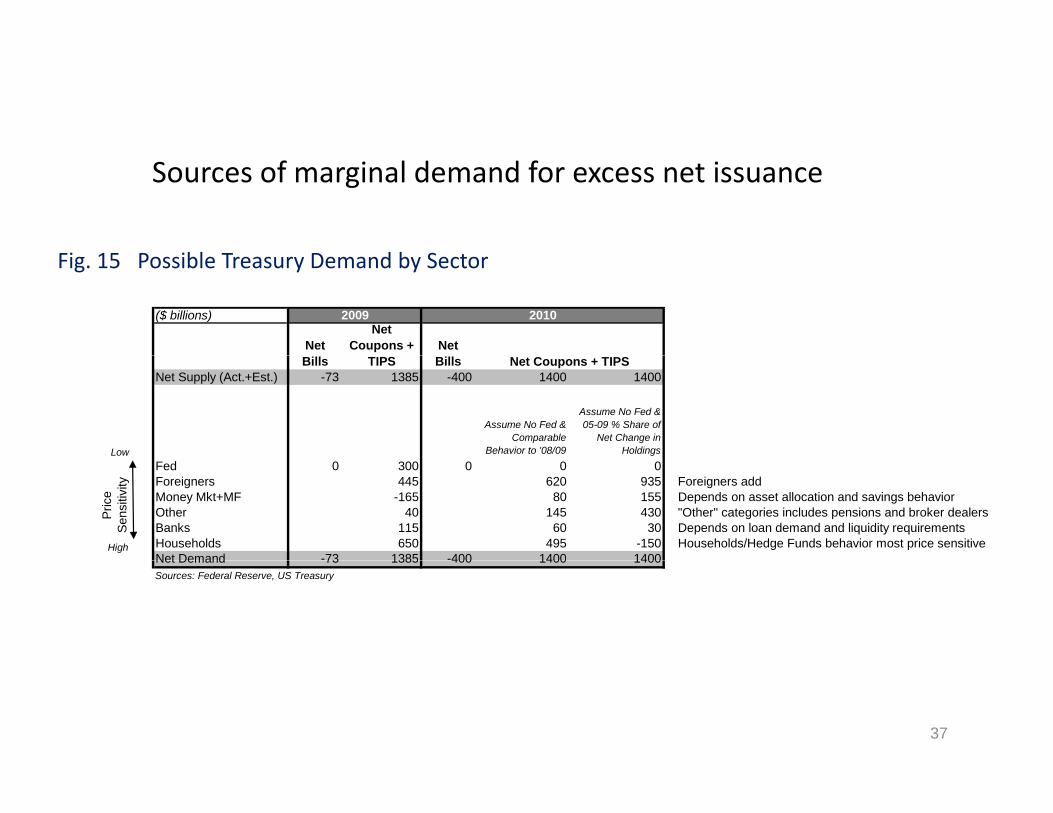
Sources of marginal demand for excess net issuance
i 1 ibl d b SFig. 15 Possible Treasury Demand by Sector
($ billions)
Net Net
Coupons + Net
20102009
Bills TIPS BillsNet Supply (Act.+Est.) -73 1385 -400 1400 1400
Assume No Fed & Comparable
Behavior to '08/09
Assume No Fed & 05-09 % Share of
Net Change in Holdings
Net Coupons + TIPS
LowFed 0 300 0 0 0Foreigners 445 620 935 Foreigners addMoney Mkt+MF -165 80 155 Depends on asset allocation and savings behaviorOther 40 145 430 "Other" categories includes pensions and broker dealers Banks 115 60 30 Depends on loan demand and liquidity requirementsHouseholds 650 495 -150 Households/Hedge Funds behavior most price sensitiveNet Demand -73 1385 -400 1400 1400
Pric
e Se
nsiti
vity
HighNet Demand 73 1385 400 1400 1400Sources: Federal Reserve, US Treasury
37
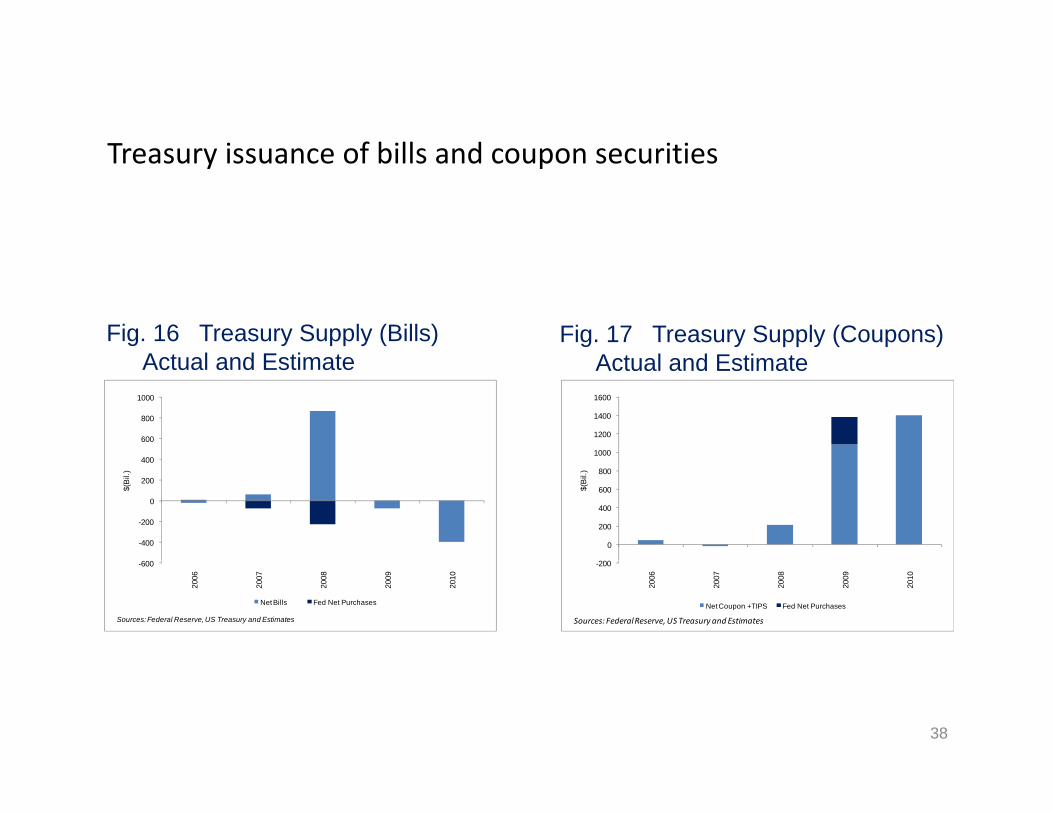
Treasury issuance of bills and coupon securitiesTreasury issuance of bills and coupon securities
Fig. 16 Treasury Supply (Bills) A t l d E ti t
Fig. 17 Treasury Supply (Coupons) A t l d E ti tActual and Estimate Actual and Estimate
400
600
800
1000
1000
1200
1400
1600
-400
-200
0
200
400
$(B
il.)
200
0
200
400
600
800
$(B
il.)
-600
2006
2007
2008
2009
2010
Net Bills Fed Net Purchases
Sources: Federal Reserve, US Treasury and Estimates
-200
2006
2007
2008
2009
2010
Net Coupon +TIPS Fed Net Purchases
Sources: Federal Reserve, US Treasury and Estimates
38

Expectations for the performance of spread products in 2010
• Long-dated swap spreads should widen while short-dated swap spreads should remain stable or tighten slightly
• Corporate credit spreads should continue to stabilize tighter
• Municipal spread levels have tightened with strong demand, but fundamental deterioration continues
• CMBS spreads should continue to improve• CMBS spreads should continue to improve
• Mortgage basis should widen modestly
39
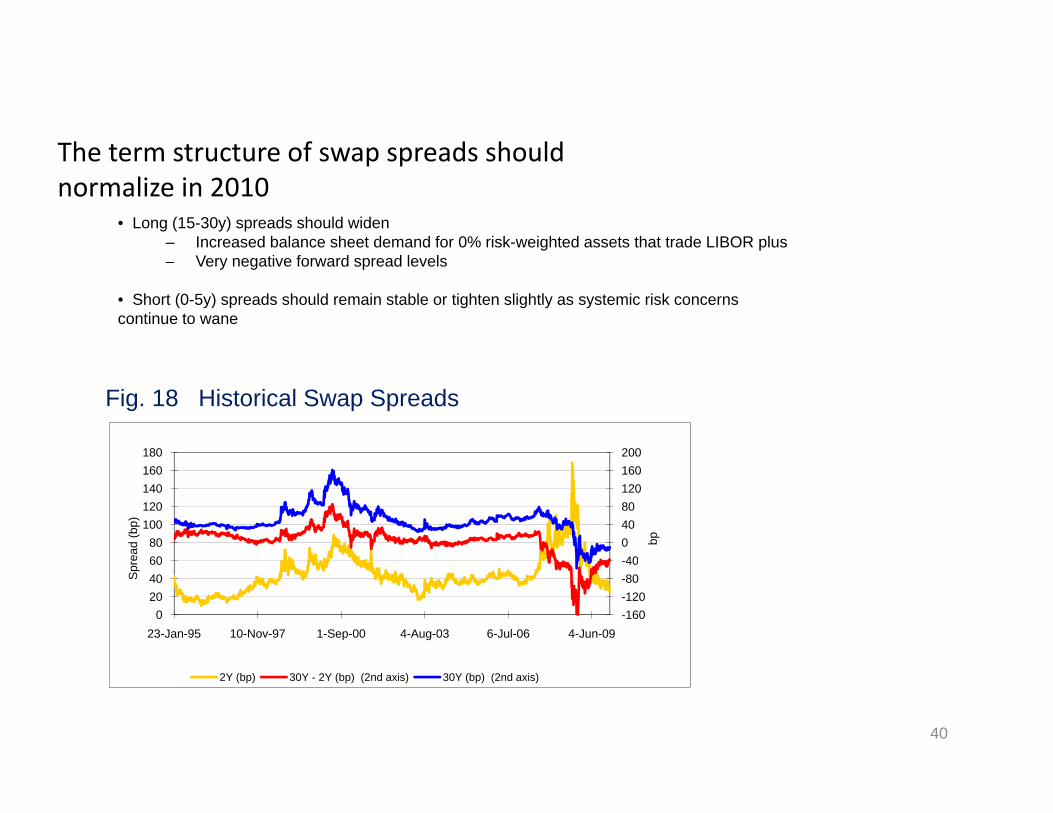
The term structure of swap spreads shouldThe term structure of swap spreads should normalize in 2010
• Long (15-30y) spreads should widen– Increased balance sheet demand for 0% risk-weighted assets that trade LIBOR plus– Very negative forward spread levels
• Short (0-5y) spreads should remain stable or tighten slightly as systemic risk concerns continue to wane
Fig. 18 Historical Swap Spreads
200180
4004080120160
6080
100120140160
bp
ead
(bp)
-160-120-80-40
0204060
23-Jan-95 10-Nov-97 1-Sep-00 4-Aug-03 6-Jul-06 4-Jun-09
Spre
40
2Y (bp) 30Y - 2Y (bp) (2nd axis) 30Y (bp) (2nd axis)
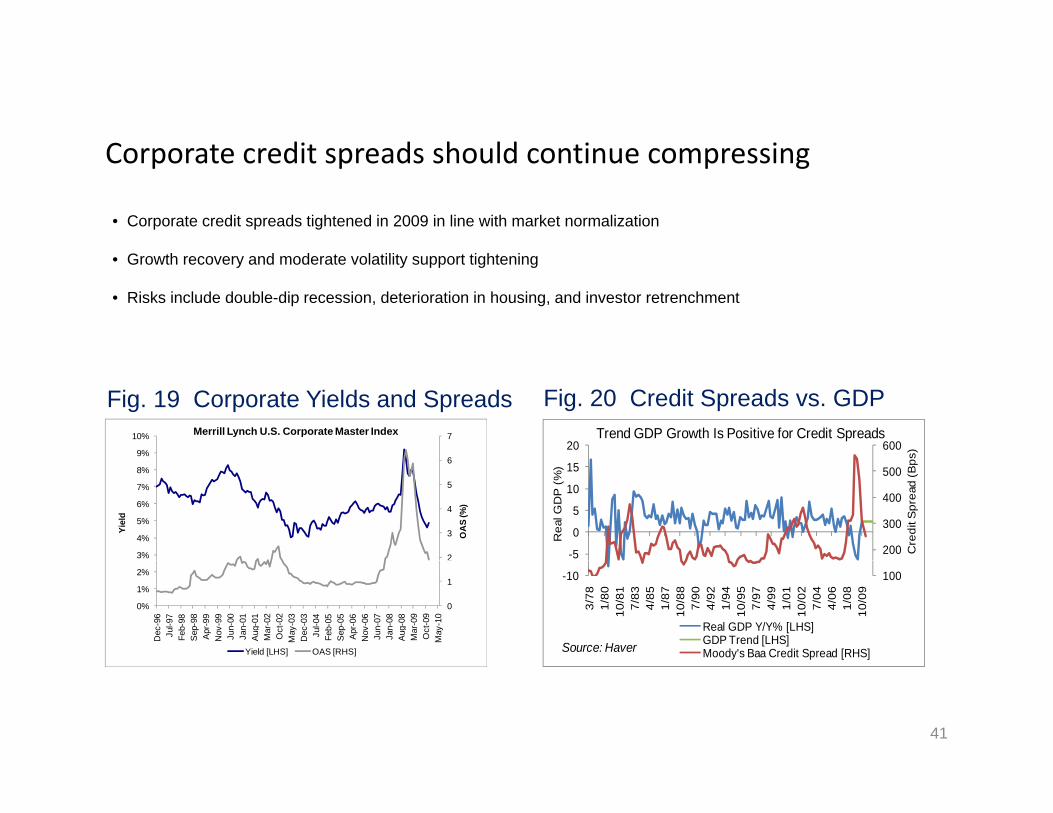
Corporate credit spreads should continue compressing
• Corporate credit spreads tightened in 2009 in line with market normalization
Corporate credit spreads should continue compressing
• Growth recovery and moderate volatility support tightening
• Risks include double-dip recession, deterioration in housing, and investor retrenchment
Fig. 19 Corporate Yields and Spreads Fig. 20 Credit Spreads vs. GDP
6
7
9%
10% Merrill Lynch U.S. Corporate Master Index60020
s)
Trend GDP Growth Is Positive for Credit Spreads
2
3
4
5
6
3%
4%
5%
6%
7%
8%O
AS
(%)
Yiel
d
200
300
400
500
-5
0
5
10
15
Cre
dit S
prea
d (B
ps
Rea
l GD
P (
%)
0
1
0%
1%
2%
Dec
-96
Jul-9
7Fe
b-98
Sep
-98
Apr-9
9N
ov-9
9Ju
n-00
Jan-
01A
ug-0
1M
ar-0
2O
ct-0
2M
ay-0
3D
ec-0
3Ju
l-04
Feb-
05S
ep-0
5Ap
r-06
Nov
-06
Jun-
07Ja
n-08
Aug
-08
Mar
-09
Oct
-09
May
-10
Yield [LHS] OAS [RHS]
100-103/
781/
8010
/81
7/83
4/85
1/87
10/8
87/
904/
921/
9410
/95
7/97
4/99
1/01
10/0
27/
044/
061/
0810
/09
Real GDP Y/Y% [LHS]GDP Trend [LHS]Moody's Baa Credit Spread [RHS]Source: Haver
41
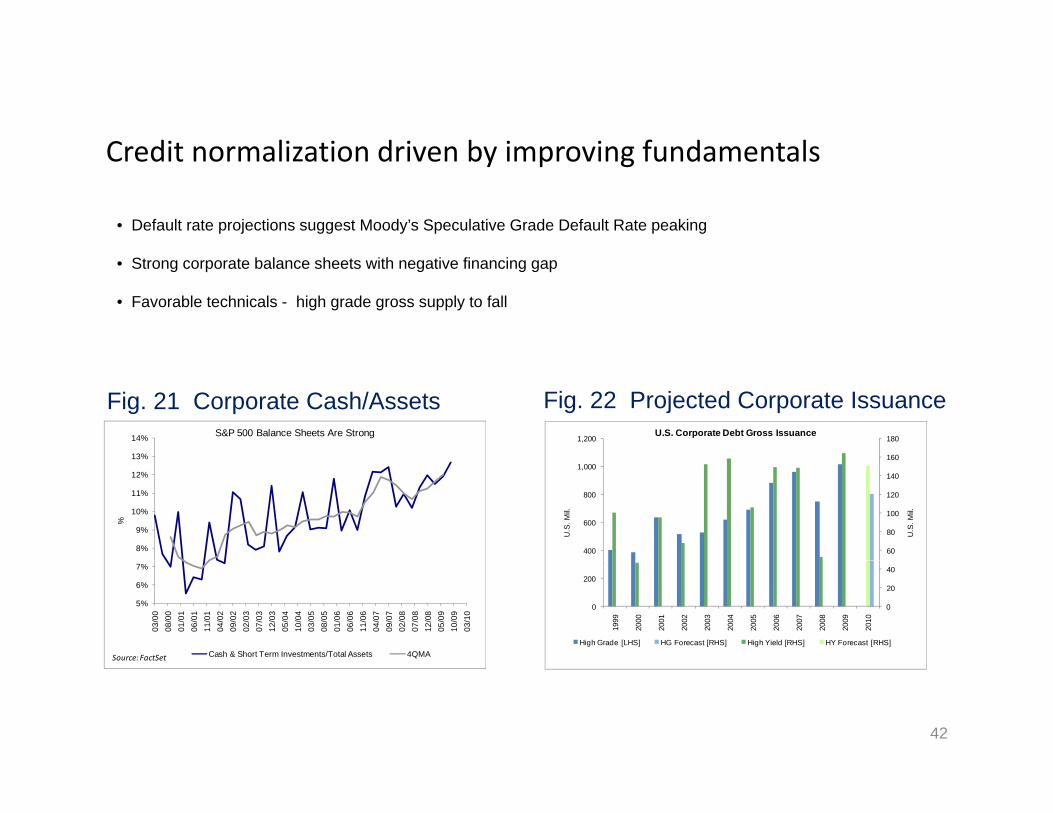
Credit normalization driven by improving fundamentals
• Default rate projections suggest Moody’s Speculative Grade Default Rate peaking
Credit normalization driven by improving fundamentals
• Strong corporate balance sheets with negative financing gap
• Favorable technicals - high grade gross supply to fall
Fig. 21 Corporate Cash/Assets Fig. 22 Projected Corporate Issuance
13%
14% S&P 500 Balance Sheets Are Strong
160
1801,200U.S. Corporate Debt Gross Issuance
8%
9%
10%
11%
12%
13%
%
60
80
100
120
140
160
400
600
800
1,000
U.S
. Mil.
U.S
. Mil.
5%
6%
7%
03/0
008
/00
01/0
106
/01
11/0
104
/02
09/0
202
/03
07/0
312
/03
05/0
410
/04
03/0
508
/05
01/0
606
/06
11/0
604
/07
09/0
702
/08
07/0
812
/08
05/0
910
/09
03/1
0
Cash & Short Term Investments/Total Assets 4QMASource: FactSet
0
20
40
0
200
1999
2000
2001
2002
2003
2004
2005
2006
2007
2008
2009
2010
High Grade [LHS] HG Forecast [RHS] High Yield [RHS] HY Forecast [RHS]
42
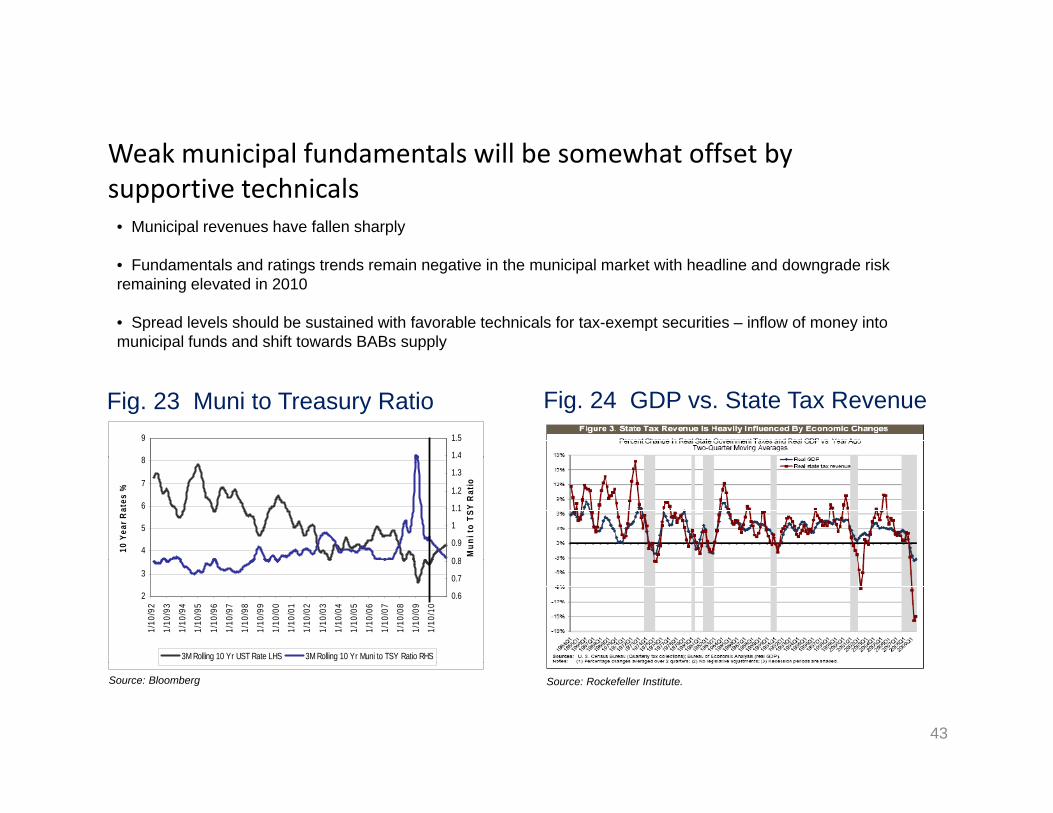
Weak municipal fundamentals will be somewhat offset byWeak municipal fundamentals will be somewhat offset by supportive technicals
• Municipal revenues have fallen sharply
• Fundamentals and ratings trends remain negative in the municipal market with headline and downgrade risk remaining elevated in 2010
• Spread levels should be sustained with favorable technicals for tax-exempt securities – inflow of money into municipal funds and shift towards BABs supply
8
9
1.4
1.5
Fig. 23 Muni to Treasury Ratio Fig. 24 GDP vs. State Tax Revenue
4
5
6
7
8
10 Y
ear R
ates
%
0 8
0.9
1
1.1
1.2
1.3
1.4M
uni t
o TS
Y R
atio
2
3
1/10
/92
1/10
/93
1/10
/94
1/10
/95
1/10
/96
1/10
/97
1/10
/98
1/10
/99
1/10
/00
1/10
/01
1/10
/02
1/10
/03
1/10
/04
1/10
/05
1/10
/06
1/10
/07
1/10
/08
1/10
/09
1/10
/10
0.6
0.7
0.8
3M Rolling 10 Yr UST Rate LHS 3M Rolling 10 Yr Muni to TSY Ratio RHS
43
Source: Rockefeller Institute.Source: Bloomberg
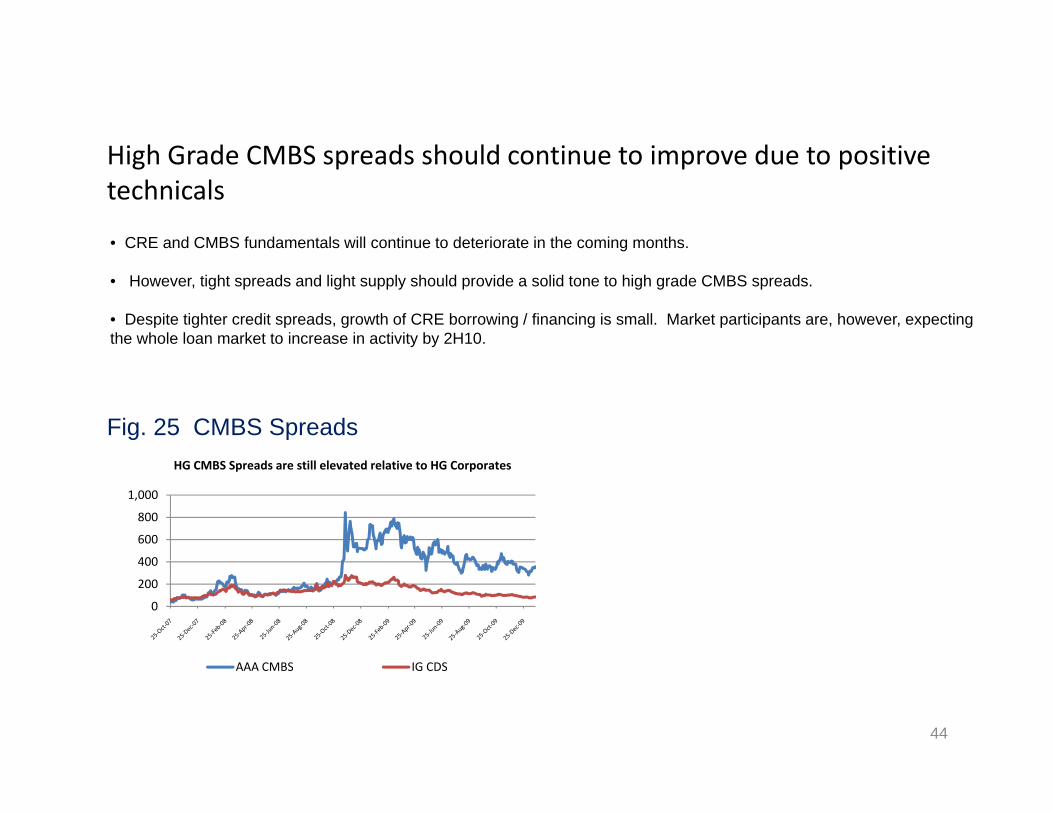
Hi h G d CMBS d h ld ti t i d t itiHigh Grade CMBS spreads should continue to improve due to positive technicals
• CRE and CMBS fundamentals will continue to deteriorate in the coming months.
• However, tight spreads and light supply should provide a solid tone to high grade CMBS spreads.
• Despite tighter credit spreads, growth of CRE borrowing / financing is small. Market participants are, however, expecting the whole loan market to increase in activity by 2H10.
Fig. 25 CMBS Spreads
400
600
800
1,000
HG CMBS Spreads are still elevated relative to HG Corporates
0
200
400
AAA CMBS IG CDS
44
AAA CMBS IG CDS
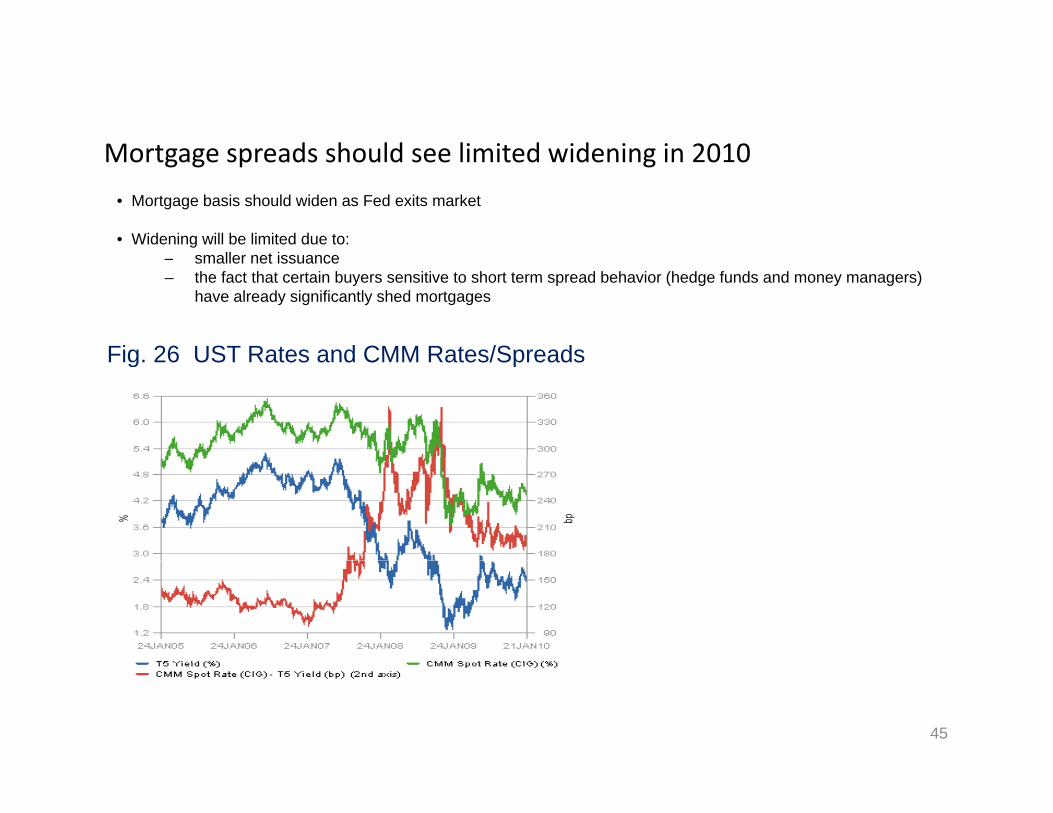
Mortgage spreads should see limited widening in 2010Mortgage spreads should see limited widening in 2010
• Mortgage basis should widen as Fed exits market
• Widening will be limited due to:ll t i– smaller net issuance
– the fact that certain buyers sensitive to short term spread behavior (hedge funds and money managers) have already significantly shed mortgages
Fig 26 UST Rates and CMM Rates/SpreadsFig. 26 UST Rates and CMM Rates/Spreads
45
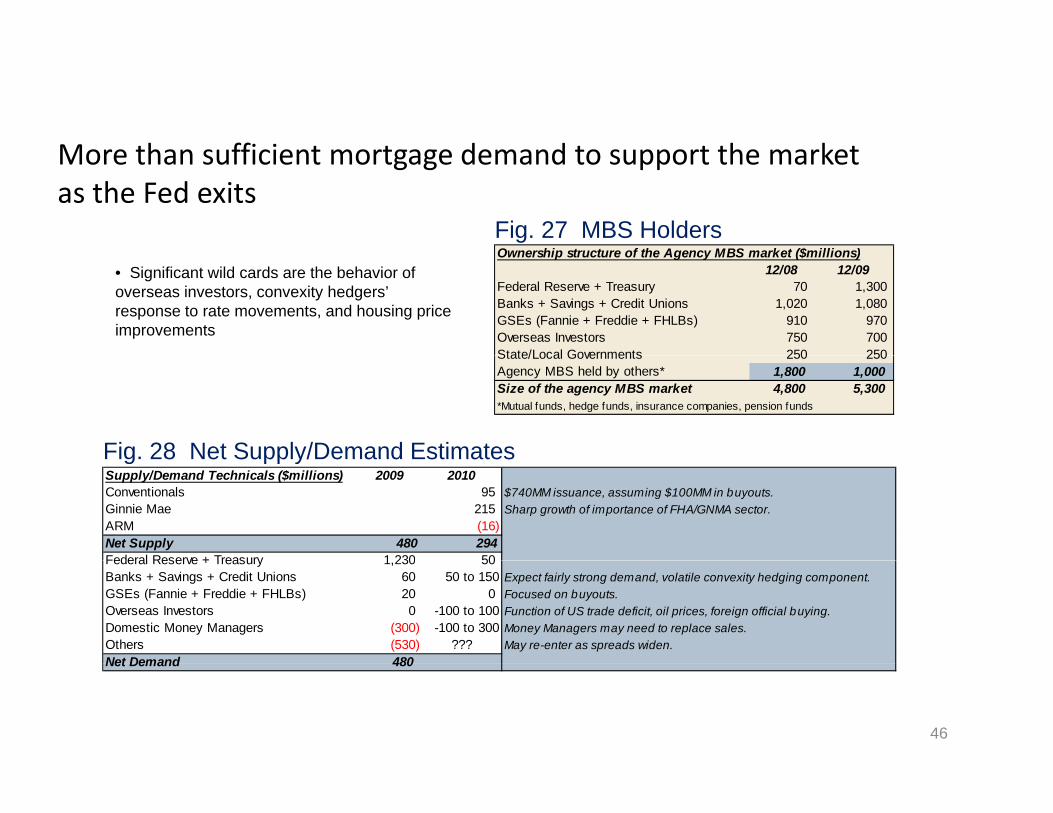
More than sufficient mortgage demand to support the marketMore than sufficient mortgage demand to support the market as the Fed exits
Fig. 27 MBS HoldersOwnership structure of the Agency MBS market ($millions)
• Significant wild cards are the behavior of overseas investors, convexity hedgers’ response to rate movements, and housing price improvements
Ownership structure of the Agency MBS market ($millions)12/08 12/09
Federal Reserve + Treasury 70 1,300Banks + Savings + Credit Unions 1,020 1,080GSEs (Fannie + Freddie + FHLBs) 910 970Overseas Investors 750 700State/Local Governments 250 250
Fig. 28 Net Supply/Demand Estimates
State/Local Governments 250 250Agency MBS held by others* 1,800 1,000Size of the agency MBS market 4,800 5,300*Mutual funds, hedge funds, insurance companies, pension funds
Supply/Demand Technicals ($millions) 2009 2010Conventionals 95 $740MM issuance, assuming $100MM in buyouts.Ginnie Mae 215 Sharp growth of importance of FHA/GNMA sector.ARM (16)Net Supply 480 294Federal Reserve + Treasury 1 230 50
Fig. 28 Net Supply/Demand Estimates
Federal Reserve + Treasury 1,230 50Banks + Savings + Credit Unions 60 50 to 150 Expect fairly strong demand, volatile convexity hedging component.GSEs (Fannie + Freddie + FHLBs) 20 0 Focused on buyouts.Overseas Investors 0 -100 to 100 Function of US trade deficit, oil prices, foreign official buying.Domestic Money Managers (300) -100 to 300 Money Managers may need to replace sales.Others (530) ??? May re-enter as spreads widen.Net Demand 480
46
Net Demand 480