Embed Size (px)
Citation preview

Presentation to the Select Committee on Trade Presentation to the Select Committee on Trade and International Relations –and International Relations –
the dti’s 2011/12 Annual Report the dti’s 2011/12 Annual Report
Date :14 November 2012Date :14 November 2012Director-GeneralDirector-General
Mr Lionel OctoberMr Lionel October

2
Presentation outlinePresentation outline Economic context
Strategic objectives
Achievements against planned targets
Financial management
Key challenges

3
Key highlights for Key highlights for 2011/122011/12
Industrial Policy gained traction in 4 key sectors (Autos, Clothing, BPS and Film)
Progress on reforming the Companies registrations landscape; and
Started key initiatives in the areas of co-operatives, SMEs Incubators.
Trade diversification to high growth markets (China).

4
Economic contextEconomic context
The global economic recovery still fragile since the sovereign debt crisis continues to haunt Europe.
The rate of the world’s real gross domestic product (GDP) growth declined from 5,2% in 2010 to 3,8% in 2011. Negative impact on tradeable sectors (manufacturing, mining and agricultural sectors)
However, growth in developing economies was still generally robust during the course of 2011, but was moderated in the last quarter due to a deteriorating global demand, which affected export performance.

5
Economic contextEconomic context
Source: Stats SA
Manufacturing Real Gross Value-Added Growth 2006 – 2011

6
Economic contextEconomic contextInternational Trade Performance
Global economic growth slowed significantly from 3,7% in the third quarter of 2011 to 2,6% in the fourth quarter, mainly on account of slower output growth in advanced economies.
European trade narrowly avoided a technical recession in the first quarter of 2012. Real output was at zero percent in the first quarter of 2012, following a contraction of 1,3% in the last quarter of 2011.
South Africa’s exports to the BRIC countries have increased significantly, with China being the main driving force behind this increase and India not far behind. Exports to BRICS in 2011: 72% of exports were to China; 21% to India; 5% to Brazil and 2% to Russia. Total trade with BRICS at R263,5 billion in 2011.
The stagnation in world trade volumes in 2011 and the rising domestic expenditure manifested itself in increasing imports in South Africa.
This culminated in an annualised trade deficit of R17,1 billion in the fourth quarter of 2011.
14,3 % of RSA exports were to Africa of which 73,3 % were to SADC.

Economic contextEconomic context
Investment performance
Real gross fixed capital formation grew steadily in 2011, showing an annual rate of 4,4%, recovering from a decline of 1,6% in 2010.
The fourth quarter recorded a particularly strong performance of 7,2%, with public corporations recording the strongest acceleration in capital spending.
The introduction of new amendments to the Companies Act, which came into effect in April 2011 has contributed to improvement in the investment climate.
7

Foreign Direct Investment cont..
8

Economic ContextEconomic Context
Investment performance South Africa has improved its ranking on the ease of doing business
from ranking 74 in 2011 to 44 out of 183 countries in 2012. (Doing Business 2012 by the World Bank)
In the World Economic Forum’s 2012 Global Competitiveness Report, South Africa moved up four places to number 50 out of 142 countries surveyed.
Overall, South Africa was ranked number one in ease of obtaining credit; number one in Auditing Standards; and number one in the regulation of the securities exchange.
In addition, it ranked number three in the protection of minority stakeholders and number 10 in the strength of protection of foreign investors.
9

10
Economic ContextEconomic ContextEmployment performance
The weak global economic recovery, together with the prevailing uncertainty about the global economy, is still negatively impacting job creation.
However, the economy managed to create 365 000 new jobs between the fourth quarters of 2010 and 2011.
This growth was supported by finance and other business services contributing 145 000 jobs, trade contributing 85 000, and community and social services 76 000. Manufacturing lost jobs in second and third quarters and gained 52 000 in the fourth quarter of 2011.

11
Structure of the dti‘s work Structure of the dti‘s work
the dti’s work is organised in terms of the following clusters:
Industrial development;
Trade, Investment and Exports;
Broadening Participation;
Regulation, and
Administration and Co-ordination

12
Achievements against Achievements against planned targetsplanned targets

13
The implementation of the Automotive Production and Development Programme (APDP) helped renew confidence.
This has been demonstrated through large investment commitments of R15 billion made by original equipment and component manufacturers.
China’s First Auto Works (FAW) committed to an investment of $100 million for a truck and car assembly plant, and Toyota SA to assembling minibus taxis locally.
Industrial Development - highlightsIndustrial Development - highlights

14
Industrial Development – Industrial Development – Public ProcurementPublic Procurement
Amended PPPFA Regulations effective from 7 December 2011. the dti empowered to designate sectors / industries from which govt departments and state-owned enterprises (SOEs) must procure locally
First round of sector (six) designations: Rail Rolling Stock: locomotives, wagons and carriages; Power Pylons; Buses; Clothing, Textiles, Leather and Footwear; Canned Vegetables; and Set Top Boxes.
Second round designation included 70 pharmaceutical products (Oral Dosage Tender)
Instruction notes signed by NT. Issues with respect to the localisation threshold in the RFP for STB’s subject of ongoing engagement.

15
BPS – mega investments relate to customer call centres, e.g. Amazon African customer service centre in Cape Town, with an investment of R834 m, Entersite to the value of R845 m and Mindpearl to the value of R356 m.
Under Monyetla II Programme, 3 400 young people were trained, 70% of which were placed in employment by the Business Process Outsourcing (BPO) consortium.
On Clothing and Textiles Competitive Incentive Programme (CTCIP) brought manufacturers and retailers such as Foschini, Truworths and Edcon together to take advantage of the proximity, quality and flexibility that domestic manufacturers offer. A total of R112 million was disbursed of which R831 million supporting 208 companies.
Industrial Development - HighlightsIndustrial Development - Highlights

16
BPS Mega Investments 2011/12
Investment: R 119mIncentive: R 1mJobs: 160
Investment: R 149mIncentive: R 2mJobs: 226
Investment: R 121mIncentive: R 5mJobs: 408
Investment: R 845mIncentive: R 69mJobs: 5 131
Investment: R 834mIncentive: R 32mJobs: 1 100
Investment: R 150mIncentive: R 7mJobs: 540
Investment: R 356mIncentive: R 14mJobs: 891
Investment: R 466mIncentive: R 20mJobs: 2 300 Projects Approved: 23
Investment: R4bn
Grant: R1.8bm
Jobs: 15 149
Payments: R51m

17
12I Mega Investments 2011/12
Investment: R 1.8bnIncentive: R 606mJobs: 2 145
Investment: R 8bnIncentive: R 353mJobs: 1 163
Investment: R 531mIncentive: R 168mJobs: 204
Investment: R 2bnIncentive: R 552mJobs: 194
Investment: R 762mIncentive: R 68mJobs: 1 924
Investment: R 1.5bnIncentive: R 237mJobs: 309
Investment: R 533mIncentive: R 191mJobs: 174
Investment: R 1.4bnIncentive: R 484mJobs: 2 394
Investment: R 2bnIncentive: R 904mJobs: 10 130
*Note: Jobs include direct & Indirect

19
Overview of Incentive SchemesOverview of Incentive Schemes
DESCRIPTION
ACTUAL
NUMBER OF FIRMS SUPPORTED
PROJECTED JOBSINVESTMENT LEVERAGED
R'000
EIP -MIP 648 SMME 15 586 10 650 000
EIP –TSP 158 SMME 1 744 1 650 000
AIS 92 5 344 4 700 000
BPS 23 projects 15 149 4 100 000
Film & Television 72 productions - 2 000 000
12 I Allowance Programme 14 1 969 22 400 000
Co-operatives (CIS) 183 - -
BBSDP 299 - -
EMIA 896 - -
CIP 6 projects - -
SPII 52 - -
TOTALS 2 890 48 581 128 392 932

Broadening Participation - Broadening Participation - HighlightsHighlights
Enterprise development and Women Empowerment
the dti through the Small Enterprise Development Agency (seda) has to date established a network of 42 branches, 17 mobile units, 47 information kiosks and three Enterprise Information Centres (EICs) countrywide.
31% of which are women-owned enterprises and 86% are black-owned entities.
34 incubators countrywide supporting SMMEs in various industrial sectors including agriculture, agro-processing, construction, Information and Communication Technology (ICT), manufacturing, mining and minerals beneficiation.
the dti has received 44 incubator proposals from private sector, science councils and institutions of higher education. The Incubation Support Programme administered by TEO has been allocated funds for 2012/13 to support PPP incubators.
The Strategic Framework on Gender and Women Economic Empowerment has been finalised to affirm gender mainstreaming.
20

Broadening Participation- Broadening Participation- HighlightsHighlights
Co-operatives
Initiation of a national pilot project to establish six provincial Red Tape Reduction Forums.
Workplace Challenge extended its scope to 396 small and medium enterprises and co-operatives.
21

Broadening Participation- Broadening Participation- HighlightsHighlights
SMMEs Productivity support is now also provided to three industrial clusters specialising in
sawmilling, agro-processing and fishing in the Msinga and Doringbaai areas. Continuous improvement interventions were extended to 149 companies, mainly SMMEs.
In support of the National Skills Accord, the dti secured work experience placements for unemployed graduates in partnership with the Department of Labour, Productivity SA and the SA Graduate Development Association (SAGDA).
Work is under way to secure a Memorandum of Understanding (MoU) with Majuba FET College to establish a Centre of Entrepreneurship in Newcastle.
Seda Technology Incubation Programme created 295 new SMMEs and supported 1 089 SMMEs.
Hosted the SMME conference in October 2011.
SMME Payment Hotline – since its inception in 2009, over R300 miilion has been facilitated to SMMEs.
22
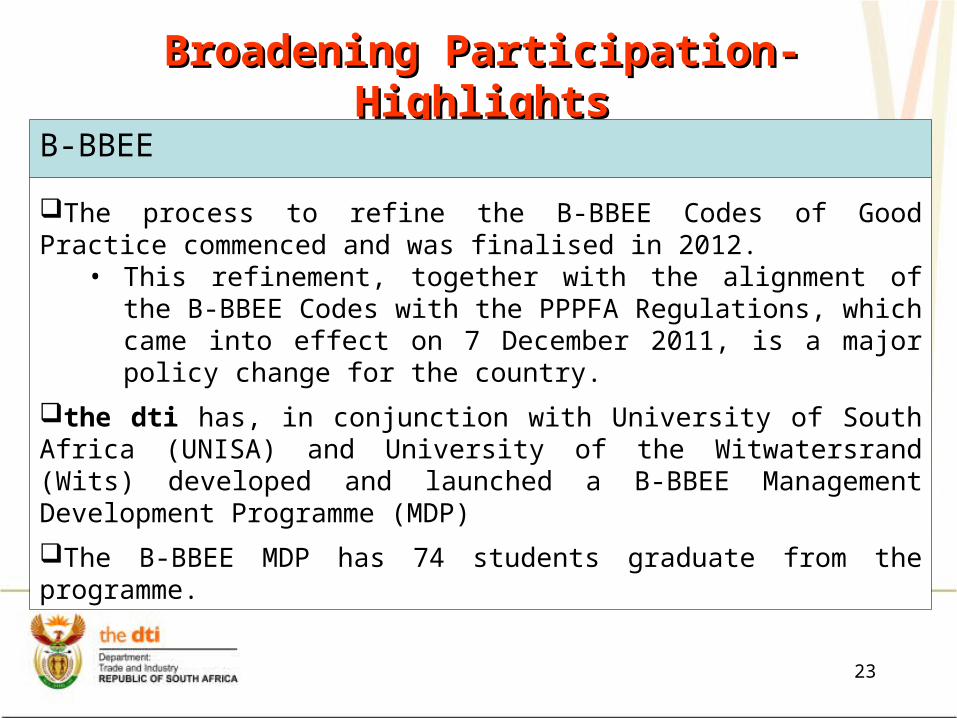
Broadening Participation- Broadening Participation- HighlightsHighlights
B-BBEE
The process to refine the B-BBEE Codes of Good Practice commenced and was finalised in 2012.
• This refinement, together with the alignment of the B-BBEE Codes with the PPPFA Regulations, which came into effect on 7 December 2011, is a major policy change for the country.
the dti has, in conjunction with University of South Africa (UNISA) and University of the Witwatersrand (Wits) developed and launched a B-BBEE Management Development Programme (MDP)
The B-BBEE MDP has 74 students graduate from the programme.
23

24
Provincial SpreadNorth West:BBSDP: 3CIS: 14EIP: 29
Northern Cape:BBSDP: 1CIS: 0EIP: 12
Western Cape:BBSDP: 42CIS: 22EIP: 157
Eastern Cape:BBSDP: 18CIS: 15EIP: 62
Kwa Zulu Natal:BBSDP: 34CIS: 46EIP: 146
Mpumalanga:BBSDP: 5CIS: 8EIP: 49
Limpopo:BBSDP: 57CIS: 41EIP: 49
Gauteng:BBSDP: 133CIS: 35EIP: 272
Free State:BBSDP: 13CIS: 2EIP: 30
Provincial Spread: Broadening Participation Incentives
24

25
Provincial SpreadNorth West:12I: 0BPS:0 Film: 0AIS: 0CIP: 0
Northern Cape:12I: 0BPS: 0Film: 3AIS: 0CIP: 0
Western Cape:12I: 1BPS: 13Film: 54AIS: 1CIP: 1
Eastern Cape:12I: 2BPS: 0Film: 5AIS: 33CIP: 0
Kwa Zulu Natal:12I: 1BPS: 6Film: 1AIS: 16CIP: 1
Mpumalanga:12I: 2BPS: 0Film: 0AIS: 0CIP: 0
Limpopo:12I: 1BPS: 0Film: 0AIS: 0CIP: 1
Gauteng:12I: 5BPS:4 Film: 48AIS: 37CIP: 4
Free State:12I: 2BPS:0 Film: 0AIS: 0CIP: 0
Provincial Spread: Investment Incentives

26
Performance of the IDZsPerformance of the IDZs
DESCRIPTION
ACTUAL
NUMBER OF INVESTORS JOBS
INVESTMENT LEVERAGED
R'000
COEGA 7 7 803 4 100 000
East London IDZ 2 89 71,000
Richards Bay IDZ The work covered bulk earthworks including fencing in Phase 1A. The work created 281 construction jobs and will enable the IDZ to attract much needed investors to the zone.
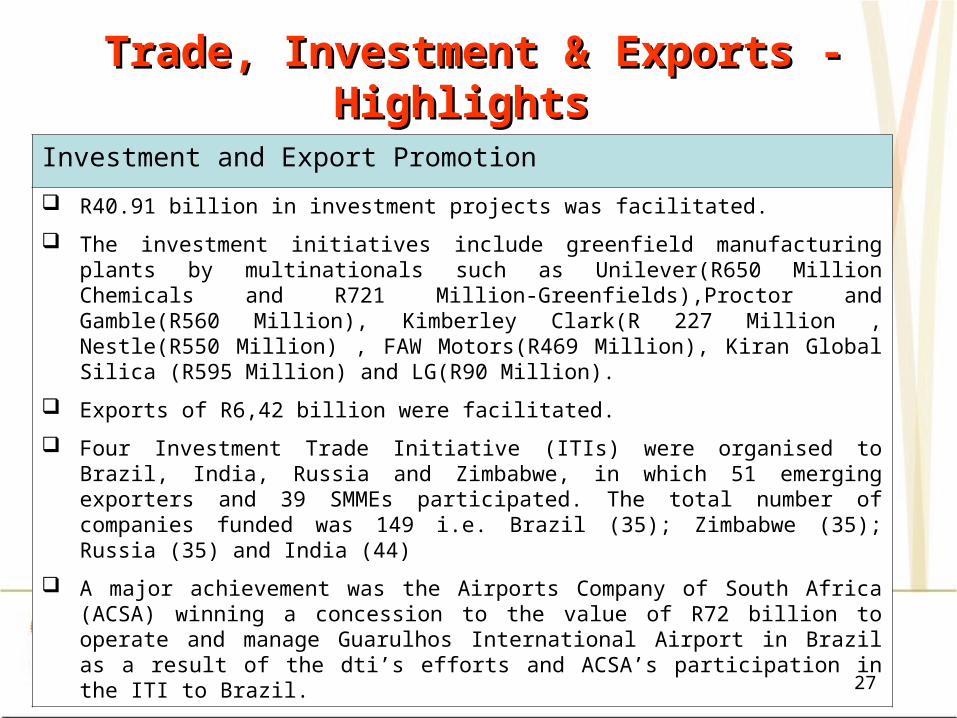
Trade, Investment & Exports - Trade, Investment & Exports - Highlights Highlights
Investment and Export Promotion
R40.91 billion in investment projects was facilitated.
The investment initiatives include greenfield manufacturing plants by multinationals such as Unilever(R650 Million Chemicals and R721 Million-Greenfields),Proctor and Gamble(R560 Million), Kimberley Clark(R 227 Million , Nestle(R550 Million) , FAW Motors(R469 Million), Kiran Global Silica (R595 Million) and LG(R90 Million).
Exports of R6,42 billion were facilitated.
Four Investment Trade Initiative (ITIs) were organised to Brazil, India, Russia and Zimbabwe, in which 51 emerging exporters and 39 SMMEs participated. The total number of companies funded was 149 i.e. Brazil (35); Zimbabwe (35); Russia (35) and India (44)
A major achievement was the Airports Company of South Africa (ACSA) winning a concession to the value of R72 billion to operate and manage Guarulhos International Airport in Brazil as a result of the dti’s efforts and ACSA’s participation in the ITI to Brazil.
27

28
Provincial SpreadNorth West:PAV: R1,95 millionMission: R0.099 million
Northern Cape:PAV: R0.073 millionMission: R0,57 million
Western Cape:PAV: R2,83 millionMission: R1,181 million
Eastern Cape:PAV R1,76 millionMission: R0,194 million
Kwa Zulu Natal:PAV: R0,209 million Mission: R0,288 million
Mpumalanga:Pav:R1,39 millionMission: R0,019 million
Limpopo:PAV:R0,293million Mission: R0,227million
Gauteng:PAV: R17millionMission: R 3,998million
Free State:PAV: R0,688 millionMission: R0.017 million
PROVINCIAL SPREAD : Financial Assistance on National Pavilions and Missions under EMIA

29
Provincial SpreadPAV: North West:R0mMission: R0, 267million
Northern Cape:PAV: R4,35
millionMission: R0m
Western Cape:PAV: R1 248,4 millionMission: R 237,8million
Eastern Cape:PAV: R197,982 millionMission: R2,9million
Kwa Zulu NatalPAV: R23,982 millionMission: R3.1million
MpumalangaPAV: R130,95 MillionMission: R0m
Limpopo:PAV: R18,1 millionMission: R2,9 million
GautengR4,327 millionMission: R 222,5
million
Free StatePAV: R2,134 millionMission: R0m
PROVINCIAL SPREAD: Export Sales at National Pavilions and Missions under EMIA

30
Provincial Spread
North West: 0
Northern Cape:0
Western Cape:0
Eastern Cape: Exhibition Training, East London(30)
Kwa-Zulu Natal: 0
Mpumalanga: 0
Limpopo:Export Awareness;
Tzaneen (56) Polokoane (43)
Gauteng: the dti Open Day:
Export Development Training (17)
Free State:Exhibition Training
(70)
Provincial Spread: TISA Workshops
30
Total: 216 Companies Trained

31
Provincial Spread
North West: 40
Northern Cape: 0
Western Cape: 100
Eastern Cape: 14
Kwa-Zulu Natal: 60
Mpumalanga: 30
Limpopo: 16
Gauteng: 200
Free State: 70
Provincial Spread: TISA Trade Lead Dissemination
31

Trade, Investment & Exports- Trade, Investment & Exports- HighlightsHighlights
Africa
Regional Integration
Work programme on industrial development has been agreed to by the SACU Council. Eight sectors have been identified for cross-border complementarities and value-chains, with the agro-processing sector a pilot
South Africa has met its obligations under the SADC Trade Protocol with 92,5% of tariffs at 0.
SA’s view that work should focus on consolidating the SADC Free Trade Agreement (FTA), and extending regional markets through the T-FTA, rather than moving towards a SADC customs union, is accepted
32

Trade, Investment & Exports - Trade, Investment & Exports - HighlightsHighlights
Africa
Tripartite summit was hosted and the T-FTA was launched.
Continental FTA: South Africa’s position regarding timing, scope and broad principles to boost intra-Africa trade was accepted in the African Union (AU) summit that was held in January 2012.
33

Trade, Investment & Exports - Trade, Investment & Exports - HighlightsHighlights
Bilateral:
Co-operation memoranda of understanding (MoUs) were signed with partner countries in Africa (Ghana, Benin, Burundi, Namibia and Mozambique).
Six trade and investment facilitation missions were undertaken- (Angola, DRC, Zimbabwe, Southern Sudan, Malawi and Cameroon).
Technical cooperation arrangements were facilitated with three African country partners – (Cameroon, Mauritius, Zambia).
34

Trade, Investment & Exports - Trade, Investment & Exports - HighlightsHighlights
Multilateral South Africa’s membership of the BRICS alliance has been a major achievement in
strengthening South-South relations.
the dti’s efforts to advance South Africa’s trade and investment interest at the BRICS and IBSA summits, with respect to multilateral and bilateral economic collaboration, yielded substantial results, which included:
Coordination of business participation such as Business Unity South Africa (BUSA) and Black Business Council (BBC)
Work programme for the BRICS Contact Group on Economic and Trade Issues (CGETI)
Proposed BRICS-led Development Bank to support infrastructure projects in BRICS and Africa
2 major projects: BRICS Undersea cable – US $1bn BRICS reinsurance tool aimed at providing reinsurance for projects within
BRICS and other high growth markets
35

Trade, Investment & Exports- Trade, Investment & Exports- HighlightsHighlights
Top 10 investment projects and top 10 value-added export products prepared and submitted to China. 70 companies exhibited in China and R400 million in Export sales secured. Progress in reducing trade deficit with China – over 50% from R48 billion in 2008 to less than R18 billion in 2011.
the dti continued to lead South Africa’s engagement in the Economic Partnership Agreement (EPA) negotiations with the EU to establish a trade-in-goods arrangement between SACU and the EU.
36

Regulation - HighlightsRegulation - Highlights Policy and legislative development
Introduction of the Cooperatives Amendment Bill into Parliament in 2012.
Gambling Review Commission Report (awaits Select Committee feedback), Copyright Review Commission Report finalised and released, and Intellectual Property Laws Amendment Bill tabled in Parliament.
SEZ Bill approved by Cabinet and public consultations finalised. B-BBEE Amendment Bill was tabled in Cabinet in the first quarter of
2012. Two major pieces of legislation came into effect, namely:
Companies Act, 2008 (Act No. 71 of 2008). Consumer Protection Act, 2008 (Act No. 62 of 2008).
Business Rescue successes - 652 business rescue applications received and 104 business rescue practitioners accredited by CIPC.
37

Regulation - HighlightsRegulation - Highlights
Policy and legislative development According to StatsSA, fewer companies closed down in 2011 than in
2010, with the total number of liquidations for 2011 falling 10,8% (from 3 992 in 2010 to 3 559 in 2011)
The Security Regulatory Panel, which is now the Takeover Regulation Panel, was established with the extended mandate under the Companies Act
The Financial Reporting Standards Council has also been established in terms of the Companies Act to advise the Minister on standards in line with international requirements
Improved monitoring of liquor distributors and macro manufacturers in terms of the Liquor Act of 2003
38

39
Provincial SpreadNorth West:No of registrations: 101Approved registrations: 55Cancelled registrations: 53
Provincial Spread: Liquor Distributors and Manufacturers Gauteng:No of registrations: 729Approved registrations:142Cancelled registrations: 121
Limpopo:No of registrations:129Approved registrations: 44Cancelled registrations: 42
Mpumalanga:No of registrations: 104Approved registrations:32Cancelled registrations: 30
Kwa-Zulu Natal:No of registrations: 327Approved registrations: 83 Cancelled registrations: 58
Free State:No of registrations: 130Approved registrations: 34Cancelled registrations: 33
Eastern Cape:No of registrations: 145 Approved registrations: 55Cancelled registrations: 53
Western Cape:No of registrations: 582Approved registrations: 89Cancelled registrations: 79
Northern Cape:No of registrations: 51Approved registrations: 7Cancelled registrations: 6

Administration & Co-ordination- Administration & Co-ordination- HighlightsHighlights
the dti managed to reduce its vacancy rate from 18% to 8,45%.
95% of all eligible payments were processed within 21 days as required by legislation pertaining to the payment of creditors within 30 days.
Percentage of women occupying senior management positions is 43.8% (DDGs – women is 50%).
Percentage of People With Disability is 2.6%, which is above 2% target set for the entire public service.
The department had several engagements with the public through the “Taking the dti to the People” programme, which is championed by Deputy Minister Elizabeth Thabethe.
The programme gives communities the opportunity to come face-to-face with the dti and to familiarise themselves with services the department and its public entities have to offer.
40

41
Provincial Spread
North West: 1
Northern Cape: 3
Western Cape: 3
Eastern Cape: 1
Kwa-Zulu Natal: 5
Mpumalanga: 2
Limpopo: 2
Gauteng: 5
Free State: 4
Provincial Spread: Taking the dti to the People
41

Vacancy report Vacancy report
42
Vacancy reduction
Recruitment efforts
* Includes posts additional to the establishment
2011/12Quarter 1
(1.4.11 – 30.6.11)
2011/12Quarters 1 - 4
2012/13Quarter 1
(1.4.12 – 30.6.12)
Posts filled through appointments
42 293 68
Posts filled through promotions
27 169 31
Total recruitment efforts *
69 462 99

Governance & Oversight of the dti’s Governance & Oversight of the dti’s entitiesentities
As part of strengthening relations between the dti and its entities, the Minister continuously engaged with Accounting Authorities through individual engagements with the Commissioners and their deputies as well as the Chairpersons of Boards and/or Tribunals to discuss strategic priorities and key challenges.
The Policy Framework on governance and oversight on the entities was finalised – it is aimed at bringing a uniform approach to the oversight of entities.
Critical interventions were made at EAAB, National Regulator for Compulsory Specifications (NRCS), National Credit Regulator (NCR) and the National Consumer Commission (NCC).
the dti also intervened in situations where governance problems were identified as a risk in some entities and worked collaboratively with them to stabilise the situation.
43
44
Financial Financial managementmanagement

Budget vs. expenditure for the 2011/12 Budget vs. expenditure for the 2011/12 financial year – per programmefinancial year – per programme
45
Programme 2011/12 Unspent as % of final
appropriationFinal
Appropriation
Actual Expenditure
Variance Expenditure as % of final
appropriation
R’000 R’000 R’000
Administration 569,917 563,873 6,044 98.9% 1.1%International Trade and Economic Development 139,238 132,920 6,318 95.5% 4.5%Empowerment & Enterprise Development 896,245 887,513 8,732 99.0% 1.0%Industrial Development 1,333,129 1,321,671 11,458 99.1% 0.9%Consumer and Corporate Regulation 225,447 218,564 6,883 96.9% 3.1%The Enterprise Organisation 3,301,230 3,283,549 17,681 99.5% 0.5%Trade and Investment South Africa 330,102 317,388 12,714 96.1% 3.9%Communication & Marketing 81,205 75,502 5,703 93.0% 7.0%Total 6,876,513 6,800,980 75,533 98.9% 1.1%

Economic classification 2011/12 Unspent as % of final
appropriationFinal
AppropriationActual
Expenditure Variance Expenditure as
% of final appropriation
R’000 R’000 R’000
Compensation of Employees 588,389 566,988 21,401 96.4% 3.6%
Goods & Services 634,395 593,730 40,665 93.6% 6.4%
Interest and rent on land 73 73 - 100% -
Transfers to:
Departmental agencies 1,058,599 1,058,599 - 100% -
Manufacturing incentives, including:
1,862,247 1,861,159 1,088 99.9 0.1%
**Automotive Production & Development Programme
951,548 951,457 91 99.9% 0.1%
Incentives to industry 1,432,584 1,424,109 8,475 99.4% 0.6%
Infrastructure incentives 844,403 844,335 68 99.9% 0.1%
Export incentives 311,011 310,965 46 99.9% 0.1%
Other 70,562 68,946 1,616 97.7% 2.3%
Payments for capital assets 38,662 36,490 2,172 94.4% 5.6%
Payment for financial assets 35,588 35,586 2 99.9% 0.1%
Total 6,876,513 6,800,980 75,533 98.9% 1.1%
Budget vs. expenditure for the 2010/11 financial Budget vs. expenditure for the 2010/11 financial year – economic classification year – economic classification
46
** Amounts in respect of AIS are already included under the manufacturing incentives

Five Year Comparison of budget Five Year Comparison of budget vs Expenditure – R’000vs Expenditure – R’000
47
2007/08 2008/09 2009/10 2010/11 2011/12
Budget 5 479 433 5 126 893 6 402 076 6 194 208 6 876 513
Expenditure 5 295 250 5 057 064 6 237 955 5 796 741 6 800 980
Unspent 184 183 69 829 164 121 397 467 75 533
% Unspent 3.36% 1.36% 2.56% 6.42% 1.10%
01 000 0002 000 0003 000 0004 000 0005 000 0006 000 0007 000 0008 000 000

Overview of expenditureOverview of expenditure The expenditure based on the annual projections of R6,876 billion
is 98.9% or R6,801 billion, implying an under-spending of R75 million (1.1%).
The under-expenditure is as a result of:-
Compensation of Employees (R21m) - Due to vacancy rate of 8.4%;
Goods and Services (R41m) – Creditor invoices totalling R4,5m and DIRCO claims totalling R29,1 that were only received after financial year end; and
Incentives (R10m) – claims for approved incentives not received timeously from private companies for processing in the financial year under consideration.
48

AG’s ReportAG’s Report
49
Unqualified Audit Opinion.
Matters successfully dealt emanating from previous audit - 2010/11
Performance information – improved performance indicators to SMART criteria- zero findings; and
Asset management – monthly asset reconciliations conducted. All losses were investigated and reported.
Current matters raised
– Contingent liabilities in respect of lawsuits and incentive grants approved by the department but not paid.

AG’s Report cont..AG’s Report cont..
50
Current Matters raised
– Irregular expenditure relates to:
The irregular expenditure is of a technical nature and the department did receive value for money.
The absence of at least three comparable quotations for expenses in excess of R10 000 (in most cases three quotes requested but not all received).
The use of single source service providers without obtaining the required approval, e.g. training, conferences, media and publishing etc.
The expenditure should have been authorised by the Accounting Officer or the delegated officials. The view of the department is that this was inherent in the delegations of power for expenditure. Such deviations are required to be specific in the delegations which have since been updated.

Key ChallengesKey Challenges
Global slow down and its impact on tradeable sectors.
Management and governance of the dti entities.
Inter-governmental coordination.
Mainstreaming and/or formalisation of co-operatives/ small black business and increasing demand for 10 set asides for small businesses procurement.
Short vs Medium- term job creation.
51

52
Thank youThank you