Embed Size (px)
Citation preview
Presentation to the Board of RegentsPresident M. Duane Nellis
Texas Tech University
October 10, 2014
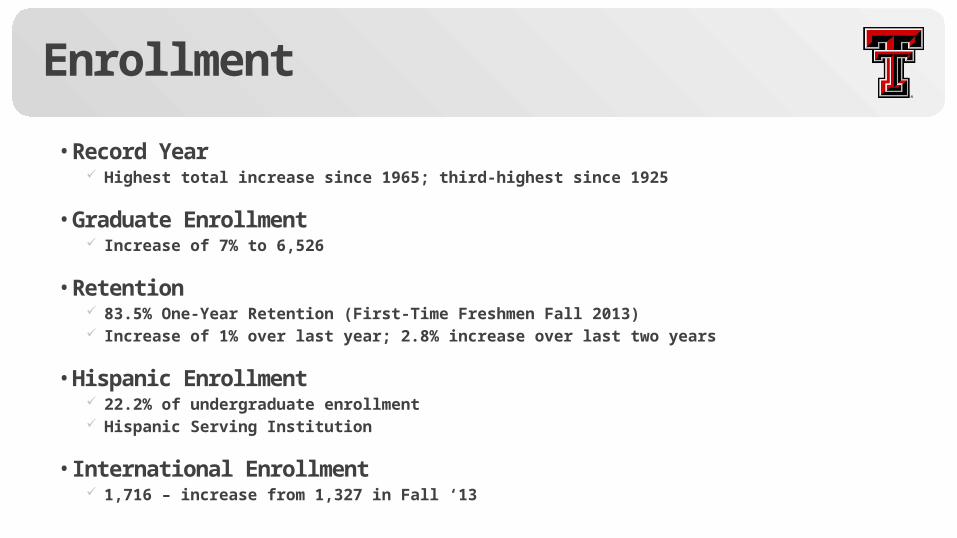
Enrollment
• Record Year Highest total increase since 1965; third-highest since 1925
• Graduate Enrollment Increase of 7% to 6,526
• Retention 83.5% One-Year Retention (First-Time Freshmen Fall 2013) Increase of 1% over last year; 2.8% increase over last two years
• Hispanic Enrollment 22.2% of undergraduate enrollment Hispanic Serving Institution
• International Enrollment 1,716 – increase from 1,327 in Fall ‘13
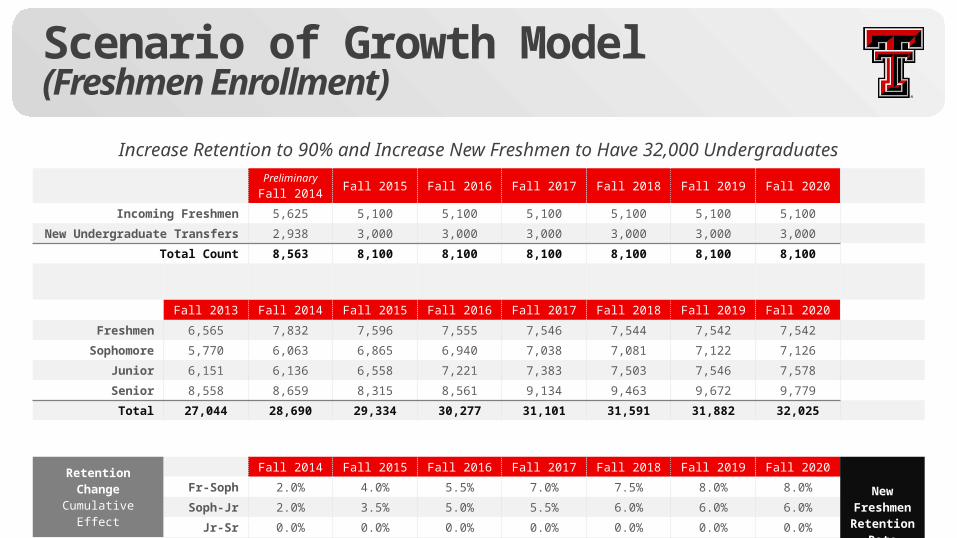
Scenario of Growth Model(Freshmen Enrollment)
Increase Retention to 90% and Increase New Freshmen to Have 32,000 UndergraduatesPreliminaryFall 2014 Fall 2015 Fall 2016 Fall 2017 Fall 2018 Fall 2019 Fall 2020
Incoming Freshmen 5,625 5,100 5,100 5,100 5,100 5,100 5,100
New Undergraduate Transfers 2,938 3,000 3,000 3,000 3,000 3,000 3,000
Total Count 8,563 8,100 8,100 8,100 8,100 8,100 8,100
Fall 2013 Fall 2014 Fall 2015 Fall 2016 Fall 2017 Fall 2018 Fall 2019 Fall 2020
Freshmen 6,565 7,832 7,596 7,555 7,546 7,544 7,542 7,542
Sophomore 5,770 6,063 6,865 6,940 7,038 7,081 7,122 7,126
Junior 6,151 6,136 6,558 7,221 7,383 7,503 7,546 7,578
Senior 8,558 8,659 8,315 8,561 9,134 9,463 9,672 9,779
Total 27,044 28,690 29,334 30,277 31,101 31,591 31,882 32,025
Retention ChangeCumulative Effect
Fall 2014 Fall 2015 Fall 2016 Fall 2017 Fall 2018 Fall 2019 Fall 2020New
Freshmen Retention
Rate
Fr-Soph 2.0% 4.0% 5.5% 7.0% 7.5% 8.0% 8.0%
Soph-Jr 2.0% 3.5% 5.0% 5.5% 6.0% 6.0% 6.0%
Jr-Sr 0.0% 0.0% 0.0% 0.0% 0.0% 0.0% 0.0%
Annual Adjustment(Deviation from
Current %)
Fr-Soph 2.0% 2.0% 1.5% 1.5% 0.5% 0.5% 0.0% 90.0%
Soph-Jr 2.0% 1.5% 1.5% 0.5% 0.5% 0.0% 0.0% 77.0%
Jr-Sr 0.0% 0.0% 0.0% 0.0% 0.0% 0.0% 0.0%
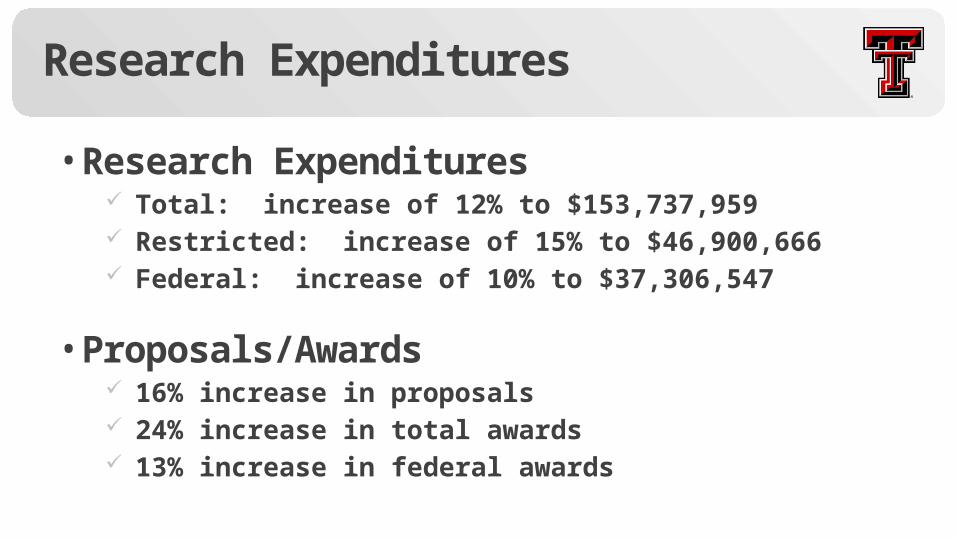
Research Expenditures
• Research Expenditures Total: increase of 12% to $153,737,959 Restricted: increase of 15% to $46,900,666 Federal: increase of 10% to $37,306,547
• Proposals/Awards 16% increase in proposals 24% increase in total awards 13% increase in federal awards
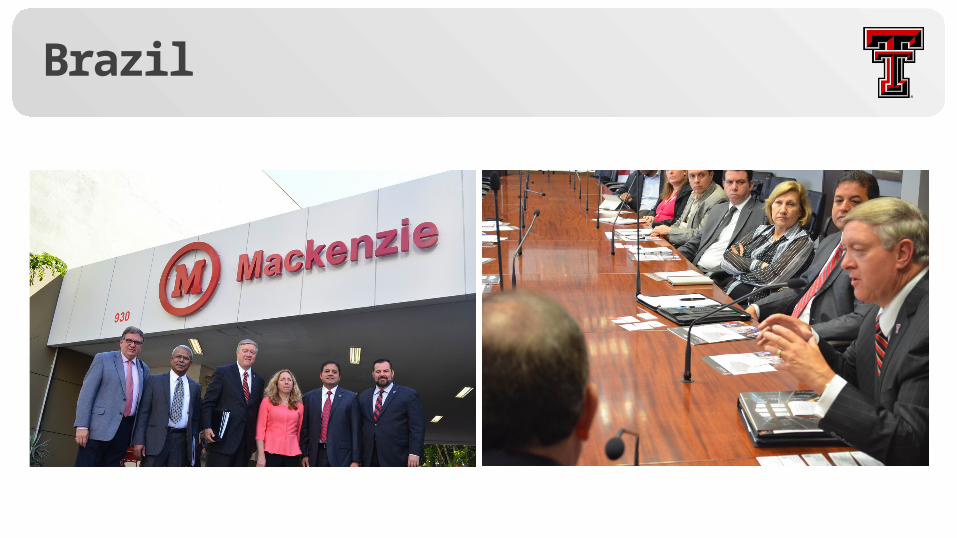
Brazil
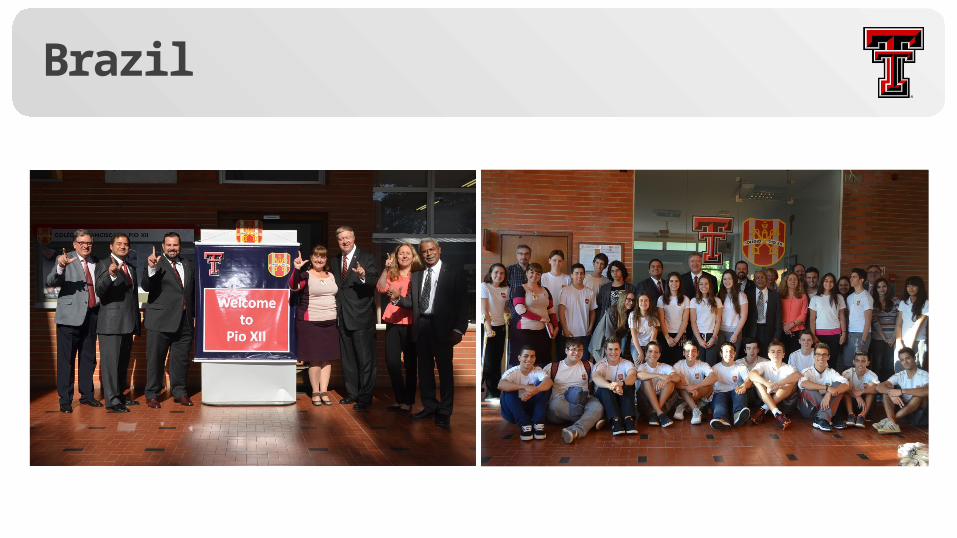
Brazil
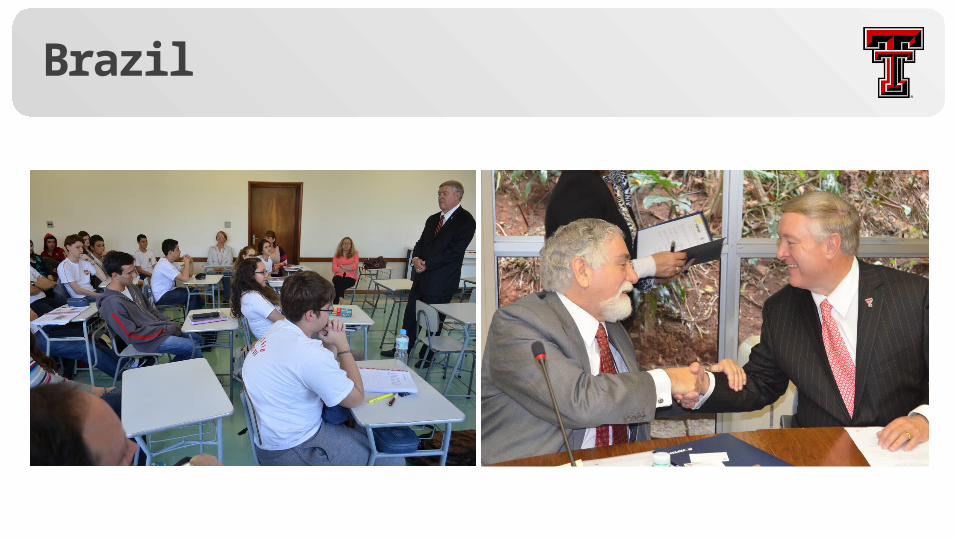
Brazil
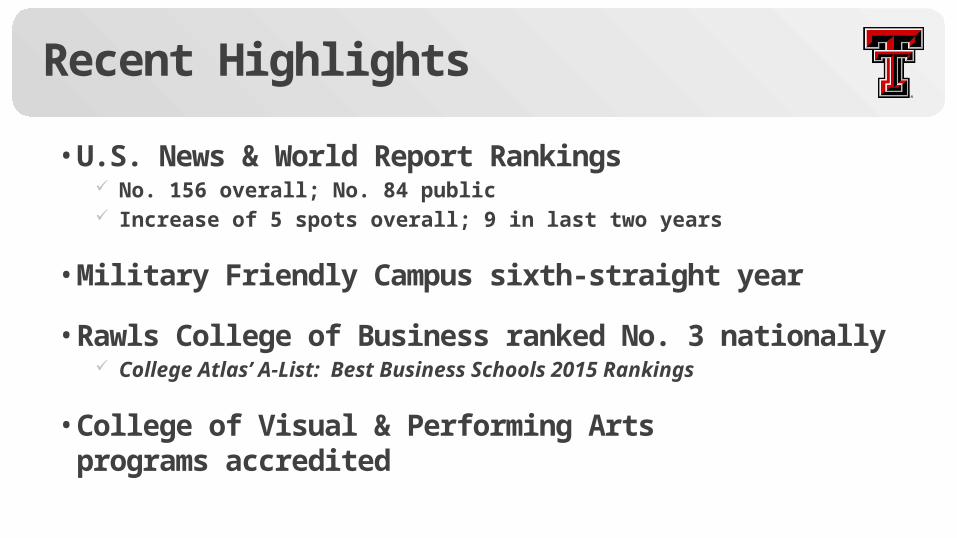
Recent Highlights
• U.S. News & World Report Rankings No. 156 overall; No. 84 public Increase of 5 spots overall; 9 in last two years
• Military Friendly Campus sixth-straight year
• Rawls College of Business ranked No. 3 nationally College Atlas’ A-List: Best Business Schools 2015 Rankings
• College of Visual & Performing Artsprograms accredited
Research Park
• Board of Directors Finalized First meeting later this month
• Planning TTIME recruitment 3-Day Startup Weekend Naming Rights TECHcelerator
New Building Needs
• Tuition Revenue Bond ESB II College of Engineering Expansion/Renovation
• HEAF Life Safety Upgrade College of Engineering
• Former Petroleum Engineering• Former Mass Communication
• Auxiliaries Wall/Gates Residence Hall Renovations (Summer 2015) New Residence Hall (Fall 2017)
Fundraising Efforts and Needs
• Scholarships/Endowments
• College of Engineering
• College of Visual & Performing Arts
• Athletics
Campus Safety
• Task Force on Greek Organization Culture Dr. Juan Muñoz, Sr. Vice President and Vice Provost, Chair Members identified and appointed