Embed Size (px)
Citation preview
PRESENTATION TO SHAREHOLDERS 23RD OCTOBER, 2015
VISION
To be the most innovative investment Group in the South
Pacific
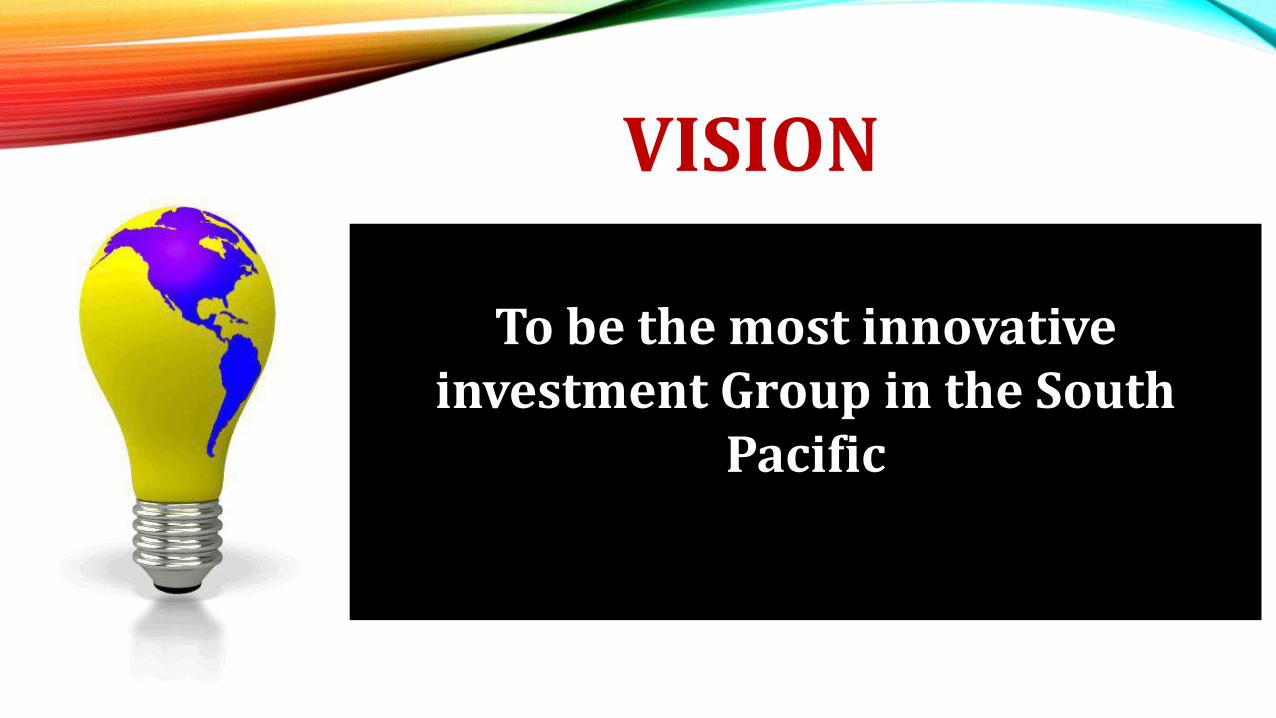
CreateSustainable and consistent value
Promote the growth& Development
MaintainHighestintegrity
Lead in allchosen areas
MISSION
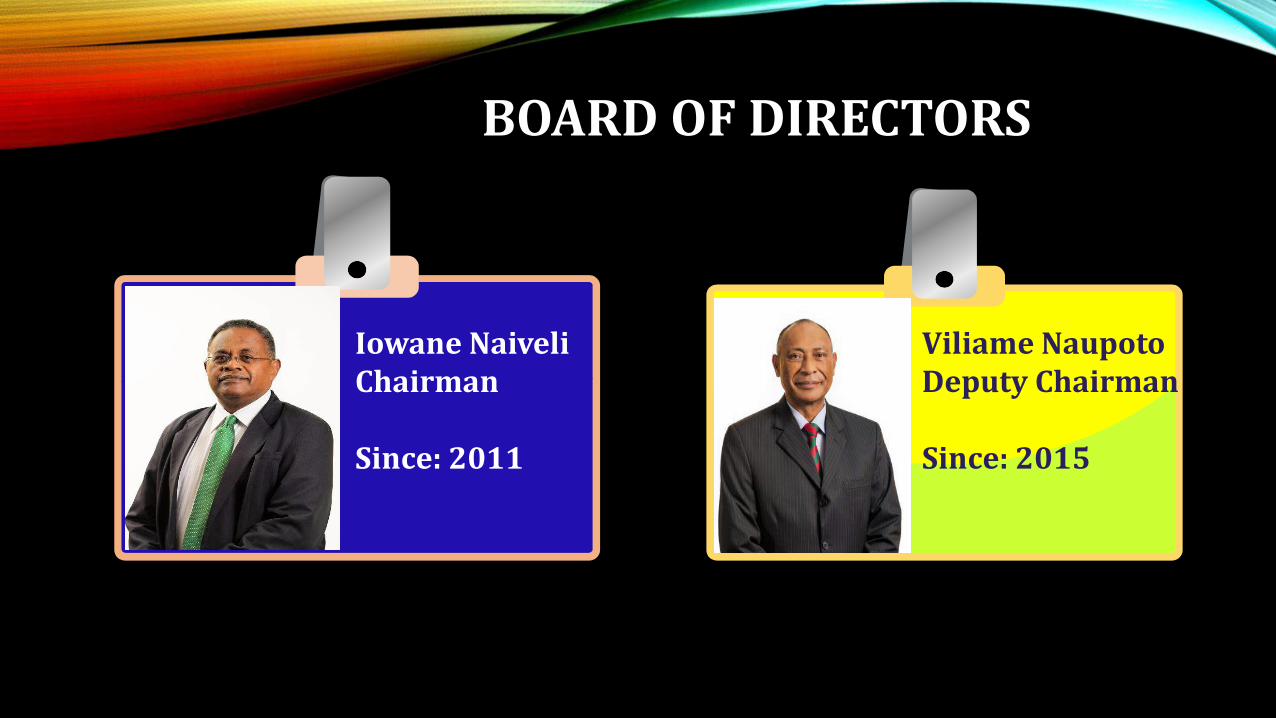
Iowane NaiveliChairman
Since: 2011
Viliame NaupotoDeputy Chairman
Since: 2015
BOARD OF DIRECTORS
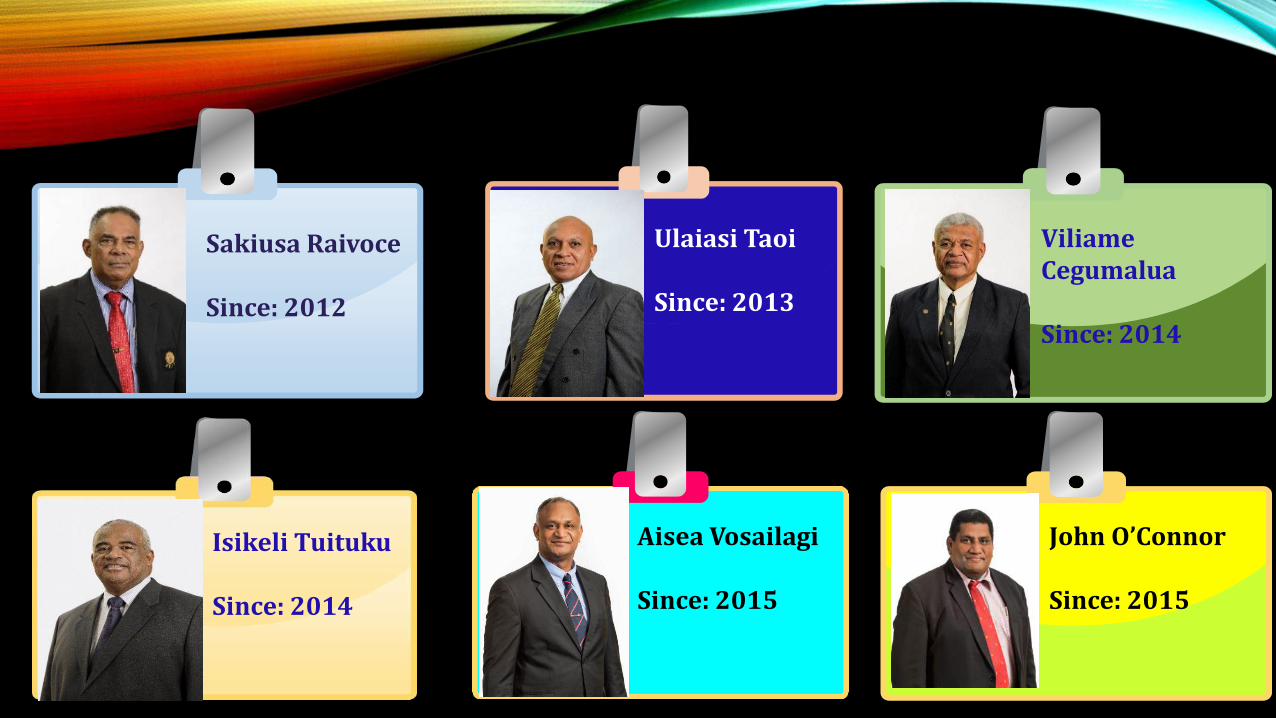
Sakiusa Raivoce
Since: 2012
Ulaiasi Taoi
Since: 2013
Viliame Cegumalua
Since: 2014
Isikeli Tuituku
Since: 2014
Aisea Vosailagi
Since: 2015
John O’Connor
Since: 2015
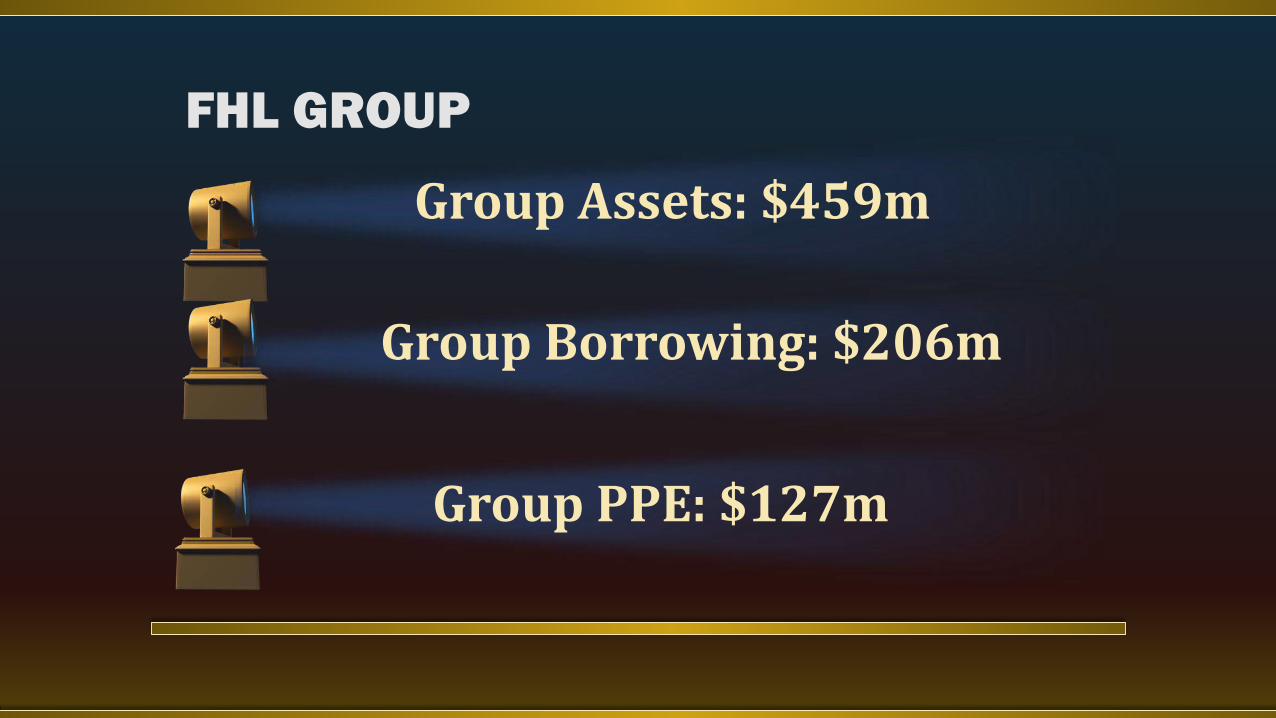
Group Assets: $459m
Group Borrowing: $206m
Group PPE: $127m
FHL GROUP
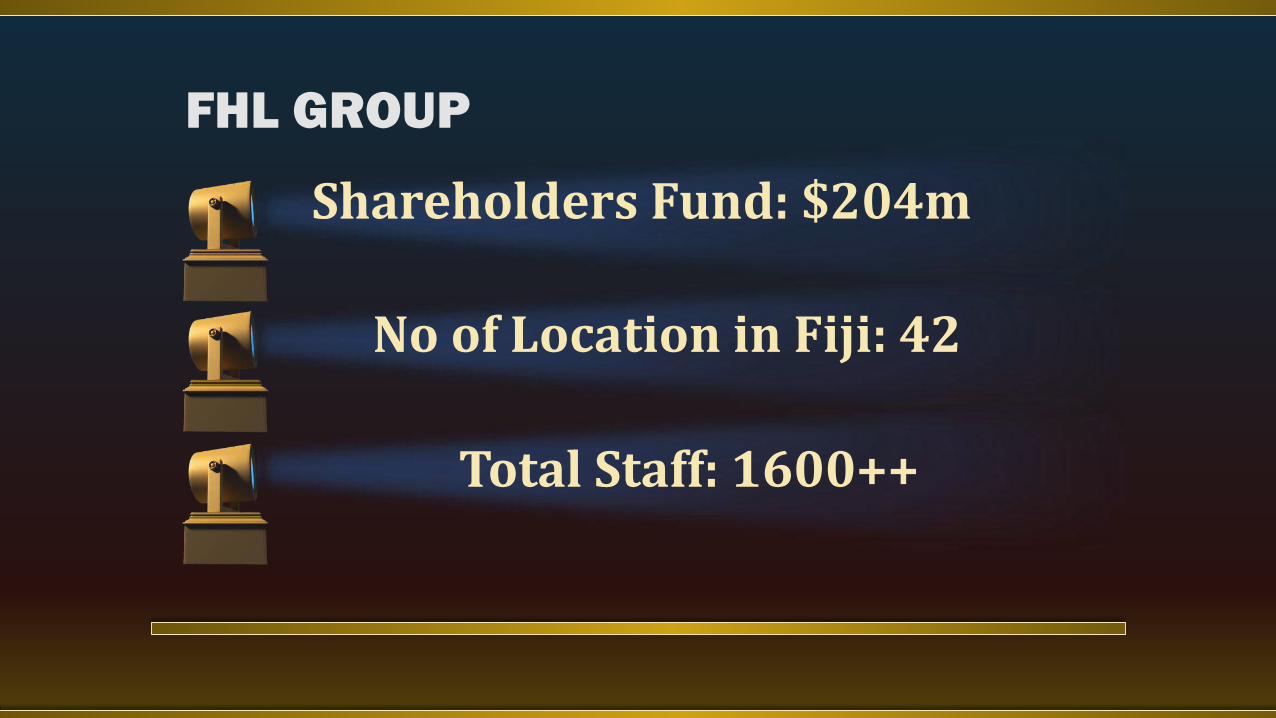
Shareholders Fund: $204m
No of Location in Fiji: 42
Total Staff: 1600++
FHL GROUP
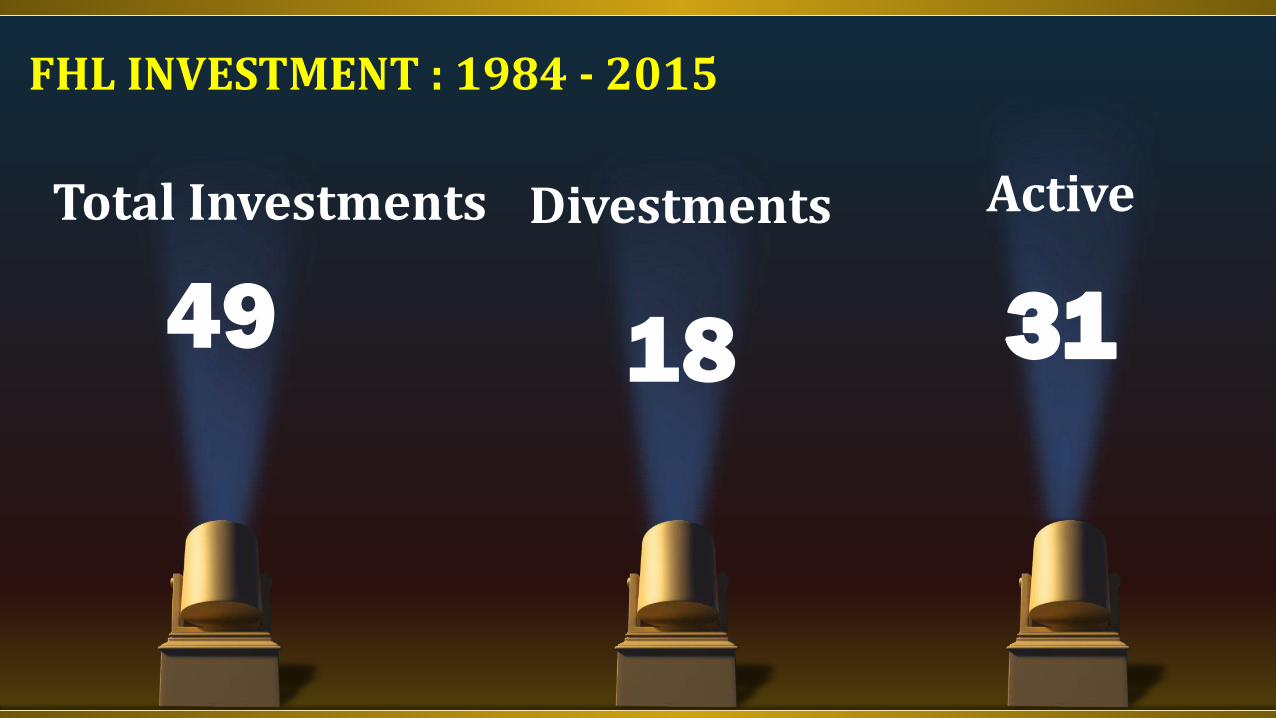
Active
31
Divestments
18
Total Investments
49
FHL INVESTMENT : 1984 - 2015
Failed Investments: 4
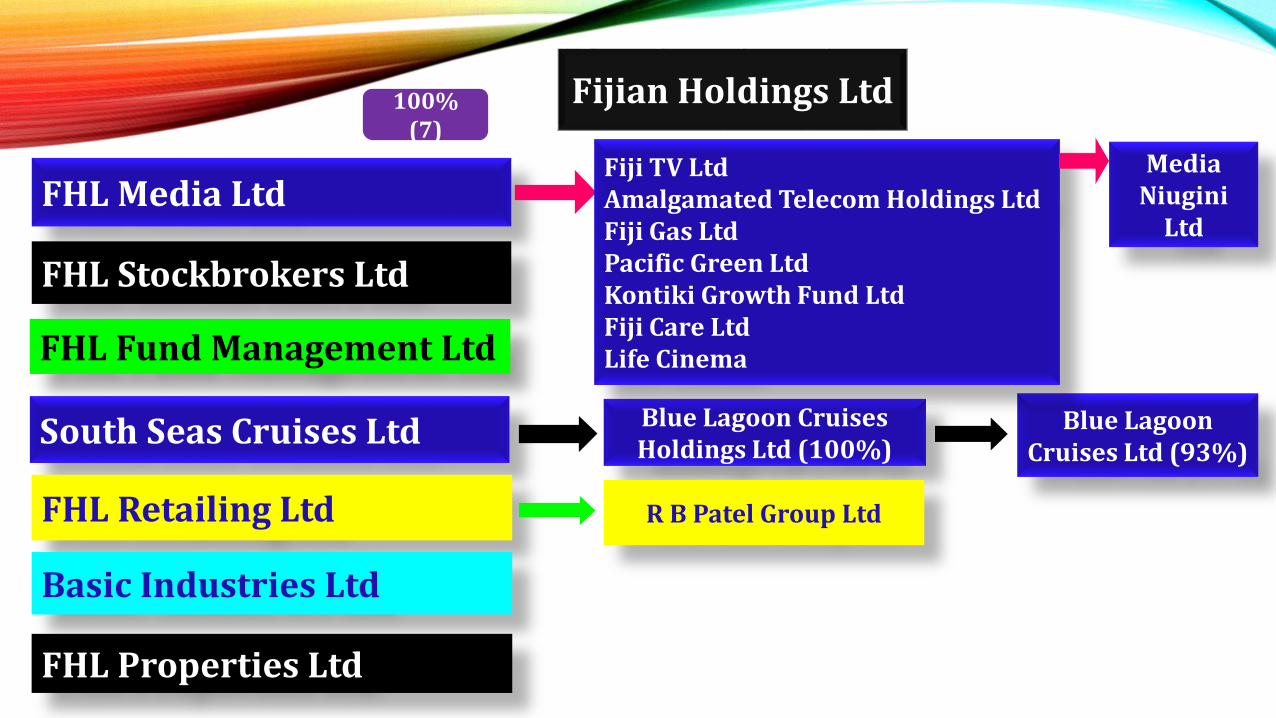
Fijian Holdings Ltd
FHL Media Ltd
FHL Stockbrokers Ltd
FHL Fund Management Ltd
South Seas Cruises Ltd
FHL Retailing Ltd
Basic Industries Ltd
FHL Properties Ltd
100% (7)
Blue Lagoon Cruises Holdings Ltd (100%)
Blue Lagoon Cruises Ltd (93%)
R B Patel Group Ltd
Fiji TV LtdAmalgamated Telecom Holdings LtdFiji Gas LtdPacific Green LtdKontiki Growth Fund LtdFiji Care LtdLife Cinema
Media Niugini
Ltd
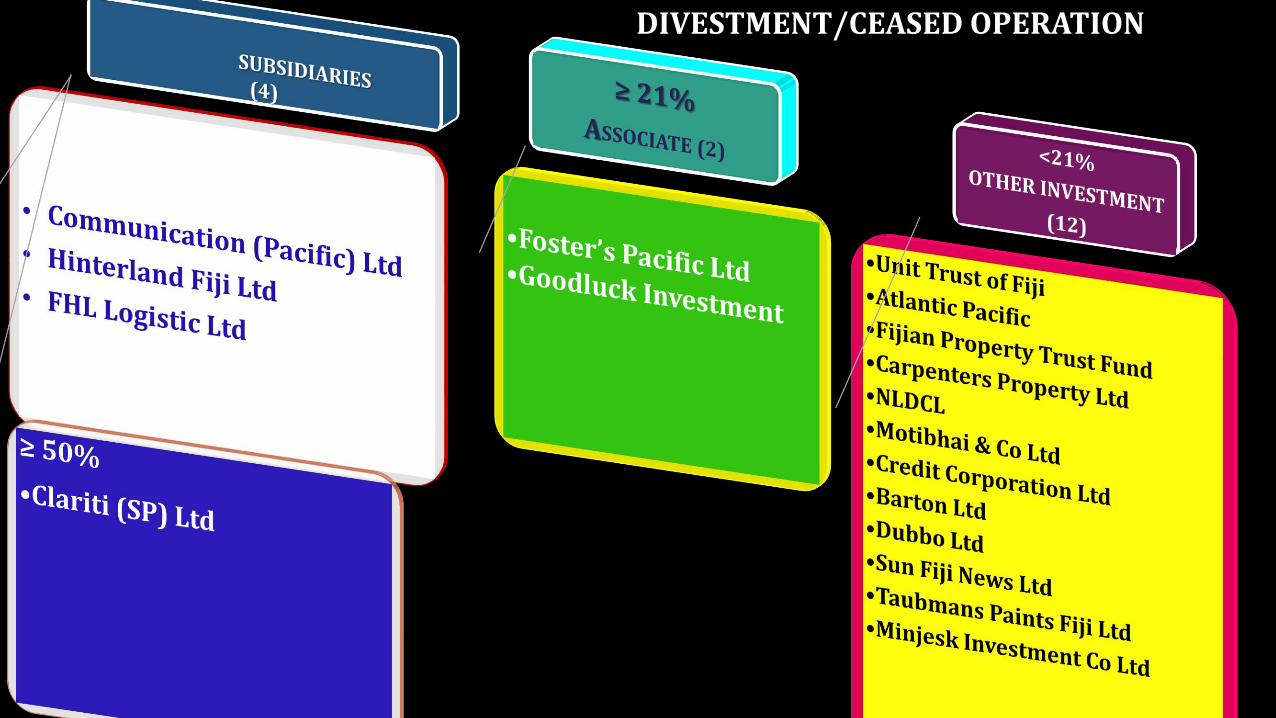
DIVESTMENT/CEASED OPERATION
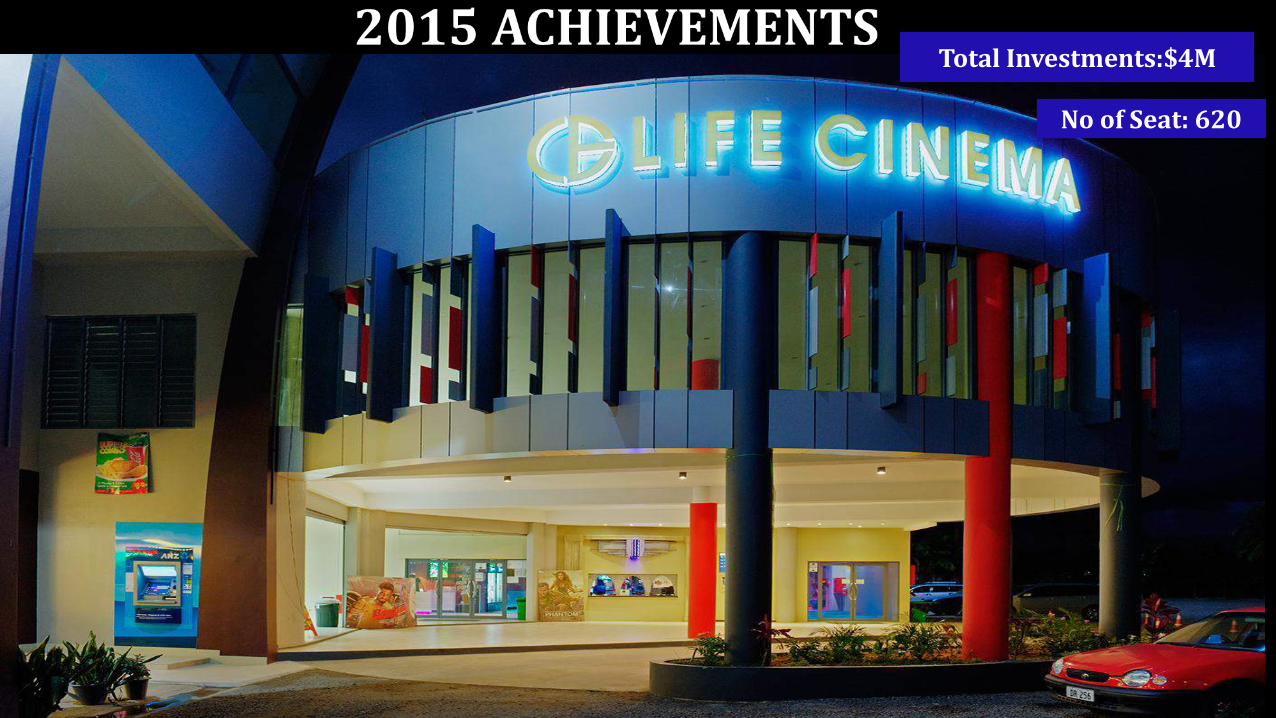
Total Investments:$4M
No of Seat: 620
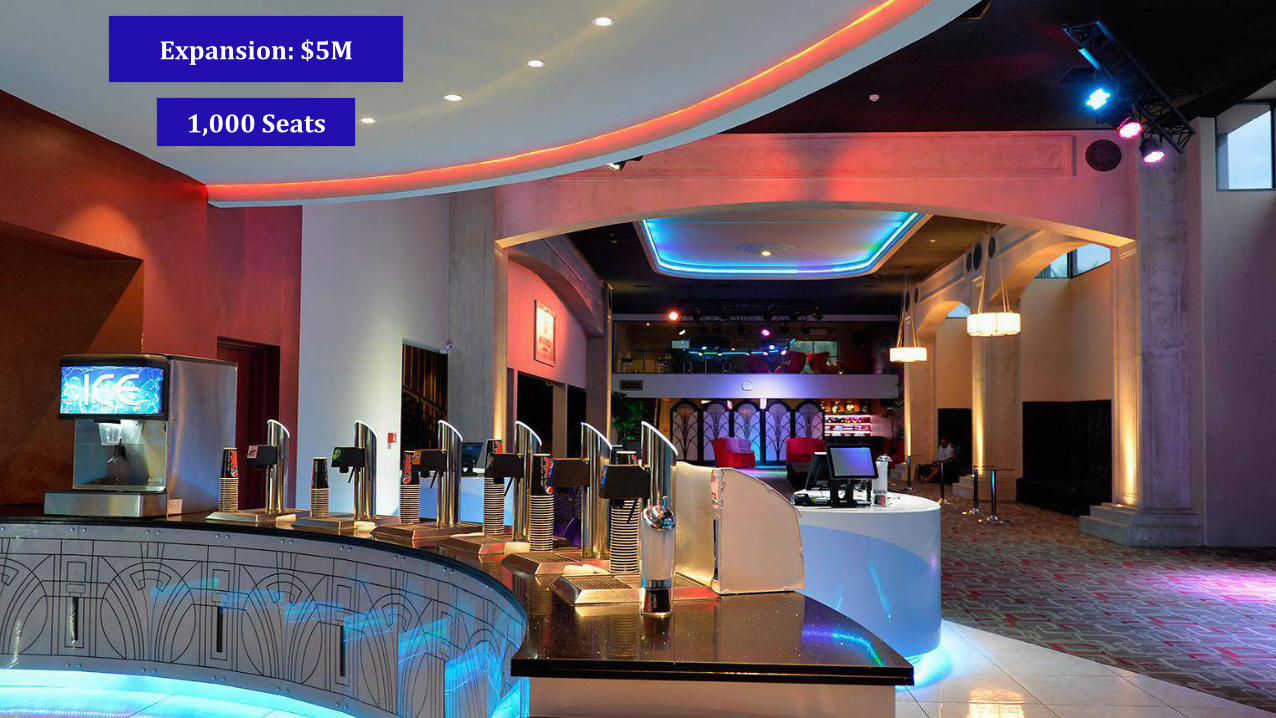
Expansion: $5M
1,000 Seats
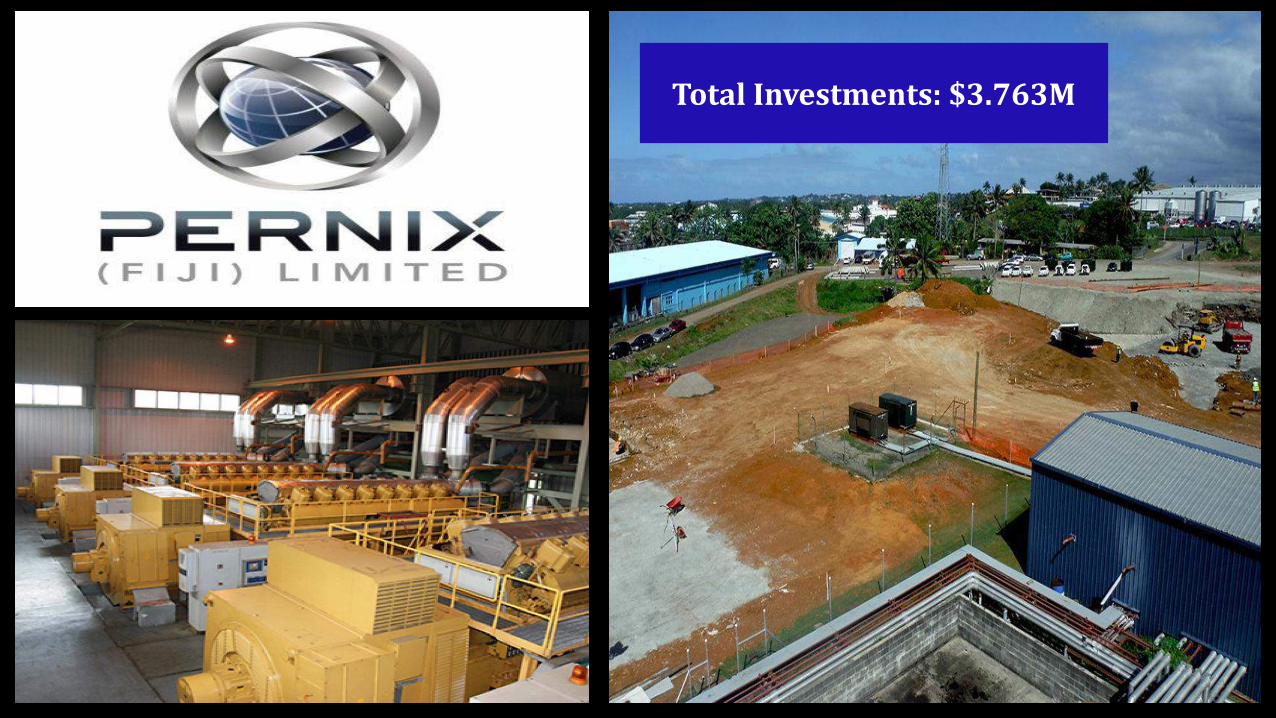
Total Investments: $3.763M
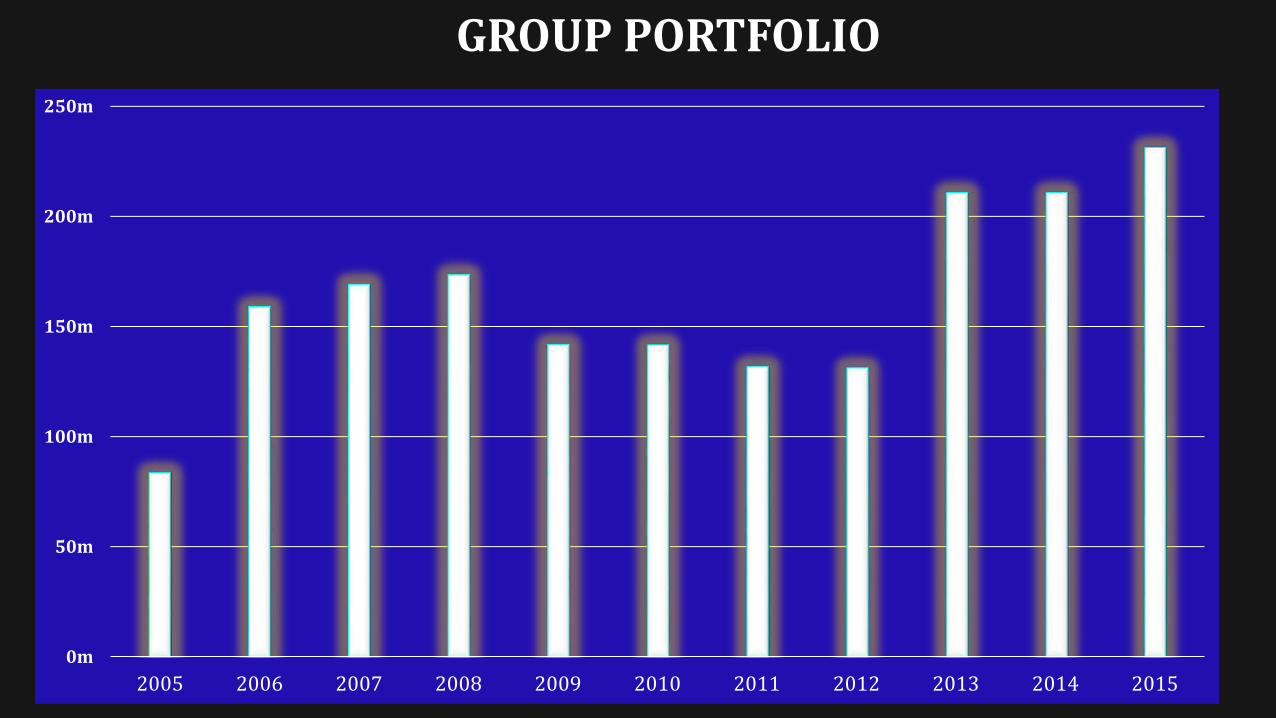
0m
50m
100m
150m
200m
250m
2005 2006 2007 2008 2009 2010 2011 2012 2013 2014 2015
GROUP PORTFOLIO
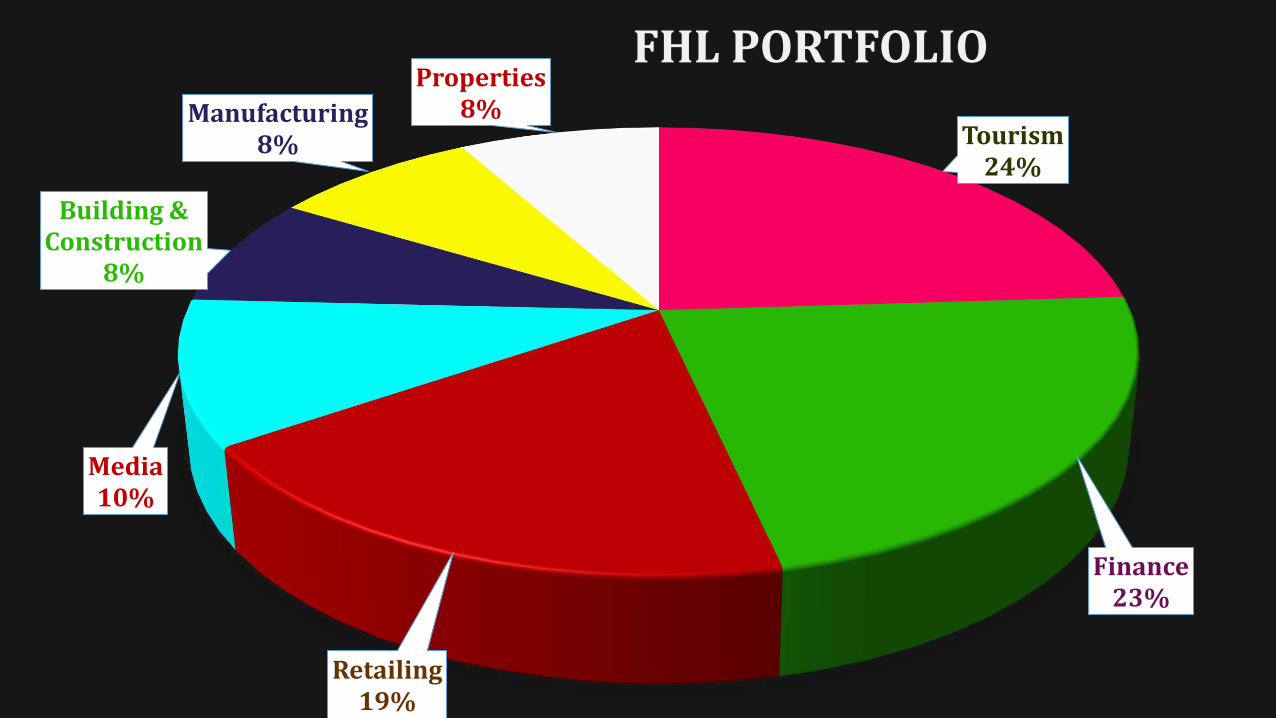
Tourism24%
Finance23%
Retailing19%
Media10%
Building & Construction
8%
Manufacturing8%
Properties8%
FHL PORTFOLIO
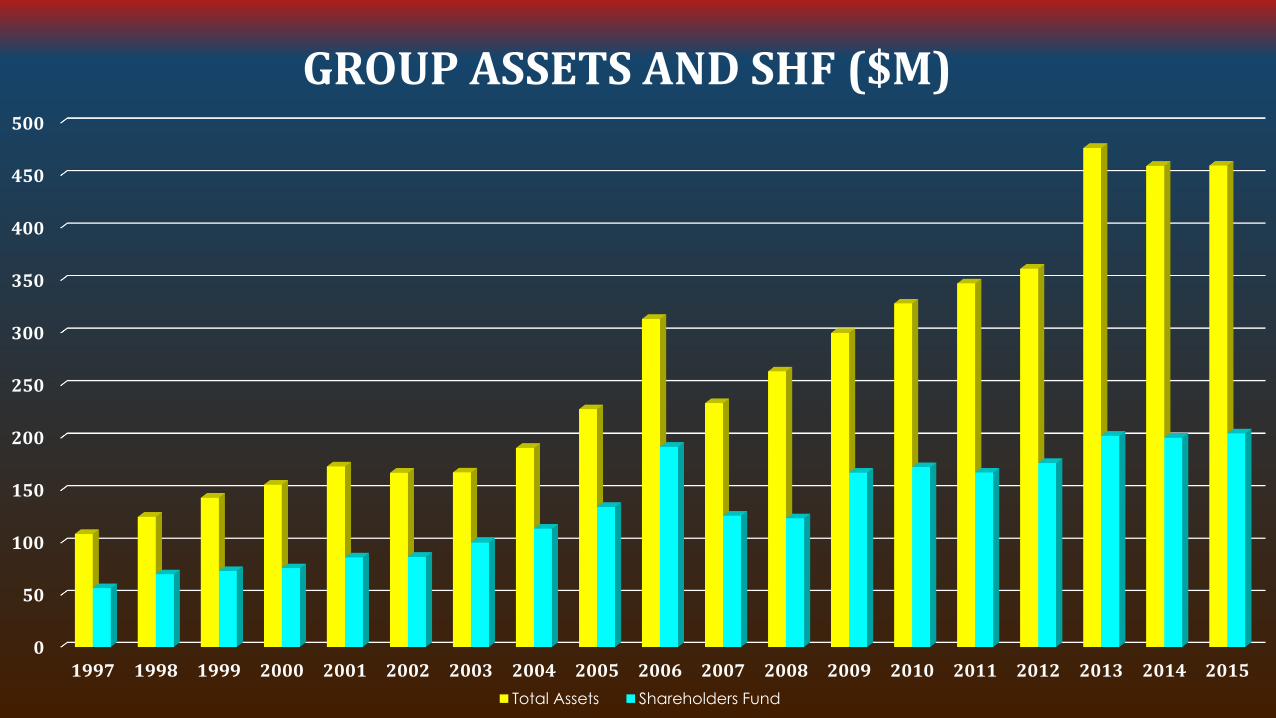
GROUP ASSETS AND SHF ($M)
0
50
100
150
200
250
300
350
400
450
500
1997 1998 1999 2000 2001 2002 2003 2004 2005 2006 2007 2008 2009 2010 2011 2012 2013 2014 2015
Total Assets Shareholders Fund
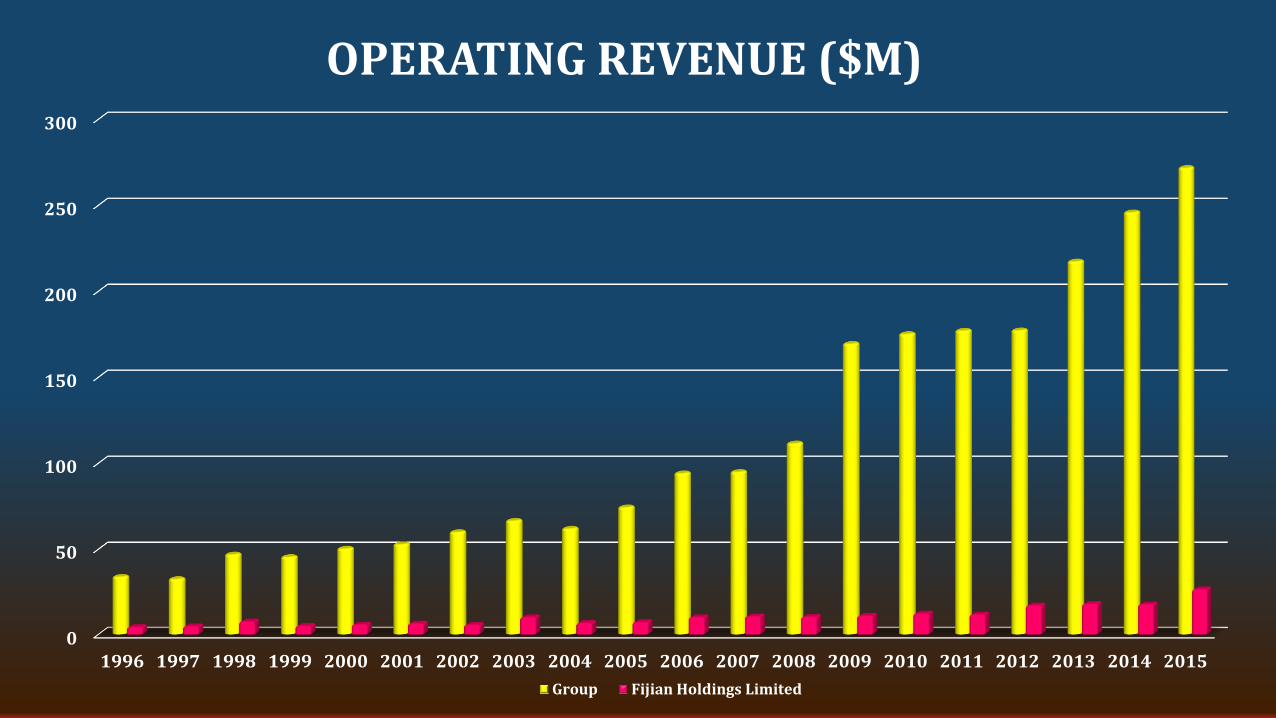
OPERATING REVENUE ($M)
0
50
100
150
200
250
300
1996 1997 1998 1999 2000 2001 2002 2003 2004 2005 2006 2007 2008 2009 2010 2011 2012 2013 2014 2015
Group Fijian Holdings Limited
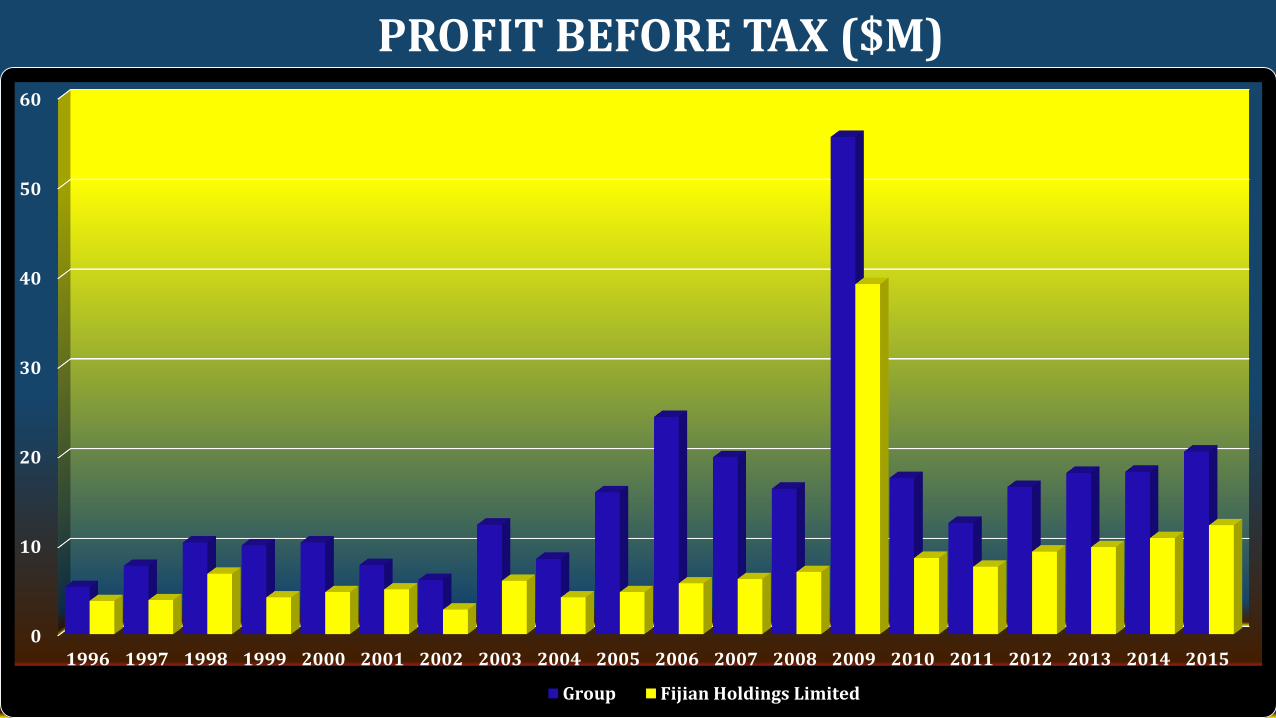
0
10
20
30
40
50
60
1996 1997 1998 1999 2000 2001 2002 2003 2004 2005 2006 2007 2008 2009 2010 2011 2012 2013 2014 2015
Group Fijian Holdings Limited
PROFIT BEFORE TAX ($M)
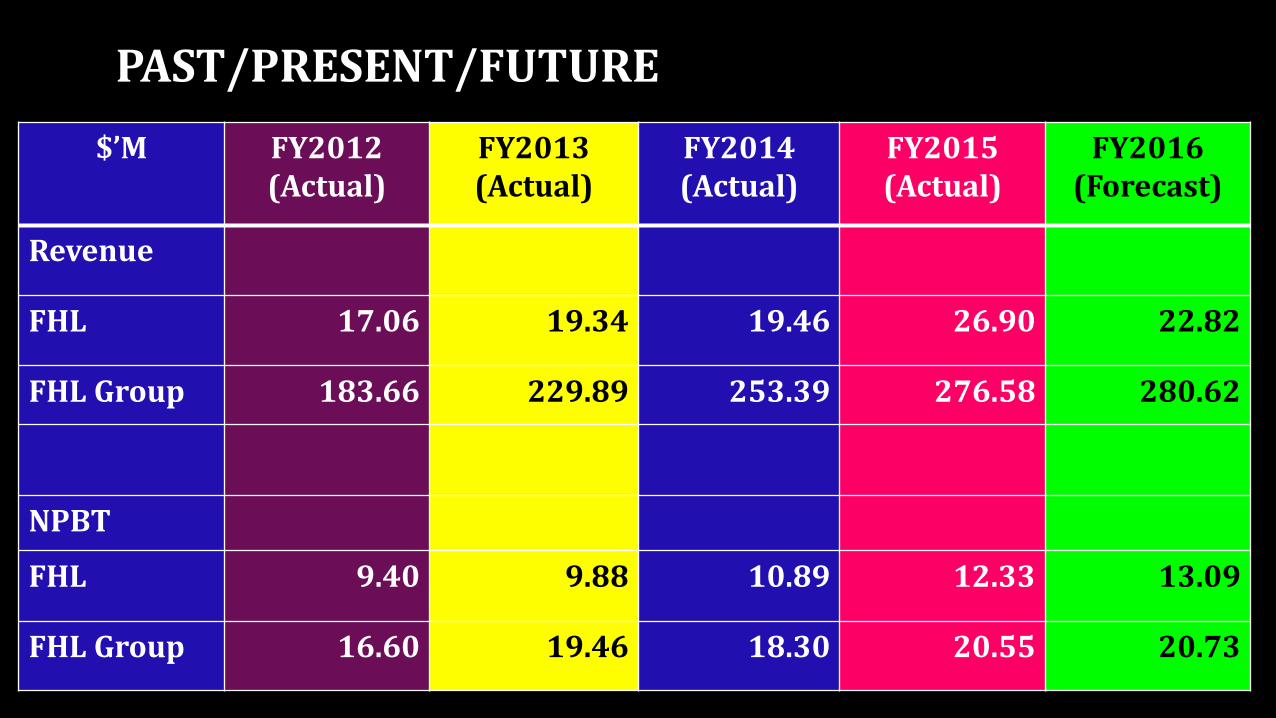
$’M FY2012(Actual)
FY2013(Actual)
FY2014(Actual)
FY2015(Actual)
FY2016(Forecast)
Revenue
FHL 17.06 19.34 19.46 26.90 22.82
FHL Group 183.66 229.89 253.39 276.58 280.62
NPBT
FHL 9.40 9.88 10.89 12.33 13.09
FHL Group 16.60 19.46 18.30 20.55 20.73
PAST/PRESENT/FUTURE
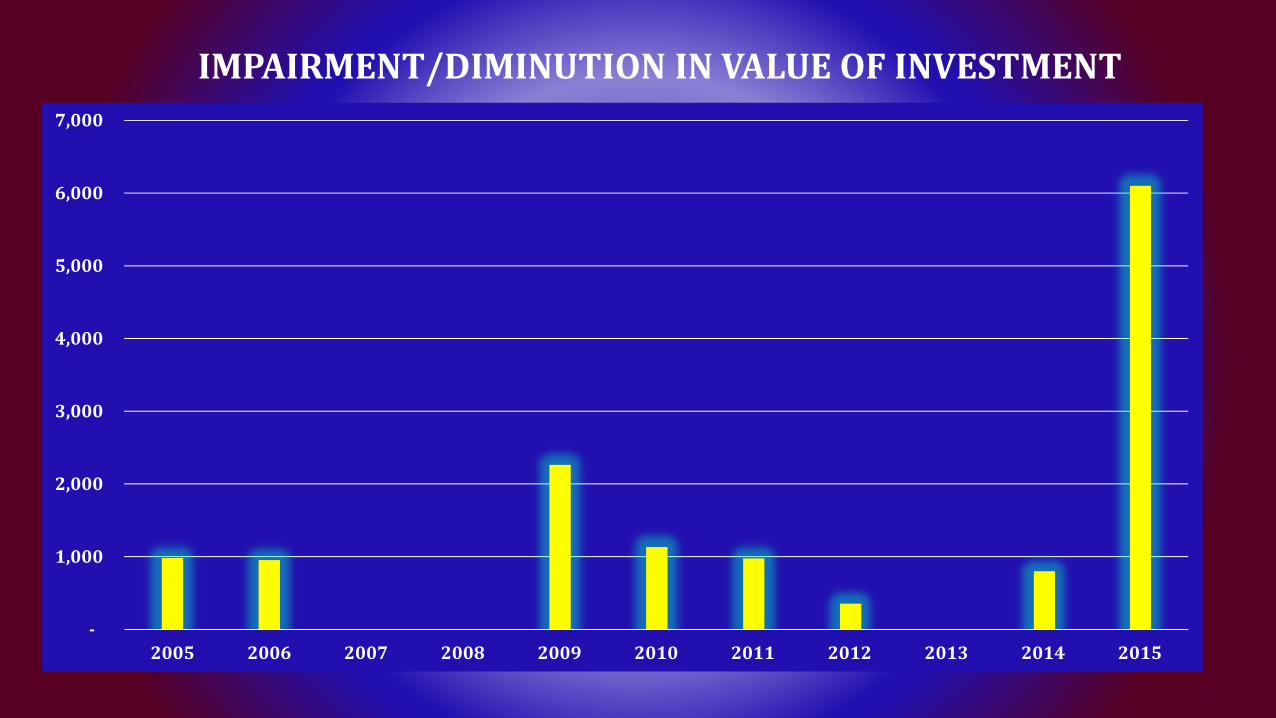
-
1,000
2,000
3,000
4,000
5,000
6,000
7,000
2005 2006 2007 2008 2009 2010 2011 2012 2013 2014 2015
IMPAIRMENT/DIMINUTION IN VALUE OF INVESTMENT
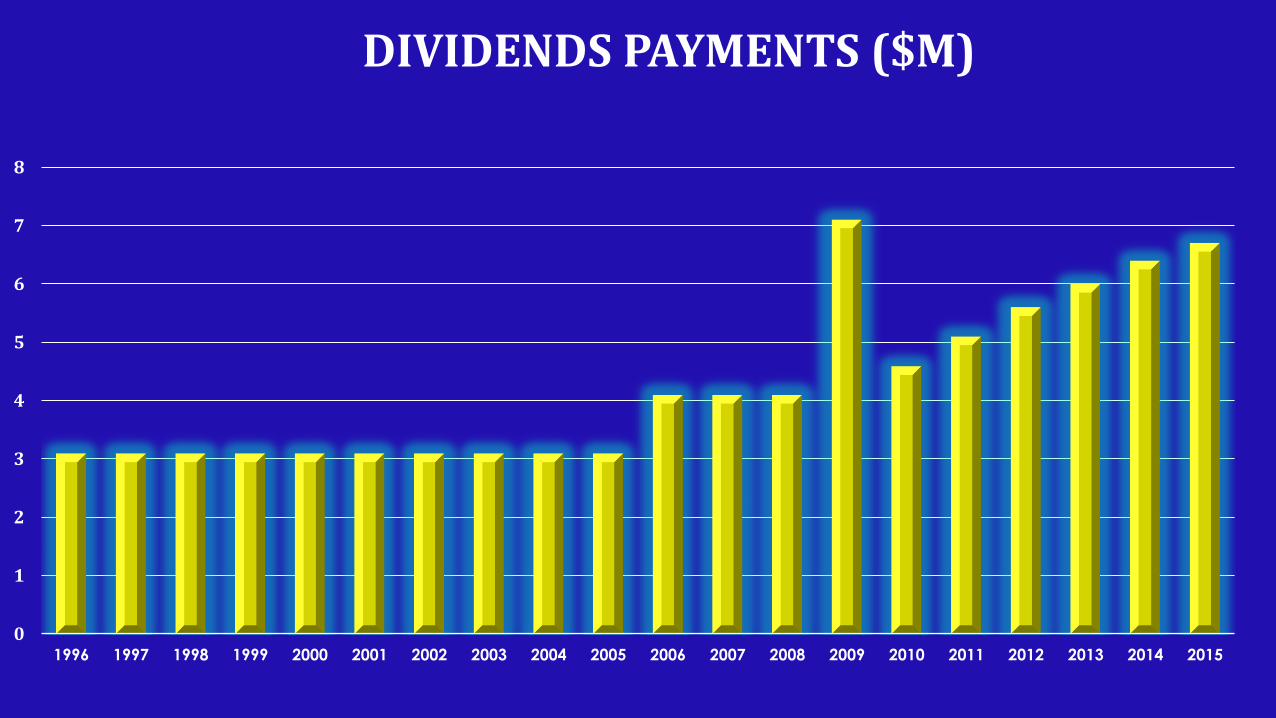
0
1
2
3
4
5
6
7
8
1996 1997 1998 1999 2000 2001 2002 2003 2004 2005 2006 2007 2008 2009 2010 2011 2012 2013 2014 2015
DIVIDENDS PAYMENTS ($M)
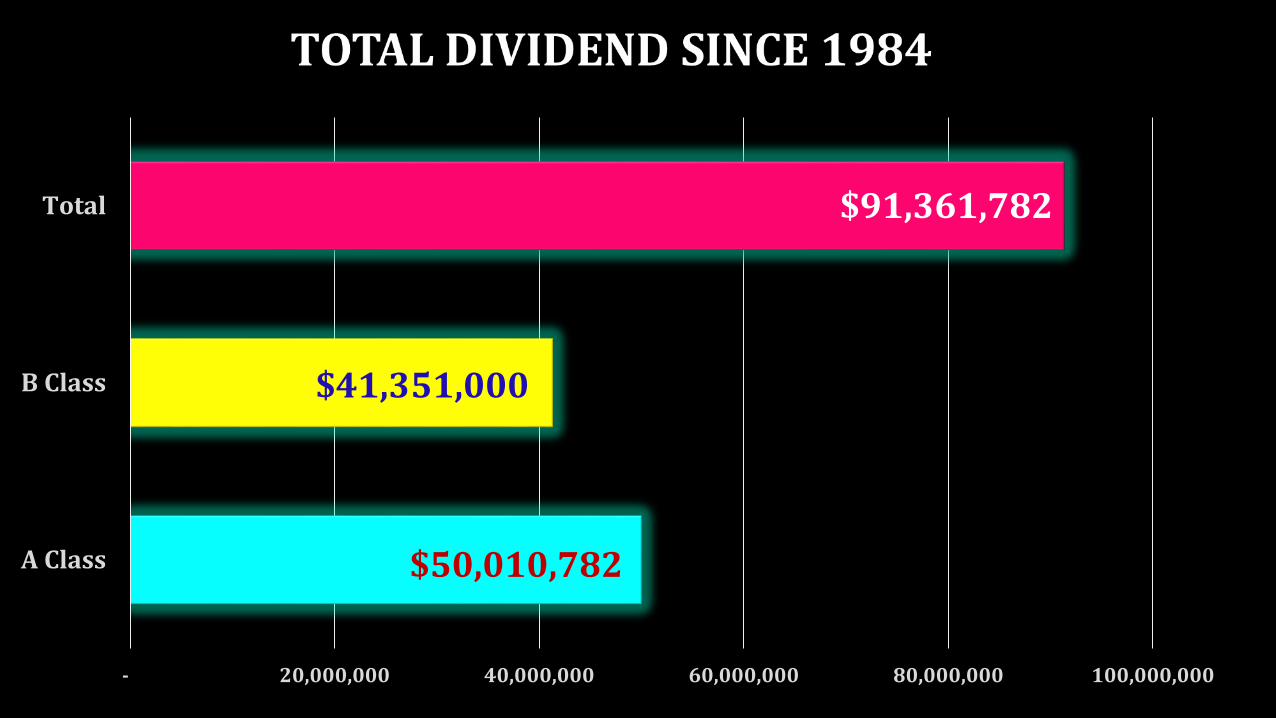
- 20,000,000 40,000,000 60,000,000 80,000,000 100,000,000
A Class
B Class
Total $91,361,782
$41,351,000
$50,010,782
0
5
10
15
20
25
30
35
40
45
50
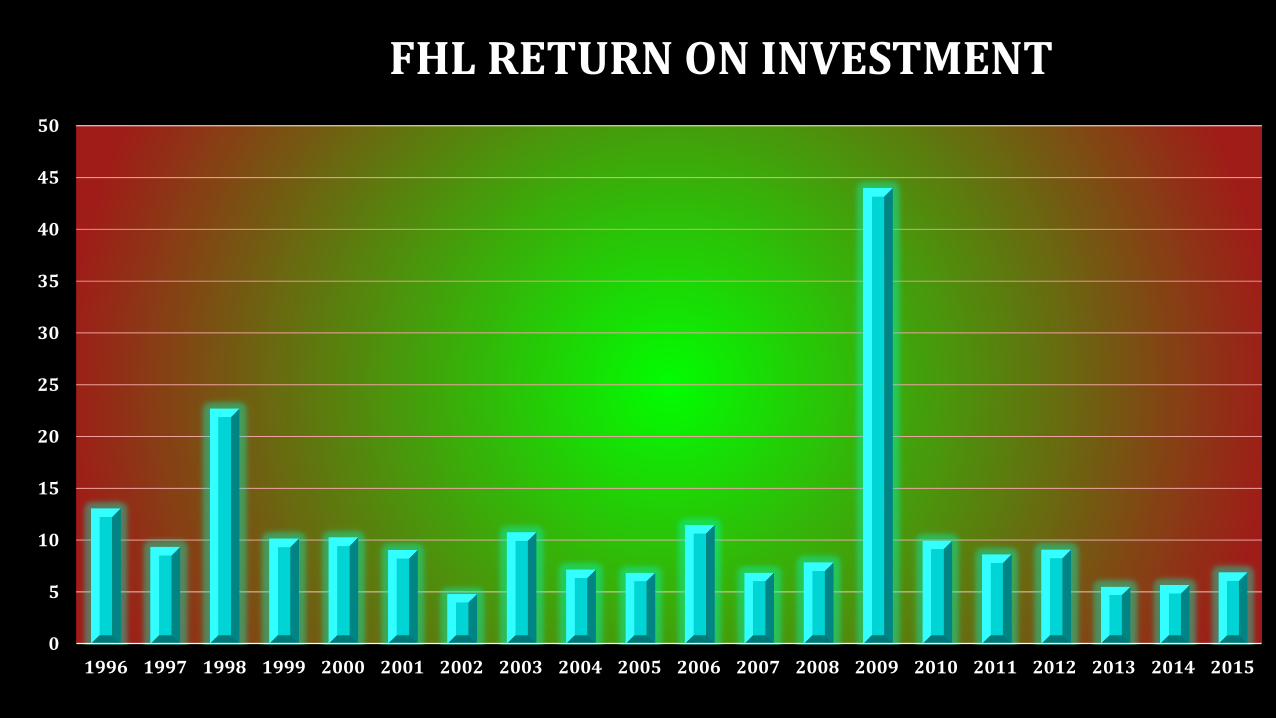
1996 1997 1998 1999 2000 2001 2002 2003 2004 2005 2006 2007 2008 2009 2010 2011 2012 2013 2014 2015
FHL RETURN ON INVESTMENT
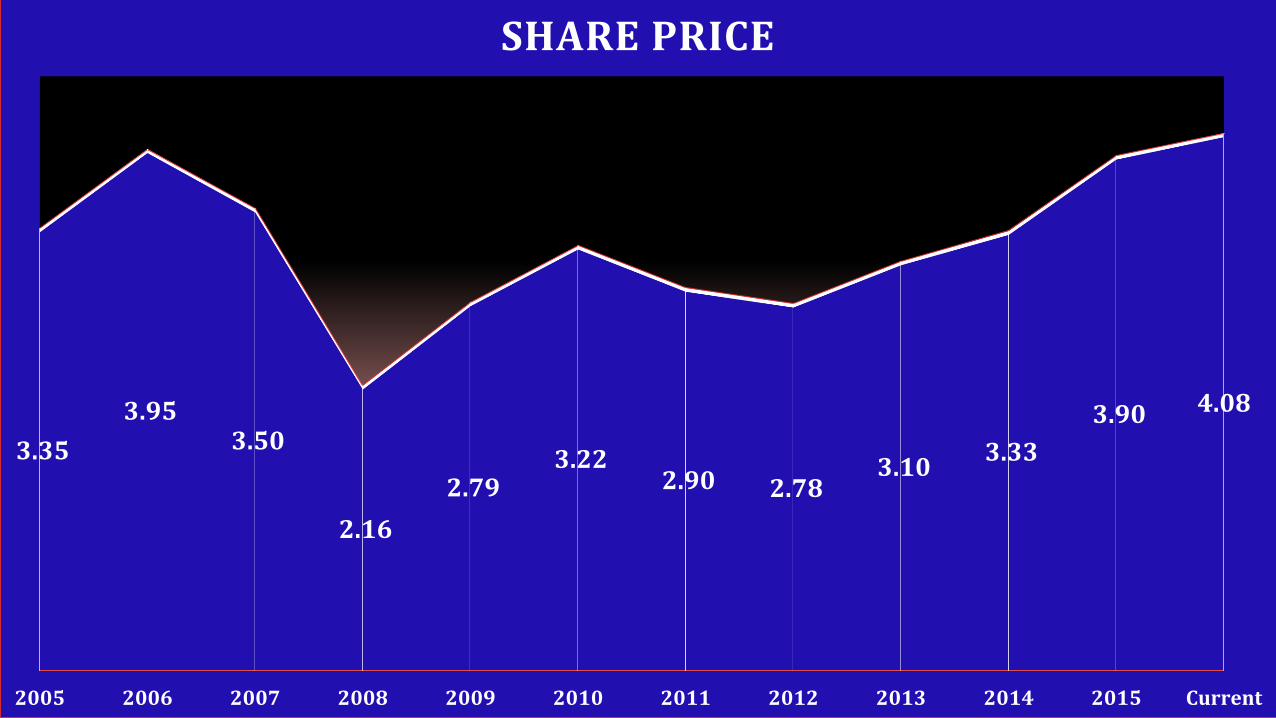
3.35
3.95 3.50
2.16
2.79 3.22
2.90 2.78 3.10
3.33
3.90 4.08
2005 2006 2007 2008 2009 2010 2011 2012 2013 2014 2015 Current
SHARE PRICE
CHALLENGES
• BIL (PNG) LTD
• FIJI TV
• MYSTIQUE PRINCESS
• SUSTAINABILITY
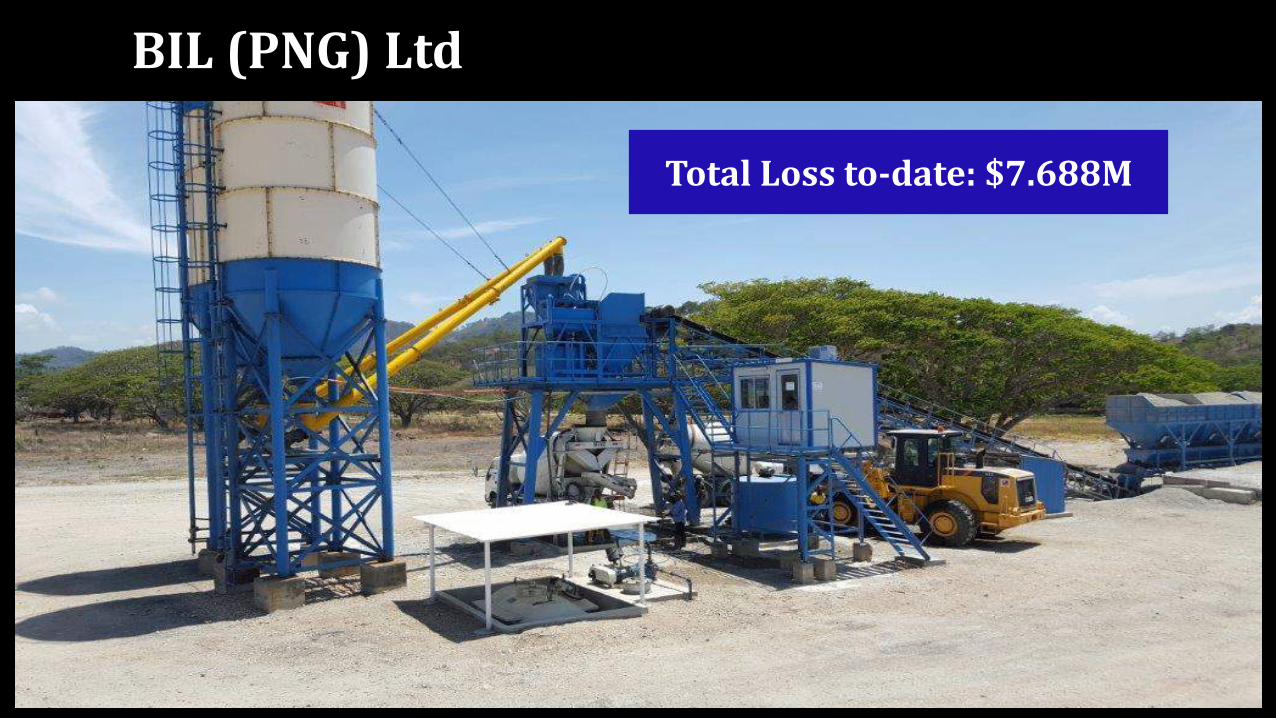
BIL (PNG) Ltd
Total Loss to-date: $7.688M
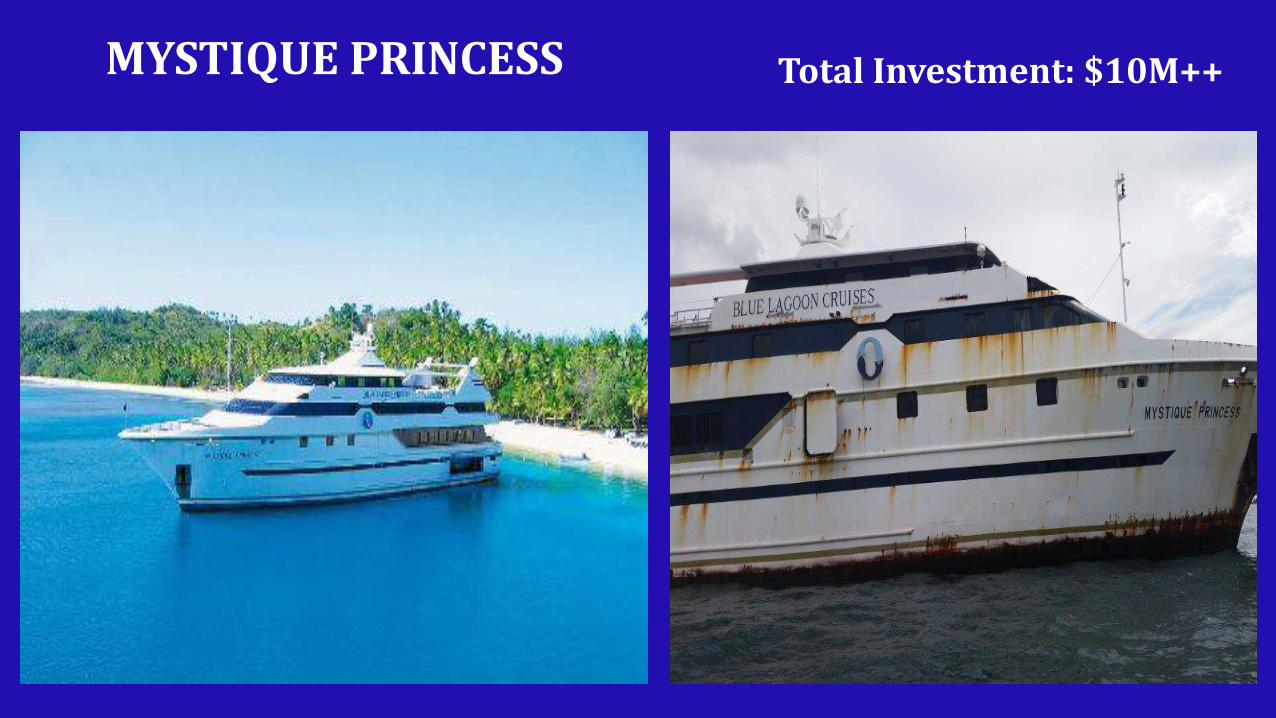
MYSTIQUE PRINCESS Total Investment: $10M++
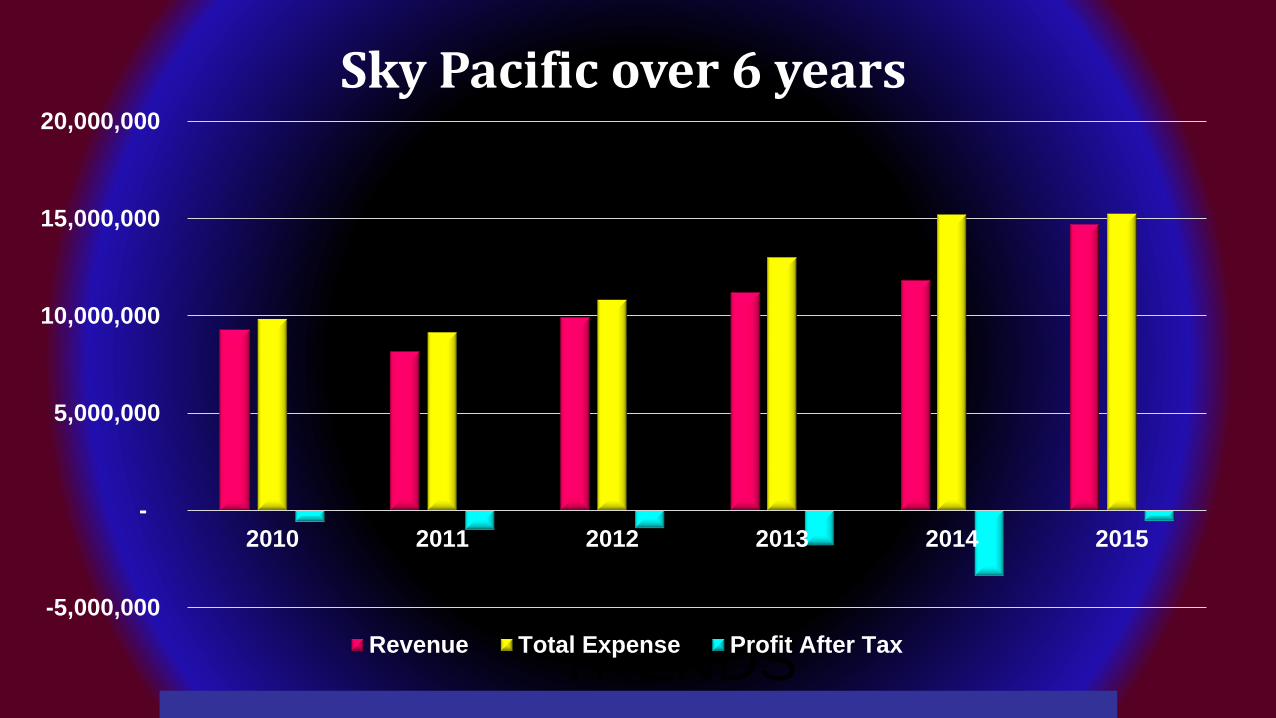
TRENDS-5,000,000
-
5,000,000
10,000,000
15,000,000
20,000,000
2010 2011 2012 2013 2014 2015
Sky Pacific over 6 years
Revenue Total Expense Profit After Tax
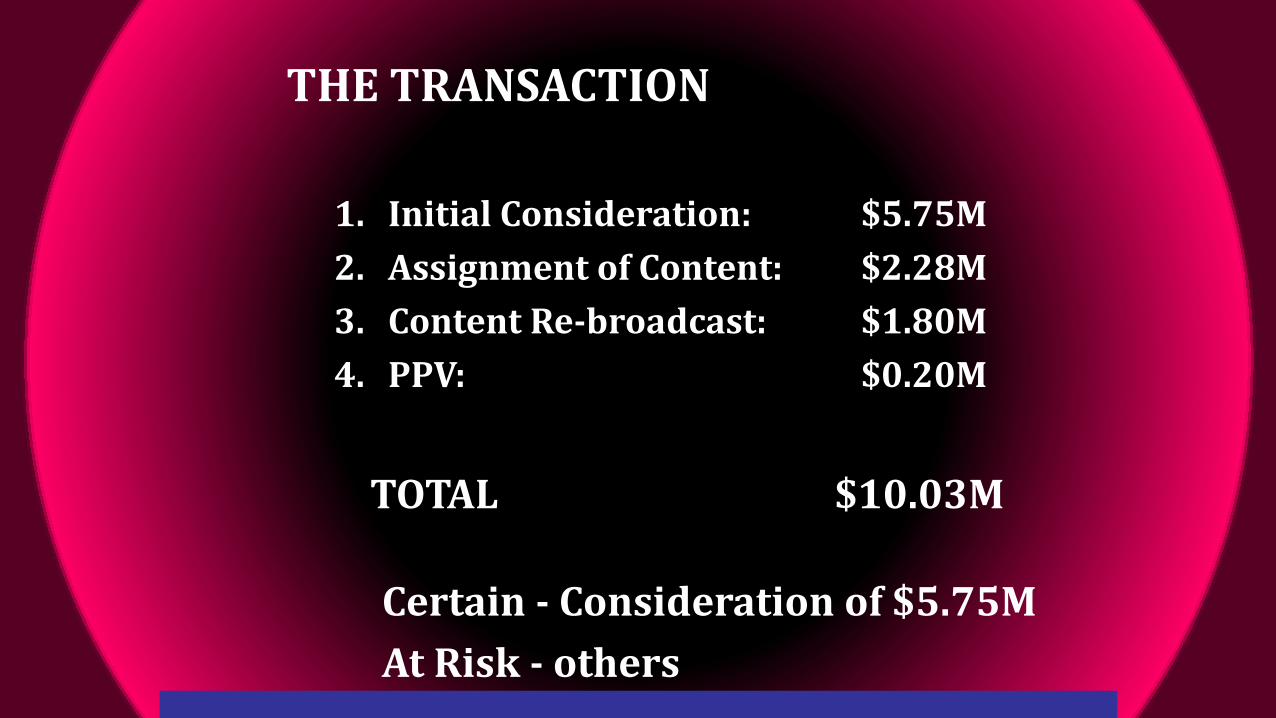
THE TRANSACTION
1. Initial Consideration: $5.75M
2. Assignment of Content: $2.28M
3. Content Re-broadcast: $1.80M
4. PPV: $0.20M
TOTAL $10.03M
Certain - Consideration of $5.75M
At Risk - others
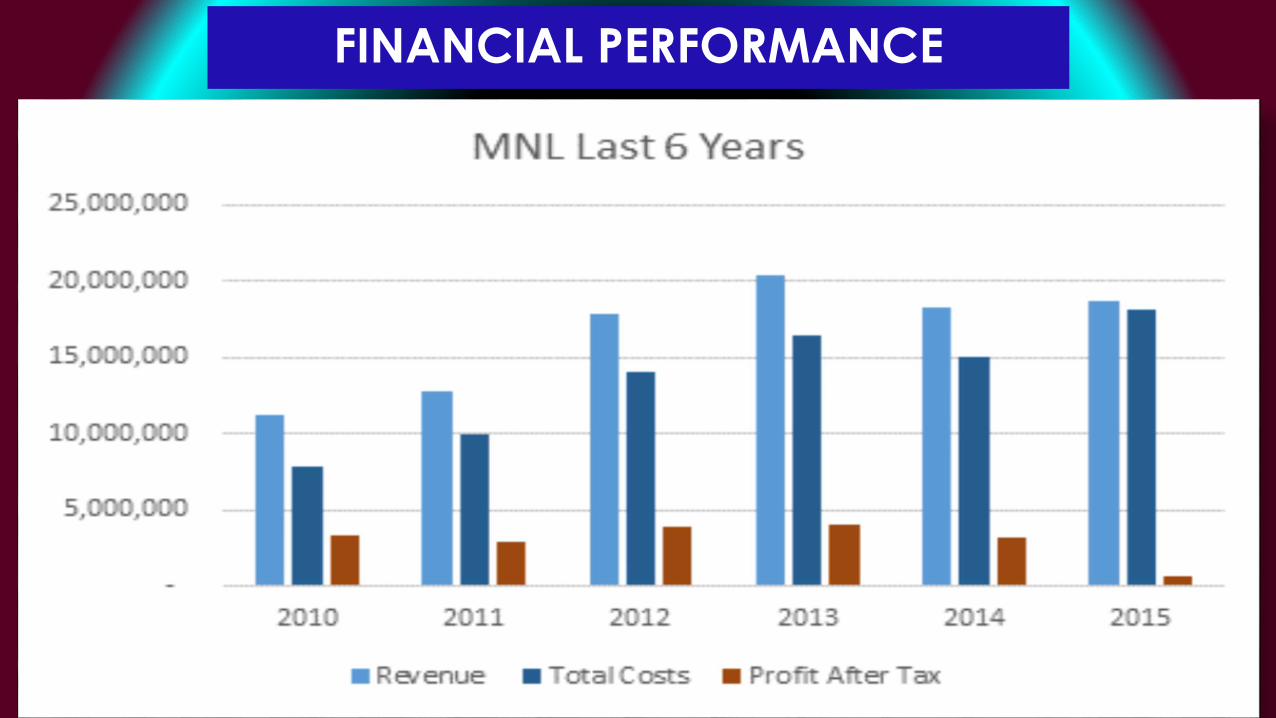
FINANCIAL PERFORMANCE
WAY FORWARD
• Strategic Partners (expertise)
• Restructure & re-engineer for listing
• Privatization of SOE
• Divesting underperforming investment
• Sale of unutilized assets
WAY FORWARD
• Listing
• Agriculture/Dairy
• Industrial Products
• Renewable Energy
• Pacific Expansion (Availability ???)
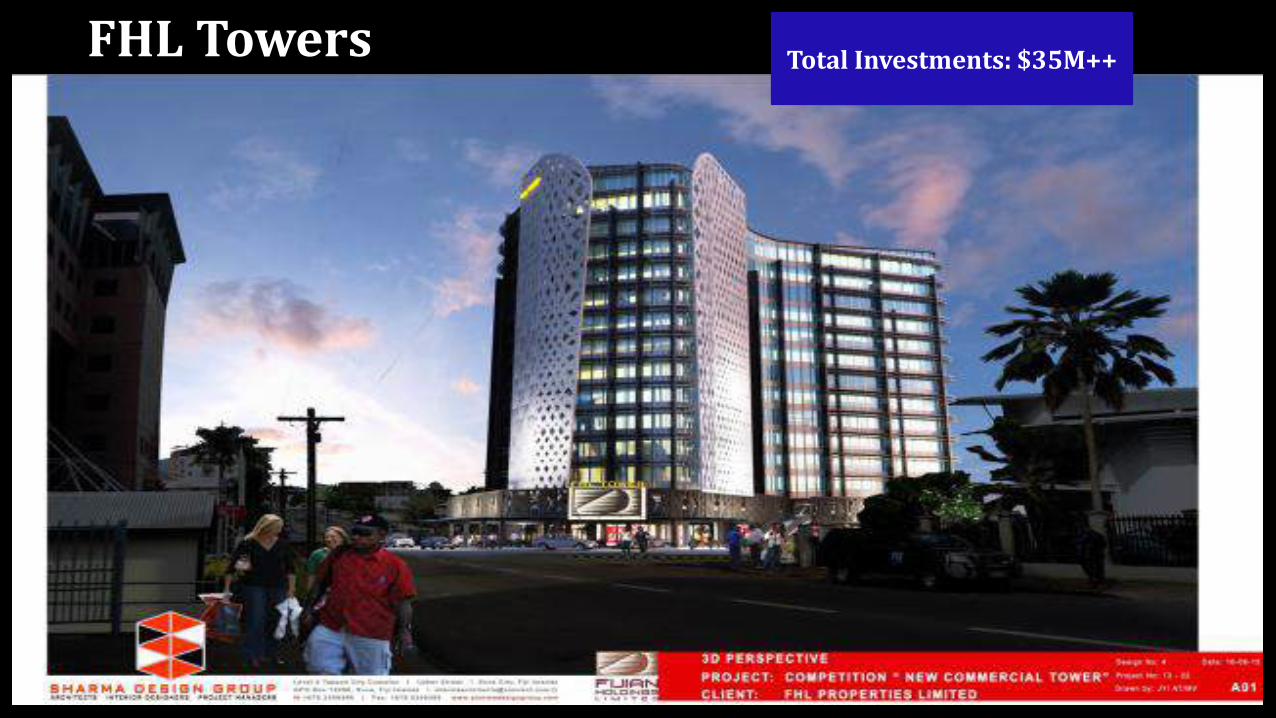
FHL Towers Total Investments: $35M++
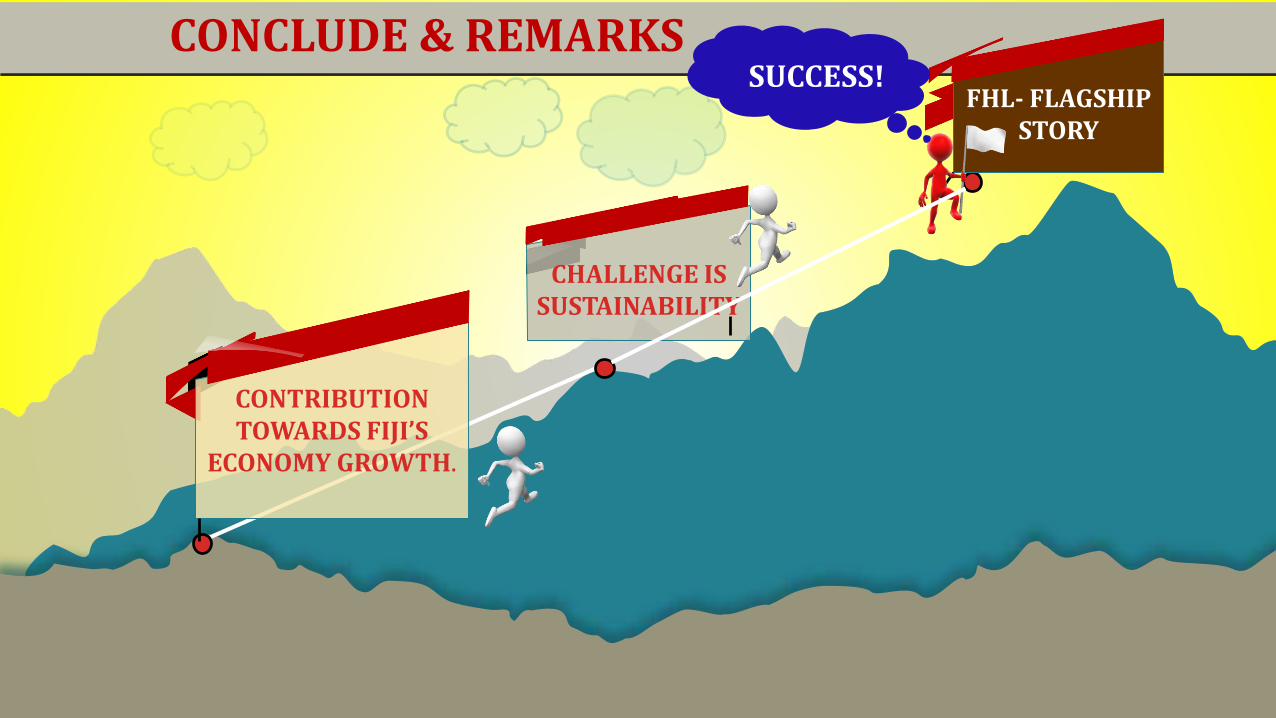
CONCLUDE & REMARKS
CONTRIBUTION TOWARDS FIJI’S
ECONOMY GROWTH.
FHL- FLAGSHIP STORY
CHALLENGE IS SUSTAINABILITY
SUCCESS!

VINAKA